Guest essay by David Archibald
President Obama didn’t start the war on coal. That war had its origins back in the 1970s. The nuclear industry joined the fray in 1982 with the establishment of the Carbon Dioxide Information Analysis Center (CDIAC) at Oak Ridge, part of the U.S. Department of Energy. The CDIAC collects data on carbon dioxide concentrations around the planet and conducts experiments with pre-ordained outcomes. By that I mean growing plants in elevated carbon dioxide concentrations to study the effects of that on growth rates but at the same time adding ozone so that the growth would be stunted. Not everything the CDIAC is completely useless though.
The pause in global temperature rise might cause a loss of faith in the global warming faithfully so the priests of the movement are required to provide an explanation. The explanation they have come up with is that the missing heat is hiding in the depth of the Altantic Ocean and will one day leap out at us when we are least expecting it. This is an illustration of the heat gone AWOL:

The illustration shows heat plunging into the depths as far as 1,500 metres. The oceans don’t work like that. Most of the heat energy of sunlight is absorbed in the first few centimetres of the ocean’s surface. Waves mix the water near the surface layer such that the temperature may be relatively uniform in the top 100 metres. Below that there is almost no mixing and no vertical movement of water.
This is where the CDIAC comes in handy. Following is a map of CDIAC voyages in the Atlantic Ocean:

And this is the temperature profile of A16 from almost 60°S to near Iceland, a distance of over 13,000 km.:

It shows how the Antarctic is a giant refrigerator for the planet. The dark blue in the bottom left is cold water below 1°C plunges near Antarctica and ponds in the deep ocean right up to the equator. The CDIAC voyages also record carbon dioxide data of course. This is the carbon dioxide and total alkalinity profile for A20, to the west of the A16 voyage:

Once again, most variation is near surface while the bulk of the ocean is effectively homogenous.
We didn’t need the CDIAC data to debunk claims of missing heat in the ocean depths but it is good to have empirical data. The CDIAC is well past its use-by date though. Apart from the unnecessary cost, it was conceived for a dark purpose under President Carter. The United States will need all the energy it can get soon enough.
David Archibald, a Visiting Fellow at the Institute of World Politics in Washington, D.C., is the author of Twilight of Abundance: Why Life in the 21st Century Will Be Nasty, Brutish, and Short (Regnery, 2014).
Reference:
Is Atlantic holding Earth’s missing heat?
Eli Kintisch
Armchair detectives might call it the case of Earth’s missing heat: Why have average global surface air temperatures remained essentially steady since 2000, even as greenhouse gases have continued to accumulate in the atmosphere? The suspects include changes in atmospheric water vapor, a strong greenhouse gas, or the noxious sunshade of haze emanating from factories. Others believe the culprit is the mighty Pacific Ocean, which has been sending vast slugs of cold bottom water to the surface. But two fresh investigations finger a new suspect: the Atlantic Ocean. One study, in this issue of Science, presents sea temperature data implying that most of the missing heat has been stored deep in the Atlantic. The other, published online in Nature Climate Change, suggests a warming Atlantic is abetting the Pacific by driving wind patterns that help that ocean cool the atmosphere. But some climate specialists remain skeptical. In a third recent paper, also published online in Nature Climate Change, other researchers argue that the Pacific remains the kingpin. One reason some scientists remain convinced the Pacific is behind the hiatus is a measured speedup in trade winds that drive a massive upwelling of cold water in the eastern Pacific. But there, too, the Atlantic may be responsible, modeling experiments suggest. A consensus about what has put global warming on pause may be years away, but one scientist says the recent papers confirm that Earth’s warming has continued during the hiatus, at least in the ocean depths, if not in the air.
It’s time to go beyond ARGO and have anchored, densely spaced monitoring instruments (including for acidification) in all the world’s oceans. If nothing else, they will greatly aid weather forecasting.
The big problem with theories like the ocean swallowed the heat is that there are no failure criteria – the theories are unfalsifiable, utterly unscientific, because they make no testable predictions, other than a vague threat that the world might get warmer again someday.
God of the gaps – the global warming scare survives in the gaps in our knowledge.
Water also acts as an instantaneous liquid expansion thermometer so heat going into the oceans would show up in tide gauge records as a recent upswing following a recent downswing as it released heat before. There are no such swings, going back 150 years:
postimg.org/image/uszt3eei5/
It would be good for a mathematically inclined reader to calculate the expected sea level rise required to hide all the man made global warming from us landlubbers, so possibly give my argument real teeth.
“But there, too, the Atlantic may be responsible, modeling experiments suggest.”
Models all the way down.
I used to have a very negative opinion regarding coal usage. The modern emissions controls seem very effective these days. Although,the industry certainly has some issues with their handling of the waste byproducts.
Great job with the graphics display of the Atlantic.
Explaining the North Atlantic is nowhere adequate despite numerous papers on the subject, despite the longest and ‘most’ reliable records available.
Solar, geomagnetism, tectonics and Arctic atmospheric pressure they all have input and lead by number of years the N. Atlantic SST and its de-trended derivative the AMO
(see Here )
All of the above (see the link) point to the fall in the N. Atlantic’s and N. Hemisphere temperatures, in not distant future.
Perhaps an early warning : Northern Ireland (home of the famous Armagh observatory) recorded its lowest August minimum temperature ever of – 2C (yes, minus 2 degrees Celsius).
Heat going into the Atlantic is not an anthropogenic change of climate.
It might explain the cooling now and the heating in the past.
Periodicity is not unknown in the past, with two periods of rising temperatures, 1910-1940 and 1970-2000. During 1940-1970 the global temperature indicated global cooling.
David Archibald:
Thankyou for your timely essay.
Immediately below your essay is a comment from Eli Kintisch which lists suggested explanations of the ‘missing heat’. That comment concludes saying
That conclusion demonstrates the real problem which is that so-called ‘climate science’ has abandoned the scientific method and replaced it with a belief system.
What one not-named “scientist” says the recent papers confirm has no relevance, especially when there is no “consensus” because other scientists don’t agree. The possible interpretations of the data reported in those papers is important.
Eli Kintisch says global warming has been “put” “on a pause”. No. Global warming has stopped and the existing plateau in global temperature will end with warming or cooling. Therefore, until the plateau ends it cannot be known whether global temperature rise has paused or is reversing.
The important possibility which Eli Kintisch does not mention (fails to recognise?) is that there may be no “missing” heat. There are three known possible reasons for this; viz.
1.
The twentieth century rises in global average surface temperature anomaly (GASTA) known as global warming resulted from redistributed surface temperatures and not altered heat in the climate system.
2.
The twentieth century rises in GASTA resulted from moderation of cloud cover with resulting variations to heat entering the system which is independent of atmospheric greenhouse gas (GHG) concentrations.
3.
Whatever the cause of the twentieth century rises in GASTA, the rises in GASTA were not discernibly affected by atmospheric greenhouse gas (GHG) concentrations because negative feedbacks in the climate system reduce climate sensitivity to being less than 1.0°C per doubling of CO2 equivalence.
Of course, the existence of those known reasons does not remove the possibility of other and unknown reasons.
Richard
I’m confused. I wouldn’t call myself thick; BSc (Hons) Geol, Chartered Engineer, 25 yrs working scientific experience, but on the other hand I’m no rocket scientist, but to me, the post identifies that the latest sets of “papers” purporting to explain the “Pause” seem to have been written by those suffering from the severest type of delusion. However, I can’t seem to grasp whether the information posted here is a) out of date, b) cherry picked – why would these paper writers ignore empirical data over “modelling experiments” and if the empirical data presented here is sound, why doesn’t someone write a rebuttal?? In fact, why don’t we write rebuttals each and every time these [toilet] papers are authored?
AleaJactaEst says:
August 24, 2014 at 1:04 am
Most of the readers of this blog would be aware of the thermocline that stops mixing. And then you could write a post to that effect in about two lines. That would be too boring for all concerned though. Defeating a nihilist belief system like global warming means mocking them. This post is a rebuttal to the delusionist papers. The entertainment value comes from using CDIAC data to refute global warming claims while showing the readers some data that they might not be aware of. Finally, it is important to put the boot into the nasty nest that is the CDIAC so that when the United States reverts to having a balanced budget, the DCIAC is defunded as part of that process.
And.. Is the following ‘picture’ of Northern hemisphere marine temperature anomalies accurate because there is an awful lot of heat?
http://polar.ncep.noaa.gov/sst/ophi/color_anomaly_NPS_ophi0.png
AleaJactaEst says: August 24, 2014 at 1:04 am
…………….
It is that powerful computers have taken over the science, their software regurgitating modelling data, with the helpless ‘scientists’, instead discussing and arguing, blindly dressing bungled output with a suitable narrative.
To paraphrase A. Einstein “the day that technology surpasses our human interaction the world will have a generation of idiots”
“President Obama didn’t start the war on coal.”
Those of us who are aware that there is a world outside the US already knew that.
First of all (sorry, I again have to get this out) it isn’t a ‘pause’. A ‘pause’ implies that you know future events. The increase in global warming has stopped. If it then continues then it WAS a pause.
Right, that aside, my basic understanding of science says that if you warm water, it will increase in volume. So first of all, that is correct, yes? Ok, so if the oceans have been absorbing warmth all this time (but land temperature shows no change) then the world’s water stores should be growing in volume at a rate far higher than the recent past. Sea levels shouldn’t just be rising in line with recent history, but going up at an extraordinary rate, yes? So to prove that the warmth is being stored, one would only have to look at sea level rise? Is it as simple as I show, or have I missed something?
Hot water floats just like hot air rises, minus massive currents anyway:
http://youtu.be/bN7E6FCuMbY
Excellent article David. I have said many times on this blog that heat cannot just disappear into the oceans for the following reasons:
1) Like you say, if CO2 is warming the atmosphere by a greenhouse effect it can only affect water to a few inches deep and temperature by very little due to the huge specific heat capacity of salt water compared to air at sea level.Add to that, the fact that warm salt water is less dense than cold salt water and there is no way it can disappear into the ocean depths.
2) The reason the oceans warm during the summer, is because of infrared radiation from the sun.
3) The reason the oceans cool during the summer is because solar radiation going in is less than heat energy going out by the mechanism of convection in the sea and the air above the sea. This is why our UK climate is as it is, mild wet winters and cool wet summers because we are a small island surrounded by sea with the Gulf Stream passing our Western shores.
4) Global warming by increased CO2 levels can only warm the air, the amount of solar radiation hitting the Earth is unchanged. Therefore the only way the sea could warm as a result, is by heat conduction from the air into the surface of the water, but we have already established that the main transfer of energy in fluids is by convection. So as the air warms it rises away from the surface of the sea being replaced by cooler air from above. There is no known physical process by which less dense warmer water can sink into colder more dense water.
I cannot believe that the AGW believers have subjected us to this tosh, which can be dismissed by a 16 year old with a GCSE in physics!
Question: for fresh water it is most dense at 4 deg C and then gets less dense as it approaches zero (i.e. ice cubes float). Does this relationship, perhaps with a different temperature value, also hold for salt water?
In northern lakes that freeze in winter, the warmer 4deg water does indeed sink below the colder 1deg water and causes the fall and spring “turnover” that drives some nutrient processes.
I see richardscourtney shares my definition of ‘pause’ in the English language! Sorry to be bossy here, but we really should NOT call it a ‘pause’. You simply cannot know if that is the correct term, as you don’t know future events. If you were describing WW2, you wouldn’t describe Germany’s defeat in Africa at the hands of the Allies as a ‘pause’ in their ability to wage war. After Africa, it was all pretty much downhill for Germany’s forces. Had they suffered that Africa defeat, but then went on to repel the Allies in northern France, then Africa would have been a ‘pause’. But we all know that wasn’t the case.
The word ‘pause’ should NOT be used!
David –
I maybe am missing the point, as an outsider in this debate, but I can’t really see why your neat exposition of the heat distribution pattern in the oceans contradicts anything in the present argument, on either side.
I asked in a comment on a previous post for some figures about the relevant heat capacity of the oceans versus the atmosphere, but I wasn’t really answered. I suspect that, even if you confine yourself to the more rapidly-responding surface layers (say, 0-200m) the disparity is vast. That would make any effect such as is being discussed very difficult to identify. Without numbers we can’t really be expected to put your argument in perspective.
There is a very close correlation between NH temperatures and AMO.
According to NOAA
When the AMO decreases, as from 1950 to 1975, global warming may appear to be reversed. When the AMO increases, as from 1975 to the present, the global warming is exaggerated.
In other words, it is not so much the PHASE of the AMO that matters, but the DIRECTION of travel.
AMO hit rock bottom in the mid 1970’s, then rose till around 2000. NH temperatures followed accordingly.
Since 2000, the AMO has remained pretty level, and again NH temperatures have responded in like fashion.
Fairly soon we will see a 25-year decline in the AMO, and when this happens there will follow a corresponding downward effect on temperatures.
The correlation can be seen very well on this Woodfortrees graph.
http://notalotofpeopleknowthat.wordpress.com/2014/08/22/correlation-of-the-amo-with-nh-temperatures/
andrewmharding says: August 24, 2014 at 2:16 am
…
1) Like you say, if CO2 is warming the atmosphere by a greenhouse effect it can only affect water to a few inches deep and temperature by very little due to the huge specific heat capacity of salt water compared to air at sea level.
ADH – If the atmosphere is warmed, it can only warm a very thin film of water in which it is in contact. Air temperature and water temperature can differ quite markedly as there is very little heat transfer from one to tother. Note the extremely low lying fog when sea water is about -1C and the air temperature is about -20C. Slight air turbulence creates very low fog.
Add to that, the fact that warm salt water is less dense than cold salt water and there is no way it can disappear into the ocean depths.
ADH – Sorry to disagree, Andrew, but this is not quite so. If winds blow consistently in a particular direction, they create a surface current in that same direction. If there is no land in the way, the current goes round and round the earth – hence the Southern CircumPolar current. But when there is land in the way, the current can either be diverted laterally or vertically. If vertically, the warm water goes down.
…
This is why our UK climate is as it is, mild wet winters and cool wet summers because we are a small island surrounded by sea with the Gulf Stream passing our Western shores.
ADH – with my pedant’s hat on, the Gulf Stream is on the western side of the atlantic, it is the North Atlantic Drift which produces a warmish, dampish climate for the UK.
4) Global warming by increased CO2 levels can only warm the air, the amount of solar radiation hitting the Earth is unchanged. Therefore the only way the sea could warm as a result, is by heat conduction from the air into the surface of the water, but we have already established that the main transfer of energy in fluids is by convection. So as the air warms it rises away from the surface of the sea being replaced by cooler air from above.
There is no known physical process by which less dense warmer water can sink into colder more dense water.
ADH – see my comment above. Note also that for every warm surface current there is usually a cool bottom current.
“Global warming is – and only is – an increase to global average surface temperature anomaly (GASTA).”
Good morning. If I may respectfully clarify: it makes sense to me that we need to measure and incorporate temperatures and heat fluxes in any region that impacts the “global” climate. This must include the ocean, which absorbs most of the heat. The risks of a narrow definition for global warming is that one ignores information that may be globally relevant.
“Global warming has stopped while atmospheric CO2 has continued to increase.”
This is an example of a misleading conclusion drawn from incomplete data. The skeptical mouse climbing the long staircase is thus forced to deny her vertical ascent at each stair.
“Claims that global warming has not stopped are falsehood.”
My criteria for global warming cessation needs to be informed by the prior surface temp hiatuses and by evidence of cessation of effects, such as global ice mass declines. Also, I would need evidence of radiative balance at TOA.
“There is no evidence that heat is ‘hiding’ in the oceans and will – or can – return to cause future global warming.”
Some labs have shown this evidence in the Atlantic and the Pacific oceans beneath the thermocline…and ice is melting.
In terms of evaluating the current understanding of the climate… global warming means GASTA.
It may well be that the energy moved by convection trumps irradiation (well, obviously). But this new insight was never incorporated into the climate models (whoops).
And therefore, the impact of man’s CO2 emissions was evaluated against GASTA only.
The question of “has the world stopped warming” only makes sense with respect to GASTA. Because that is what the models are talking about with their predictions.
Also, the dangerous feedbacks that make Global warming newsworthy all come from GASTA – not heat hidden down the back of the sofa or anywhere else.
“There is no known physical process by which less dense warmer water can sink into colder more dense water.”
Salinity and temperature governs density
That’s quite right.
Sometimes people seem to forget what “haline” means in the phrase “Thermohaline circulation”.
“The nuclear industry joined the fray in 1982…”
I do wonder if it was earlier. Perhaps 10 years earlier.
The answer begins with the name Carroll L. Wilson
How did the missing heat get from the top to the bottom with no one noticing? Not only is it missing, it hides its moves.
The reason that these paper writers ignore empirical data is that the data is not telling them what they want to hear. Even the fudged data sets where they have “adjusted” the data to suit their preconceived biases are not telling them what they want to hear.
Many rebuttals have been posted here at WUWT and in many, many other places. But it is hard to get a scientific paper past the group-think, censorship, and pal-review of the various scientific journals. In fact, some have said that a young scientist would risk his/her entire career on submitting a paper showing that the CO2 alarmist group-think is bunk. One can lose funding, grants, chance at advancement or full time professorship and so on.
My friend, I think only Mother Nature can end the madness of the modern crowd. When the ice starts to flow toward New York, then you might see some of the alarmists finally admit that man-generated CO2 did not have a darn thing to do with it on net and then we might get back to trying to figure out what really causes climate change.
The climate does change. Glaciations do happen as do interglacials and we don’t know what causes this. Even worse, we don’t know what caused the present ice age to begin with nor if we will ever see an end to it. For me, I will not live to see even the end of the present interglacial of this ice age, much the less see an end to the ice age itself. So, I only worry about the government and its ridiculous anti-humanity rules and laws that are prompted by this false religion.
The Hockey Schtick keeps a running total of scientific papers that explain the pause. This is the 38th scientific explanation. None of the models factor in any of these causes. If only half of the excuses have some validity, no matter what goes into the model you get garbage out.
There is no ”missing” heat, the heat never arrived. The sun is at a low level of radiation so we get less. the 18year slowdown might turn into a full blown total cooling like the LIA or even worse.
But when there is land in the way, the current can either be diverted laterally or vertically. If vertically, the warm water goes down.
If warm water rises what is keeping it down? I blame waterism. Prejudice pure and simple is keeping the warm water down. We need a warm water liberation movement. WWLM. Liberate the warm water now! Free WW Now!. No Justice No Heat
How am I doing so far?
The neutral word is “plateau.” (And plateau’d and plateau-ing.)
Richardscourtney says:
August 24, 2014 at 12:55 am
There is another more plausible reason for the “missing” heat.
Adjustments.
With far more attention on these damned fraudsters.
They are having a lot more difficulty exacuting more of what they’ve served up over the last 25 years or so.
America, it seems is also asking questions of their “gate keeper” of historical temperature records.
In Australia we have seemed to have cornered the “animal” that is our BOM.
Forcing it to respond to the outrage and criticism of it.
And it doesn’t like it.
Lashing out in defense of their adjustments.
As seems to be the norm in Australia Jo Nova seems to be the one “poking” the monster.
Yes, the heats missing because it was never really there.
http://joannenova.com.au/2014/08/the-heat-is-on-bureau-of-meteorology-altering-climate-figures-the-australian/
The Ghost Of Big Jim Cooley says:
August 24, 2014 at 1:58 am
Can we have a pause before a drop? Can we have a pause before a rise? Can we have a continuous pause?
The sun has its paws all over this.
It may well happen that I am particularly obtuse today, but I fail to understand in which way is the CDIAC data supposedly debunking any claims about recent heat storage in the oceans. Would anyone care to explain in a little bit more detail?
I would like someone to rigorously describe the mechanism for transferring enormous amounts of atmospheric heat into the ocean with what appears to be a very small temperature difference. Until I have a verifiable explanation I will remain sceptical. For a “leading climate scientist” with lots of letters after his name this should be quite easily done because all the heat transfer, psychcrometric and thermodynamics equations are well known. I guess I am asking for the algorithms and code of the climate models but just a simplified explanation would do for me because I am too busy working to find the time to look at code. Lots of alarmists read WUWT, because they are getting alarmed at what is written here, so there must be at least 1 person out there reading this who can help me out here. Just point me to a paper or some other reference that explains it clearly at the level of graduate mechanical engineer.
Do we have a source URL for the A16 temperature profile? The one posted is hard to read.
No matter how deeply we store heat in the ocean, if it isn’t warmer than the surface temperature, then it can’t warm the air even if it rises to replace the current surface water.
David Archibald says:
August 24, 2014 at 1:25 am
“Defeating a nihilist belief system like global warming means mocking them. This post is a rebuttal to the delusionist papers.”
————–
Right you are, David A. And you did a fine job at doing just that.
Any way, it is of my learned opinion that the “missing heat” (aka: the “Pause”) is the direct result of their “fuzzy math” calculations of Monthly/Yearly Average Increases in/of near-surface air temperatures that are rooted in the highly questionable historical Temperature Record from 1880 up thru the 1970’s ….. at which time more accurate near-surface air temperatures were being measured and recorded.
And by 1980 there was 22 years of fairly accurate atmospheric CO2 ppm measurements via which monthly/yearly average increases in CO2 ppm quantities could be calculated. Given said, all the CAGW “climate scientists” had to do to justify their “Global Warming” claims was insure that their calculations of Monthly/Yearly Average Increases in/of near-surface air temperatures corresponded with said fairly accurate calculations of Monthly/Yearly Average Increases in/of atmospheric CO2 ppm.
This worked great for a while …… but then the “post-1990” more accurate surface temperature measurements started “forcing” a decrease in their most current calculated monthly/yearly average temperatures. Said decrease prompted them to massage, modify and/or change the “outliers” in the historical Temperature Record, a “fact” that has been pointed out by different commentaries hereon WUWT.
But, the aforesaid decrease in current calculated average temperature is continuing ….. and the increase in current calculated average CO2 ppm is continuing …. and they dare not perform any more massaging, modifications and/or changes to the historical Temperature Record, ….. therefore their only recourse in an attempt to CTAs is to claim ….. “the ocean ate the heat”.
Cheers
If there is heat down to 2,000 m could it be rising from geothermal heat flux through that paper thin ocean floor?
rogerknights:
At August 24, 2014 at 3:35 am you say
Yes, and that is why I used it.
In my post at August 24, 2014 at 12:55 am I wrote
But I admit to disappointment that this issue has engendered discussion because that was NOT my main point which was
Richard
The North Atlantic is absorbing almost no energy at all.
In the last 8 years, the total energy content of the North Atlantic down to 2000 metres has risen at a rate of 0.1 x 10^22 joules per year which is equivalent to 0.09 W/m2/year. We are looking for 2.3 W/m2/year to be showing up.
http://data.nodc.noaa.gov/woa/DATA_ANALYSIS/3M_HEAT_CONTENT/DATA/basin/yearly/h22-a0-2000m.dat
Even that chart at the top of the post showing heat accumulating at 10^18 joules and a similar one from the paper also at 10^18 joules; those are tiny, tiny numbers.
1.0 W/m2/year (and we are looking for 2.3 W/m2/year to be showing up) of energy absorption across the whole ocean is 1.13 x 10^22 joules/year or a factor of 1,000 to 10,000 times larger than 10^18 joule/year rates.
The oceans don’t work like that…
Exactly….it would be constant…..the oceans wouldn’t all of a sudden decide to hide the heat
“one scientist says the recent papers confirm that Earth’s warming has continued during the hiatus, at least in the ocean depths, if not in the air.”
He must be the man from Atlantis. Most of us don’t leave under the sea. Tell him when we say global warming we don’t mean 20,000 ft. under the sea. But why limit to deep ocean? Most of earth’s mass is in the core and mantle. Earth’s interior has been cooling for 4 billion years. So it must be global cooling for those philosophers not satisfied with air temperature.
“We didn’t need the CDIAC data to debunk claims of missing heat in the ocean depths but it is good to have empirical data.” Empirical data? Climate Science (TM) doesn’t work like that.
Sorry for the misspelling. I mean we don’t live under the sea like Patrick Duffy
CDIAC and DOE are not a part of the nuclear industry. They are government entities.
Commercial nuclear and coal power go hand in hand, both are part of a mix of generation sources needed for reliable power. I have never known an anti-coal person in my nuclear power career.
People, the English language is much more malleable than you think. There is nothing wrong to use the word “pause” to describe a halt.
If you pause a video, there is nothing which forces you to resume it.
Other than that, I’d say that no one is going to find the missing heat in the oceans, at least until we get more precise measurements, or wait for the next 20 to 30 years.
The average world ocean depth is 4,000 meters and thermal expansion factor changes with temp. at about 56 degrees F or 13 degrees C the thermal expansion of water is 1.2665 times 10 to the minus 4.So it would average out to 11 inches per degree F if all the ocean water increased 1 degree F or 20 inches per degree C
Quick back of the envelope.
The lack of see level rise is easy to explain.. As the ocean,s volume increases it puts tremendous pressure on the ocean floor causing huge holes and rifts to form which allows the excess volume of water to sink to the center the earth. Problem solved. Now can I get my grant money? I need to buy groceries later this week.
Roy Spencer offers an explanation of how the deep ocean could warm without surface warming, here:
http://www.drroyspencer.com/2014/08/how-deep-ocean-warming-can-bypass-the-surface/
He does not claim that this has actually happened.
The post focuses only on temperature differences density. A comment pointed out that there are also ocean currents to consider as these approach continental land masses. Equally important is salinity- a higher salt content is denser. Thatnismwhat drives thermocline circulation and the deep,ocean conveyor. As, for example, winter Artic ice forms (fresh water) salt is exuded. The adjacent sea becomes saltier, denser, and sinks. That in turn draws warmer water from the equator, an example being the gulf stream. That, among other things, ismwhynthere is supposed to be polar amplification. For heat to go deep, one must either hypothesis wind/current changes that have not been observed (Trenberth Pacific trades) or salinity changes. It is possible that some of both are involved in the known Atalntic meridional overturning circulation as driving mechanisms for the apparently natural quasi-resonant variation. The stadium wave hypothesis suggests how those could come about as a function of ice and therefor albedo fluctuations around the Arctic.
The problem with the Atlantic hypothesis is not absence of possible mechanisms. It is scale. The North Atlantic isn’t big enough to cause the global stoppage in atmospheric warming. Contemplate a globe, or look at the Argo measured heat verus what would be required to offset the the supposed forcing, one rough calculation of which was posted above. Still a fail, but not for the lackmof mechanism reason posited in this thread.
Daniel G.:
At August 24, 2014 at 6:19 am you assert
The Oxford English Dictionary (OED) refutes your assertion because “pause” is a TEMPORARY STOP, and says your illustration is wrong.
The OED defines ‘pause’ as follows
But I continue to point out that the misleading propaganda of the word ‘pause’ for plateau is not the most important issue which is that there may be no missing heat.
Richard
dipchip says:
August 24, 2014 at 6:24 am
.
“Quick back of the envelope.”
..
Correct, and in the past 17 years the sea level has increased two inches.
A few words on the word “pause”.
I don’t like the word “pause” and I know it was chosen for propaganda reasons. We all do.
However, I see the situation as one of climate temps going down and up and down and up and so on. We do have a pause according to the corrupt data sets that say temps are flat. Well friends, they will not stay flat for all that long. The temps will go up or go down sometime soon. So it is a pause in a way.
By the way; I think the temps have gone down over the last decade if the “keepers of the data” were not “adjusting” the temps wholesale.
Nylo says:
August 24, 2014 at 3:42 am
It may well happen that I am particularly obtuse today, but I fail to understand in which way is the CDIAC data supposedly debunking any claims about recent heat storage in the oceans. Would anyone care to explain in a little bit more detail?
I’m with Nylo. There’s got to be something missing from the article because “the illustration of the heat gone awol” and the illustration of the CDIAC voyage A16’s temps down to 1500 meters seem to match fairly closely.
So, I’m forced to assume, absent an explanation, that the CDIAC A16 result was obtained years ago, and indicates that the “heat gone awol” illustration could have been drawn years ago as well, i.e., that it doesn’t explain where the “missing heat” of today has gone.
Is that correct? If so, did I miss the mention of the date of the CDIAC A16 voyage? Or is that supposed to be general knowledge? (If the answer to this last is ‘yes’, then I give up.) If the date of A16 was long ago, and it wasn’t noted here, I’d suggest that be added, and in a prominent place, since it underpins the entire argument being made, which falls apart completely without it, it appears to me anyway.
Incidentally, I’ve reread the piece twice. I’m forced to assume that the A16 voyage occurred some time after 1982 with the formation of CDIAC, and I shouldn’t be forced to assume that to understand the argument being made, since it appears to be the keystone of the argument. If the date is there somewhere, it’s not obvious.
Anthony, please see my previous post regarding the date of the A16 voyage. I’m adding your name to get my question to a moderator. If I’m correct in my assumption, the date of the A16 voyage should be prominently noted in the article. If I’m wrong, then I don’t understand the article at all and would appreciate clarification.
SpaghettiO might not have started the war on coal, but he sure escalated it.
So I try to go to http://www.tellEPA.com and when you try to put in my zip code it won’t take it (required field) and then my android phone goes bonkers. Anyone else ever had this problem?
Albert Einstein Was Correct About Technology,
“I fear the day when the technology overlaps with our humanity. The world will only have a generation of idiots.”
http://wac.450f.edgecastcdn.net/80450F/nj1015.com/files/2012/10/Having-Dinner-w-friends.jpg
http://wac.450f.edgecastcdn.net/80450F/nj1015.com/files/2012/10/Enjoying-a-museum.jpg
http://drinkingwateradvisor.files.wordpress.com/2012/01/pages-from-scafetta_models_comparison_atp.jpg?w=500&h=358
Global warming scare has been based only on gaps in our knowledge where technology is replacing scientific method. The belief with a basis of anything unknown has never been science and is taking our civilization back centuries.
The missing heat isn’t missing. It left the house via the poles. Antarctica is setting new record cold in large areas. Check out http://www.wunderground.com/weather-forecast/zmw:00000.1.89828 . The wunderground.com forecasts have been high by 20 to 30 degrees F all winter. We are talking -100 to -120 F.
Cold doesn’t come in: it is driven away by heat. No heat, the cold regions expand.
The way the “missing heat” graphic is designed, the hot areas are over the Mid-Atlantic Ridge including Iceland. Couldn’t this just be due to geothermal activity?
“The oceans don’t work like that”
They do
“Below that there is almost no mixing and no vertical movement of water.”
Except for a tiny few tens of million cubic meters per second?
http://onlinelibrary.wiley.com/enhanced/doi/10.1029/2007JC004477/
I believe the Chen/Tung paper is simply a discovery of how the AMO is driven. Useful work but not evidence of hiding heat. What it is is evidence that some (if not all) of the warming we did see in the late 20th century is perfectly natural. The AMO along with the PDO being positive is all it really takes to produce the GASTA changes we’ve seen. This doesn’t mean AGW is zero, but it is unlikely to be of any concern.
As I’ve mentioned before the speed of the MOC/THC can easily be the driver of global warming/cooling. This includes both the Pacific and the Atlantic. As the MOC slows we have sun warmed water staying on the surface longer which releases more heat into the atmosphere. When the MOC speeds up this effect reverses.
Is it possible for one of the more graphically gifted of you to recast the two graphs in similar scales for a more direct comparison? The first appears to show 0 – 1500 meters and the second ( over roughly the same lattitudinal area) shows 0 – 6000 meters, and one scale is joules and the other (apparently) is in degrees C. This makes it difficult to see the proof of the contention, and even harder to explain to my (even less) scientifically literate friends.
Otherwise I completely support this thread, and would love to see the sea level expansion data matched to this so called sequestration of heat as well.
Needs correction:
“Waves mix the water near the surface layer such that the temperature may be relatively uniform in the top 100 metres. Below that there is almost no mixing and no vertical movement of water.”
Here are 2 simple rules of physics.
1. Heat rises whether in air or water.
2. Heat will migrate to cooler areas close to it.
The “heat migrating to the bottom of the ocean” hypothesis depends on rule 2 above; warmer air continually migrating to cooler areas, first the ocean surface and then progressively cooler areas of the ocean. As in with CO2 there is extraordinary tunnel vision that happens in climate science. Isolate one certain behavior or aspect of a process and then assume it is the primary controlling element. So rule number 1 (Heat rises) is ignored, how the ocean currents work at various depths ignored, effect of wind and cloud interaction causing cyclic cooling/warming ignored, etc, etc.
I am pedestrian when it comes to climate science and while common sense is not infallible in all circumstances, I hope for a day when common sense starts to play a much more significant role in understanding our climate.
Rainfall. Water gathered up in the tropics falls in northern latitudes regularly. In Seattle we call it the Pineapple Express.
Reblogged this on Centinel2012 and commented:
The problem the believes have is not only that temperatures have not gone up but if the heat was to go deep it would first have to be hotter at the surface; otherwise the heat would have to jump over the surface to get to the deeper layers.
Alx says:
August 24, 2014 at 8:23 am
“2 simple rules of physics.”
…
Add a third rule which throws a wrench into rule #1…
3) Ice floats on water.
…
Without this rule, rule number one would cause the oceans to freeze solid.
Excellent post and commentary. Who knows where fluid lunacy will migrate next?
Using the only reliable ocean heat data for the Atlantic ocean, there is no supportive evidence for missing heat. The energy content here has been declining since 2006 and yet there has been no rise in global atmospheric temperatures since.
http://climate4you.com/images/NODC%20NorthAtlanticOceanicHeatContent0-700mSince1979%20With37monthRunningAverage.gif
It shows whatever little delay there was in the energy exchange between the Atlantic Ocean and the atmosphere has already been loss and we are almost back to late 1990’s levels. The heat content is declining while global temperatures remain static and the ocean heat mainly rose previously while global atmospheric temperatures were rising also.
How many so called expert climate scientists are still discovering the AMO like its brand new information? Very obvious these so called experts are nothing of the sort, when they come up with science that has already been known about and treat it like brand new discoveries. When you know little about this how can you make a sound judgment on global warming? The answer is of course you can’t and it’s been obvious to many for numerous years with the rubbish excuses year on year, showing your lack of knowledge.
For accuracy, Eric Worral’s statement that climatological theories are unfalsifiable needs amendment.A theory is falsifiable if and only if a statistical population underlies it. In testing such a theory one compares the predicted to the observed relative frequencies of the outcomes of observed events in this population. If there are no events, this is impossible.
Prior to publication of AR5, IPCC assessment reports do not reference a statistical population or compare the predicted to the measured relative frequencies. Thus, all of the research that is reported in IPCC assessment reports is non-falsifiable and unscientific, as Mr. Worral points out.
In AR5, Chapter 11, report of Working Group I, events, outcomes and relative frequencies enter the picture that is painted by the IPCC. It looks as though the comparison between the predicted and the observed relative relative frequencies is based upon far more statistically independent observed events than are available in the temperature time series, however. Also, while the IPCC has the opportunity to report whether the referenced models are falsified or validated, it fails to seize this opportunity.
A question from one of those that these climatologists call ‘ignorant’:
If a huge number of joules warm a thick and massive layer of the ocean 0.03°C is there any possible way for those huge numbers of joules causing the rise, through natural processes of energy transport, to exit upward and warm the atmosphere any more than 0.03°C? I thought I understood entropy properly, but possibly not. Could someone clue me in on as to how or just agree that is impossible?
These climatologists seem to imply solely by nature and ocean water, excluding the solar energy, can somehow re-concentrate itself but I can’t imagine it via physics or thermodynamics.
How does the heat get from the surface (which doesn’t seem to be warming, but never mind that) to the deep, dark ocean depths without being defected?
Easy! Quantum teleportation:
http://en.wikipedia.org/w/index.php?title=Quantum_teleportation
Prove it’s not true.
/sarc
It’s like the naturalists “time and chance” of the gaps.
What we don’t know and can’t predict is blamed on something equally unknowable and unpredictable.
richardscourtney says: August 24, 2014 at 6:35 am
…But I continue to point out that the misleading propaganda of the word ‘pause’ for plateau is not the most important issue which is that there may be no missing heat.
Why not just say that the global warming has stopped and get on with discussing the meat of David Archibald’s excellent rebuttal of yet another meaningless paper trying to explain the (non-existent) ‘missing heat’.
Until climate scientists stop using linear trends and start to get their heads around MEP and spatio-temporal chaos they will continue to have no clue about the energy balance of our Earth. Careful dismissal of inconvenient truths is not helping their cause, and it will not help them to develop climate models which have any degree of skill about predicting the future.
dipchip estimated the sea level rise per degree temperature increase, but sea level can only expand mainly in one axis so all three axes of expansion have to express themselves as a rise, with only a bit of relief due to a slightly greater surface area and thus only slight lateral expansion. Just a logical problem here, I imagine may be important, and may juice up the actual predicted expansion considerably, up to the third power of the expansion factor itself to fold X,Y, and Z expansion just into Z. Similarly, a thermometer cannot expand in but one direction either, so the calculator for mile long thermometers would be appropriate.
andrewmharding says: August 24, 2014 at 2:16 am “4) Global warming by increased CO2 levels can only warm the air, the amount of solar radiation hitting the Earth is unchanged.”
Key is the solar radiation rising and falling. Rising heats and expands the atmosphere; allowing for increased water vapor, resulting in a denser atmosphere. Falling radiation does the opposite. Everyone knows this.
Commented here: http://stevengoddard.wordpress.com/2014/08/23/another-great-triumph-for-climate-science/#comment-410394
But seriously, I agree with:
rogerknights says:
August 24, 2014 at 12:08 am
“It’s time to go beyond ARGO and have anchored, densely spaced monitoring instruments (including for acidification) in all the world’s oceans…”
Put this nonsense to bed once and for all.
Haven’t we been here before? The measurement of the change in ocean temperature at depth is a very small change and difficult to quantify (the change is smaller than the margin of error for the instruments used) but the potential energy for the atmosphere is very large. One exchange mechanism that has been proposed are el ninos.
David Archibald wrote:
“Below that there is almost no mixing and no vertical movement of water.”
There is. In the north Atlantic, the volume of water transported by the Florida Current is about 150 Sverdrups south of Newfoundland.
“The heat carried within this volume equals roughly that transported through the atmosphere to make the relatively milder climate of north-western Europe.”
– http://en.wikipedia.org/wiki/Sverdrup
highflight56433 says: August 24, 2014 at 9:40 am
“Key is the solar radiation rising and falling. Rising heats and expands the atmosphere; allowing for increased water vapor, resulting in a denser atmosphere. Falling radiation does the opposite. Everyone knows this.”
Sorry, I have my doubts on this. Water vapour is H2O, = 1 + 1 + 16 = 18.
N2 = 28, O2 = 32, so increased water vapour makes the atmosphere less dense. QED.
I hate to argue with David Archibald (nice story!), but it may have helped if he had quoted from the synopsis of the experiments that he opened his arguments with:
The CDIAC collects data on carbon dioxide concentrations around the planet and conducts experiments with pre-ordained outcomes. By that I mean growing plants in elevated carbon dioxide concentrations to study the effects of that on growth rates but at the same time adding ozone so that the growth would be stunted. Not everything the CDIAC is completely useless though.
The synopsis clearly states:
During one growing period, 5-year-old spruce trees (Picea abies L., Karst.) were exposed in environmental chambers to elevated concentrations of carbon dioxide (750 cm3 m−3) and ozone (008 cm3 m−3) as single variables or in combination. Control concentrations of the gases were 350cm3 m−3CO2 and 0.02 cm3 m −3 ozone.
So, one growing period (a year) – not too useful, but they appear to have tested a number of scenarios where they either raised the CO2 level alone, or the ozone (O2) level alone and compared that with raising both the CO2 and O2 together and the result was:
Elevated concentrations of ozone or CO2 as single variables caused a significant reduction in the activities of superoxide dismutase and catalase in the current year’s needles. Minimum activities of superoxide dismutase and catalase and decreased peroxidase activities were found in both needle age classes from spruce trees grown at enhanced concentrations of both CO2 and ozone. These results suggest a reduced tolerance to oxidative stress in spruce trees under conditions of elevated concentrations of both CO2 and ozone.
They don’t mention any other variables in the synopsis so one can’t tell if the lighting and temperature, etc. were also controlled, nor if there were control 5-year old Spruce trees in similar settings (same type of chamber with normal atmosphere) – so can’t comment on the conclusion that elevated CO2 appears to effect the superoxide dismutase and catalase production.
So the experiment may (or may not) be indicative of a problem for the combination of raised CO2 & O2, but as an opening argument it suffers from just being a poor example as the paper is behind a paywall and it is not possible for the average person to review…
Would it not be better to use non-paywalled examples so that his opening argument that the results were ‘pre-ordained’ can be verified more easily?
John Robertson – no known relation to john robertson
Matt G says:
“Using the only reliable ocean heat data for the Atlantic ocean, there is no supportive evidence for missing heat.”
Your data only goes down to 700 meters. Argo has been measuring down to 2000 meters since 2005, and there have been Pentadal annual data there since 1955. They’re all on this page:
– http://www.nodc.noaa.gov/OC5/3M_HEAT_CONTENT/basin_data.html
The theory of carbon based AGW at least posited a mechanism: IR energy absorbed by CO2 molecules get warm and thereby warm everything else.
What is the mechanism of deep ocean warming? Do they suggest atmospheric CO2 does this? So now these warm atmospheric CO2 molecules somehow warm the deep oceans without a warming of the atmosphere and upper levels of ocean first?
What’s up with that?
The weather forecasters in my Chicago suburbs have been “threatening” a 90F degree day lately.
They have been stymied of late by clouds and thunderstorms.
Their last hope appears to be Monday, before the cold front arrives.
Seeing as the area has received 3-5 (or more) inches of rain recently, I doubt She can heat all that water vapor to 90F.
We’ll see 🙂
The illustration shows heat plunging into the depths as far as 1,500 metres. The oceans don’t work like that. Most of the heat energy of sunlight is absorbed in the first few centimetres of the ocean’s surface. Waves mix the water near the surface layer such that the temperature may be relatively uniform in the top 100 metres. Below that there is almost no mixing and no vertical movement of water.
Are you saying that the thermohaline circulation and the Atlantic Meridional Overturning do not exist?
According to Bob Tisdale, it seems that only the Indian and South Atlantic show signs of warming according to ARGO data. Here is a recent graph of the anomalies for the years 2000 – 2013: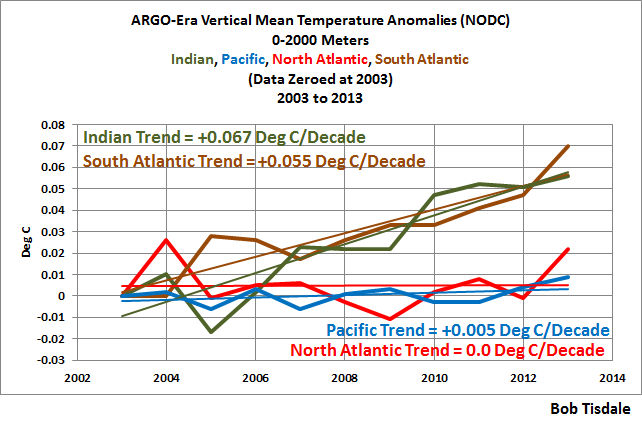
Eric Worrall says:
August 24, 2014 at 12:15 am
“God of the gaps – the global warming scare survives in the gaps in our knowledge.”
So true. I hadn’t thought of it from that perspective.
Dudley Horscroft says:
August 24, 2014 at 3:17 am
“But when there is land in the way, the current can either be diverted laterally or vertically. If vertically, the warm water goes down.”
How far down do you think wind can essentially pump the water downward? I would aver that you would need sustained hurricane force winds to move it even marginally deep.
rogerknights says:
August 24, 2014 at 3:35 am
‘The neutral word is “plateau.”’
There you go – pefect. I will use that term from now forward.
nickreality65 says:
August 24, 2014 at 4:44 am
“…could it be rising from geothermal heat flux through that paper thin ocean floor?”
Something I have wondered… Anyone have any numbers?
Latitude says:
August 24, 2014 at 5:24 am
‘…the oceans wouldn’t all of a sudden decide to hide the heat’
Indeed, the oceans are not a conscious entity, and cannot be arbitrarily fickle. If we presume chaotic behavior, then their behavior could appear spontaneous. However, if it just happened spontaneously, then it could have as easily spontaneously been releasing the heat that was formerly driving surface temperatures higher.
James Strom says:
August 24, 2014 at 6:26 am
“Roy Spencer offers an explanation of how the deep ocean could warm without surface warming…”
A) Why now, and not before? See above responses.
B) The heat still has to transport through the upper layers. Why is this not observed?
Edward Richardson says:
August 24, 2014 at 7:35 am
“Correct, and in the past 17 years the sea level has increased two inches.”
But, there hasn’t been a change in that trend since before the plateau.
wayne says:
August 24, 2014 at 9:09 am
“…is there any possible way for those huge numbers of joules causing the rise, through natural processes of energy transport, to exit upward and warm the atmosphere any more than 0.03°C?”
No.
Steven Hales says:
August 24, 2014 at 9:56 am
“…the change is smaller than the margin of error for the instruments used…”
The computed error bars are huge. And, those error bars are based on a model of random sampling. Are such error bars even in any way reliable, given the non-uniform, time-varying spatial distribution of the samples?
Bart says:
August 24, 2014 at 12:01 pm
.
“But, there hasn’t been a change in that trend since before the plateau.”
…
Correct, the thermal expansion of the ocean continues.
As is now being noted here and in Australia, UK, the so-called warming trend in past decades may actually be artificially manufactured by continual “adjustments” to land and sea temperature records in a co-ordinated fashion between North America/USA/Australia/NZ weather record orgaizations. Since satellite-measured temperature measuring was introduced in the 1980s, adjusting temperatures upwards would have become more difficult and obvious, so coincidentally warming in land/sea temperature records has slowed or stopped for twenty years or more..
Now that it has become impossible to explain the halt in warming from climate models, or increasing C02 theories, or unfathomable deep ocean heat burying theoriesetc, perhaps the most obvious explanation is that the “warming” and “heat” actulaly never existed and was completely manufactured from temperature record manipulation.
Tenuc:
In your post at August 24, 2014 at 9:29 am you ask me
There are three needed answers to that.
Firstly, people keep disputing that global warming has stopped and that needs to be corrected.
Secondly, global warming is an increase to global average surface temperature anomaly (GASTA). Global warming has stopped and global temperature is in a plateau: the ‘missing heat’ and heat going into the oceans are not relevant to that.
Thirdly, my first post in this thread stated the three known possible reasons why the ‘missing heat’ may not exist. That post is at August 24, 2014 at 12:55 am and this link jumps to it. All my subsequent posts have drawn attention to it.
Richard
Thanks for the verification Bart.
Seems this ‘speak’ of ocean heating is but another diversion tactic away from the real culprit, the constant artificial pushing downward adjustments of the old temperature records giving the appearance of some upward trend caused by mankind, though we do know there was some real warming from a recovery from the LIA over a century and the sometimes large real current UHI influence near cities, but it’s not that what is being shown to the public. Lately every article not addressing this real culprit tends to irks me but I have to stop and say so every now and then. Honestly, who really gives a damn about hundredths or thousandths (all in error range) of changes in averaged temperature (which is not a temperature at all, it’s a statistic)?
SonicsGuy says:
August 24, 2014 at 10:23 am
“Argo has been measuring down to 2000 meters since 2005, and there have been Pentadal annual data there since 1955. They’re all on this page:
– http://www.nodc.noaa.gov/OC5/3M_HEAT_CONTENT/basin_data.html”
The data down to 2000 m is not reliable at all before Argos so I don’t trust it. Only the data down to 700 m before Argos, is reliable since 1979 and there has been a much better coverage down to 2000 m since 2003. The North Atlantic doesn’t show warming even with Argos, but the Southern Atlantic does.
http://www.oceanobs09.net/proceedings/pp/2A1-Wijffels-OceanObs09.pp.40.pdf
The ocean below 2000m remains inadequately
monitored [22]. Besides a small number of deep time
series stations (largely restricted to the North Pacific
and Atlantic Oceans), the global repeat hydrographic
program [20] is the only broadscale deep ocean
sampling achieved. While eddy-resolving along the
transects, these sections are sparse in both space (one or
two meridional or zonal transects per basin) and time
(5-10 year repeat spacing).
The global ocean temperature observing system has made impressive progress over the past decade in some areas, such as broadscale observing via Argo and satellite altimetric observations. Monitoring ocean heat advection, the polar, marginal and deep oceans remains inadequate. Some clear next steps emerge from the community deliberations at OceanObs’09, which are outlined above. These can be used as a guide to focus international efforts over the next decade so that future generations have a stronger basis on which to understand, adapt to and predict our climate and environment.
Sorry ignore Argos, automatically was changed from Argo without my notice.
One tell that the ocean-ate-the-climate-crisis is just post hoc excuse making is that it was the cliamte scientists who are not oceanographers who made up this excuse. It is not likethe atmospheric science gang sent out a “help us find a heat” message and then the oceanographers said, “hey, dudes, here it is”. Instead we have a bunch of atmosphere guys scrambling and tossing stuff against the wall and hoping some of it sticks or sounds so plausible that no one really bothers to check.
THE MAJOR GAPS
The present in situ ocean temperature observing system
is largely confined to the ice-free open oceans above
2000m, with the limiting factors being observing system
technologies (cost) and legal constraints. Prior to Argo,
the ice-free polar oceans were poorly sampled and
primarily in summer. The global surface drifter array
remains at suboptimal densities in these regions, and
satellite retrievals are difficult to process due to
insufficient understanding of biases in the cold, high
wind, high wave surface conditions.
Latitude says:
August 24, 2014 at 5:24 am
The oceans don’t work like that…
Exactly….it would be constant…..the oceans wouldn’t all of a sudden decide to hide the heat
There was a forcing.
modeling experiments suggest.
The do?
WTF is a “modeling experiment”?
SonicsGuy says:
August 24, 2014 at 10:23 am
Care to explain the heat transfer/fluid flow mechanism? And explain why the heat transport was not noticed? A paragraph should do. One liners are inadequate.
Unfortunately, someone just read half of my post. You can pause a video and not resume it.
Is it not physically impossible for heat to be “missing”?
Conservation of energy is absolute.
I don’t know, maybe they are onto something. During the LIA for example, the heat could have just been hiding in the deep oceans the whole time. Perhaps there is a fifth, heretofore unknown
mode of heat transfer. This could be groundbreaking science, people. Ice ages themselves could be described as periods where the heat is locked away for millenia.
Karl Braun
“According to Bob Tisdale, it seems that only the Indian and South Atlantic show signs of warming according to ARGO data”
Yup Indian and South Atlantic. That’s where the cold salty water of THC passes transporting heat before it resurfaces in the North Pacific. Note the THC has 1,000-year cycle. The oceans may still hold the heat from MWP.
One thing I always ask alarmists is this – Will hot air stop rising under CAGW? Will the adiabatic lapse rate change under CAGW?
The illustration shows heat plunging into the depths as far as 1,500 metres. The oceans don’t work like that. Most of the heat energy of sunlight is absorbed in the first few centimetres of the ocean’s surface. Waves mix the water near the surface layer such that the temperature may be relatively uniform in the top 100 metres. Below that there is almost no mixing and no vertical movement of water.
Thanks for the article. Actually David – vertical mixing of the oceans does occur and is significant climatically. However this has been known for decades. The Warmunists are being very dishonest and machievellian in wheeling it out now.
Warmist talk of warm water physically descending to the bottom of the ocean is a myth only possible in a mind sterile of even the most basic physics. Warm water can no more descend below colder denser bottom water than it could flow to the dark side of the moon.
However at certain well defined locations that have been known for half a century, deep bottom water is formed from the surface and descends to the ocean floor – these are the Norwegian sea and around Antarctica. Here water becomes near freezing and hypersaline, thus very dense. Only denser water can descend. These sites of cold bottom water formation drive the system of deep currents which is called the ThermoHalineCirculation or THC.
There are two parallel ocean circulation systems, one at the surface and the THC deep down. They act almost independently often flowing in different or opposite directions. However globally they are connected in a winding route rather like the route through an IKEA furniture store and after about 1000 years seawater ends up where it started.
This is no doubt a simplification and looked at at higher magnification one would see a much more complex intermittently turbulent circulation. This complexity is the key. Circulation is subject to chaotic-nonlinear dynamics including intermittent turbulence and this complexity and variability gives ocean circulation the possibility to vary the atmosphere climate by variable delivery of cold water to the surface. It makes much more sense to think of the ocean’s influence on atmosphere climate in terms of variable upwelling of cold to the surface than to parade childish ignorance by talking about heat or warm water hiding in the deep.
Warmunist spin-doctor central have clearly decided to make an about face on ocean circualtion. Up to now any mechanism that could explain “natural” (odd how they hate that word) climate variability was suppressed or discounted since their AGW theory requires climate stasis in the absence of CO2 change. However, interestingly, now they are abandoning that line of defense and moving back to another one. With the pause challenging their credibility they – clearly under some pressure – have decided that they can admit what has been known for decades that ocean circulation causes natural climate variation. Variable delivery of cold water to the surface and alternating stratification and turbulent mixing are instead spun and packaged as “warm water hiding in the deep”. They clearly judge that the media and most of the public are too slow and dimwitted to see the obvious fact that, by this, they are admitting that variation and “climate change” are completely normal and natural. And this makes it less likely (although still possible at least in part) that late 20th century warming was anthropogenic CO2 related.
So overall this tactical retreat by the warmist Berchesgarden shows a little desperation and risk-taking mixed with insulting the public’s intelligence.
Further to the previous comment – if and where there is no vertical mixing in the ocean, the bottom becomes anoxic. This happens in the Black sea and is why it has this name. But in most of the open ocean there is oxygen at depth originating from the surface.
richardscourtney says:
August 24, 2014 at 12:36 pm
Firstly, people keep disputing that global warming has stopped and that needs to be corrected.
Global warming of the lower troposphere and the top of the ocean, which are the only parts of the planet whose temperatures matter to us and the only ones that the IPCC have been mentioning all along, and the ones that IPCC predicted that would rise faster and faster every year, have indeed stopped, and this needs no correction at all.
Well its been colder here all summer AND there’s been a bunch of extra high tides. I think they are on to something. However maybe one of you experts here can take the submerged heat theory and use it to explain how it could instead be a trigger for the next ice age?
richardscourtney says:
“Secondly, global warming is an increase to global average surface temperature anomaly (GASTA). Global warming has stopped and global temperature is in a plateau: the ‘missing heat’ and heat going into the oceans are not relevant to that.”
No, “global warming” is warming globally. What goes into warming the surface air is variable, but since almost all the extra trapped heat goes into the ocean, ocean warming is a strong sign the planet still has an energy imbalance — more coming in than leaving.
Matt G says:
“The data down to 2000 m is not reliable at all before Argos so I don’t trust it.”
What are the data’s uncertainties?
Magma, thats where the heat is hiding, all those cracks in the earth, the heat is going down there, the centre of the earth is heating up you wait a paper will come out soon
Daniel G. If you paused a video and didn’t watch it, then you stopped watching it! It didn’t continue, so it is stopped. The English language is flexible to some extent, but not that much. To ‘pause’ indicates a known future event. What you’re doing is to confuse the buttons on a video machine with the definition of the word in the English language. Stop it!
Daniel G.:
Your post at August 24, 2014 at 4:23 pm says in total
Unfortunately you did not read the reply to you which I took the trouble to provide at August 24, 2014 at 6:35 am. It is here.
My answer quotes the Oxford English Dictionary (OED) which refutes your assertion because “pause” is a TEMPORARY stop, and it specifically says your video illustration is wrong because – as I also quoted – it says
I consider the OED to be a more definitive indicator of the meaning of a word than you.
It is untrue propaganda to use the word ‘pause’ for global warming has ‘stopped’ or global temperature is at a ‘plateau’. And your false claim that I failed to read what you wrote is also untrue propaganda: I refuted what you wrote with quotation from the OED.
As I said in my first post which is at August 24, 2014 at 12:55 am and induced your propaganda crusade
Richard
Nylo:
I cannot reply to your post addressed to me at August 24, 2014 at 6:47 pm because I don’t understand what it says. Please clarify.
Richard
SonicsGuy:
Your post at August 24, 2014 at 7:13 pm is balderdash!
It says in total
No! Warming is an increase in temperature.
Global warming is an increase in GASTA.
Global warming is NOT a change to heat balance, to energy or to anything except GASTA.
That is why Hadley, NASA GISS, and et al. have expended – and are expending – so much time, money and effort in generating time series of GASTA. It is also why GCMs generate surface temperature emulations. And it is why etc.
But global warming stopped some 17 years ago so warmunists are now trying to pretend global warming is something other than an increase to global average surface temperature anomaly (GASTA).
And putative “ocean warming” is not relevant to global warming.
The entire change to GASTA since the industrial revolution could result from a redistribution of surface temperatures caused e.g. by variation to ocean currents. Thus, ALL the global warming since the industrial revolution may have happened without any change to radiative forcing and – in that case – any energy imbalance would have been a RESULT – n.b. not a cause – of global warming.
Richard
Hmm, I look forward to the day when that missing heat in the Atlantic stops me from freezing to death in a few hrs if i fell in.
I have a feeling you would need a thermal heat pump to extract any so called heat that would make any major difference to our atmosphere.
Mods:
I am sure you are very busy getting familiar with the new system.
I write to inform that my post at August 25, 2014 at 2:22 am in reply to SonicsGuy is still in moderation.
I hope this information is helpful when you get around to checking the ‘bin’.
Richard
richardscourtney: August 24, 2014 at 12:36 pm
“Thirdly, my first post in this thread stated the three known possible reasons why the ‘missing heat’ may not exist.
Thanks for the reply, Richard. Using Occam, I still feel that the simplest explanation for the ‘missing heat’ is that climate scientists don’t know how to calculate the energy balance of the Earth with sufficient accuracy to know whether the heat is missing or not. Too many assumptions made in their useless models and too few measuring points around the globe to even know what is going on at any delta(t), let alone on the scale of centuries.
Tenuc:
Thankyou for your reply to me at August 25, 2014 at 3:45 am which includes
I agree. Indeed, the methods used to determine energy balance are based on temperature estimates that are meaningless: if you have not seen it then I suggest you may want to read this, especially its Appendix B.
However, my point was that there may be no ‘missing heat’ because the hypothesis which suggests the existence of such ‘missing heat’ may be the wrong hypothesis. And this is directly pertinent to my post still in moderation which is at August 25, 2014 at 2:22 am and is in reply to SonicsGuy .
Richard
Local thermometer. The sea level reflects the expansion only in the local profile, plus or minus a hair for moving water. The warmer water floats on top of the cooler water underneath, forming a local hump that can easily be isostatic with cooler water elsewhere that is unchanged.
In coastal regions, local warming can produce a localized SLR increase. Or, in mid-ocean surface warming can cause SLR there only without affecting coastal SLR at all (as long as coastal temperatures do not vary).
The problem then is that coastal records have literally nothing to do with what is going on in or over the deep ocean. Our records over 150 years are nearly pointless except that they demonstrate that very little SLR is taking place along the coasts where people actually measure it, especially when subsidence is taken into account, because in fact there has been very little change in mean SST along the coasts. Only the very recent ARGO/Satellite era has a prayer of measuring global SLR at all accurately, and even there one needs to correct for geostasis using e.g. GRACE data and the many, complex measurements of the shape of the Earth and influence of the continental land masses.
In a few decades we MIGHT have enough, good enough, data to make halfway decent statements about SLR. At the moment, all we can really say is that the observed SLR rate is utterly ignorable, basically unchanged and tiny over the last 150 years.
rgbatduke
August 25, 2014 at 7:31 am
“Only the very recent ARGO/Satellite era has a prayer of measuring global SLR at all accurately”
Correct.
They have measured 50 mm of SLR in the 17 years of “no warming”
That’s two inches.
Half of that is attributed to the thermal expansion of the water in the oceans.
NikFromNYC:
Your post at August 24, 2014 at 12:16 am concluded saying
I write to help you following the response to your post that rgbatduke has provided at August 25, 2014 at 7:31 am.
I can commend the dental practice I use at Carnon Downs near Trurob for provision of your needed dentures.
Richard
Alan Davidson: August 24, 2014 at 12:21 pm
“Now that it has become impossible to explain the halt in warming from climate models, or increasing C02 theories, or unfathomable deep ocean heat burying theoriesetc, perhaps the most obvious explanation is that the “warming” and “heat” actulaly never existed and was completely manufactured from temperature record manipulation.”
————————-
Great minds think alike, to wit:
http://wattsupwiththat.com/2014/08/24/missing-heat-in-the-atlantic-it-doesnt-work-like-that/#comment-1716274
===================
To better understand the physical movement of the Thermohaline Circulation, to wit:
http://essayweb.net/geology/quicknotes/images/thermohaline_circ.png
One needs to better understand the physical forces that are associated with the functioning of “fluid logics” or “fluidics”, to wit: http://en.wikipedia.org/wiki/Fluidics
And “Yes”, that is a Wikipedia reference, …. and a pretty good one for the subject in question.
===============
And for those persons interested in knowing, the much argued phrase ….. “pause in global warming” ….. has absolutely nothing whatsoever to do with the status of the earth’s climate, but in actuality is a “descriptor phase” that defines the status of ……. the mathematically calculated “average increase in/of atmospheric temperatures”, ….. which are abstract numbers and therefore have no physical quantities or attributes associated with them.
Thus said, the literal translation of the aforementioned phrase of “pause in global warming” is in reference to the “pausing” of the mathematically calculated “average temperature increase”.
richardscourtney says”
“No! Warming is an increase in temperature.”
Warming is the transfer of heat.
“Global warming is an increase in GASTA.”
If it were, it’d be called “surface warming” or something like “global surface warming.” But it isn’t.
“That is why Hadley, NASA GISS, and et al. have expended – and are expending – so much time, money and effort in generating time series of GASTA. It is also why GCMs generate surface temperature emulations.”
No, that’s done because it easiest to do, because thermometers have been around for a long time but ocean soundings were scarce.
“But global warming stopped some 17 years ago so warmunists are now trying to pretend global warming is something other than an increase to global average surface temperature anomaly (GASTA).”
It has only “stopped in one of seven datasets (RSS LT), which differs significantly from UAH LT. That means the data are suspect. Meanwhile, the dataset that uses the most information for validation (Cowtan & Way) shows 0.16 C of warming in 17.0 years.
“And putative “ocean warming” is not relevant to global warming.”
Hardly. There is no guarantee that ocean heat will stay there — some of it could well come out in an El Nino or when the IPO or AMO shifts. That’s why scientists talk about “committed warming.”
Always fun to hear a rant from Mr. Archibald. He says “We didn’t need the CDIAC data to debunk claims of missing heat in the ocean depths” which is good, because it’s not debunked. He’s so intent on hating climate science that he contradicts himself repeatedly in this “essay”.
He says this about the illustration from the article he picks on:
“The illustration shows heat plunging into the depths as far as 1,500 metres. The oceans don’t work like that.”
But then he says this about the deep cold water in the Antarctic: “The dark blue in the bottom left is cold water below 1°C plunges near Antarctica and ponds in the deep ocean right up to the equator. ”
So he says that the oceans DO work like that.
And the temperature profile chart he includes from voyage A16 that shows heat mixing down to ~1500 meters from the equator northwards.
So, what’s been proved? Not that the oceans don’t mix, since Mr. Archibald himself shows us deep water mixing twice.
I must ammend my comment; the front page is not as nice but the inside is terrific for reading, I must say.
Thanks.
Richard Courtney has neatly put it in a nutshell.
SonicsGuy:
I am replying to your post at August 25, 2014 at 9:29 am. It begins
Oh dear. WARMING IS AN INCREASE IN TEMPERATURE.
A transfer of heat can occur without warming by providing a change of state; e.g. from solid to liquid.
After that ‘schoolboy howler’ your post goes downhill.
It next says
That is plain silly! If global warming is not an increase to the Earth’s average surface temperature then global warming can only be an increase to the average temperature of the Earth’s volume.
The volumetric temperature average would be dominated by the temperatures of the magma.
GLOBAL WARMING IS AN INCREASE TO GLOBAL AVERAGE SURFACE TEMPERATURE ANOMALY (GASTA).
I see. According to you all those organisations spent $billions doing pointless things because the pointless things were easy to do and they could not do what you claim is the right thing do. And, according to you, all the IPCC Reports are wrong because they assessed global warming in terms of GASTA. Are you really stupid enough to think anybody will accept those risible assertions or are you merely trying to look stupid?
Rubbish! GLOBAL WARMING HAS STOPPED. Read the liknked article by Werner Brozek which assesses all data sets.
Clearly, you don’t understand “committed warming.” And climastrologists talk about it.
“Committed warming” is global warming so is estimated as increase to GASTA because global warming is increase to GASTA. And it has vanished.
The explanation for this is in IPCC AR4 (2007) Chapter 10.7 which can be read at
http://www.ipcc.ch/publications_and_data/ar4/wg1/en/ch10s10-7.html
It says there
In other words, it was expected that global temperature would rise at an average rate of “0.2°C per decade” over the first two decades of this century with half of this rise being due to atmospheric GHG emissions which were already in the system.
This assertion of “committed warming” should have had large uncertainty because the Report was published in 2007 and there was then no indication of any global temperature rise over the previous 7 years. There has still not been any rise and we are now way past the half-way mark of the “first two decades of the 21st century”.
So, if this “committed warming” is to occur such as to provide a rise of 0.2°C per decade by 2020 then GASTA would need to rise over the next 7 years by about 0.4°C. And this assumes the “average” rise over the two decades is the difference between the temperatures at 2000 and 2020. If the average rise of each of the two decades is assumed to be the “average” (i.e. linear trend) over those two decades then global temperature now needs to rise before 2020 by more than it rose over the entire twentieth century. It only rose ~0.8°C over the entire twentieth century.
Simply, the “committed warming” has disappeared (perhaps it has eloped with Trenberth’s ‘missing heat’?).
This disappearance of the “committed warming” is – of itself – sufficient to falsify the AGW hypothesis as emulated by climate models. If we reach 2020 without any detection of the “committed warming” then it will be 100% certain that all the IPCC projections of global warming are complete bunkum.
Richard
richardscourtney
August 25, 2014 at 12:41 pm
..
“This disappearance of the “committed warming” is – of itself – sufficient to falsify the AGW hypothesis as emulated by climate models”
The AGW hypothesis does not depend on models.
Svante Arrhenius did not have computer models when he first formulated the AGW hypothesis.
Edward Richardson:
Your post at August 25, 2014 at 1:26 pm demonstrates your difficulties with reading comprehension. It says in total
The AGW hypothesis as emulated by climate models does depend on the models which emulate it.
Svante Arrhenius did not formulate the AGW hypothesis and it would not be relevant if he had because there were no climate models in his time.
The climate models emulating the AGW hypothesis predicted (n.b. predicted and NOT projected) the “committed warming” which has not happened. And, as I said, this disappearance of the “committed warming” is – of itself – sufficient to falsify the AGW hypothesis as emulated by climate models.
I would be interested in a dispute of what I wrote. If you can dispute it then please do.
Richard
Edward Richardson says:
“Svante Arrhenius did not have computer models when he first formulated the AGW hypothesis.”
But he did have a model. He just did all the calculations by hand.
richardscourtney
August 25, 2014 at 1:55 pm
..
“If you can dispute it then please do.”
The AGW hypothesis does not depend on any climate model. The hypothesis stands apart from the computer models, as it was formulated over 100 years ago when there were no computer models in existence.
@richard_courtney
Robert Pielke Sr., et al:
“This aspect of the climate system is why it has been proposed to use the changes in the ocean heat content to diagnose the global radiative imbalance, as summarized in Pielke (2003, 2008). In this weblog post, we take advantage of this natural space and time integrator of global warming and cooling.
“We present this alternate tool to assess the magnitude of global warming based on assessing the magnitudes of the annual global average radiative imbalance, and the annual global average radiative forcing and feedbacks.”
“An alternative metric to assess global warming,”
by Roger A. Pielke Sr., Richard T. McNider, and John Christy
April 28, 2014
http://judithcurry.com/2014/04/28/an-alternative-metric-to-assess-global-warming/
Friends:
I see that there are attempts to deflect this thread with assertions that Svante Arrhenius first formulated the AGW hypothesis. We can ignore that red herring because he did not.
His pertinent paper can be seen and read here. As the accompanying comment observes
There, the red herring is hooked, landed and disposed so there is no valid reason to continue with any mention of it.
Richard
Edward Richardson
August 25, 2014 at 7:48 am
“Half of that is attributed to the thermal expansion of the water in the oceans.”
Whatever it is attributed to, the trends haven’t changed in many decades. Thus, the attribution for the warming plateau to a recent diversion of heat energy to the oceans fails.
richardscourtney says:
“Svante Arrhenius did not have computer models when he first formulated the AGW hypothesis.”
Svante’s paper outlined his model in detail.
I can’t think of a concept or calculation in science (outside of mathematics) that doesn’t rely on a model. Can you?
SonicsGuy:
Thankyou for your post at August 25, 2014 at 2:08 pm which admits you were wrong when you pretended that “ocean heat content” and “energy imbalance” are the metrics of global warming.
Your new post admits that as recently as April 28, 2014 Roger A. Pielke Sr., Richard T. McNider, and John Christy wrote
A recently proposed “alternate tool” presented on a blog is interesting but is NOT a metric which has replaced global average surface temperature anomaly (GASTA).
Richard
SonicsGuy
August 25, 2014 at 2:00 pm
“But he did have a model. He just did all the calculations by hand.”
Indeed. A model is a mathematical paradigm which quantifies the relationships between cause and effect. Arrhenius’ construct for projecting temperature rise based on CO2 concentration is a model.
It is an incorrect model but, per Geo Box, they all are, though some are useful. This one has not proved to be very useful for anything but diverting precious resources into a snipe hunt.
Arrhenius’s model is wrong for being non-falsifiable. Box’s aphorism is wrong for having counter examples;
SonicsGuy:
At August 25, 2014 at 2:18 pm you apply the classic warmunist troll trick of misquotation by claiming I wrote
I DID NOT WRITE THAT! At http://wattsupwiththat.com/2014/08/24/missing-heat-in-the-atlantic-it-doesnt-work-like-that/#comment-1717505 I wrote
Richard
Repeat of post sans link which is held up in moderation queue:
Edward Richardson
August 25, 2014 at 7:48 am
“Half of that is attributed to the thermal expansion of the water in the oceans.”
Whatever it is attributed to, the trends haven’t changed in many decades. Thus, the attribution for the warming plateau to a recent diversion of heat energy to the oceans fails.
Edward Richardson:
I see that at August 25, 2014 at 2:06 pm you continue to try to distract this thread with your red herring.
I discussed climate models which predict “committed warming”. That is pertinent to this thread.
I did not raise the irrelevance of calculations made a century ago: you are waving that red herring. It is stinking fish. Please take it elsewhere.
Richard
Moderator: A couple of posts (same one really) are being held in the queue for reasons unknown and seemingly unfathomable.
REPLY: You know, I can’t be “on” 24/7, I have a life, I occasionally have to eat, go to the bathroom, spend time with my family, and do work. I don’t see any posts held in moderation – Anthony
Richard – the only reason “anthropogenic” is in the AGW is because we happen to be the ones responsible for the increasing concentrations of persistent greenhouse gases in the atmosphere.
This has been measured. The CDIAC tracks all that, as do other groups worldwide. Included in the list of persistent gases are CFCs, which don’t even exist in nature.
The greenhouse effect is well understood, proven, and has been observed on Earth as well as on Venus, Mars and Titan. It’s physics. At Earth’s distance from the sun, gases like water vapor, CO2, methane and others intercept infrared photons, absorb energy from them, then re-emit that energy. This slows the path of those photons out to space.
It’s been understood since Fourier in the 1820s that something in the atmosphere was keeping the Earth far above the expected temperature of -15C. That little “something” is greenhouse gas.
Increasing the amount of greenhouse gas increases the energy content of the climate system by lowering the temperature of energy escaping at the top of the atmosphere. The system can only reach a new equilibrium by increasing the temperature of the atmosphere.
Disprove the greenhouse effect and you will have proved that we’ve got nothing to worry about. Except declining ocean pH.
Then you’ll have to come up with a valid, comprehensive theory to explain the following measured or observed changes in Earth’s climate system:
1 – cooling stratosphere
2 – reduction in Arctic ice
3 – greatest effect of warming in high latitudes (showing it’s not insolation driven).
4 – increasing frequency of intense precipitation events due to greater water-carrying capacity of a warmer atmosphere.
Arrhenius didn’t worry about AGW because the amount of fossil fuels consumed back then were miniscule, and nobody was forseeing the exponential growth in consumption.
b fagan:
Your conclusion that the greenhouse effect is proven cannot be reached by the scientific method of investigation. Under this method observational data may disprove a conclusion but may not prove one.
Terry, you said “b fagan:
Your conclusion that the greenhouse effect is proven cannot be reached by the scientific method of investigation. Under this method observational data may disprove a conclusion but may not prove one.”
Correct. I’ll state it more properly. “The greenhouse effect, or more specifically, the ability of certain atmospheric gases to capture and release photons in the infrared range of the spectrum, slowing the escape of heat back to space, is a hypothesis that has been examined and tested frequently since first postulated well over a century ago and has never been falsified.”
Anyone seriously attempting to say that increasing the concentrations of persistent greenhouse gases, as we have been measuring, without it producing a significant result on the planetary energy budget needs to provide an alternate hypothesis that is more robust than the 100+ year old greenhouse hypothesis.
b fagan:
I’m thinking of the model that has the equilibrium climate sensitivity as its proportionality constant. As a basis for policy making, this model has a number of shortcomings. One is that it conveys no information to a policy maker about the outcomes from his or her policy decisions. A model with this characteristic is useless for the purpose of making pollicy.
SonicsGuy August 24, 2014 at 7:30 pm
Matt G says:
“The data down to 2000 m is not reliable at all before Argos so I don’t trust it.”
What are the data’s uncertainties?
————————————————————————————————————————————-
This link below shows the number of temperature profiles per month below 1000m.
http://www.cpc.ncep.noaa.gov/cgi-bin/godas_parameter.pl
This how the number compares with down to 250m
http://www.cpc.ncep.noaa.gov/cgi-bin/godas_parameter.pl
The ocean has 71% surface area of the planet with land 29%.
Notice the oceans should have 2.45 times more temperature profiles, just to have an equal coverage of observations. Surface land instrument temperature data sets use around 7,000 depending on the organisation for 29% surface area. These are still not accurate enough/poor coverage and just to keep this standard would need around 17000 for ocean coverage. Less than 50 temperature profiles for the deep ocean (below 1000m) until the 1990’s is awful coverage. That is less than one profile per 2% surface ocean coverage.
That’s why anybody that treats so little profiles with any confidence is a fool.
Sorry the above links don’t work, these should now.
For below 1000m
http://www.cpc.ncep.noaa.gov/products/GODAS/mnth_gif/xy_data/temp.prof.global.90s-90n.1000-5000m.gif
For depth down to 250m
http://www.cpc.ncep.noaa.gov/products/GODAS/mnth_gif/xy_data/temp.prof.global.90s-90n.0-250m.gif
Bart
August 25, 2014 at 2:36 pm
“the trends haven’t changed in many decades. ”
From 1870 to 2004, global average sea levels rose a 1.46 mm per year.
From 1950 to 2009, the annual rise in sea level of 1.7 ± 0.3 mm per year,
From 1993 to 2009, satellites are showing a rise of 3.3 ± 0.4 mm per year.
…
I’d say there’s a slight acceleration.
Bart
August 25, 2014 at 2:38 pm
“You know, I can’t be “on” 24/7…”
Nobody appreciates you and your service here more than I. Please do not ever think I am ever being even slightly critical. If a thousand thank you’s will help assuage your irritation, please accept them from me.
I thought you had said you would like a note labelled moderator when something went awry, I assumed to help calibrate the new sp*m filter. I got three messages saying innocuous posts were being held for moderation. That’s all.
Bart Your comment is awaiting moderation.
August 25, 2014 at 2:53 pm
That one, too.
b fagan:
It would require writing a book to correct all the errors and misunderstandings in your post at August 25, 2014 at 2:39 pm. It begins saying
CFCs have a potential effect but it is very small. At issue is the cause and the effect of rising atmospheric carbon dioxide (CO2) concentration.
Please provide cogent evidence that human activity is “responsible for the increasing concentrations of” CO2 in the atmosphere. I don’t know what is causing it but I want to know. We modeled the rise as being either natural or anthropogenic and in a variety of ways.
ref. Rorsch A, Courtney RS & Thoenes D, ‘The Interaction of Climate Change and the Carbon Dioxide Cycle’ E&E v16no2 (2005).
Then there is the effect of the rise in CO2. Allow me to introduce you to the scientific Null Hypothesis.
The Null Hypothesis says it must be assumed a system has not experienced a change unless there is evidence of a change.
The Null Hypothesis is a fundamental scientific principle and forms the basis of all scientific understanding, investigation and interpretation. Indeed, it is the basic principle of experimental procedure where an input to a system is altered to discern a change: if the system is not observed to respond to the alteration then it has to be assumed the system did not respond to the alteration.
In the case of climate science there is a hypothesis that increased greenhouse gases (GHGs, notably CO2) in the air will increase global temperature. There are good reasons to suppose this hypothesis may be true, but the Null Hypothesis says it must be assumed the GHG changes have no effect unless and until increased GHGs are observed to increase global temperature. That is what the scientific method decrees. It does not matter how certain some people may be that the hypothesis is right because observation of reality (i.e. empiricism) trumps all opinions.
Please note that the Null Hypothesis is a hypothesis which exists to be refuted by empirical observation. It is a rejection of the scientific method to assert that one can “choose” any subjective Null Hypothesis one likes. There is only one Null Hypothesis: i.e. it has to be assumed a system has not changed unless it is observed that the system has changed.
However, deciding a method which would discern a change may require a detailed statistical specification.
In the case of global climate no unprecedented climate behaviours are observed so the Null Hypothesis decrees that the climate system has not changed.
Importantly, an effect may be real but not overcome the Null Hypothesis because it is too trivial for the effect to be observable. Human activities have some effect on global temperature for several reasons. An example of an anthropogenic effect on global temperature is the urban heat island (UHI). Cities are warmer than the land around them, so cities cause some warming. But the temperature rise from cities is too small to be detected when averaged over the entire surface of the planet, although this global warming from cities can be estimated by measuring the warming of all cities and their areas.
Clearly, the Null Hypothesis decrees that UHI is not affecting global temperature although there are good reasons to think UHI has some effect. Similarly, it is very probable that AGW from GHG emissions are too trivial to have observable effects.
The feedbacks in the climate system are negative and, therefore, any effect of increased CO2 will be probably too small to discern because natural climate variability is much, much larger. This concurs with the empirically determined values of low climate sensitivity.
Empirical – n.b. not model-derived – determinations indicate climate sensitivity is less than 1.0°C for a doubling of atmospheric CO2 equivalent. This is indicated by the studies of
Idso from surface measurements
http://www.warwickhughes.com/papers/Idso_CR_1998.pdf
and Lindzen & Choi from ERBE satellite data
http://www.drroyspencer.com/Lindzen-and-Choi-GRL-2009.pdf
and Gregory from balloon radiosonde data
http://www.friendsofscience.org/assets/documents/OLR&NGF_June2011.pdf
Indeed, because climate sensitivity is less than 1.0°C for a doubling of CO2 equivalent, it is physically impossible for the man-made global warming to be large enough to be detected (just as the global warming from UHI is too small to be detected). If something exists but is too small to be detected then it only has an abstract existence; it does not have a discernible existence that has effects (observation of the effects would be its detection).
To date there are no discernible effects of AGW. Hence, the Null Hypothesis decrees that AGW does not affect global climate to a discernible degree. That is the ONLY scientific conclusion possible at present.
I can also dispute every other of your assertions that your post presents as being facts.
Richard
Richard, your reply to me was full of words, but little that bears reply. We have measures of fossil fuel extraction – recorded in the books of the energy companies. We know how much CO2 is produced per unit of fuel burned. We have recordings since 1958 of increasing CO2 in the atmosphere, declining pH of ocean surface waters as they absorb CO2, and the amounts add up to what we see dug from the ground, when you allow for increased plant growth absorbing a bit of the remainder.
We have measurements of declining concentrations of atmospheric oxygen which are consistent with the amount of carbon burned in our fossil fuels.
And the greenhouse effect is still real.
richardscourtney
August 25, 2014 at 2:59 pm
1) “unless there is evidence of a change.”
2) ” no unprecedented climate behaviors ”
First of all, there is evidence of a change, namely a rise of 0.8 degrees C in the past 100 years. Secondly the Null hypothesis does not include the word “UNPRECEDENTED.” Your adding that word is evidence that you are not being honest about what the actual Null Hypothesis is.
Edward Richardson:
re your post at August 25, 2014 at 2:52 pm that says
No, I would say you have chosen different lengths of time. It is a common warmunist disinformation trick and the IPCC has used it to pretend that global warming is accelerating.
Richard
richardscourtney
August 25, 2014 at 3:08 pm
“you have chosen different lengths of time”
…
Just pointing out to you the slope of the line. You know, that old “dy/dx” first derivative. It’s increasing.
Edward Richardson:
Your post at August 25, 2014 at 3:07 pm is desperate. It says in total
No, there is no evidence of a change to the climate system.
Variations of 0.8 degrees C have happened before in the holocene. Indeed, the importance of the MBH hockey Stick was that it pretended to show the Medieval Warm Period was not hotter than now, but that graph is now the most discredited graph in the history of science.
Your objection to the word “unprecedented” is ridiculous. If there is nothing unprecedented then there is no evidence of a change to the behaviour of the system.
Your words prove beyond any possibility of reasonable doubt that you do not know what “honesty” is.
Richard
Edward Richardson:
Please desist from your trolling. Your red herring at August 25, 2014 at 3:14 pm is your second attempt to distract this thread from its subject.
Richard
richardscourtney
August 25, 2014 at 3:16 pm
..
First you say, ” there is no evidence of a change”
Then you say “Variations of 0.8 degrees C have happened before.”
You need to make up your mind. Either 0.8 degrees is a change, or it is not a change. Which is it?
Also, the word “unprecedented” is not a part of the Null Hypothesis.
Edward Richardson:
I see that having failed with the red herring ploy at August 25, 2014 at 3:22 pm you attempt to troll the thread with the obtuse ploy
GASTA varies within limits. If it varies within those limits then the system is not observed to change its behaviour.
You need to stop pretending to be an idiot. A variation of 0.8 degrees is NOT evidence that the system has changed because such variations have happened before.
And I stated the Null Hypothesis. Your pretense that you cannot read is also deliberately obtuse. I wrote
The Null Hypothesis says it must be assumed a system has not experienced a change unless there is evidence of a change.
I shall ignore any further attempts by you to present the obtuse ploy.
Richard
SonicsGuy August 24, 2014 at 7:30 pm
Matt G August 25, 2014 at 2:41 pm
“That is less than one profile per 2% surface ocean coverage.”
If you think that’s bad enough (which it is) for coverage below 1000m I forgot to add most of those are only in 4-6 very small regions of the worlds oceans before 1990’s. Many thousands of miles of ocean especially in the Pacific, Atlantic and Indian don’t have a single one. The area without a single one is larger than the planets land mass.
richardscourtney quoted:
“Contrary to some misunderstandings, Arrhenius does not explicitly suggest in this paper that the burning of fossil fuels will cause global warming,”
Having established the warming potential of carbonic acid in the atmosphere, Arrhenius writes, in the last section of his 1996 paper”
“Even though the number given were on account of inexact or uncertain assumptions erroneous to the extent of 50 per cent. or more, the comparison instituted is of very great interest, as it proves that the most important of all the processes by means of which carbonic acid has been removed from the atmosphere in all times, namely the chemical weathering of siliceous minerals, is of the same order of magnitude as a process of contrary effect, which is caused by the industrial development of our time, and which must be conceived of as being of a temporary nature.”
In the argument that was posted by Mr. Courtney on Aug. 24 at 2:59 pm I find the claim that “…climate sensitivity is less than 1.0°C for a doubling of CO2 equivalent.” As I understand it, this claim is not falsifiable. If so, it is not a valid premise to Mr. Courtney’s argument.
richardscourtney says:
” A recently proposed “alternate tool” presented on a blog is interesting but is NOT a metric which has replaced global average surface temperature anomaly (GASTA).”
Seems you didn’t read closely enough, as the authors referred to work in “Pielke (2003, 2008)”:
In Physics Today 2008, Roger Pielke Sr wrote:
“…my collaborators and I have shown that global average surface-temperature changes are not particularly useful for assessing the broad range of human influences on climate.
“Global warming (or global cooling) can be more accurately quantified in terms of accumulation (or loss) of heat in the Earth system as measured in joules…. ”
“The ocean, of course, is the largest reservoir of this heat change. Thus, the Earth’s heat budget observations, within the limits of their representativeness and accuracy, provide an observational contraint on the actual global average radiative forcing. The value of ocean heat content at any time documents the accumulated heat content and its change since the laste assessment….”
“…Moreover, because the surface temperature is a massless two-dimensional global field while heat content involves mass, the use of surface temperature as a monitor of climate change is not accurate for evaluating heat storage changes.”
https://pielkeclimatesci.files.wordpress.com/2009/10/r-334.pdf
Terry Oldberg says:
“In the argument that was posted by Mr. Courtney on Aug. 24 at 2:59 pm I find the claim that “…climate sensitivity is less than 1.0°C for a doubling of CO2 equivalent.” As I understand it, this claim is not falsifiable.”
1) Paleoclimate data can be used to calculate the surface’s sensitivity to CO2. They gives values that, within uncertainites, are the same. If they hadn’t, that would have been a falsifiation.
2) so what?
SonicsGuy:
Thank you for giving me the opportunity to clarify.
I think your reference is the use of paleoclimate data plus Bayesian parameter estimation in constructing a posterior probability density function over the climate sensitivity. This process of construction is illogical.
The process assumes the unique existence of a non-informative prior probability density. However, it is easy to prove non-informative prior PDFs to be of infinite number violating non-contradiction. Non-contradiction is one of the classical laws of thought.
Matt G says
“This link below shows the number of temperature profiles per month below 1000m.
http://www.cpc.ncep.noaa.gov/cgi-bin/godas_parameter.pl”
Sorry, but your link did not work for me — all I get is a blank page.
richardscourtney says:
“A variation of 0.8 degrees is NOT evidence that the system has changed because such variations have happened before.”
There are logic and symantic problems with this statement.
Logically, climate change doesn’t just happen. Climate changes when it’s caused to change. Energy is conserved. The climate system doesn’t warm of cool without causes.
Semantially, you use the word “variation.” That’s a synonym of “change.”
Beyond that, 0.8 C is about 1/10th the warming from a glacial to interglacial period. I think anyone would conclude that 10% of ice age is, indeed, a significant changes.
richardscourtney says:
“A variation of 0.8 degrees is NOT evidence that the system has changed because such variations have happened before.”.
..
Place an ice cube in a container in a -.0.2 degree C environment
Raise the environmental temp by 0.8 degrees C to +0.6 degrees.
…
The system will VISIBLY change, and I’m sure this sort of thing has “happened before”
Edward Richardson
August 25, 2014 at 2:52 pm
“I’d say there’s a slight acceleration.”
Cherry picked intervals of differing lengths, different measuring systems, no link provided. There is no observable acceleration.
Edward Richardson
August 25, 2014 at 3:14 pm
“You know, that old “dy/dx” first derivative.”
No, the old least squares numerical fit, which is an FIR filtering operation with greater rejection of higher frequency variability over longer timelines. Are you trying to fool us, or yourself?
Bart
August 25, 2014 at 4:32 pm
…
Today, sea level is rising at 3.2 mm/year
…
It wasn’t rising that fast in the 20th century.
In my most recent post, please change “is the use” to “is to the use” in the second sentence.
Edward Richardson
August 25, 2014 at 4:44 pm
“It wasn’t rising that fast in the 20th century.”
Yes, it was, at specific times over comparable timelines. Faster, in fact, at mid-century.
It has a significant cyclical component to it, just like global temperatures. You are comparing the result over an upswing of the cycle with a result over a longer interval which quashes the cycle. I say again, are you trying to fool us, or yourself?
Bart
August 25, 2014 at 4:53 pm
“in fact, at mid-century.”
…
However….in your own words…..
..
“Cherry picked intervals of differing lengths,”
Edward Richardson
August 25, 2014 at 5:07 pm
Hardly. Fixing it to look at comparable length intervals. Either get serious about this or go away.
SonicsGuy on August 25, 2014 at 4:27 pm
…
Logically, climate change doesn’t just happen. Climate changes when it’s caused to change. Energy is conserved. The climate system doesn’t warm of cool without causes.
Logically your statement means that you believe that Tung and Chen 2014 is wrong. This paper claims that multidecadal changes in ocean cold downwelling and other circulation processes can redistribute heat vertically in the ocean, leading to corresponding changes in global surface temperatures. Specifically they attribute the recent warming “pause” to a couple of decades of co2 warming being by coincidence exactly cancelled by equal cooling from ocean vertical mixing. Further, they show that vertical ocean mixing changes or oscillates on a multidecadal timescale, raising hopes that surface warming might resume within a decade or two.
How is it possible for you not to understand the implication of this? T&C2014 have shown correctly what has been know for decades, that varying patyerns of vertical ocean mixing can cause climate temperature variation or if you like “climate change” on decadal up to millenial timescales. Two key aspects of this ocean driven climate change are:
(1) It is NATURAL (dont you just love that word?!) not involving any human agency and
(2) It does not need any change in the total heat in the climate system (which means essentially in the ocean). That’s what redistribution means. There is enough heat in the oceans, combined with complex patterns of varying vertical mixing, to allow significant up and down swings in global temperature with ZERO CHANGE in the heat energy in the system.
(I’m not saying there is or can not be change in total energy – just that with the total amount of heat in the ocean such change would take some time. )
Now if one accepts this (i.e. accepts the discipline of oceanography), then, again, how is it possible for you not to see the implication that, under the dominant influence of ocean vertical mixing, climate can be expected to be always changing with no human influence and not requiring any change in ocean i. e. climate energy? In the light of this can you see what it looks like to say something like: “logically [sic] climate cannot change unless something forces it by changing the amount of heat in the system”. The implication being that that “something” can only be co2.
You cant have your cake and eat it.
Either accept T&C2014 that oceans can eat global warming, as the warmist media are doing who are crawling all over T&C2014, and accept the implication that continual climate change driven by vertical ocean mixing is normal, without the need for any change in total heat.
Or reject T&C2014 in order to be able to continue to make statements like the one quoted at the top that logically climate cant changed without an external thermal forcing.
Make your choice.
Bart
August 25, 2014 at 5:14 pm
….
” get serious about this”
…
Try this…
..
Historical data (in mm/yr)
SLR Err (years) References
2.8 ±0.8 1993-2009 Church & White (2011)
1.7 ±0.2 1900-2009 Church & White (2011)
1.9 ±0.4 1961-2009 Church & White (2011)
1.43 ±0.14 1881-1980 Barnett (1984)
2.27 ±0.23 1930-1980 Barnett (1984)
1.2 ±0.3 1880-1982 Gornitz and Lebedeff (1987)
2.4 ±0.9 1920-1970 Peltier and Tushingham (1989)
1.75 ±0.13 1900-1979 Trupin and Wahr (1990)
1.7 ±0.5 Nakiboglu and Lambeck (1991)
1.8 ±0.1 1880-1980 Douglas (1991)
1.62 ±0.38 1807-1988 Unal and Ghil (1995)
….
….
Current rates
Colorado Univ 3.2 ± 0.4 mm/yr
AVISO 3.3 ± 0.6 mm/yr
CSIRO 3.2 ± 0.4 mm/yr
NASA GSFC 3.2 ± 0.4 mm/yr
NOAA 3.2 ± 0.4 mm/yr
(ref http://sealevel.colorado.edu/ )
In studying control systems engineering, I’ve discovered the principle that the controllability of a system is dependent upon identification of that variable whose value is being controlled. In Mr. Richardson’s post of Aug. 25 at 6:51 pm he seems to favor regulation of the sea level. That’s a worthy candidate but for the fact that governments have already decided to regulate the global surface temperature. How to regulate the latter is a different problem than the one of how to regulate the former.
Edward Richardson on August 25, 2014 at 6:51 pm
Your “current” rates are inflated by two things, 1: recovery from La Nina and precipitation return to the sea, 2: yet another isostatic adjustment.
“Current” is too short and does not mean much. The reality shown by Envisat and other sources is decelerating sea level rise.
Nice try.
Well I agree, “heat” (noun) tends not to go into the oceans, except where it contacts land. “Heat” needs stuff, in order to propagate.
But solar spectrum radiant energy can penetrate to some depth in the oceans. My handy dandy Infrared Handbook (US Navy text) says the 1/e (37% t) depth for the solar spectrum peak (at sea level air mass 1.5) is 100 meters. So 99% attenuation in 500 meters.
BUT !! not ALL of that radiant energy gets wasted as heat throughout that depth. A whole lot of it turns into plankton, and fishes, and mammals too. So there is no missing heat, we never made it.
Now the atmospheric isotropic LWIR emissions can hit the ocean, but they all get absorbed in the top 50 microns ow water, not centimeters. So to a great extent, they just promote increased evaporation, and don’t really add much to the ocean heat. If anything, they are a negative feedback effect, because that puts more water into the atmosphere to stop more solar spectrum energy from reaching the ocean.
Why is this process not understood by everyone, and specially by those who actually work in the climate field. Well at least, they get grant money to work. So what are they learning, instead of ocean energy dynamics ??
phlogiston says:
“Specifically they attribute the recent warming “pause” to a couple of decades of co2 warming being by coincidence exactly cancelled by equal cooling from ocean vertical mixing.”
No, that’s wrong. The ocean isn’t cooling, it’s warming. It’s gaining heat. And some of that heat is going to depth. It’s quite a simple picture, really.
Terry Oldberg wrote:
“I think your reference is the use of paleoclimate data plus Bayesian parameter estimation in constructing a posterior probability density function over the climate sensitivity.”
No. I mean comparing the warming from temperature proxies to the GHG proxies.
You seem to believe science is done via strict logical rules. No one who has ever done any science thinks that.
SonicsGuy:
While “science” is not necessarily done via strict logical rules, it is possible to do so. When this is not done people unnecessarily starve, experience pain, die, lose their capital or suffer additional ghastly consequences. The ethical approach, then, is to follow strict logical rules in the performance of research. This is what I do despite pressure to do otherwise.
The statement that “there is almost no mixing and no vertical movement of water” is inconsistent with what is known as the meridional overturning circulation. This is driven by density differences governed by temperature AND salinity.
http://en.m.wikipedia.org/wiki/Thermohaline_circulation
http://news.nationalgeographic.com/news/2014/08/140821-global-warming-hiatus-climate-change-ocean-science/
“It’s important to note that a pause in rising temperatures doesn’t mean global warming isn’t happening, writes Gerald Meehl, a senior scientist at NCAR, in an email. “Global warming hasn’t stopped, it has temporarily shifted to the subsurface ocean,” says Meehl, who first proposed that the Atlantic Ocean was storing some of the missing heat.”
“The frightening part,” Tung says, is “it’s going to warm just as fast as the last three decades of the 20th century, which was the fastest warming we’ve seen.” Only now, we’ll be starting from a higher average surface temperature than before.”
The radiative imbalance is still showing that the climate system is adding more heat energy than it is losing. The ice mass at both poles are still diminishing without pause, and accelerating. When surface temperatures were adjusted for known natural processes like ENSO and volcanic activity in the last 30 years, there was no pause observed in the mean global temperature increase due to the GHG component. Now climate scientists are identifying the additional heat sinks through measurement.
It looks like the heat that did not influence the SAT in the last 15 years, went into the subsurface oceans and was expended in melting ice. There are economic consequences to melting ice. And these consequences are not based on the outcome of a semantic argument about what a ‘pause’ is. According to some, global warming ‘pauses’ every winter. It is not enough to assert that the increasing global heat (in ocean or in air) is part of a ‘natural’ cycle unless that cycle or forcing is characterized, quantified and compared to GHG forcing.
For the above reasons, I am not yet persuaded that anthropogenic global warming has ceased because its effects are still measured and there is no indication of reversal. I challenge anyone to refute any of the claims without an ad hominem, speculative or conspiracist response.
Matt G wrote:
“Notice the oceans should have 2.45 times more temperature profiles, just to have an equal coverage of observations.”
There’s no “should” — only what’s been and the associated uncertainties. Water temperatures are much more stable than air temperatures — the latter varies greatly every day, with every burst of wind, with every season. The ocean does not.
Climate science isn’t an experimental science. So scientists take the data they can get, which is never what they want, and do the best they can with it. So they include uncertainties with every calculation. If you look at graph 6 (with error bars) on this page
http://www.nodc.noaa.gov/OC5/3M_HEAT_CONTENT/index1.html
you see that the error bars are substantial, especially before 1990, when they reach 50% and more.
Scientists have spent an enormous amount of time and effort gathering ocean data and documenting its quality:
NOAA Atlas NESDIS 72
WORLD OCEAN DATABASE 2013
http://data.nodc.noaa.gov/woa/WOD/DOC/wod_intro.pdf
Terry Oldberg says:
“While “science” is not necessarily done via strict logical rules, it is possible to do so.”
No it is not — the proof being that no no one has ever done it. Science is done by people, who advance it any way they can — guessing, borrowing ideas, trying every angle until something works. Logic has a role, but it’s hardly a governing one. As Paul Feyerabend wrote, ” Science is an essentially anarchic enterprise: theoretical anarchism is more humanitarian and more likely to encourage progress than its law-and-order alternatives.”
“When this is not done people unnecessarily starve, experience pain, die, lose their capital or suffer additional ghastly consequences.”
No, they don’t — it is, in fact, science — done imperfectly, helter skelter, scientists clawing their way forward by any possible means — that has fed the billions of people in the world for about two centuries now, and especially in the last century. And will in this one. The Green Revolution didn’t come about by applying laws of logic — it came about by enormous trial and error, accidental discoveries, hunches, tricks, and plain hard work. Some logic, once the rules were deduced, but not so much, really — and it usually comes after the discovery, not before it.
“The ethical approach, then, is to follow strict logical rules in the performance of research.”
That’s absurd. Ethics is not limited to logic — Max Planck was completely ethical when he came up with the Planck Law, but his method wasn’t logic — he guessed. Neils Bohr was ethical when he made up the Bohr model, taking a guess at the structure of the atom. (He was wrong, but it was still a very good guess, and an advancement.) Pauli made up spin, but not by logic — he just took a guess about a fourth quantum number, and only then used logic and rationality to see its consequences — and a lot of intuition, too. But certainly not the type of logic you’re trying to throw around here.
SonicsGuy:
Thank you for taking the time to respond. In the articles at http://judithcurry.com/2010/11/22/principles-of-reasoning-part-i-abstraction/, http://judithcurry.com/2010/11/25/the-principles-of-reasoning-part-ii-solving-the-problem-of-induction/ and http://judithcurry.com/2011/02/15/the-principles-of-reasoning-part-iii-logic-and-climatology/ I argue to the contrary that science has sometimes been done by logical rules. Usually it has not been done in this way but rather by the use of heuristics replacing logical rules.
SonicsGuy:
Thank you for your reponse of Aug. 25 at 8:18 pm. I’m unclear on how one would compare the warming from temperature proxies to the GHG proxies or the relevance of said comparison. Please clarify.
SonicsGuy August 25, 2014 at 8:14 pm
phlogiston says:
“Specifically they attribute the recent warming “pause” to a couple of decades of co2 warming being by coincidence exactly cancelled by equal cooling from ocean vertical mixing.”
No, that’s wrong. The ocean isn’t cooling, it’s warming. It’s gaining heat. And some of that heat is going to depth. It’s quite a simple picture, really.
Please try to get the point – ocean “forcing” of climate is from redistribution. The ocean as a whole can be (slowly) warming or cooling or staying the same, its not important. Climate warming from the ocean does not require the ocean as a whole to be warming. Likewise for cooling.
And if you accept T&C2014 (their plagiarism of established oceanography) then the argument “nothing else we can think of can change the climate except co2” goes out of the window.
Think about the ocean.
katatetorihanzo August 25, 2014 at 8:30 pm
The statement that “there is almost no mixing and no vertical movement of water” is inconsistent with what is known as the meridional overturning circulation. This is driven by density differences governed by temperature AND salinity…
The statement is more than “inconsistent”, it is nonsense. Where there is no vertical mixing in the ocean, the bottom becomes anoxic. This happens in the Black sea and is why it has this name. But in most of the open ocean there is oxygen at depth originating from the surface.
Edward Richardson says:
Also, the word “unprecedented” is not a part of the Null Hypothesis.
ER, Richard Courtney knows what the Null Hypothesis says, and what it does. From your comment, it is clear that you don’t.
++++++++++++++++++++++++++++++
phlogiston:
Hanzo argues incessantly without saying anything of value. I thought we were finally rid of his nitpicking, but he’s back again. Hanzo is a true believer in runaway global warming, and he actually believes it is happening right now. Yes, this very minute. And of course, he totally believes that humans are the reason. All his arguments are his attempt to support that preconceived conclusion. Typically, he cites NatGeo as his authority; a pop picture book source. And Wikipedia. SkS will probably be next.
++++++++++++++++++++++++++++++
SonicsGuy,
I’ve tried to follow, but it seems you are just arguing for the sake of arguing. If you believe that NOAA is “quality”, you must be new here.
dbstealey on August 25, 2014 at 11:38 pm
Thanks for the heads-up on Hanzo. I just jumped in regarding a single comment.
My other posts here make a point about the null hypothesis of normative climate change. Essentially, Tung and Chen 2014 is a massive own goal in the net of team AGW. In making a flimsy and unconvincing excuse for the warming “pause” they unwittingly provide rock solid support for the null hypothesis that chaotic nonlinear climate is always changing. They supply a convincing mechanism in ocean vertical mixing and periodic oscillatory changes and corresponding variation in delivery of deep cold to the surface.
b fagan says:
The greenhouse effect is well understood, proven, and has been observed on Earth as well as on Venus, Mars and Titan.
Then why isn’t Mars experiencing runaway global warming? It’s atmosphere is well over 95% CO2.
When the predictions of runaway global warming collide with reality, they crash and burn. Do you think the reason in this case might be because planets are not closed greenhouses?
The earth’s atmosphere is only .04% CO2, not 95%. The concentration of that harmless trace gas has risen from about 3 parts in 10,000, to only about 4 parts in 10,000, in a century and a half. That minuscule change is what the alarmist crowd is hanging their hats on. Skeptics are amused at that.
There is nothing unusual or unprecedented happening with global temperatures, which have been both higher and lower before, without any regard to CO2 levels. The extremely minor, ≈0.07ºC fluctuation in T, over the past 150 years, is supposed to be some sort of “proof” that we face runaway global warming? Honestly, doesn’t that sound silly?
++++++++++++++++++++++++++
phlogiston,
Hanzo is riding the climate scare gravy train. His income depends on keeping the populace alarmed, and he will often argue non-stop using the most discredited sources. The one source he will not use is the real world, which contradicts his belief system.
When alarmists start making up excuses for the flat global average temperature trend, you know they are making it all up as they go along.
Why?
Remember the 2007 IPCC 4th Assessment Report? Around the world it was hailed as “the gold standard in climate science” based solely on peer-reviewed science (except that that was a lie)… the settled science… incontrovertible… indisputable. Funny how that report never covered the scenario of a flat temperature trend despite rising CO2 emissions! In effect, AR4 is now obsolete!
b fagan’
I have posted multiple links to charts showing no change in ocean pH. Here is just one example:
http://sanctuarymonitoring.org/regional_docs/monitoring_projects/100240_167.pdf
This should help:
http://wattsupwiththat.com/2011/01/10/ocean-acidification-chicken-of-the-sea-little-strikes-again/#more-31112
The “acidification” scare is baseless. CO2 has been up to twenty times [20X] higher in the past, without ocean pH being affected due to the oceans’ immense buffering capacity.
Relax, there is nothing to worry about. pH isn’t gonna getcha.
dbstealey – you ask why Mars isn’t having a runaway greenhouse effect, with a 95% CO2 atmosphere. The quick answer is because it isn’t as close to the sun as Venus, and has a far smaller atmosphere, since Mars doesn’t way nearly as much as Earth or Venus.
But read this paper from one of the experts and you’ll know much more about the subject than now.
The paper is “Infrared Radiation and Planetary Temperature” by Ray Pierrehumbert in Physics Today from 2011. http://geosci.uchicago.edu/~rtp1/papers/PhysTodayRT2011.pdf
And no climate scientist is predicting a runaway greenhouse effect here – they are predicting a greenhouse effect that matches the amount of greenhouse gases released, and we simply won’t be burning enough fuel to start a true runaway greenhouse.
They are also predicting warming lower than the Paleocene–Eocene Thermal Maximum, which is a very good thing. And the temperatures during the PETM are based on greenhouse gases.
Your comment about “The earth’s atmosphere is only .04% CO2, not 95%. The concentration of that harmless trace gas has risen from about 3 parts in 10,000, to only about 4 parts in 10,000, in a century and a half. That minuscule change is what the alarmist crowd is hanging their hats on. Skeptics are amused at that.”
No, people who confuse amount with effect are amused by that. All the plants on the planet are alive because of that minuscule amount of a silly gas. The Earth is 33C warmer than it would be because the persistent greenhouse gases keep water vapor cycling back into the atmosphere – otherwise it falls from the sky within weeks. People get jailed for drunk driving because of a minuscule amount of alcohol in their bodies. Certain chemicals are toxic at far lower concentrations than that.
Read the Pierrehumbert paper. He literally wrote the book on planetary atmospheres – well, one of them: “Principles of Planetary Climate”.
Friends:
The trolls have been very busy overnight. Much of their tripe has been answered by others. However, I answer two of them as a method to demonstrate how disingenuous and/or misguided they are.
Fitstly, SonicsGuy writes at August 25, 2014 at 4:27 pm saying in total
Oh dear!
SonicsGuy, either you are full of cr@p or you are deliberately providing falsehoods.
The “logic and symantic (sic) problems” are entirely yours!
Clearly, you don’t know what climate is!
The UN Intergovernmental Panel on Climate Change (IPCC) defines “climate” in its Glossary which is here. The definition is
There cannot be “average weather” if weather does not vary.
There cannot be a “statistical description in terms of the mean and variability of relevant quantities over a period of time” if weather does not vary.
And, importantly, “Climate in a wider sense is the state, including a statistical description, of the climate system.”
Variation of the weather occurs within the climate system. Temperature variation is one of the parameters which is statistically described to define the climate system. A change to the system would be indicated by temperature variation (n.b. NOT temperature) changing by more than its previous variations.
I said and you have quoted me having said of the climate system
“A variation of 0.8 degrees is NOT evidence that the system has changed because such variations have happened before.”
That is true and it is completely consistent with the definitions of climate and of the climate system of the holocene.
You are being disingenuous when you conflate temperature “variation” with “change” to the range of temperature variation.
And your entire argument is false because it is built on a set of falsehoods which lead to your saying
“Beyond that, 0.8 C is about 1/10th the warming from a glacial to interglacial period. I think anyone would conclude that 10% of ice age is, indeed, a significant changes.”
NO! Only someone who knows nothing about climate and climate change could or would think and/or conclude such ridiculous nonsense!
And then we have b fagan at August 26, 2014 at 12:28 am.
b fagan, your first post was addressed to me and consisted entirely of untrue talking points derived from some unstated warmunist briefing note. I rebutted that twaddle in my reply at August 25, 2014 at 2:59 pm. Your response to my careful explanation is a ‘fingers in the ears’ rejection which is summed up by your saying
Yes, b fagan, I said that in my post you think you have answered. It would help if you were to open your mind to reality because then reality will crowd-out the untrue warmunist talking points which now fill your brain.
Richard
b fagan August 26, 2014 at 12:28 am
Richard, your reply to me was full of words, but little that bears reply. We have measures of fossil fuel extraction – recorded in the books of the energy companies. We know how much CO2 is produced per unit of fuel burned. We have recordings since 1958 of increasing CO2 in the atmosphere, declining pH of ocean surface waters as they absorb CO2, and the amounts add up to what we see dug from the ground, when you allow for increased plant growth absorbing a bit of the remainder.
We have measurements of declining concentrations of atmospheric oxygen which are consistent with the amount of carbon burned in our fossil fuels.
In the light of palaeo climate and atmospheric data this alarmist CO2 narrative is impossible. Corals and bryozoans supposedly sensitive to CO2 acidification evolved during the Cambrian-Ordovician during which CO2 was at 3000-10000 ppm. Later during the Carboniferous CO2 levels, lower but still higher than today were accompanied by oxygen levels higher than today, not lower, as evidenced by supersize insects impossible in today’s 20% O2. For most of the Phanerozoic epoch of multicellular life co2 has been much higher than today with the biosphere in rude health and no sign of stress to the oceans (except during extinction events caused by bolides, flood basalts etc which oddly were followed not by runaway change but a reversion to life-supporting conditions).
If the total CO2 in the atmosphere were added to the oceans it would lower the ocean CO2 concentration by only 1ppm.
What planet are you on?
If the ocean is absorbing CO2 from the atmosphere, why is the concentration of CO2 near the surface, lower than that at depths? Sure, solubility is higher in deep cold water but how does it get there, if it is being removed progressively by marine organisms?
katatetorihanzo:
I write to ask a genuine and serious question.
In your post at August 25, 2014 at 8:30 pm you assert
No. In reality ice mass is increasing.
And you assert
Now that is pseudoscience at its finest!
Any data can be “adjusted” to show anything, and some charlatan has adjusted the surface temperature data to indicate what s/he wants. And you claim to be impressed by that!
You add similar nonsense then conclude saying
So, my question is;
Who supplies you and the others with the nonsense which you spout?
Richard
Richard, in your reply to katatetorihanzo I quote you, your pasted quote from him, and your reply:
“In your post at August 25, 2014 at 8:30 pm you assert
The ice mass at both poles are still diminishing without pause, and accelerating.
No. In reality ice mass is increasing.”
I believe that katetetorihanzo was referring to ice mass on the Antarctic Ice Sheet, which is measurably losing mass. He could also be talking about Arctic sea ice, or ice mass on the Greenland Ice Sheet, or on glaciers around the world. Ice sheets, glaciers and Arctic sea ice are declining globally. .
You ask where people who read science get their information – I’ll ask you please to also provide links to where you get yours, and blog posts are not accepted. Peer reviewed literature please, or centers where the observations are made.
First, the Antarctic and Greenland ice sheets losing mass. Here’s a recent research article for reference and a quote from the extract.
“A Reconciled Estimate of Ice-Sheet Mass Balance”
Science 30 November 2012: DOI: 10.1126/science.1228102
http://www.sciencemag.org/content/338/6111/1183.abstract
“Between 1992 and 2011, the ice sheets of Greenland, East Antarctica, West Antarctica, and the Antarctic Peninsula changed in mass by –142 ± 49, +14 ± 43, –65 ± 26, and –20 ± 14 gigatonnes year−1, respectively. Since 1992, the polar ice sheets have contributed, on average, 0.59 ± 0.20 millimeter year−1 to the rate of global sea-level rise.”
And sea ice. The National Snow and Ice Data center tracks sea ice extents in Arctic Ocean and around the Antarctic continent. http://nsidc.org/cryosphere/sotc/sea_ice.html – the page shows Arctic and Antarctic ea ice trends.
As they point out, the trend in decline in the Arctic is steeper than the trend in increasing Antarctic sea ice.
This matters because the declining ice extent during Arctic summers allows even more sunlight into the Arctic and surrounding waters, further increasing the warming, reducing ice, reducing albedo in a feedback loop. So opening the Arctic waters during the sunlit months is a positive feedback speeding the warming.
It also matters because even while sea ice is increasing around the Antarctic continent, the ice sheet on Antarctica itself is losing mass, which increases sea level.
Glaciers are generally shrinking, too. Another report from Science: “A Reconciled Estimate of Glacier Contributions to Sea Level Rise: 2003 to 2009”
Science 17 May 2013: DOI: 10.1126/science.1234532
http://www.sciencemag.org/content/340/6134/852.abstract
“Glaciers distinct from the Greenland and Antarctic Ice Sheets are losing large amounts of water to the world’s oceans. However, estimates of their contribution to sea level rise disagree. We provide a consensus estimate by standardizing existing, and creating new, mass-budget estimates from satellite gravimetry and altimetry and from local glaciological records. In many regions, local measurements are more negative than satellite-based estimates. All regions lost mass during 2003–2009, with the largest losses from Arctic Canada, Alaska, coastal Greenland, the southern Andes, and high-mountain Asia, but there was little loss from glaciers in Antarctica. Over this period, the global mass budget was –259 ± 28 gigatons per year, equivalent to the combined loss from both ice sheets and accounting for 29 ± 13% of the observed sea level rise.”
You can provide your science references if you want, here’s a Google Scholar search for you to help. Term is “global ice mass trend” and search is from 2010 to now.
http://scholar.google.com/scholar?as_ylo=2010&q=global+ice+mass+trend&hl=en&as_sdt=1,11
The Princeton Primers in Climate is a good book series on various aspects of how the climate works. Check them here http://press.princeton.edu/catalogs/series/ppic.html
Note from the titles that they don’t make scary “the end is near” noises. They are reviews of the science by experts. As I’ve told others, the warming and declining ocean pH are completely natural responses due to a sudden increase in atmospheric CO2. Doesn’t matter how the stuff got there – the planet is just going to respond according to the laws of nature.
I have work to do so can’t spend more time here. Read the books and links referenced above.
richardscourtney on August 26, 2014 at 2:35 am asks
katatetorihanzo:
“I write to ask a genuine and serious question…
Who supplies you and the others with the nonsense which you spout?”
ICE MASS LOSS:
With regard to accelerated global ice mass loss, I am persuaded by the GRACE satellite data which quantifies the mass (not ‘extent’ or area) of ice loss, with error bars, over the last 20 years during the so called ‘hiatus’. I am also persuaded by the number of consistent studies, all showing similar down trends, performed at 26 different labs.
“GRACE” are two satellites that detect mass changes by measuring the pull of Earth gravity and how it changes over time. It measures ice build up and ice mass declines.
QUANTIFIABLE:
I’m further persuaded when I see numbers rather than qualitative statements. “In Greenland, the ice mass loss increased from 137 Gt/yr in 2002–2003 to 286 Gt/yr in 2007–2009, i.e., an acceleration of −30 ± 11 Gt/yr2 in 2002–2009.
In Antarctica the ice mass loss increased from 104 Gt/yr in 2002–2006 to 246 Gt/yr in 2006–2009, i.e., an acceleration of −26 ± 14 Gt/yr2 in 2002–2009.”
Source: http://onlinelibrary.wiley.com/doi/10.1029/2009GL040222/abstract;jsessionid=5CC63C213C94CF82C29D3519069FF8C7.f03t03
More recent (2011) http://www.nasa.gov/mission_pages/Grace/news/grace20121129.html#.U7y-ZGt5mSN
REPRODUCIBLE:
I’m persuaded when I see multiple studies giving the same result. “In a landmark study published… in the journal Science, 47 researchers from 26 laboratories report the combined rate of melting for the ice sheets covering Greenland and Antarctica has increased during the last 20 years.”
UNCOMPLICATED:
Here is a great visualization of global ice mass loss:
Yellow represents mountain glaciers and ice caps
Blue represents areas losing ice mass
Red represents areas gaining ice mass
Source: http://www.youtube.com/watch?v=oGnM75T6iaE
All of the above is inconsistent with this assertion: “No. In reality ice mass is increasing.”
MASS IS NOT THE SAME AS EXTENT:
The only data cited to support the claim of increased global ice mass is the observation of increased sea area extent in Antarctica over 2.7 years (1000 days).
Sea ice extent: http://wattsupwiththat.com/2014/08/22/antarctic-sea-ice-has-been-above-average-for-1000-straight-days/”
Respectfully, I feel like I need to bring clarity to the distinction between “sea ice extent” and the declining ice mass trend as measured gravimetrically by GRACE satellites.
Sea ice extent is an area measurement (‘spread’), not a mass measurement. Consider, which is more money: A small pile of $1000 bills on your kitchen floor or the same floor covered with $100 worth of $1 bills?
Increasing the ‘spread’ with ever thinning ice whose extent is greatest in the Antarctic winter (minimum solar) is less important than the impact of increased solar energy absorption in increasing areas of ice-free Arctic ocean in the summer (max solar).
Source: http://www.youtube.com/watch?v=MPnj9eR7t0g
DECONVOLUTION:
When I asserted… “When surface temperatures were adjusted for known natural processes like ENSO and volcanic activity in the last 30 years, there was no pause observed in the mean global temperature increase due to the GHG component.”
…The refutation appeared to criticize the inappropriate use of “adjusted” data. In this context, “adjusted” refers to removing the effect of variation from known natural sources (ENSO, solar, volcanic aerosols) to better reveal the magnitude of ‘unnatural’ sources of temperature variation if present. The null hypothesis here is that natural sources of variation trump any anthropogenic variation. The approach is illustrated here and it is not unconventional.
GREENHOUSE EFFECT AND MARS
As for Mars, we inappropriately oversimplify the greenhouse effect with statements such as “∆T is the cause of ∆CO2” or vice versa. Temperature on Mars is not governed by solely by its proportion in the atmosphere but rather by the magnitude of the flux of incoming solar radiation (minus reflection) compared with the flux of outgoing IR radiation. The latter is impacted by the concentration of GHG. On Mars the concentration of CO2 is very low because the atmosphere is too thin (due to low gravity). Also dust storms impact the albedo and there’s no significant water vapor feedback. In other words, Mars is a terrible control experiment for the cause of the radiative imbalance seen on Earth.
As always, I challenge anyone to refute any of the claims above without ad hominem, speculative or conspiracist ideation.
Dr Burns:
At August 26, 2014 at 2:27 am you ask
I answer the CO2 is delivered to deep ocean from above and from below.
FROM ABOVE
CO2 is net flowing from the air into the ocean surface layer and then exchanges with the deep ocean.
FROM BELOW
CO2 is injected directly into the deep ocean by undersea volcanism.
So very little is known and understood about the carbon cycle that neither process is quantified and cannot be estimated.
Richard
b fagan,
I like how you get to have it both ways. Mars is farther from the sun, so it is colder.
If that negates the effect of all-powerful CO2, then the 95% CO2 atmosphere of Mars doesn’t really have any warming effect to speak of. So which is it? In reality, Mars’ distance from the sun fully explains its colder temperature.
Next, CO2 may have some minuscule effect, possibly even as much as 1ºC per doubling. But that truly is minuscule, because it is too small to even measure with current technology.
Stick around here for a while, instead of wasting your time at your usual alarmist blogs. You will learn worthwhile facts here. All you will ‘learn’ at alarmist blogs is misinformation, because they are political propaganda blogs, not science sites like WUWT.
You will learn here that globbal warming stopped, many years ago. That fact alone debunks the “carbon” scare. The incessant predictions were that runaway global warming would continue until there was a climate catastrophe. But when that didn’t happen, the predictions stopped. Now, the alarmist crowd is backing and filling, tapdancing around with words like “pause” and “hiatus”. All those words mean is that global warming has stopped. At last count, they were up to 38 excuses as to why global warming has stopped.
Next, you are correct that all the plants are alive because of that tiny, beneficial trace gas. But you do not go far enough: CO2 is harmless, and it is beneficial to the biosphere. More CO2 is better, at current and projected concentrations. The “carbon” scare is preposterous nonsense. CO2 has been far higher in the past, during times when the biosphere thrived with life and diversity. All of the great extinction events took place during cold episodes. In fact, global T is lower now that the planet’s long term average. It has often been substabntially warmer, with no ill effects. Therefore, the arm-waving over the completely arbitrary 2º rise is nonsense. If global T rose by 2º, immense areas would be opened to farming, like Canada, Mongolia, Alaska and Siberia. A warmer world is a healtier world. And global warming raises low temperatures — it does not raise high temperatures higher. It warms at the higher latitudes, not at the equator. And it warms nights more than days. All net benefits. What’s not to like?
Finally, the climate null hypothesis has never been falsified. That means that everything currently being observed has happened before, and to a greater degree. Current climate parameters were all exceeded in the past. We have actually been living in a true “Goldilocks” climate for the past century and a half, and all the ridiculous Chicken Little clucking over a few tenths of a degree fluctuation is ridiculous nonsense. Honestly, we have never had it so good as a species. Leave it to the wild-eyed climate alarmist crowd to make a full glass half empty.
See? You are already learning some new facts. Stick around, and you will eventually conclude that you have been lied to. There is nothing wrong with more CO2, and all the scare stories are just that. It isn’t news to point out that nothing unusual or unprecedented is happening. The ‘news’ that sells advertising is news of looming catastrophes. But after a while, folks get tired of the incessant cries of “Wolf!!”
There is no runaway global warming wolf. And there never was one. It was always a false alarm.
richardscourtney
August 26, 2014 at 2:35 am
…
“No. In reality ice mass is increasing.”
…
That is false.
Sea levels continue to rise at > 3 mm/yr.
…
Half the rise is from melting ice.
Half the rise is from thermal expansion.
dbstealey
August 25, 2014 at 11:38 pm
…
“From your comment, it is clear that you don’t.”
Could you please cite a reference where the word “unprecedented” is a required part of the Null Hypothesis?
Edward Richardson:
I see you continue your campaign of disinformation and distraction.
For example, at August 26, 2014 at 7:06 am you ask dbstealey
Before he does, could you please justify your question by citing any reference where anybody claimed it is?
You see, Edward Richardson, I think this is another of your red herrings which attempts to distract from the subject of the thread.
Richard
Edward Richardson:
At August 26, 2014 at 6:59 am you provide yet more disinformation when you write
No. Total ice mass is increasing.
The Antarctic contains 90% of all the ice on Earth which continues to grow; see here.
Please provide references to substantiate your assertions when you make them because they are usually absurd.
Richard
dbstealey says:
“Then why isn’t Mars experiencing runaway global warming? It’s atmosphere is well over 95% CO2.”
The absence of pressure broadening of CO2’s spectral lines.
@richardscourtney:
No comments on http://wattsupwiththat.com/2014/08/24/missing-heat-in-the-atlantic-it-doesnt-work-like-that/#comment-1717630 ?
richardscourtney
August 26, 2014 at 8:48 am
..
“No. Total ice mass is increasing.”
…
False.
Sea levels are continuing to rise at 3 mm/yr.
Half of sea level rise is due to melting ice.
Richardscourtney wrote:
“The Antarctic contains 90% of all the ice on Earth which continues to grow; see here.”
Sorry, but no.
Antarctic land ice: -159 Gt/yr
McMillan et al: GRL (2014): http://onlinelibrary.wiley.com/doi/10.1002/2014GL060111/abstract
Antarctic sea ice: +26 Gt/yr
Holland et al, J Climate (2014): http://journals.ametsoc.org/doi/abs/10.1175/JCLI-D-13-00301.1?af=R
Sonicsguy,
Yes, pressure broadening exists on Venus, but it is far too small of an effect to explain away the fact that Venus is near the sun and thus hot, and Mars is farther from the sun, and thus cold.
Not only that. It has been proven beyond doubt that changes in global temperature [T] are the cause of subsequent changes in CO2. There is no longer any doubt about that:
∆T causes ∆CO2
This is seen on all time scales from years, to hundreds of millennia [charts on request]. However, there is no comparable data or charts showing that changes in CO2 cause subsequent changes in T.
What would your conclusion be to those facts? Would you conclude that the alarmist crowd got its causation backward? Or would your response be the usual warmist reaction?
When facts that you are aware of change, the best course of action is to do what a scientific skeptic would do: change your mind. Arguing is just digging a deeper hole.
From the beginning the narrative has been that rising CO2 would cause runaway global warming leading to climate catastrophe. Now it turns out that T is the forcing, not CO2. Change your mind? Or dig?
@ dbstealey: August 26, 2014 at 3:41 am
“It warms at the higher latitudes, not at the equator. And it warms nights more than days. All net benefits. What’s not to like?”
——————-
Right you are, dbstealey.
And there in the above is the “secret” that defines and/or explains all of the hyped and touted CAGW “junk science” claims about the ….. “increases in ‘average’ monthly/yearly near-surface air temperatures”.
The “average number” of a number “set” will decrease if any number in the “set” decreases.
And, conversely, the “average number” of a number “set” will increase if any number in the “set” increases
But, an increase in the “average number” of a number “set” does not mean that the highest number in the “set” was the one that increased.
Therefore, the calculated “average increase” in near-surface air temperatures does not mean, nor prove without a doubt, that the highest number in the near-surface air temperature number “set” is increasing and/or getting “hotter”. Does not prove, suggest, infer or imply that the average increase in CO2 ppm is causing said near-surface air temperatures to get “hotter”.
But the “warmer” night time and winter temperature(s) does mean, …. and does prove, …. that the average near-surface air temperatures will and/or have been increasing.
The Laws of Mathematics dictates said will occur. And all “average numbers” are abstract numbers and therefore have no physical quantative value and thus are only useful as reference information..
dbstealey
August 26, 2014 at 9:21 am
…
“∆T causes ∆CO2”
…
FALSE
…
Proof? 17 years of no increase of surface temperature, but CO2 has risen in the 17 year time span.
@ Edward Richardson: August 26, 2014 at 9:27 am
““∆T causes ∆CO2″
…
FALSE
…
Proof? 17 years of no increase of surface temperature, but CO2 has risen in the 17 year time span.”
—————
Firstly, Edward R, you really should read and try to understand Henry’s Law which defines the fact that …. “∆T causes ∆CO2″, …. or the ingassing/outgassing of CO2.
REF: http://butane.chem.uiuc.edu/pshapley/GenChem1/L23/web-L23.pdf
Also read up on the outgassing of CO2 via microbial decomposition (rotting/decaying) of dead biomass when surface temperatures are above 60 degrees F.
And secondly, the average temperature of the ocean has been increasing for the past 200+ years …. so it matters not that the near-surface air temperatures have not risen in the past 17 years. As long as the ocean water is “warming” then the outgassing of CO2 from the ocean will continue. And IT IS still “warming”, to wit:
http://www.realclimate.org/index.php/archives/2013/09/what-ocean-heating-reveals-about-global-warming/
Edward Richardson,
You dismiss empirical evidence with a one-word throwaway: “FALSE” ??
Then you fit this meme.
Your objection is very simple to explain. I’ve done it many times:
Changes in temperature cause changes in CO2. This happens on all time scales, from years, to hundreds of millennia.
The proof is irrefutable: ∆T causes ∆CO2. The reverse may be true to a small extent… but where are the charts?
I have been looking for years for comparable charts, showing that a rise in CO2 is the cause of a later rise in T. They don’t seem to exist. All we find are simple overlays of temperature and CO2. But those do not show causation.
Either produce charts showing that ∆CO2 is the cause of ∆T, or face facts: the alarmist crowd got causation wrong from the get-go.
Personally, I don’t think you can face those facts. Show me I’m wrong.
Edward Richardson
August 25, 2014 at 6:51 pm
You don’t get it. You must use the same time interval for each slope estimate, or you are comparing apples and tennis balls. When you do that, you find that sea level rise is cyclical, and it has been just as high in the past as it has been recently. In fact, it is currently decelerating, when the “ocean ate my heat” excuse should produce acceleration.
katatetorihanzo
August 25, 2014 at 8:30 pm
Vertical mixing via the mechanisms you cite is in specific locales, and takes place over centuries, not decades. This is not the mixing you are looking for. Move along.
b fagan
August 26, 2014 at 12:28 am
“We know how much CO2 is produced per unit of fuel burned. We have recordings since 1958 of increasing CO2 in the atmosphere, declining pH of ocean surface waters as they absorb CO2, and the amounts add up to what we see dug from the ground, when you allow for increased plant growth absorbing a bit of the remainder.”
What we actually have is accelerating emissions, and non-accelerating concentration. The two are diverging from their superficial resemblance. Instead, the atmospheric concentration is tracking integrated temperatures, with the agreement especially stark in the rate of change.
Given that relationship, it is impossible for CO2 to surface temperature sensitivity to be significantly greater than zero.
The AGW hypothesis is not “robust”. Not if you are willing to open your eyes to countervailing evidence. You find then that the whole brouhaha is an exercise in confirmation bias and fear mongering.
dbstealey
August 26, 2014 at 9:44 am
…
“on all time scales”
Something else besides ∆T causes CO2 to increase.
…
The past 17 years proves it.
Edward Richardson
August 26, 2014 at 9:27 am
“Proof? 17 years of no increase of surface temperature, but CO2 has risen in the 17 year time span.”
It is an integral relationship. Your “proof” fails. More on this in another comment yet to appear.
Bart
August 26, 2014 at 9:48 am
“Your “proof” fails.”
…
Are you admitting that the surface temperatures have risen in the past 17 years?
Edward Richardson
August 26, 2014 at 9:55 am
No. You don’t know math, do you?
Bart
August 26, 2014 at 10:05 am
…
“No”
…
So, you admit that temps have NOT risen in the past 17 years.
But CO2 has risen from 365 ppm to 400 ppm in the 17 years. (10%)
…
These facts prove that something other than ∆T is causing CO2 levels to increase.
Edward Richardson says:
“Something else besides ∆T causes CO2 to increase.”
‘Something else’?? What else? *Facepalm* A baseless conjecture like that does not support your argument.
I showed you real world evidence proving that changes in CO2 follow changes in temperature!
Your response indicates quite clearly that you have already arrived at your conclusion, and no evidence, no matter how compelling, can possibly penetrate your confirmation bias. Your mind is made up and closed to any new information.
You are a classic example of Al Gore’s acolytes: due to your religious belief, any facts that contradict your world view must be promptly rejected.
An honest skeptic will accept evidence that contradicts what he believes. Based on convincing new evidence, the skeptic will then change his mind. That exemplifies the central difference between climate alarmists and scientific skeptics: alarmists have already made up their minds. Contrary facts only get in the way. If it were not for cognitive dissonance, the alarmist’s head would explode from the contradiction.
Wake up, Edward! You have been provided with useful knowledge. Either use it to form a correct world view, or keep digging your hole deeper. The choice is yours, and the facts are clear:
Changes in CO2 result from temperature changes. <–that is irrefutible proof. Thus, the basis of climate alarmism is debunked: “carbon” will not cause runaway global warming. Accept it, or continue down the path of ignorance. Your choice.
Edward Richardson
August 26, 2014 at 10:10 am
It is futile arguing with someone who lacks the basic knowledge to understand the argument. Take a course in calculus, and then we can talk.
dbstealey
August 26, 2014 at 10:13 am
“I showed you real world evidence proving that changes in CO2 follow changes in temperature! ”
…
And I showed you real world evidence proving that changes in CO2 follow NO CHANGE in temperature
SonicsGuy:
At August 26, 2014 at 9:11 am you ask me
Of course not!
It is too stupid to deserve a reply, and any comment may spoil the enjoyment of others laughing at it.
Global warming is and always has been an increase in global average surface temperature anomaly (GASTA).
Richard
Edward Richardson:
At August 26, 2014 at 10:18 am
No! That is yet another of your falsehoods.
dbstealey is right and you are wrong.
GASTA has been rising with interruptions from the Little Ice Age.
The most recent period of warming ended about 17 years ago.
The present rise in atmospheric CO2 concentration is after that rise in temperature.
Some processes of the carbon cycle have rate constants of years and decades and the ice core data suggests also centuries.
Richard
richardscourtney
August 26, 2014 at 10:26 am
..
“dbstealey is right”
…
No, dbstealy posted, “This is seen on all time scales from years, ”
…
However, it is certainly not seen in the past 17 years, so he is wrong.
Edward Richardson:
I see you have reverted to the deliberately obtuse ploy in your post at August 26, 2014 at 10:30 am. Andf you again do it by misquotation.
NO! YOU KNOW WHAT HE DID SAY BECAUSE YOU QUOTED PART OF IT.
In reality, at August 26, 2014 at 9:44 am dbstealy posted saying to you
“ALL TIME SCALES”, Edward Richardson, “ALL TIME SCALES”!
So, as you know and I said, you are wrong and he is right.
Richard
Edward Richardson says:
I showed you real world evidence proving that changes in CO2 follow NO CHANGE in temperature
That is crazy talk, Edward. I have dropped a mountain of empirical evidence at your feet, and you give your usual response. Your typical argument is: Say anything.
The alarmist contingent is turning reality upside down, as usual. The incessant drumbeat of the alarmist crowd has always been that rising CO2 would cause rising global temperatures. We were constantly told that would happen.
But now that their central prediction has been falsified by Planet Earth, their argument becomes:
Are you admitting that the surface temperatures have risen in the past 17 years?… So, you admit that temps have NOT risen in the past 17 years.
So now we are told by Edward that CO2 is not the cause of rising T, after all!
There is no ‘admitting’ that global warming has stopped, Edward. It is a fact. Therefore, the endless predictions that rising CO2 would be the cause of rising T have failed. In fact, all of their scary predictions have failed, from Polar bear decimation, to predictions of rising global humidity, to bleaching wiping out the corals, to frog extinctions, to accelerating sea level rise, to disappearing polar ice, to ocean “acidification”, to more extreme weather events… to runaway global warming itself. ALL of the alarmist predictions have turned out to be wrong. All of them.
Edward: at what point do you finally admit that the basic alarmist premise has been falsified?
Ever? Or will you go on believing people who have been wrong 100.0% of the time?
Believing people who are always wrong is madness, Edward. Don’t follow them down that road.
richardscourtney
August 26, 2014 at 10:39 am
…
“ALL TIME SCALES”
…
Except for the past 17 years.
“And I showed you real world evidence proving that changes in CO2 follow NO CHANGE in temperature”
Popularly known as Hansen’s Law, at low pressures the solubility of CO2 in water is inversely proportional to the temperature.
At very high pressures and low temperatures in the presence of calcium and magnesium it precipitates out of solution in the form of carbonates.
The Oceans contain 50,000 times the CO2 of that in the Atmosphere. Examining the Mauna Loa CO2 record in fine detail we see the diurnal fluctuation on the order of 20ppm, each and every day as the surface warms and CO2 exits the Ocean. At night the reverse takes place.
This is elementary HS Chemistry.
richardscourtney wrote:
“”No comments on http://wattsupwiththat.com/2014/08/24/missing-heat-in-the-atlantic-it-doesnt-work-like-that/#comment-1717630 ?”
“It is too stupid to deserve a reply.”
Pielke Sr,McNider and Christy are hardly “stupid.” Calling them such just shows you don’t have a real scientific argument. QED.
Edward Robinson says:
“Except for the past 17 years.”
You made an assertion there, Edward. Now, back it up. Post a chart that supports your belief. If you can.
Here is a current chart, Edward. Notice that it debunks your assertion. CO2 follows temperature. Solid, empirical evidence proves you are wrong. What say you now?
Will you ‘Say Anything’? <— You are good at that kind of prevarication and dissembling.
You are being painted into a corner by reality, Edward. Don't you think it's time to stop digging the hole you’re in?
dbstealey says:
“Yes, pressure broadening exists on Venus, but it is far too small of an effect to explain away the fact that Venus is near the sun and thus hot, and Mars is farther from the sun, and thus cold.”
Is it too small? Where are the numbers showing that?
richardscourtney wrote:
“The most recent period of warming ended about 17 years ago.”
You know very well that only one dataset (RSS LT) shows this, and the other seven (UAH LT, GISS, HadCRUT4, NCDC, BEST, Cowtan & Way. and NOAA-OHC) do not.
Here, for example, is a plot of GISS for the last 17 years. It shows warming:
http://www.politics.ie/forum/environment/33041-climate-change-debate-thread-4291.html
So why are you ignoring 88% of the data?
dbstealey
August 26, 2014 at 10:50 am
What say you now?
Here is your ∆C for 17 years.
.http://www.woodfortrees.org/plot/esrl-co2/from:1997/plot/esrl-co2/from:1997/trend
…
Here is your ∆T for 17 years
..
http://www.woodfortrees.org/plot/rss-land/from:1997/plot/rss/from:1997/trend
…
Looks like something other than T is causing CO2 increase.
Once again, that is an OVERLAY. It says nothing about cause and effect. Can you never get it into your thick skull that an overlay does not show causation?
This is harder than teaching a dog algebra!
SonicsGuy:
Your post at August 26, 2014 at 10:50 am attempts to compound stupidity with stupidity.
I did NOT say the authors of the paper were or are stupid.
I did say – AND I REPEAT – that your post was and is stupid to claim that because that paper was published the definition of global warming has been altered.
I do not need a “scientific argument” – be it “real” or otherwise – to point out that your claim is Pythonesque.
I will offer some free advice. You may be thought to be daft but writing posts which demonstrate you are daft is not a good idea: I suggest you stop doing it.
Richard
Sonicsguy,
You made the ‘pressure broadening’ assertion. I called you on it. So don’t assign me homework; you need to support your assertion, which is, so far, baseless.
Next, you claim that “88%” of the data shows no warming. That is simply false.
Got more charts like that if you want ’em. But somehow, I don’t think you do.
Edward Richardson,
What is the point of posting CO2 and T charts? I have repeatedly posted them. They do nothing at all to support your position. In fact, nothing supports your belief.
A chart of T and another of CO2 do not show causation. You say:
Looks like something other than T is causing CO2 increase.
The more I read your nonsense, the crazier you sound. Really. I have posted verifiable empirical evidence showing that ∆T causes ∆CO2. Because that fact debunks your alarmist belief system, you post completely meaningless charts, which have been posted many times by me and others. They do not show causation.
You said I had not shown the past 17 years. I proved that I did. In fact, nothing you write is anything but your personal belief. It is baseless nonsense. I only respond so others who may read your nonsense do not accept it. It is pseudo-scientific nonsense.
If you cannot refute what I post with verifiable, testable, measurable scientific evidence, then you are only emitting your baseless opinion. That, my friend, is completely worthless.
Either dispute what I post by using testable, measurable evidence, or be a stand-up guy and concede the argument. No one will think worse of you. That only happens when you continue to argue based on nothing but your own belief — which is what you’ve been doing.
You are outclassed here, Edward. Best if you run along to Hotwhopper or Treehugger now. They have know-nothing head-nodders who will agree with any alarmist claptrap. Here, we require verifiable evidence.
Edward Richardson
Your post at August 26, 2014 at 10:43 am is plain daft.
Have you and SonicsGuy made a bet to see which of you can provide the most ridiculous post in the thread?
Richard
dbstealey
August 26, 2014 at 11:31 am
“I have posted irrefutable empirical evidence showing that ∆T causes ∆CO2. ”
…
I have posted irrefutable empirical evidence that shows that in the past 17 years, ∆T=0 resulted in a 10% increase in CO2.
SonicsGuy says:
Richardscourtney wrote:
“The Antarctic contains 90% of all the ice on Earth which continues to grow; see here.”
Sorry, but no.
Sorry, but yes:
The Antarctic contains about 90% of the planet’s ice. The Arctic and Greenland have almost all of the rest.
Are you wrong about almost everything, sonicguy? So far, that’s what it looks like.
But don’t feel bad, Edward Richardson has you beat hands down. Edward has yet to be right about anything.
Edward Richardson says he posted a chart showing that CO2 has increased.
NO ONE disputes that. It still does not show causation. My charts do.
And thanx for finally admitting that ∆T causes ∆CO2. You’re coming around.
SonicsGuy
It seems that you have decided to copy the ludicrous Edward Richardson by posting blatant falsehood in response to being shown to be wrong.
At August 26, 2014 at 10:59 am you write
I know very well that you are deliberately presenting falsehood.
See Section 1 of this item by Werner Brozek
http://wattsupwiththat.com/2014/08/23/midyear-prognosis-for-records-in-2014-now-includes-june-data/
It lists all the trends which negative, their duration, and provides graphical plots. Indeed, it links to the usaed data sets so you can repeat the analysis yourself.
So, why are you presenting such easily refuted falsehoods?
Richard
dbstealey
August 26, 2014 at 11:48 am
I do believe that even if Mr. Richardson wanted to understand, he could not, at whatever present level of education he has achieved. Best to just let it go. You can’t teach a dog to play the trumpet. It lacks the necessary basic equipment.
dbstealey
August 26, 2014 at 11:48 am
“You’re coming around.”
…
Why don’t you explain to all of us what has caused the increase in CO2 in the past 17 years, because there has been no increase in T in the past 17 years.
Bart,
I don’t respond to teach Edward anything. He is unteachable. I respond so other readers who may be new here, and maybe not up to speed on the subject don’t get bamboozled by Edward’s anti-science nonsense. That’s all.
But you’re right. Teaching Edward the basics is like trying to teach a dog algebra.
Edward says:
Why don’t you explain to all of us what has caused the increase in CO2 in the past 17 years, because there has been no increase in T in the past 17 years.
I see you are moving the goal posts again, as usual. OK. Part of what has caused the rise in CO2 is the outgassing of the oceans. There is a lag time in that, as we thashed out in excruciating detail with the site pest “chuck” a month ago. I certainly do not feel like teaching you again, especially since a) you are unteachable, and b) you will argue incessantly no matter how solid the facts are.
The other source of CO2 — a minor cause — is human emissions. Since CO2 is beneficial, and harmless, it’s all good.
Now, it’s about time you admitted that you were wrong about your assertion that there is no evidence over the past 17 years that ∆T causes ∆CO2. Because I posted real world, empirical evidsence that you have never refuted.
Be a stand-up guy and admit it, Edward. No one will hold it against you if you admit you were wrong.
Bart
August 26, 2014 at 11:56 am
“You can’t teach a dog to play the trumpet”
dbstealey
August 26, 2014 at 12:05 pm
.
“is human emissions”
..
Thank you for admitting it
Edward Richardson,
It has never been a secret that human emissions are a small part of the total [about 3%]:
http://wattsupwiththat.files.wordpress.com/2009/02/eia_co2_contributions_table3.png
See, I’m a stand-up kinda guy [although I have posted that table here for at least five years].
But what about you, Edward? You falsely claimed that I didn’t show that CO2 followed temperature for the past 17 years, when I posted a chart ending in 2014, and showed exactly that.
So, what about that, Edward? Are you a stand-up guy? Or are you a typical alarmist, who cannot admit that you were wrong no matter how decisively it is proven?
The credibility ball is in your court, Edward.
dbstealey says:
“Next, you claim that “88%” of the data shows no warming. That is simply false.”
Your graphs are a wonderful illustration of a cherry pick — picking the starting point to give you the result you want. Perfect.
BTW, HadSST2 has been replaced by a newer version.
So has HadCRUT3.
Why did you leave off UAH LT? Because it shows warming?
dbstealey
August 26, 2014 at 1:14 pm
“CO2 followed temperature for the past 17 years”
…
It didn’t
According to you temps have not increased in the past 17 years. ( ∆T = 0)
CO2 has risen from 365 ppm to 400 ppm. ∆C = 35 ppm
CO2 is not following T at all.
Here is UAH LT:
http://www.woodfortrees.org/plot/uah/from:1997/to:2014/plot/uah/from:1997/to:2014/trend
and sea surface temperatures:
http://www.woodfortrees.org/plot/hadsst3gl/from:1997/to:2014/plot/hadsst3gl/from:1997/to:2014/trend
and the surface:
http://www.woodfortrees.org/plot/hadcrut4gl/from:1997/to:2014/plot/hadcrut4gl/from:1997/to:2014/trend
and note that the UAH data used by the site is out of date (UAH is on v5.6, not v5.4).
The best surface dataset, Cowtan & Way, shows 0.16 C of warning in 17 years.
Note that you are using short intervals that aren’t climatologically meaningful — they’re heavily influenced by natural variability, such as ENSO and volcanoes.
And……. doesn’t everyone here dispute the data because they’re “adjusted?” Then how can you use that same data to draw any conclusions? Hmm?
dbstealey says:
“It has never been a secret that human emissions are a small part of the total [about 3%]”
Strange, isn’t it, that you only showed half of the carbon cycle? Where is the other half — the carbon sinks.
dbstealey says: “Part of what has caused the rise in CO2 is the outgassing of the oceans.”
Where is that data?
Last time I looked, the land and the oceans were absorbing *more* CO2 than they emit:
“Increase in observed net carbon dioxide uptake by land and oceans during the past 50 years,”
A. P. Ballantyne et al, Nature 488, 70–72 (02 August 2012)
http://www.nature.com/nature/journal/v488/n7409/abs/nature11299.html
Richardscourtney wrote:
“It lists all the trends which negative, their duration, and provides graphical plots.”
Mere numerology. Purposely picking starting dates to give the result you want is called “cherry picking.”
Pretending that such short intervals are indicative of climate shows you doesn’t understand the difference between weather (especially in the ocean) and climate.
Pretending that CO2 is the only factor that determines short-term surface temperature trends is a gross misunderstanding of the science.
And claiming that Pielke Sr et al are “stupid” for advancing a far better metric for global warming shows you don’t understand conservation of energy.
SonicsGuy
Now you have overstepped the mark.
Your series of disingenuous posts has culminated in your outrage at August 26, 2014 at 2:22 pm that only consists of falsehoods.
Of especial note is your lie that I accused Pielke Sr et al of being stupid when I specifically refuted that at August 26, 2014 at 11:31 am in response to your first presentation of that lie. Clearly, the repetition of the falsehood can only be a lie when the accusation was rebutted when first made.
Withdraw and apologise.
Richard
richardscourtney wrote:
“It is too stupid to deserve a reply…”
The post you impolitely labeled “stupid” was one that (a) pointed out you missed relavant journal references and (b) quoted from Pielke Sr’s article in Physics Today:
:http://wattsupwiththat.com/2014/08/24/missing-heat-in-the-atlantic-it-doesnt-work-like-that/#comment-1717630
Neither of those are “stupid” — they’re both right on point — and the clear implication is that Pielke Sr. was “stupid” for writing that that changes in ocean heat content are a better measure of global warming and a planetary energy imbalance.
It is you who should apologize, for your constant name-calling on this forum. (And for being wrong about Antarctic ice.)
By the way, Richard, the IPCC has always recognized the importance of ocean warming:
“The large warming of the ocean in high latitudes is propagated downwards to the ocean floor, where it spreads to all latitudes. The warming of the deep oceans is consistent with paleo-oceanographic data for a warmer climate….”
– IPCC AR1 WG1 (1990) pg 151
http://www.ipcc.ch/publications_and_data/publications_ipcc_first_assessment_1990_wg1.shtml
“However, when greenhouse gas concentrations are changing continuously, the thermal capacity of the oceans will delay and effectively reduce the observed climatic response At a given time, the realized global average temperature will reflect only part of the equilibrium change for the corresponding instantaneous value of the forcing Of the remainder, part is delayed by storage in the stably stratified layers of the upper ocean and is realized within a few decades or perhaps a century, but another part is effectively invisible for many centuries or longer, until the heating of the deep ocean begins to influence surface temperature.”
– IPCC AR1 WG1 (1990) pg 179
http://www.ipcc.ch/publications_and_data/publications_ipcc_first_assessment_1990_wg1.shtml
Troll posting as SonicsGuy:
Your posts consist of a series of falsehoods. Perhaps some result from your ignorance.
But everybody can see your claim I called Pielke Snr et al stupid is a lie.
Withdraw and apologise.
Richard
Troll posting as SonicsGuy:
By the way troll, your quotation from the IPCC was already trumped by my reference, quotation and explanation of the IPCC’s “committed warming” which was addressed to you and is at August 25, 2014 at 12:41 pm. this klink jumps to it.
I assume that you were unaware of this because it was in discussion with somebody else posting as SonicsGuy.
Richard
richardscourtney:
This is the comment you called “stupid”:
http://wattsupwiththat.com/2014/08/24/missing-heat-in-the-atlantic-it-doesnt-work-like-that/#comment-1717630
That comment, by me, merely shows that, besides myself, at least three notable scientists think OHC is a better metric by which to assess global warming.
Clearly, that means you are calling these three scientists “stupid.” They are not.
You can think what you want about global warming metrics. We will think what we want. But you can’t squirm out of rudely calling people “stupid.”
PS: And you’re still badly wrong about Antarctic ice.
Mr Courtney.
…
In scanning this thread from top to bottom, the first use of the word “stupid” occurs in your post ( http://wattsupwiththat.com/2014/08/24/missing-heat-in-the-atlantic-it-doesnt-work-like-that/#comment-1717437 )
…
Could you please try and be more adult-like in these threads and refrain from issuing insults and using derogatory adjectives ?
soniucsguy says:
Your graphs are a wonderful illustration of a cherry pick — picking the starting point to give you the result you want. Perfect…
heh. …as you cherry-pick your own carefully constructed charts.
Look, you can argue all you want that global warming is continuing, but the more you do, the more wacked-out you sound. Because just about every authority now, including the professional alarmist crowd, is desperately trying to explain the “pause”, or the “hiatus”.
By those inappropriate terms they are trying to explain why global warming has stopped. At last count, your side is up to about 38 excuses, trying to explain why global warming has stopped:
Who are you, to be arguing with all the keepers of temperature records? You are just a nameless, faceless, anonymous internet commenter. So go argue with them if you don't like their conclusions. They freely admit that global warming stopped, many years ago. You, whoever you are, don’t agree, based on a carefully constructed, cherry-picked chart or two. Who should folks listen to? You? Or everyone else?
Better trot back to your thinly-trafficked alarmist blogs now. You need some new talking points. Yours are out of date — and you are out of your league here.
Next, you say:
Strange, isn’t it, that
youthe UN/IPCC only showed half of the carbon cycle? Where is the other half — the carbon sinks.Go ask the UN/IPCC. And note that the U.S. is a net “carbon” sink. [By “carbon” they mean CO2: a beneficial and harmless trace gas. But “carbon” sounds scarier, because your HE-RO, the Rev. Algore, has demonized ‘carbon’.] And it is the hydrologic cycle that matters, not the “carbon” cycle.
Next:
Last time I looked, the land and the oceans were absorbing *more* CO2 than they emit
Which should reduce your false alarm panic. And if the oceans — 71% of the planet’s surface — are absorbing CO2, that means they are cooling, because that’s what cooling oceans do. What does that do to your runaway global warming scare? You have self-debunked.
Finally, you never responded to the fact that Antarctica has almost 90% of the ice on the planet. You wrongly claimed it is less. Antarctica is increasing its polar ice, which easily makes up for the Arctic — which was the last desperate prediction of the alarmist clique; every other prediction they made has failed.
Why should anyone listen to a gang that has been consistently wrong about everything? One by one, every alarmist prediction has been debunked. Got any new ones? Let us at ’em. Because you guys are on the ropes, and you’re going down for the count.
dbstealey
August 26, 2014 at 4:55 pm
“if the oceans — 71% of the planet’s surface — are absorbing CO2, that means they are cooling”
…
No, it means that the phytoplankton are eating well.
dbstealey:
Until you explain why you are using RSS data instead of UAH’s, and why you’re using old versions of datasets (HadCRUT3, HadSST2) instead of the most recent ones, I stand by my criticism.
dbstealey
August 26, 2014 at 4:55 pm
..
“Antarctica is increasing its polar ice”
..
Not according to GRACE and CryoSat
http://onlinelibrary.wiley.com/doi/10.1002/2014GL060111/abstract
Edward Richardson
August 26, 2014 at 2:04 pm
“CO2 is not following T at all.
Yes, it is.
Bart
August 26, 2014 at 5:12 pm
…
No it is not…..
..
For the past 17 years……
∆C —– http://www.woodfortrees.org/plot/esrl-co2/from:1997/plot/esrl-co2/from:1997/trend
∆T —– http://www.woodfortrees.org/plot/rss-land/from:1997/plot/rss-land/from:1997/trend
Note the trend lines
dbstealey wrote:
“Strange, isn’t it, that you the UN/IPCC only showed half of the carbon cycle? Where is the other half — the carbon sinks.”
> Go ask the UN/IPCC.
Unlike you, the IPCC includes *all* of the carbon cycle — sources AND sinks. The planet is taking in more CO2 than humans are emitting (for now, at least). That’s why CO2 is building up in our atmosphere, and why your “3%” number is deceptive.
“Last time I looked, the land and the oceans were absorbing *more* CO2 than they emit”
> Which should reduce your false alarm panic.
It directly shows where you went wrong.
PS: There are no guarantees that sinks will continue to be greater than sources. It could reverse. Science’s understanding of the carbon cycle contains significant unknowns.
Sonicsguy,
I use the Woof For Trees databases — all of them. Both sides of the debate use WFT, therefore that is a credible site acceptable to all. I use RSS because it is satellite data; the most accurate kind of data [and before you try the debunked ploy about inaccurate satellites, be aware that RSS and UAH are direct competitors. When have you ever heard of competitors not badmouthing the competition? The fact is that RSS is universally accepted data, and it is paid for. Therefore it is acceptable for the purpose of recording global temperature trends]. So stand by your ‘criticism’. If you haven’t noticed, you are standing all alone.
++++++++++++++++++++
Edward Richardson says:
dbstealey says:
“CO2 followed temperature for the past 17 years”
…
It didn’t
According to you temps have not increased in the past 17 years. ( ∆T = 0)
CO2 has risen from 365 ppm to 400 ppm. ∆C = 35 ppm
CO2 is not following T at all.
Edward, take your Prozac and lie down. It’s time for your nap.
I posted verifiable, testable, measurable empirical evidence showing conclusively that ∆T is the cause of ∆CO2. All you posted was a simple overlay. An overlay does not show cause and effect. The charts I posted do.
Your response? You made a baseless assertion: “CO2 is not following T at all.”
Do you actually believe that posting your baseless opinion can score any debate points??
Edward, this is the internet’s Best Science & Technology site; the winner of the internet’s last 3 consecutive Weblog Awards. If you haven’t noticed, unlike the alarmist blogs WUWT has articles and comments by numerous climatologists, physicists, chemists, geologists, and many others in the hard sciences.
Those highly educated folks don’t give much credit to baseless assertions from the Peanut Gallery. You need to post testable, measurable scientifc evidence backing up your point of view. But so far, with you it’s been assertions all the way. Your opinion, that’s all. You’ve got to do better than that to be credible, Edward…
…and still waiting for you to man-up and acknowledge my empirical evidence showing conclusively that CO2 follows temperature. Your baseless opinions don’t cut it Edward, and you are still not manning up.
dbstealey wrote:
“And if the oceans — 71% of the planet’s surface — are absorbing CO2, that means they are cooling, because that’s what cooling oceans do.”
Bad science. What matters is the difference in the partial pressures of CO2 in the atmosphere and in the ocean. The former is increasing, so the ocean takes up more CO2, even as it warms.
“I posted verifiable, testable, measurable empirical evidence showing conclusively that ∆T is the cause of ∆CO2.”
….
Again, I posted verifiable, testable, measurable, empirical evidence showing that for the past 17 years ∆T = 0 and ∆CO2 rose 10%.
Here is the “evidence” (Evn you use the Woof For Trees databases )
…
∆T
http://www.woodfortrees.org/plot/rss-land/from:1997/plot/rss-land/from:1997/trend
∆CO2
http://www.woodfortrees.org/plot/esrl-co2/from:1997/plot/esrl-co2/from:1997/trend
..
From these two graphs you can see that ∆T is not the cause of ∆CO2
Edward Richardson:
You say that “I posted verifiable, testable, measurable, empirical evidence showing that for the past 17 years ∆T = 0 and ∆CO2 rose 10%.” However, it is the change in the temporally averaged global temperature over the past 17 years that is approximately 0. Thus, your ∆T must be the change in the temporally averaged global temperature over this period. Over this period, the global temperature varied and, as I understand it from a post in this thread, the change in the CO2 concentration followed the change in the global temperature rather than preceeding it. Thus, the change in the CO2 concentration cannot have caused the change in the global temperature, by the definition of “cause.”
dbstealey wrote:
“Finally, you never responded to the fact that Antarctica has almost 90% of the ice on the planet. You wrongly claimed it is less. Antarctica is increasing its polar ice, which easily makes up for the Arctic.”
The wrong part was Richardscourtney’s claim that Antarctic ice was increasing. It is not.
The Antarctic, Greenland, and the Arctic are all, net, losing ice.
dbstealey wrote:
“Changes in CO2 result from temperature changes.”
Changes in CO2 can also come from volcanoes, forest fires, land use changes, melting clathrates, and more.
Oh yeah, and by animals of any species who dig up fossil fuels and then burn them.
dbstealey
August 26, 2014 at 5:28 pm
…
“Edward, take your Prozac and lie down. It’s time for your nap.”
.
This should clear up your confusion
http://www.woodfortrees.org/plot/rss-land/from:1997/scale:10/plot/rss-land/from:1997/trend/plot/esrl-co2/from:1997/offset:-380/plot/esrl-co2/from:1997/offset:-380/trend
dbstealey wrote:
“The proof is irrefutable: ∆T causes ∆CO2.”
But many other things also ’cause’ CO2.
If you think only a change in temperature causes a change in CO2, you have to explain this: why has 0.8 C of modern warming “caused” a 120 ppm increase (so far) in atmospheric CO2, when about 8 C of warming after an ice age glacial period caused only about 100 ppm increase of CO2?
dbstealey
August 26, 2014 at 5:28 pm
…
This too, it has a better scale factor on RSS
http://www.woodfortrees.org/plot/rss-land/from:1997/scale:10/plot/rss-land/from:1997/scale:10/trend/plot/esrl-co2/from:1997/offset:-380/plot/esrl-co2/from:1997/offset:-380/trend
Ah, and we have yet another baseless opinion from ‘sonicsguy’:
It directly shows where you went wrong.
Your opinion shows no such thing.
And “Edward Richardson” appears again like Whack-A-Mole, posting another opinion. Edward, here on Earth, empirical evidence always trumps opinion. Notice here the latest measurement of global ice [the red chart line].
Global ice is above it’s 30-year average. That’s another alarmist prediction falsified.
Note that you can aloways find an opinion to support your Belief. That is why I always defer to real world measurements. They trump all opinions. You should try it.
Finally, Edward, look at Bart’s link above. There is a mountain of similar empirical evidence showing conclusively that CO2 follows temperature. You just refuse to acknowledge it. Your mind is already made up, and any contrary evidence is rejected. Typical alarmist. No wonder your conclusions are wrong.
dbstealey
August 26, 2014 at 5:47 pm
….
“Notice here the latest measurement of global ice”
Correction: Notice here the latest measurement of global SEA ice.
…
Your graph shows SEA ice, not the ice mass sitting on top of the land mass of Antarctica and Greenland.
..
Sea level is rising 3 mm/yr. Half of that rise is from melting ice, and half from thermal expansion. CyroSat and GRACE both show ice mass decreasing.
dbstealey wrote:
“Your opinion shows no such thing.”
It’s not my “opinion” that carbon sinks are currently greater than sources, it’s a scientific finding.
“Global ice is above it’s 30-year average.”
Ice is 3-dimensional, not two. And the world is now losing a huge amount of it every year — over 500 km3/yr, according to a paper that just came out in “The Cryosphere”
http://www.the-cryosphere.net/8/1539/2014/tc-8-1539-2014.pdf
dbstealey
August 26, 2014 at 5:47 pm
“You just refuse to acknowledge it.”
…
Yes, and I wll continue to refuse to acknowledge that CO2 follows temperature as this graph clearly shows.
..
http://www.woodfortrees.org/plot/rss-land/from:1997/scale:10/plot/rss-land/from:1997/scale:10/trend/plot/esrl-co2/from:1997/offset:-380/plot/esrl-co2/from:1997/offset:-380/trend
From the graph you can see that CO2 is rising and Temperature is flat, therefore CO2 is NOT following temperature.
dbstealey wrote:
“The proof is irrefutable: ∆T causes ∆CO2.”
That doesn’t explain this…..
http://nas-sites.org/americasclimatechoices/files/2012/10/Figure-14.png
You would have to have a pretty big increase in T to get up to 400 ppm.
dbstealey August 26, 2014 at 9:21 am
Sonicsguy,
Yes, pressure broadening exists on Venus, but it is far too small of an effect to explain away the fact that Venus is near the sun and thus hot, and Mars is farther from the sun, and thus cold.
That’s a dumb comment even for you, here’s part of the spectrum of CO2 at 1 atmosphere:
http://i302.photobucket.com/albums/nn107/Sprintstar400/CO2-1atm.jpg
and here it is at 93atm:
http://i302.photobucket.com/albums/nn107/Sprintstar400/CO2-93atm.jpg
Pressure broadening in the Venusian atmosphere is a major effect, as shown, even more so at elevated temperature.
Terry Oldberg wrote:
“Thus, the change in the CO2 concentration cannot have caused the change in the global temperature, by the definition of “cause.””
More silly logic.
Surface temperature depends on MORE FACTORS than atmospheric CO2. Many more, that are themselves changing with time.
This is so obvious I can’t understand why many people here can’t get it.
Mr Terry Oldberg
….
I am not arguing that ∆CO2 caused ∆T.
I am refuting the following statement made by dbstealy…..
.
dbstealey wrote:
“The proof is irrefutable: ∆T causes ∆CO2.”
Edward Richardson:
Thank you for the clarification. dbstealy errs in stating that “∆T causes ∆CO2.”
SonicsGuy:
In your attempt at refutation of the argument that I make in my Aug. 27 at 7:22 pm post you make a couple of logical errors. First, you try to reach a conclusion by characterizing an opposing argument as “silly.” Logic does not contain principles by which one can do so. Second, that the global surface temperature may depend upon more factors than the concentration of CO2 is irrelevant in relation to Mr. Richardson’s argument that the change in the global temperature cannot have caused the change in the CO2 concentration. As the change in the global temperature preceeds the change in the CO2 concentration, the change in the former can have caused the change in the latter. On the other hand, the change in the latter cannot have caused the change in the former as claimed in my post.
Terry Oldberg
August 26, 2014 at 7:51 pm
“. As the change in the global temperature preceeds the change in the CO2 concentration”
…
This is not true in the past 17 years.
Something other than global temperature is causing the CO2 concentration to rise.
Edward Richardson
I’d like to call you attention to the fact that the quantity that has not risen over the past 17 years is not the global temperature but rather is the temporal average of the global temperature. Your argument conflates the global temperature with the temporal average of the global temperature.
Edward Richardson says:
The AGW hypothesis…
AGW is not a hypothesis. A hypothesis is able to make consistent, reliable and accurate predictions. The AGW conjecture has never been able to make any accurate predictions. At all. They even failed to predict the amazing halt to global warming for almost two decades. Not one AGW prediction saw that one coming. Thus, AGW is merely a conjecture. An opinion.
If someone is unable to understand basic scientific terms, such as the difference between a conjecture and a hypothesis, they are certainly not qualified to discuss this subject. And we see how unqualified Edward Richardson is. It is clear that he runs back constantly to his alarmist blog sto get new talking points. I, for one, do not do that. I’ve been immersed in this subject for almost twenty years, from when I believed that CO2 caused gloabl warming. Yes! That long ago! But facts changed, and my view changed along with increasing knowledge. Now I just shake my head at the noobs who pop up here, pretending to be competent. They aren’t.
======================
Phil. You are sure a dumb cluck. The proximity to the Sun is the main reason for Venus’ temperature.
+++++++++++++++++++++++
Edward Richarsson,
Thank you for posting yet another chart that shows global temperatures leading CO2. Sorry about the bullet hole in your shoe…
Edward continues digging:
Sea level is rising 3 mm/yr. Half of that rise is from melting ice, and half from thermal expansion.
Thank you for yet another assertion. Half and half, eh?
Edward, the only debate is over whether sea level rise is accelerating. That is/was the endless prediction of the global warming cult. Skeptics know that the sea level has been rising since the last stadial. But so what? It is not accelerating. Chalk up another major alarmist prediction FAIL. They are still batting 0.000.
_________________________
sonicsguy says:
But many other things also ’cause’ CO2.
Do you ever stop your endless nitpicking? Of course there are other CO2 forcings! So what? The question is this: does ∆T cause ∆CO2? Or vice-versa?
There is no measurable, testable, empirical evidence showing that CO2 is the cause of rising temperature. Now, that may possibly be the case. But there are no measurements quantifying the amount/fraction of global warming resulting from rising CO2. There are no data-based charts showing that CO2 leads temperature. So if that is the case, any such effect is simply too minuscule to measure.
Science is nothing without measurements. There are ample and numerous measurements showing that changes in temperature cause changes in CO2. But none show the opposite. Thus, AGW is simply a conjecture; an opinion, nothing more.
See, your Belief is based entirely on an unproven conjecture. Furthermore, you are ready to change the direction of Western civilization, based only on your ridiculous Belief. That is INSANE.
But then, the entire alarmist belief system is insane. Fortunately, their nonsense is finally being dismissed by the public. And none too soon. The crazies almost got the U.S. headed down the road to ruin. That would leave China, India, Russia, and other rational countries as top dogs. That is what those fools almost accomplished, with their insane anti-science nonsense.
We are very fortunate to have the best science site on the internet, right here. Unlike censoring alarmist blogs, WUWT lets everyone have their say — even the mental cases. Then readers can sift the wheat of truth from the chaff of pseudo-science. What is left standing is as close to scientific truth as we are likely to get currently. And the truth is that AGW, if it exists, is a non-problem. It simply doesn’t matter.
Terry Oldberg,
Explain this:
http://cyclesresearchinstitute.files.wordpress.com/2011/06/co2-temperature-roc.png
dbstealy:
Though the change in the temperature preceeds the change in the CO2 concentration one cannot conclude that the change in the temperature causes the change in the CO2 concentration. One can conclude that the change in the CO2 concentration does not cause the change in the temperature. The latter conclusion is significant for regulation as a causal relation from the change in the CO2 concentration to the change in the temperature underlies the EPA’s argument for regulation of the CO2 concentration.
Though a change in the CO2 concentration cannot cause a change in the temperature such a change may provide information about a subsequent change in this temperature. Past climatological research addresses this issue inadequately.
Terry Oldberg wrote:
“As the change in the global temperature preceeds the change in the CO2 concentration, the change in the former can have caused the change in the latter. On the other hand, the change in the latter cannot have caused the change in the former as claimed in my post.”
Your attempts to impress and bamboozle with logic lack substance.
Temperature and CO2 are in a mutually reinforcing loop. A change in either can cause in the other. The warming from recent glacial to interglacial periods (about 8 C) are only about half explained by Milankovitch forcings. The rest is the feedback from the increase in CO2.
There are natural changes — like the above, volanoes, forest fires, etc — and there a manmade changes. Man is digging up fossil fuels and burning them, and this not a function of temperature. Those fossil fuels produce CO2 when burned, which goes into the atmosphere and ocean.
Presto – a change in CO2. That then causes a change in T.
The argument is a simple one.
SonicsGuy:
Your claim that “Your attempts to impress and bamboozle with logic lack substance” lacks a basis in logic. In logic, one refutes an argument by proving that a premise to this argument is incorrect or that the manner in which the conclusion is drawn from the premises lacks a logical basis. You have done neither.
Data presented by dbstealy are inconsistent with your claim that a change in the CO2 concentration causes a change in the global temperature. They do not eliminate the possibility that a change in the CO2 concentration provides information about a subsequent change in the global temperature. Climatological research performed to date is inadequate to the task of determining whether this provides information or does not.
Terry Oldberg,
Explain this:
http://www.woodfortrees.org/plot/esrl-co2/isolate:60/mean:12/scale:0.26/plot/hadcrut3vgl/isolate:60/mean:12/from:1958
Can you see which leads, and which lags?
Be honest. Which changes first? Temperature, or CO2?
As with the others, if you can produce a chart showing that ∆CO2 is the cause of ∆T, please do. You will be the first. Otherwise, try to be logical. Look at those charts, and tell us which is the cause, and which is the effect.
dbstealey wrote:
“Phil. You are sure a dumb cluck. The proximity to the Sun is the main reason for Venus’ temperature.”
How rude. Phil gave you clear evidence of pressure broadening. And you simply dismissed it altogether because it wasn’t want you wanted to hear. You aren’t fooling anyone,
Nor could you show your theory works. It’s just a claim — and a false one.
Whatever you’re doing here, you certainly aren’t interested in the science of climate change.
Sonicsguy says:
Temperature and CO2 are in a mutually reinforcing loop. A change in either can cause in the other.
Your use of “Presto” is appropriate. You believe in the magic gas.
But to be credible you need to post measurable, testable, verifiable empirical evidence, as I have done repeatedly. All you do is assert. And saying, “Presto” just isn’t enough.
dbstealey
August 26, 2014 at 7:59 pm
1) Stop calling people names. Phil is not a “dumb cluck” Name calling is juvenile.
…
2) “The proximity to the Sun is the main reason for Venus’ temperature.”
Mercury is closer to the Sun than Venus is, and the surface of Venus is hotter than the sun facing side of Mercury
…
3) :”Edward, the only debate is over whether sea level rise is accelerating”
I am not debating if it is or it is not “accelerating” I am merely stating a simple fact. Sea level rise is SHOWING us that both ice is melting, and that the water in the sea is thermally expanding. It is showing us that the ocean is getting warmer. It is showing us that ice mass on Antarctica and Greenland is dropping. Don’t move the goal posts.
..
sonics guy says: how rude…
Yeah, how about that? I said nothing to “Phil.”, and he comes along and calls me “dumb”. Answer this: to you, that isn’t rude? <–[that is a question].
And I did not post a "theory", I posted an empirical fact: Venus is closer to the sun.
If you would restrict yourself to measurable, verifiable, testable, empirical facts like I do, you would be forced onto the right track.
dbstealey
August 26, 2014 at 8:05 pm
Explain this:
http://www.woodfortrees.org/plot/hadcrut3vgl/from:1997/scale:10/plot/hadcrut3vgl/from:1997/scale:10/trend/plot/esrl-co2/from:1997/offset:-380/plot/esrl-co2/from:1997/offset:-380/trend
.
Can you see which leads, and which lags?
Be honest. Which changes first? Temperature, or CO2?
Why does NO CHANGE in temperature cause a rise in CO2 ?
Edward Richardson:
1) Same question to you that I asked sonicsguy. What’s your answer?
2) Mercury has no atmosphere. Would you like to discuss the night side?
3) Sea level rise is showing us that the planet is rreecovering from the LIA, and from the stadial before it. it is not showing us that CO2 causes global warming — the central debate question.
Keep ’em coming, Edward. I have yet to see a question I haven’t answered a dozen times before.
dbstealey
August 26, 2014 at 8:15 pm
…
“he comes along and calls me “dumb”.
Mr Dbstealy….
..
Phil did not call you dumb.
Here are his exact words…. (emphasis added)
“That’s a dumb comment even for you,”
See? He called your COMMENT dumb, not you.
dbstealey
August 26, 2014 at 8:20 pm
“Mercury has no atmosphere.”
Nice to know that an atmosphere can warm a planet. Is that because of some kind of “greenhouse gas” kind of thing?
dbstealey
August 26, 2014 at 8:20 pm
“the planet is recovering from the LIA,”
Explain to me how this causes thermal expansion of the water in our ocean.
What is the physical mechanism for “recovering from the LIA?”
“Sea level rise is showing us that the planet is rreecovering from the LIA.”
Climates aren’t hospital patients — they don’t “recover” on their own. They change when they’re forced to change. Conservation of energy,
Mr Dbstealey
…
You owe Mr Phil an apology for calling him names.
Edward Richardson,
What are you, Phil.’s nanny? When he used the pejorative “dumb” when referring to me, he got it back. I’m gonna start calling you Miss Manners if you keep it up…
“Treat me good, I’ll treat you better. Treat me bad, I’ll treat you worse” Get it?
Edward Richardson August 26, 2014 at 8:17 pm [ “…” ]
How many times do I have to explain this to you?? That is an OVERLAY. It does not show cause and effect! My charts show cause and effect.
SonicsGuy August 26, 2014 at 8:28 pm [ “…”]
Then use Bart’s chart. It shows the same thing.
You know, when you have to resort to nitpicking like that, you have lost the argument. I’ve posted plenty of other charts showing causation. You just don’t want to accept reality.
Both of you jamokes:
The term ‘recovering from the LIA’ has been used continuously by lots of folks on both sides of the debate. I cannot help it if you’re noobs. If you had been around a while, you would be familiar with the term ‘recovering’.
———————————-
I shall return later, to deconstruct whatever nonsense you come up with in the mean time. That will give you plenty of time to run back to your alarmist blogs for some extra talking points.
dbstealey wrote:
“You know, when you have to resort to niutpicking like that, you have lost the argument.”
Nitpicking? Your entire calculation is wrong. That’s not nitpicking — it’s telling you you aren’t plotting what you claim to be plotting. Your argument is wrong and so is your conclusion.
I don’t know what “Bart’s chart” is.
dbstealey wrote:
“The term ‘recovering from the LIA’ has been used continuously by lots of folks on both sides of the debate. I cannot help it if you’re noobs. If you had been around a while, you would be familiar with the term ‘recovering’.”
So then define it for us (no name calling), in scientific terms.
Because every time I’ve seen someone use it, it’s an attempt to sound scientific without understanding the physics of conservation of energy. They don’t want to admit CO2 caused warming since the LIA, so they just say it’s magically “recovering.”
dbstealey wrote:
“I shall return later, to deconstruct whatever nonsense you come up with in the mean time. That will give you plenty of time to run back to your alarmist blogs for some extra talking points.”
Don’t bother. You’re too rude to deal with again. That your science is terribly bad just makes it all the worse.
dbstealey:
I don’t believe I have claimed that ∆CO2 is the cause of ∆T. I certainly don’t believe it.
In reading the transcript of this thread I find that heated disagreements arose from the multiplicity of meanings that were attached to the term “T” by various participants in the conversation. For some, T meant the global temperature. For others, T meant a temporal average of the global temperature. It is the 17 year temporal average that has not changed much in the past 17 years. The global temperature has fluctuated in this period.
dbstealey:
I write to congratulate you for your patience and fortitude in dealing with the trolls over night.
The hissy fits of the abusive and offensive SonicsGuy and Edward Richardson have been joined by the usual meaningless twaddle from Terry Oldberg and the typical abuse and falsehoods from the obnoxious Phil..
The result has been your need to defend yourself from a continuous creeping barrage of lies, distortions and insults. I congratulate you on surviving unscathed.
The distortions, falsehoods and ‘mud slinging’ of the trolls do not and cannot alter the facts.
Global warming is – and only is – an increase to global average surface temperature anomaly (GASTA).
Global warming has stopped while atmospheric CO2 has continued to increase.
Claims that global warming has not stopped are falsehood.
There is no evidence that heat is ‘hiding’ in the oceans and will – or can – return to cause future global warming.
Richard
“Global warming is – and only is – an increase to global average surface temperature anomaly (GASTA).”
Good morning. If I may respectfully clarify: it makes sense to me that we need to measure and incorporate temperatures and heat fluxes in any region that impacts the “global” climate. This must include the ocean, which absorbs most of the heat. The risks of a narrow definition for global warming is that one ignores information that may be globally relevant.
“Global warming has stopped while atmospheric CO2 has continued to increase.”
This is an example of a misleading conclusion drawn from incomplete data. The skeptical mouse climbing the long staircase is thus forced to deny her vertical ascent at each stair.
“Claims that global warming has not stopped are falsehood.”
My criteria for global warming cessation needs to be informed by the prior surface temp hiatuses and by evidence of cessation of effects, such as global ice mass declines. Also, I would need evidence of radiative balance at TOA.
“There is no evidence that heat is ‘hiding’ in the oceans and will – or can – return to cause future global warming.”
Some labs have shown this evidence in the Atlantic and the Pacific oceans beneath the thermocline…and ice is melting.
katatetorihanzo:
Global warming is – and only is – an increase to global average surface temperature anomaly (GASTA).
It was feared that global warming would provide serious problems so several responses to it were adopted and those responses are killing people. Fortunately, global warming has stopped and this is a reason for rejoicing.
However, there are rent seekers and others making a living on the back of the global warming scare. They are not rejoicing, and they are trying to pretend that global warming has not stopped. But global warming has stopped so they are trying to pretend that global warming is something other than an increase to GASTA.
The risks of allowing these crooks and charlatans to redefine global warming include the certainty that the imposed policies which are killing people will not be revoked.
Richard
There’s no problem with “GASTA” as one of many indicators assessing the magnitude of the heat content of the climate system. But I wouldn’t make any final determinations based on arbitrary subsets of the full temperature record. We all realize there are short term natural variations superimposed over the continual GHG forcing. Yes, 17 years is a short time. Also, ice is melting.
katatetorihanzo
Global warming is an increase in GASTA.
The “magnitude of the heat content of the climate system” is not relevant to global warming and the important fact that global warming has stopped.
Take your red herring elsewhere. It is polluting the thread.
Richard
dbstealey August 26, 2014 at 9:02 pm
Edward Richardson,
What are you, Phil.’s nanny? When he used the pejorative “dumb” when referring to me, he got it back. I’m gonna start calling you Miss Manners if you keep it up…
Clearly I referred to your comment as dumb not you: “That’s a dumb comment even for you,”
I also proved it with data which you run away from as is your wont, note it’s not fudged data like the plots you show where you perform unstated scale changes and offsets.
dbstealey August 26, 2014 at 7:59 pm
Phil. You are sure a dumb cluck. The proximity to the Sun is the main reason for Venus’ temperature.
No it isn’t, the orbit of Venus is 0.7 AU so its insolation at TOA is ~2x Earth’s, however its albedo is 3x greater so without the GHE of its atmosphere Venus would have about 2/3 the temperature of Earth (~180K). So it is the atmosphere (particularly the pressure broadening of the CO2 spectrum) that is responsible for an increase of about 550K.
Those are the empirical facts about Venus’s temperature.
(a re-posting to insure it is at the end of this thread)
=====================================
@ Edward Richardson: August 26, 2014 at 9:27 am
““∆T causes ∆CO2″
…
FALSE
…
Proof? 17 years of no increase of surface temperature, but CO2 has risen in the 17 year time span.”
—————
Firstly, Edward R, you really should read and try to understand Henry’s Law which defines the fact that …. “∆T causes ∆CO2″, …. or the ingassing/outgassing of CO2.
REF: http://butane.chem.uiuc.edu/pshapley/GenChem1/L23/web-L23.pdf
Also read up on the outgassing of CO2 via microbial decomposition (rotting/decaying) of dead biomass when surface temperatures are above 60 degrees F.
And keep in mind that the outgassing of CO2 …. is akin to ….. the melting of ice. The FACT is, the air temperature doesn’t have to …. KEEP INCREASING … for either of said processes to continue functioning.
And secondly, the average temperature of the ocean has been increasing for the past 200+ years …. so it matters not that the near-surface air temperatures have not risen in the past 17 years. As long as the ocean water is “warming” then the outgassing of CO2 from the ocean will continue. And IT IS still “warming”, to wit:
http://www.realclimate.org/index.php/archives/2013/09/what-ocean-heating-reveals-about-global-warming/
Samuel C Cogar August 27, 2014 at 4:06 am
Firstly, Edward R, you really should read and try to understand Henry’s Law which defines the fact that …. “∆T causes ∆CO2″, …. or the ingassing/outgassing of CO2.
REF: http://butane.chem.uiuc.edu/pshapley/GenChem1/L23/web-L23.pdf
I suggest you read it and try to understand it yourself, add CO2 to the atmosphere from a sequestered source i.e. underground, and according to Henry’s Law the atmospheric concentration will go up and the ocean concentration will go up.
What is happening now is that ‘new’ CO2 is being added to the atmosphere and some of that is being absorbed by the ocean and biosphere causing a net increase in the pCO2, the exact proportion is modulated by the small fluctuations in SST per Henry’s Law which gives the correlation on the ‘noise’ that Sealey and Bart make such a fuss about after they throw away the actual increase.
richardscourtney
August 27, 2014 at 12:21 am
.
You post…..
“There is no evidence that heat is ‘hiding’ in the oceans”
..
The evidence is clear. The water in the ocean is thermally expanding. That only happens when the water gets warmer. Half of current sea level rise is thermal expansion.
Edward Richardson
The evidence is clear. You don’t have a clue about any of these matters.
I suggest you read and learn. To that end, it would be to your benefit to stop spending your time writing your rubbish.
Richard
Do you have trouble addressing thermal expansion of ocean water?
No. Do you have trouble taking your meds.?
dbstealey
August 26, 2014 at 9:02 pm
’”m gonna start calling you Miss Manners”
…
I would expect it. All you seem capable of is to call people names in this forum.
@ SonicsGuy: August 26, 2014 at 9:13 pm
“So then define it (recovering) for us (no name calling), in scientific terms.”
————–
Don’t be acting silly, …… “recovering” is not a scientific term therefore it can not be defined in “scientific terms”.
=============
@ SonicsGuy: August 26, 2014 at 9:13 pm
“Because every time I’ve seen someone use it (recovering) , it’s an attempt to sound scientific without understanding the physics of conservation of energy. ””
—————
And just what the ell does the “physics of conservation of energy” ….. have to do with the use of the word “recovering”?
Was that an example of your feeble attempt to “sound scientificy” …. or what?
=============
@ SonicsGuy: August 26, 2014 at 9:13 pm
“They don’t want to admit CO2 caused warming since the LIA, ……”
——————
Ell “NO”, …. they will not agree with or admit to such a silly arsed “junk science” claim that atmospheric CO2 has such “magical” properties.
But the simple reason they won’t admit to the above said …. is that it would have been a physical impossibility for the quantity of CO2 in the atmosphere at the height of (1500 to 1700 AD) the LIA to have any “warming” affect whatsoever on the extreme “coldness” of the near-surface temperatures.
“DUH”, iffen atmospheric CO2 causes a “warming” of the near-surface atmosphere ….. then just why in ell does the Ice Core proxies PROVE that the CO2 ppm DECREASED during the LIA at the same time as the near-surface air temperatures decreased? To wit, ice core proxy graph:
http://www-das.uwyo.edu/~geerts/cwx/notes/chap01/Image18.gif
===============
@ SonicsGuy: August 26, 2014 at 9:13 pm
“…. so they just say it’s magically “recovering.”
——————-
“NO”, absolutely not. It is the proponents of CAGW that have been claiming that the CO2 has been magically “warming” the near-surface atmosphere.
@ Phil.: August 27, 2014 at 4:47 am
“…. add CO2 to the atmosphere …… and according to Henry’s Law the atmospheric concentration will go up and the ocean concentration will go up”
—————-
Well “DUH”, just what is it exactly that you DON’T UNDERSTAND about the “ingassing of CO2” by the waters of the ocean?
@ Phil.: August 27, 2014 at 3:49 am
“So it is the atmosphere (particularly the pressure broadening of the CO2 spectrum) that is responsible for an increase of about 550K.
Those are the empirical facts about Venus’s temperature.”
—————-
GIMME A BREAK …… and I’ll offer you an education in/on science.
The extreme temperature of Venus’s atmosphere is PRIMARILY due to its extremely slow axial rotation, ….. plus its extremely high velocity atmospheric winds, ….. plus the mass density of its atmosphere ….. and plus its close proximity to the Sun.
The planet Venus is akin to a big hunk of “beef” on a barbeque “spit” that is just barely turning round n’ round above an extremely “hot” bed of burning charcoal.
Just back your arse up real close to a “roaring” camp fire …. or a “red hot” cast iron stove ….. and experience it for yourself.
Iffen you won’t listen ….. then you will just hafta feel.
Samuel C Cogar
August 27, 2014 at 6:55 am
“GIMME A BREAK”
…
Why is the sun facing side of Mercury cooler than the surface of Venus despite it being half the distance to the Sun?
richardscourtney:
By your manner of participation in this blog you continuously break a rule. In scientific or scholarly debate it is impermissible to attempt to win an argument through characterization of one’s opponent or his argument. Thus, it is impermissible to attempt to win an argument through characterization of one’s opponents as “trolls” or characterization of an opponent’s argument as “twaddle.” Instead, one has to address the allegedly faulty argument itself and to refute it if one can. That you frequently find it necessary to break this rule suggests the possibility that you are unable to construct a logical argument. If this is the case, do us all a favor by ceasing your participation.
I agree with your assessment and prescription.
I would expect you to agree with Oldberg. He says he gets “information from the future”.
Where do you get yours?
Samuel C Cogar August 27, 2014 at 6:16 am
@ Phil.: August 27, 2014 at 4:47 am
“…. add CO2 to the atmosphere …… and according to Henry’s Law the atmospheric concentration will go up and the ocean concentration will go up”
—————-
Well “DUH”, just what is it exactly that you DON’T UNDERSTAND about the “ingassing of CO2” by the waters of the ocean?
Nothing, nice cherry picking of the quote, you were claiming that the increase of CO2 was due to the change in temperature whereas in fact it’s due to the introduction of previously sequestered Carbon into the atmosphere and its subsequent partitioning between the atmosphere and ocean per Henry’s law.
Samuel C Cogar August 27, 2014 at 6:55 am
@ Phil.: August 27, 2014 at 3:49 am
“So it is the atmosphere (particularly the pressure broadening of the CO2 spectrum) that is responsible for an increase of about 550K.
Those are the empirical facts about Venus’s temperature.”
—————-
GIMME A BREAK …… and I’ll offer you an education in/on science.
You’d have to it understand first.
The extreme temperature of Venus’s atmosphere is PRIMARILY due to its extremely slow axial rotation, ….. plus its extremely high velocity atmospheric winds, ….. plus the mass density of its atmosphere ….. and plus its close proximity to the Sun.
No, primarily due to the the opacity of the atmosphere which as I showed is a function of the atmospheric pressure due to pressure broadening. Due to the high albedo the proximity to the sun is not a factor. Bear in mind that my post was in response to the erroneous statements that pressure broadening was a small factor in the Venusian atmosphere, which you conveniently omitted. Where was your education on the science when that nonsense was posted?
richardscourtney
August 27, 2014 at 8:23 am
” Do you have trouble taking your meds.?”
…
This a prime example of your inability to face facts. I feel sorry for you if you can’t deal with the thermal expansion of the water in the oceans. Having to resort to ad-hominem as a response is indicative of a person incapable of addressing reality.
Edward Robinson
Obviously, you have misunderstood. I feel contempt and not sorrow for you.
It is not an ad hom. to point out that you have only contributed illogical ravings which have disrupted the thread.
I apologise that I was not sufficiently clear, and I hope that this post has corrected any misunderstanding.
Richard
richardscourtney
August 27, 2014 at 9:22 am
“It is not an ad hom”
Of course it is, and you still have not faced the fact that half of sea level rise is due to thermal expansion of the water. Solid, verifiable proof that the oceans are warming.
Edward Robinson
It is apparent that I need to be blunt.
Your obfuscations, misquotations, evasions and misrepresentations demonstrate that you are an annoying troll who is determined to disrupt the thread.
I tried to discuss with you and your illogical nonsense made that impossible.
I will not demean myself by further interaction with you.
Richard
richardscourtney:
Contrary to your claim, to accuse one’s opponent of having “only contributed illogical ravings” is an example of an ad hominem argument. To smear one’s opponent with innuendo is one of the ways in which an ad hominem argument can be made and is one that you lean upon again and again when berift of logically legitimate counter arguments.
Terry Oldberg
A statement of demonstrable fact is not an ad hom. I cannot say that Edward Robinson is a man because I have no evidence about the matter. But I can say he/she/they/ it is an internet troll because – as I said – this troll has “only contributed illogical ravings which have disrupted the thread”.
That is not an “innuendo”: it is a clear and unambiguous statement.
Clearly,you have no counter to my clear statements because – to use your language – if you had “logically legitimate counter arguments” you would have made them.
Richard
richardscourtney:
Contrary to your claim, a statement of demonstrable fact regarding one’s opponent’s character is an example of an ad hominem argument when one’s opponent’s character is not the issue under debate. Also, I don’t believe you can demonstrate it as a fact that Mr. Robinson ( or whomever is the target of your name-calling ) is a troll. You’d need a pattern-recognizer that was inerrant in distinguishing trolls from non-trolls but real pattern recognizers (e.g. the ones used in optical character recognition) make errors.
Richard Courtney’s “do you have trouble taking your meds? comment is a de facto admission he has no scientific response to your (excellent) question. We all know that. He knows it.
And this from a member of the advisory board of E&E. Now you see why that journal has the reputation it does.
http://www.multi-science.co.uk/ee.htm
SonicsGuy
I am trying to get the troll, Edward Richardson, to accept the reality that I refuse to continue wasting time on its ridiculous and illogical talking points. My refusal has nothing to do with my ability to dismiss its silly talking points and – despite your falsehood – you know that.
Your mention of E&E has no relevance to this thread: it is simple trolling. In this manner it is similar to all your other posts in this thread.
However, E&E has its excellent reputation as a result of publishing important science. For example, E&E published the papers of M&M which demolished the MBH Hockey Stick. As a result of that there were all the other investigations and debunkings of that pseudoscientific graph.
Richard
Wikipedia gives a great summary of the so-called “Hockey Stick Controversy”.
It is interesting that this pivotal scientific discovery is only debunked in contrarian blogs and yet is repeatedly verified and extended as recently as 2013 in mainstream science.
http://en.m.wikipedia.org/wiki/Hockey_stick_controversy#Continuing_research
“New studies using different methods continued to extend the period covered by reconstructions, and agreed well with Mann et al. 2008, as in the Ljungqvist 2010 2,000 year extratropical Northern Hemisphere reconstruction.”
“Studies by Christiansen and Ljungqvist investigated previous underestimation of low-frequency variability, and reaffirmed Mann et al.’s conclusions about the Little Ice Age and the Medieval Warm Period as did Ljungqvist et al. 2012 which used a larger network of proxies than previous studies.”
“The hockey stick graph was further extended and confirmed by Marcott et al. 2013 which used seafloor and lake bed sediment proxies to reconstruct global temperatures over the past 11,300 years.”
http://en.m.wikipedia.org/wiki/Energy_%26_Environment#Criticism
“According to a 2011 article in The Guardian, Gavin Schmidt and Roger A. Pielke, Jr. claimed that E&E has had low standards of peer review and little impact.”
“In addition, Ralph Keeling criticized a paper in the journal which claimed that CO2 levels were above 400 ppm in 1825, 1857 and 1942, writing in a letter to the editor, “Is it really the intent of E&E to provide a forum for laundering pseudo-science?””
“A 2005 article in Environmental Science & Technology stated that “scientific claims made in Energy & Environment have little credibility among scientists.””
Boehmer-Christiansen (editor) acknowledged that the journal’s “impact rating has remained too low for many ambitious young researchers to use it”, but blamed this on “the negative attitudes of the Intergovernmental Panel on Climate Change (IPCC)/Climatic Research Unit people.”
[Interesting that these critical (skeptical ?) “editorial comments” against Energy and Environment remain inside its Wikipedia entry, isn’t it? .mod]
Richard: Your refusal to answer Edward’s simple question about sea level rise was very, very obvious — you know what the answer is, and what it implies. And you still can’t admit it — and no amount of name calling will change that. . .
katatetorihanzo
You cite Wicki then say
That Connolley, Schmidt and Pielke jnr dislike E&E is very high praise indeed. Especially when their dislike is that E&E refuses to adopt their corrupt ‘pal review’ revealed by ‘climategate’.
And if breaking the ‘Hockey Stick’ is an example of “little impact” then please let us have much more “little impact” on the corrupt practices which comprise so-called ‘climate science’.
Richard
SonicsGuy
I refuse to have any further interaction with the disingenuous and egregious troll posting as Edward Robinson. Dealing with this especially unpleasant troll engenders similar emotion to removing something unpleasant from the instep of my shoe, and I try to avoid the need to do it.
That is not changed by the cajoling of another troll who is hiding behind the cowards screen of anonymity so you can stop bothering to do it.
Richard
Edward Richardson
August 26, 2014 at 8:17 pm
“Why does NO CHANGE in temperature cause a rise in CO2 ?”
Because it is the rate of change of CO2 which is affinely related to temperature.
Phil.
August 27, 2014 at 3:49 am
“No it isn’t, the orbit of Venus is 0.7 AU so its insolation at TOA is ~2x Earth’s, however its albedo is 3x greater so without the GHE of its atmosphere Venus would have about 2/3 the temperature of Earth (~180K).”
Non sequitur. Temperature is related to stored energy, while you are discussing energy flux in time (power). That is the same error those who deny the GHE entirely make when they mistakenly apply the conservation of energy principle to the flow of energy.
richardscourtney
August 27, 2014 at 9:59 am
“you are an annoying troll ”
Name calling is an ad-hom.
You do that often here. Especially when you are unable to face facts.
Edward Richardson
You don’t like my saying “you are an annoying troll ”
OK. Let me correct it for you.
You are a persistent and annoying troll who misrepresents, misquotes and distorts statements so is contemptible and deserves to be shunned.
I tried to engage in rational conversation with you but have learned that the attempt was foolish, I refuse to do it further.
I hope that is clear enough.
Richard
If you can’t face the facts, and have the need to resort to name calling, it is abundantly clear you are lacking the ability to face facts.
I state facts and don’t do name calling.
Clear off, troll. You have ceased to be amusing.
On WUWT I have been called “a troll”, “always-wrong alarmist”, “fanatic”, “anti-science propagandist”, and “deluded”. But my favorite is “warmunist”.
I think it is fair to say that many I’ve encountered here have a playful sense of hyperbole and are quite passionate.
Phil.
August 27, 2014 at 3:49 am
To make your argument work for you, you have to assume all other influences are equal, and then solve for the steady state temperature, which would then have the ratio (2/3)^0.25.
Edward Richardson
August 27, 2014 at 10:02 am
Your “facts” are naive misconceptions.
But you can teach a dog to play the trumpet…..
A plastic toy horn is not a trumpet.
richardscourtney
August 27, 2014 at 10:33 am
” don’t do name calling.”
Calling someone a “troll” is name calling.
Are you incapable of addressing the thermal expansion of ocean water? It is clear evidence that the oceans are warming.
Bart August 27, 2014 at 9:52 am
Edward Richardson
August 26, 2014 at 8:17 pm
“Why does NO CHANGE in temperature cause a rise in CO2 ?”
Because it is the rate of change of CO2 which is affinely related to temperature.
pCO2 is linearly related to the cumulative fossil fuel emission, the temperature effect is a minor modulation due to the Henry’s law coefficient variation etc.
Phil.
August 27, 2014 at 3:49 am
“No it isn’t, the orbit of Venus is 0.7 AU so its insolation at TOA is ~2x Earth’s, however its albedo is 3x greater so without the GHE of its atmosphere Venus would have about 2/3 the temperature of Earth (~180K).”
Non sequitur. Temperature is related to stored energy, while you are discussing energy flux in time (power). That is the same error those who deny the GHE entirely make when they mistakenly apply the conservation of energy principle to the flow of energy.
The effective black body temperature of Venus in radiative equilibrium is ~180K, so sealey’s claim that it’s high temperature is due to it’s proximity to the sun is refuted.
“pCO2 is linearly related to the cumulative fossil fuel emission, the temperature effect is a minor modulation due to the Henry’s law coefficient variation etc.”
Quite impossible, given the data.
“… so sealey’s claim that it’s high temperature is due to it’s proximity to the sun is refuted.”
But, your argument was still non sequitur. Hey, you wrote it in haste. No big deal.
There are, of course, multiple causes beside a global rise in ocean temperature, for a rise in Atmospheric CO2, many of which are known to be occurring.
Soil erosion is obviously foremost, deforestation, terrestrial fuel combustion(of uncertain provenance), concrete production, global colding and drought, etc.
Comparisons of Venus and the Earth are silly.
Why?
After a timeout to take care of Life, I am back to straighten out the beginners.
First, Edward got his panties in a bunch over my reply to Phil., who wrote about me:
“That’s a dumb comment even for you”
My reply: All Phil.’s comments are dumb, even for him. <– that should wad up Edward's panties enough to give him apoplexy.
Phil. doesn’t seem to think that the Sun matters when discussing Venus' temperature. Why even reply to that preposterous nonsense?
Next, sonicsguy says:
Don’t bother [to come back]. That your science is terribly bad just makes it all the worse.
Sonicsguy is full of opinions, no? They are the basis for his entire belief system. With an opinion like that, sonicsguy will never learn anything, because his mind is made up: He believes that I know nothing. Just ask sonicsguy, he will tell you. Sonicsguy instructed me ‘don’t bother to come back’. Question: how does it feel to be impotent, Sonicsguy? You know what it’s like, so tell us. I enjoy explanations of your impotence.
Next, Hanzo says:
The skeptical mouse climbing the long staircase is thus forced to deny her vertical ascent at each stair.
Hanzo is clearly no skeptic. Hanzo Believes that global warming has only hiccuped, and it will resume any time now. Because, like, Hanzo knows the future.
The fact is that global warming has stopped. That fact throws the alarmist crowd into fits of consternation. They never saw it coming. Their predictions were universally that global warming would continue, and very likely accelerate. So their climbdown is: “It’s only temporary! A hiatus! A pause! We can see the future, just ask us.” Well, it’s been almost twenty years sincw global warming stopped. Since Hanzo knows the future, I have a question for him: when will global warming resume? What year, Hanzo?
Global warming stopped many years ago. That fact deconstructs the wild-eyed Chicken Little response from climate alarmists, who were absolutely convinced that rising CO2 would cause runaway global warming.
But Planet Earth gave her response: ‘It ain’t so, people.’
If CO2 causes any global warming, it is a minuscule, unmeasurable, 3rd-Order effect, which is swamped by 2nd-Order effects — which are both swamped by 1st-Order forcings [cf: Willis]. CO2 just does not have the claimed warming effect. Any warming from CO2 is simply too small to measure.
In fact, it has been shown conclusively that temperature controls CO2 levels; the exact opposite of the alarmist view. The peanut gallery here doesn’t want to accept that fact, but that’s why they can’t learn anything. Their minds are already made up and closed tight. They operate on confirmation bias, on cherry-picking, and on True Belief. Their religion is enough. The Rev. Algore told them so, and to heck with the real world, the scientific method, the null hypothesis, and empirical evidence. They have their religion:
That religious belief underlies the climate alarmist arguments. They argue with a thin veneer of science, but the truth is that they believe that human CO2 emissions are evil.
The truth is exactly the opposite: CO2 is harmless, and it is beneficial to the biosphere. More CO2 is better. But to the Rev. Algore’s acolytes here, that is apostasy. They cannot give one inch. They cannot admit to one fact that contradicts their religious belief. And thus, we get the kind of mindless arguments we see here.
dbstealey
August 27, 2014 at 11:07 am
..
“In fact, it has been shown conclusively that temperature controls CO2 levels”
..
Can you explain what change in temperature caused this?
..
http://nas-sites.org/americasclimatechoices/files/2012/10/Figure-14.png
Ice core data directly measuring CO2 content is invalid. First because no linear conversion of the one measure to the other has been established(assumption of equality is deprecated), and Secondly because the time resolution is inadequate for the purpose.
Edward Richardson,
Thank you for yet another chart showing that changes in temperature are followed by changes in CO2.
As for your constant demands for an ‘explanation’, you really don’t need explanations. Your belief is religious, and that is enough for you.
For the rest of us, we are always looking for rational explanations. Unlike you, we are scientific skeptics.
Salby can.
Because if CO2 causes any global warming, it is a minuscule, unmeasurable, 3rd-Order effect, which is swamped by 2nd-Order effects — which are both swamped by 1st-Order forcings [cf: Willis]. CO2 just does not have the claimed warming effect. Any warming from CO2 is simply too small to measure.
Yeah, that really is the long and short of it.
gary gulrud
August 27, 2014 at 11:17 am
“Ice core data directly measuring CO2 content is invalid.”
Citation please.
Google is your friend.
http://www.talkorigins.org/faqs/icecores.html
Note that the Vostok data is useful for paleogeology, as a relative measurement. As soon as we get data from 2000 AD, you of course are allowed to use it.
Your citation does not say anything about “CO2 content”
…
It makes two mentions of CO2, namely,
” CO2 correspondances between dated ice-cores [4] and CO2 correspondances with dated oceanic cores [4].”
….
Can you please “google” a better citation?
Secondly, could you please find a peer reviewed citation?
katatetorihanzo says:
On WUWT I have been called “a troll”, “always-wrong alarmist”, “fanatic”, “anti-science propagandist”, and “deluded”. But my favorite is “warmunist”.
Don’t forget: Rent-seeking rider on the climate gravy train. That’s your primary motivation.
When your income depends on your opinion, your opinion is predictable.
dbstealey
August 27, 2014 at 11:37 am
…
“you really don’t need explanations.”
…
You need to explain what recent temperature change caused the 120 ppm change in CO2.
You have been saying all along that ∆T causes ∆CO2.
…
All you have to do is identify what ∆T caused the recent 120 ppm increase in CO2.
..
If you cannot provide the ∆T, your “∆T causes ∆CO2.” hypothesis is falsified.
Both of you guys Edward Richardson and DBStealey -KNOCK IT OFF!
Your pissing match is getting out of hand. You two aren’t going to agree, so give it a rest.
Friends
The troll says to dbstealey
The troll’s assertion is nonsense and only demonstrates that the troll does not know – or is pretending to not know – that correlation does not indicate causation but coherence does.
In case there are onlookers who may be misled by the troll, I provide the following explanation.
Both correlation and coherence can each and both provide information pertaining to causality.
Correlation is a mathematical relationship between two parameters. If the correlation is known over the length of the data sets, then their correlation indicates the magnitude of a change in one parameter that is expected when the other parameter changes by a known magnitude.
Correlation does NOT indicate a causal relation between two parameters.
But
Absence of correlation indicates absence of a direct a causal relation between two parameters.
Coherence of two parameters indicates that when one parameter changes then the other parameter changes later.
Coherence can disprove that change of one parameter causes change in the other; i.e. if change in parameter A follows change in parameter B then the change of A cannot be the cause of the change of B (because a cause cannot occur after its effect).
So,
1.
absence of correlation indicates absence of a direct causal relationship
and
2.
when there is a direct causal relationship then coherence indicates which of the two parameters is causal.
Furthermore, coherence in the absence of correlation is strongly suggestive that both parameters are affected by another parameter (or other parameters).
For example, leaves fall off trees soon after children return to school following their summer break.
The coherence is great; i.e. both effects occur each year.
But the effects do not correlate; i.e. the number of returning children is not indicative of the number of falling leaves.
In this example, the time of year is the additional parameter which causes children to return to school and the leaves to fall off trees.
So, if it is known that there is a causal relationship between two parameters. The coherence between the parameters indicates which is causal.
Richard
Mr. Courtney prefaces his reply to Mr. Robinson by calling him a “troll” for the umpteenth time. In a past exchange of points of view on this topic, Courtney claims this is not an illogical ad hominem argument because it is a “demonstrable fact” that Robinson is a troll. If this were true, Courtney could logically use the fact that Robinson was a troll as a premise to an argument that discredited Robinson’s testimony. An argument along the lines of:
Robinson is a troll
All trolls are unreliable witnesses
Therefore, Robinson is an unreliable witness
would do the job if both of its premises (the top two sentences) were true.
However, that Robinson is a troll is not a demostrable fact for in determining that he is a troll, Courtney would have to use a pattern recognizer that distinguished trolls from non-trolls but all real pattern recognizers make errors. Thus, that Robinson is a troll has no more than a probability of being true. In assigning a value to this probability Courtney would have to conduct a scientific study featuring: a) certified trolls b) certified non-trolls and c) Courtney’s pattern recognizer. I don’t believe there are any certified trolls. Thus, it appears that Courtney could not have conducted such a study. Rather than using an inerrant pattern recognizer, Courtney must have used one of unknown reliability and implied it was perfectly reliable.
I’ve already identified this weakness in his argument to Courtney. Though he has not responded to this issue he continues to call Robinson a troll. This behavior matches a pattern in which Courtney ignores weaknesses in his arguments when they are identified for him and switches the topic as soon as possible to the allegedly bad characters of his opponents.
Thank you Mr Terry Oldberg for your analysis of Mr. Courtney
Mr. Richardson:
It was my pleasure and I apologize for calling you Robinson.
If interested in jointly pursuing a defamation lawsuit against one or more of the smear artists who inhabit the climate blogs please be in touch. My email address is terry@knowledgetothemax.com . Phone 650-941-0533 (Pacific time zone).
Oldberg and Richartdson have a group hug. Sweet.
Pity they don’t have their ‘love in’ privately instead of polluting this thread with it. But I suppose these egregious trolls cannot help their shameless behaviour.
Richard
dbstealey August 27, 2014 at 11:07 am
Phil. doesn’t seem to think that the Sun matters when discussing Venus’ temperature. Why even reply to that preposterous nonsense?
Why even make up such ‘preposterous nonsense’ in the first place, it has no bearing on what I posted?
The fact is that the combination of Venus’s distance from the sun and its albedo gives a temperature cooler than Earth’s, so Venus’s high temperature is not a result of its proximity to the sun, but rather to the properties of its atmosphere contrary to your assertion.
Phil.,
Thanx for your speculation. It’s always fun to speculate, isn’t it?
You speculate that it’s high albedo is the reason Venus is not cooler than earth. That means Venus reflects a lot of light, right? It reflectes a lot of energy.
The fact — not speculation — is that Venus has an extremely thick atmosphere. CO2 has nothing to do with it; the thickness of the atmosphere retains plenty of heat. It retains heat to the extent that the night side of Venus is the same temperature as the sunlit side. That proves that the atmosphere retains a lot of heat. Albedo has an effect. But your claim that a planet that much closer to the earth, with an extremely thick atmosphere, would be colder than earth except for it’s albedo is nonsense. A thick atmosphere that retains heat, and close proximity to the sun are the rerasons that Venus is hotter than the earth.
And if CO2 itself caused a lot of warming, then Mars’ 95%+ CO2 atmosphere would cook the planet. But Mars is cold.
Venus is hot because it is closer to the sun, and it has a thick atmosphere. Nothing more is necessary to explain the observations. As Occam’s Razor says: stick with the simplest explanation. It is the one most likely to be correct. Adding extraneous variables, such as a magic gas, unnecessarily complicate an elegant explanation.
Richard Courtney:
Agreed. Correct as usual.
And thank you, Anthony. Teaching a dog algebra is impossible.
One can calculate the surface temperature of any of the planets as if they had no atmosphere. For Venus, based on it’s surface area, magnitude of its average incoming solar radiation (662 W/m^2) and albedo, it would be -41 Celsius.
http://www.acs.org/content/acs/en/climatescience/energybalance/predictedplanetarytemperatures.html
Something about the Venusian atmosphere brings the temperature up to 462 Celsius, which is hotter than Mercury (the closest planet to the sun).
Hanzo says:
“Something” is making Venus hot.
Yes. “Something”.
What is that ‘something’?
It is certainly not CO2, because CO2 canot have that effect:
http://wattsupwiththat.files.wordpress.com/2010/03/heating_effect_of_co2.png
Citation?
dbstealey wrote:
“Venus is hot because it is closer to the sun, and it has a thick atmosphere. Nothing more is necessary to explain the observations.”
So then, explain this observation (Figure 1) of Venus’s nightside radiance spectrum:
“Retrieval of air temperature profiles in the Venusian mesosphere from VIRTIS-M data: Description and validation of algorithms,” Davide Grassi et al, JGR-Planets Volume 113, Issue E (2008)
:http://onlinelibrary.wiley.com/doi/10.1029/2008JE003075/pdf
Venus is as hot on the night side as on the day side.
Also, this isn’t about Venus and it really doesn’t interest me — unless it is about Venus and CO2.
Previous discussions about Venus have gotten wildly off-topic, so unless this concerns the article, and/or CO2’s warming effect, I’m not interested.
Talk to Phil. He can always take time out of his work day to discuss these things.
“Also, this isn’t about Venus and it really doesn’t interest me — unless it is about Venus and CO2.”
Of course it’s about CO2. See the dip in radiance at 4300 nm and 4800 nm? Explain.
dbstealey August 27, 2014 at 1:10 pm
Phil.,
Thanx for your speculation. It’s always fun to speculate, isn’t it?
Who’s speculating? I’m talking about the science.
The fact is that Venus has an extremely thick atmosphere. CO2 has nothing to do with it; the thickness of the atmosphere retains plenty of heat. It retains heat to the extent that the night side of Venus is the same temperature as the sunlit side. That proves that the atmosphere retains a lot of heat.
CO2 has everything to do with it, if the atmosphere was nitrogen with the same sulphuric acid clouds the temperature would be about 180K. It is CO2 that has the opacity to IR which causes the elevated temperature.
However, if CO2 itself caused a lot of warming, then Mars’ 95%+ CO2 atmosphere would cook the planet. But Mars is cold.
It would not cook the planet because in the absence of pressure broadening (Patm ~0.01atm) the atmosphere is rather transparent to IR.
Mars:
http://i302.photobucket.com/albums/nn107/Sprintstar400/CO2-001atm.jpg
Compare with Venus:
http://i302.photobucket.com/albums/nn107/Sprintstar400/CO2-93atm.jpg
Venus is hot because it is closer to the sun, and it has a thick atmosphere. Nothing more is necessary to explain the observations. As Occam’s Razor says: stick with the simplest explanation. It is the one most likely to be correct. Adding extraneous variables, such as a magic gas, unnecessarily complicate an elegant explanation.
The physics don’t support the ‘elegant’ explanation because in that case you’d have a surface temperature of ~180K.
Who’s speculating? I’m talking about the science.
You’re still speculating, because you are trying to describe something that doesn’t exist. You may believe otherwise. But that’s how I see it, and I much prefer real world, empirical evidence as opposed to guesses, no matter how sciency they are.
The entire debate question is about the effect of CO2. Climate alarmists claim that CO2 is a magic gas that can push the earth into runaway global warming and climate catastrophe — by rising from 3 parts in ten thousand, to only 4 parts in ten thousand, over 150 years.
Yes. That is their claim. [Well, that is their claim until they move the goal posts.]
The Venus question came up years ago because the same crowd tried to argue that because Venus’ atmosphere is CO2, that is the reason it is so hot. Venus is hot because it has an immensely thick atmosphere, and it is close to the sun. CO2 is not a credible explanation [although I will admit that today that has not been the explanation given. This is just a preemptive strike.] But that claim failed under scrutiny:
http://c3headlines.typepad.com/.a/6a010536b58035970c0115707ce438970b-pi
Also, explain the TOA-observation of Earth’s outgoing spectrum:
http://jonova.s3.amazonaws.com/graphs/co2-absorption/nimbus-satellite-emissions-infra-red-earth-petty-6-6.jpg
You did not respond to my comment, so I won’t bother responding to yours.
Also, every time you demand “Citation”, or “Source”, you can be sure I will laugh at your impotence. Especially in your typical one-word demands.
Say “please”, and you are much more likey to get what you’re asking for.
See reply below @ August 28, 2014 at 10:06 am
“Venus is hot because it has an immensely thick atmosphere, and it is close to the sun.”
1) Why is Venus’s atmosphere thick while Earth’s is not?
2) Explain the outgoing radiance of Venus (Figure 1):
“Retrieval of air temperature profiles in the Venusian mesosphere from VIRTIS-M data: Description and validation of algorithms,” Davide Grassi et al, JGR-Planets Volume 113, Issue E (2008)
http://onlinelibrary.wiley.com/doi/10.1029/2008JE003075/pdf
sonicsguy,
Please. I doubt very much your education revolves around the atmosphere of Venus. So rather than reading the items you find by trolling the iternet, why don’t you try to answer your own question, in your own words, rather than posting someone’s models?
As I have repeatedly made clear, I have no confidence in models. If you can’t post empirical evidence, then admit it. The stock market is much simpler than the atmosphere, and if someone could accurately model the atmosphere, they would become immensely wealthy in short order by modeling the stock market. Models like the one you posted are good for grant-trolling, and I understand that. But they do little to advance knowledge, no matter what you may believe.
If you can’t answer your own question of why Venus has a thick atmosphere, please don’t lay it off on others. If the answer was there, I am sure you would have found it on the internet, and posted it in your continuing effort to appear that you know things you don’t.
So spare us. Stick to the article. No more inane questions.
‘K? Thx bye.
1) Why is Venus’s atmosphere thick while Earth’s is not?
I can explain this observation. Can your theory of Venus?
2) Explain the outgoing radiance of Venus (Figure 1):
I can explain that, too. Can you?
3) Earth’s TOA outgoing spectrum.
I can explain this. What is your explanation?
dbstealey wrote:
“‘K? Thx bye.”
I understand why you’re leaving. and so do others here. And so do you.
I’ve enjoyed your posts SonicsGuy and i salute your patience. My purpose at this contrarian site is not so much masochistic as it is pedagogicaI creative outlet for me. I think the best way to learn something deeply is to patiently explain it to another in alternative and creative ways. My approach is to review an interesting contrarian claim, delete the creative ad hominem and conspiracist speculation, and contrast its essence with mainstream understanding and attempt to persuade.
While it is hard to build a model in which one can have confidence, we have to build such a model if we are to control a system for the events of the past do not recur. Fortunately, using the best available technology it is often possible to do so. Unfortunately, in addressing global warming climatologists have used some of the worst available technology. In doing so they have created models that convey no information to a policy maker about the outcomes from his or her policy decisions. These models are useless for the purpose of making policy. However, climatologists have magnified the disaster they have created by leading policy makers to the conclusion that the models are eminently useful for this purpose.
Terry Oldberg wrote:
“However, climatologists have magnified the disaster they have created by leading policy makers to the conclusion that the models are eminently useful for this purpose.”
Not so — modelers are well aware of the limitations of their models. Watch this talk from a climate modeler, especially near the end:
http://www.ted.com/talks/gavin_schmidt_the_emergent_patterns_of_climate_change
SonicsGuy:
Thanks. In your post, I don’t find a URL. Can you supply?
Here’s the URL. I think the blogging software automatically converts links to pictures if it can, so I’ve altered the URL in an obvious way. Or searech for “Gavin Schmidt Ted talk”
ht—–tp://ww—–w.ted.com/talks/gavin_schmidt_the_emergent_patterns_of_climate_change
The partial pressure of CO2 on Venus is, what, 96 ATMs? On Earth its 0.0004 ATMs. Any idea what the difference in emissivity might be? Look up Hottle’s measurements and report.
Mr SonicsGuy
…
I have “confidence” in this model, I believe you also might.
….
http://upload.wikimedia.org/math/0/f/3/0f36df929ac9d711a8ba8c5658c3bfee.png
…
Aren’t models fun?
Might be hard not having confidence in them.
Yeah, but G is a free parameter to which the model has been tuned. That makes it worthless.
Moreover, we know today that this equation is wrong, and it fails to predict observable phenomena. A better equation is G = k*T, where G is the Einstein tensor, and T is the stress-energy tensor in 4-dimensional space-time. This equation has limits on its applicability as well, which is why we keep searching for better ones.
This is an important point – most physical laws, as written, are known to fail in particular cases. You cannot just apply some laboratory result far beyond the range of its tested limits and expect it will necessarily hold in your intended application.
Edward Richardson, only a climate clown would compare a simple, provable linear model like the inverse square law to a chaotic, nonlinear unprovable (at least probably in my lifetime) climate model.
But you and David Appell (sockpuppeting as sonicsguy) seem to share such traits.
[Snip. Invalid email address. ~mod.]
No model is “provable”
…
Nothing in science is “provable”
…
If you want “proof” study Math.
@Hanzo:
What is the definition of a “contrarian”? It is a pejorative, and you used it twice in one comment.
+++++++++++++++++++++++++++++
Ah. Gavin Schmidt. The guy who tucks tail and runs from any fair, moderated debate with skeptics. That’s because he always loses the debates. Now his answer is… don’t debate!
Yeah, he’s got a lotta credibility. ☺
==============================
Terry Oldberg says:
climatologists have magnified the disaster they have created by leading policy makers to the conclusion that the models are eminently useful for this purpose.
Exactly right. Climate models — GCMs — are truly pathetic. Not one of them was able to predict the most significant event of the last twenty years: the fact that global warming has stopped.
GCMs cost $multi-millions, and they are a waste of taxpayer money. What year do they predict that global warming will start up again?
Contrarian = contrary to mainstream understanding. For example, an explanation of Venusian surface temperatures using atmospheric ‘thickness’ rather than Greenhouse effect is a contrarian viewpoint. It is less pejorative than ‘denialist’.
dbstealey: Why are you skipping out on the Venus questions above? Hmmmm?
Climate models don’t make predictions, they make projections, because no one knows what natural changes take place with solar irradiance, volcanoes, ENSOs, ocean cycles, etc. or the level of future emissions.
Climate models project the equilibrium state of climate, not every wiggle and turn on the way there. That is, they solve a boundary value problem, not an initial vallue problem. They are spun up in a random state, not with the actual initial conditions (which we not know).
Climate models are skillful (as Gavin Schmnidt said in his TED talk), but always wrong. Do you have a better method to project future climate change?
IMO the most important climate event since 2000 is the rapid melting of the Arctic. There isn’t much of a pause (see Cowtan & Way), just a slowdown which has happened several times before, and lots of works show more heating going in the ocean. This slowdown does not invalidate the role of CO2 in any way.
SonicsGuy:
Well said. Models that project but do not predict have a limitation that is not often recognized. This is that they convey no information to a policy maker about the outcomes from his or her policy decisions. A consequence is for the climate to be uncontrollable using these models. Despite this limitation governments persist in trying to control the climate. The cause of their persistence seems to be applications of the equivocation fallacy by climatologists ( http://wmbriggs.com/blog/?p=7923 ) that make it seem as though the climate is controllable when it is not .
OK, Hanzo, let’s apply your definition to the real world:
More than 32 thousand scientists and engineers, all with degrees in the hard sciences, have co-signed a statement that CO2 is ‘harmless’ and ‘beneficial’. No “contrarian” alarmist group has ever come anywhere close to that number.
Therefore, by your definition, climate alarmists are contrarians. Yes?
And thanx for admitting that ‘contrarian’ is a pejorative. See, the alarmist crowd started with all the name-calling, and they do it more often and in more places than skeptics ever did. So it is amusing when we see them whining about hurt feelings.
BTW: have you ever read Michael Mann’s tweets? Just wondering…
We may use ‘in opposition’ if you wish. For example, the claim that global ice mass is diminishing at an accelerating rate is in opposition to the claim that global ice mass is increasing. Hanzo is persuaded by 20-year results of GRACE data analysis from 26 labs quantitating mass. Dbstealey is persuaded by 2.7 years of sea ice extent increases quantitative area. Our views and inderstanding are in opposition. Do you agree? Do i misunderstand you? Do care to elaborate?
Claiming consensus?
“I want to pause here and talk about this notion of consensus, and the rise of what has been called consensus science. I regard consensus science as an extremely pernicious development that ought to be stopped cold in its tracks.”
– Michael Crichton
PS: What about Venus questions?
SonicsGuy August 25, 2014 at 8:58 pm
Matt G wrote:
“Notice the oceans should have 2.45 times more temperature profiles, just to have an equal coverage of observations.”
There’s no “should” — only what’s been and the associated uncertainties. Water temperatures are much more stable than air temperatures — the latter varies greatly every day, with every burst of wind, with every season. The ocean does not.
—————————————————————————————————————————————-
Water temperatures are more stable than air temperatures, but changes over weeks are occurring all the time under the ocean surface with PDO, ENSO, AMO and many ocean currents. The main difference is 1000’s meters of water require many more temperature measurements in 3D comapred to 2D surface temperatures. The link on my previous post showed the depth to 250m were getting closer to the 17,000 value representing 2.45 times here.
The errors may be fairly large for the most reliable data sets we have, but the errors are even bigger for those measuring below 1000m without even considering, the much bigger problem highlighted before of almost non-exsistent coverage of the deep oceans..
“The errors may be fairly large…”
I think we can all agree that larger data sets reduce uncertainty. So when I see an uncertainty ± 0.1 W/m^2 and an ocean heat trend of +0.55 W/m^2 over the 2005-2010 Argo collection timeframe, I can quite comfortably rule out ‘hiatus’ and ‘cooling’
http://thinkprogress.org/climate/2011/08/11/286636/sorry-deniers-the-ocean-is-still-warming/
“Von Schuckmann & Le Traon (2011) also estimate the errors in global trends from the period analysed, and also future error uncertainty. For the 2005-2010 period the error uncertainty is plus/minus 0.1 watt per square metre; quite large considering the global trend over the period is 0.55 watts per square metre. However, after 15 years of observations the uncertainty drops considerably, down to ± 0.02 watts per square metre. This demonstrates how longer periods of observation, along with the complete ARGO network, are critical to derive more accurate long-term ocean trends.”
Hanzo,
ARGO data do not show what your link pretends to show. But then, that is a wacko alarmist blog, so they can be completely disregarded as incredible.
In the Northern Hemisphere, ARGO buoys show consistent declines in ocean temperatures.
The models, as usual, were wrong. ARGO data shows flat to cooling ocean temperatures.
ARGO SST [sea surface temperatures] also show no accelerating warming, as had been incessantly predicted. In fact, SST shows no warming at all.
There are only two depths in which the ARGO buoys have found any ocean warming. The rest all show cooling.
Now that the ARGO floats have been *ahem* “adjusted” by the government, they might show some ocean warming. But agencies like NOAA, USHCN, GISS, and others have all fraudulently re-jiggered their so-called ‘data’ [which is no longer data after all their adjustments] so often that they cannot be trusted.
Hanzo preposterously claims that ‘global warming’ is still chugging along as always. Since his income is dependent on that scare, I understand his motivation. But he is completely at odds with all the mainstream organizations, both alarmist and skeptics, which admit that global warming has stopped.
How do we know that? Because they all use words like “Pause” and “Hiatus” to describe the end of global warming. Those Orwellian terms do not cover up the fact that they have thrown in the towel, and are now admitting that global warming has stopped. [At this point I believe they are up to 50+ excuses.]
So, hanzo, you are out of step with the mainstream. Can we refer to you as a “contrarian” now?
Taking contrarian data analysis ad absurdum, one might conclude that global warming stops each winter.
Dbstealey gave four links to support the claim of global ocean cooling. Using this data one can demonstrate how one can be mislead by ambiguous graphs, regional cherry picking and by the use of short-term data that exagerates the effect of superimposed natural variation.
http://www.friendsofscience.org/assets/documents/FOS%20Essay/Argo_Heat_Content.jpg
Shows 4 years of data (2004-2008) showing a short term cooling trend. Without more labeling it can’t be determined whether the indicated trend truly represents global temperatures including depths lower than 800 m or whether this trend is governed largely by natural variability.
Key questions for a skeptic should include: how does the short-term trend compare with the longer term trend and are the effects of cooling consistent rising sea level rise and accelerating ice mass declines?
http://tumetuestumefaisdubien1.sweb.cz/NH-0-65N-v-50-65N-0-2000dBar-2004-2013max.png
Shows 9 years of data (2004-2013) including deep ocean, but only for selected latitudes in Northern Hemisphere only (0-50N show -0.01 deg C cooling and 50-65N show -0.04 deg C). Is this trend truly a global representation?
http://1.bp.blogspot.com/-q5ZstJqH6jk/TyKKSoN-eyI/AAAAAAAAEPQ/m4-hHMQM4fI/s400/argo-v-climate-models.gif
Two 8-year ocean heat content graphs are shown (2004-2012). A perfectly linear red line is purported to represent climate model data. Since runs from any single climate model exhibit variations and are often depicted with error bars, a single linear representation of multiple climate models appears highly suspicious. The black curve indicates a rising heat content trend.
http://tumetuestumefaisdubien1.sweb.cz/ARGO-sea-temperature-max-max.PNG
Six purportedly global 8-year (2004-2012) surface temp data are contrasted by increasing depth: 0-2.9m, 0-19.5m, 0-48.7m, 0-97.4m, 0-146.1m, 0-194.7m. What is interesting is that the slope of the linear regression lines trend in the positive direction as the depth is increased.
Below is the fully labelled global OHC data from two sources, in context and without regional cherry-picking. They show increasing ocean heat uptake without pause, hiatus, or plateau.
0-2000 m
http://en.m.wikipedia.org/wiki/Ocean_heat_content#/image/File:Ocean_Heat_Content_(2012).png
10-1500 m
https://climatedataguide.ucar.edu/climate-data/ocean-heat-content-10-1500m-depth-based-argo
Here is additional context regarding short-term cooling surface temp trends in the ocean.
http://www.skepticalscience.com/cooling-oceans.htm
http://www.nasa.gov/home/hqnews/2006/sep/HQ_06318_Ocean_Cooling.html
“In the Northern Hemisphere, ARGO buoys show consistent declines in ocean temperatures.”
Citation?
And what about those Venus questions? (Really man, you are making this too easy….)
The World Ocean Database 2013 contains almost 13 million data points:
http://data.nodc.noaa.gov/woa/WOD/DOC/wod_intro.pdf
(see pg 26, Table 1.3)
Sure, it’d be nice to have 13 trillion, but there are always budget and manpower issues.
The question is, given the data that’s collected, how good is the data? That is, using data models, what is the resulting uncertainty in the various calculated values, such as OHC?.
Looking at that (very thorough) document, and Levitus et al 2012
http://onlinelibrary.wiley.com/doi/10.1029/2012GL051106/abstract
I get the definite impression that these scientists were very careful about uncertainties (as most scientists are; a particle physicist once told me that 90% of his work was getting the error bars).
So when I read Levitus et al 2012, and see graphs like their Figure 1, I am not surprised to see quite large error bars for, say, the year 1960 where the 2-sigma error bars for OHC stretch from -2 to -9.5e22 J, then decreasing with time.
All data has limitations. The question is what you do with it.
katatetorihanzo August 27, 2014 at 5:32 pm
A complete Argo network will indeed be critical in providing more accurate long-term trends.
http://www.cpc.ncep.noaa.gov/products/GODAS/mnth_gif/xy_data/temp.prof.global.90s-90n.1000-5000m.gif
Please note the little warming from between 2005-2007 to 2008-2010 with ARGO maybe just an artifact caused by significantly increasing the temperature profiles as highlighted above.
Therefore you can’t rule out hiatus and cooling, when other data which was also fairly reliable shows otherwise.
http://climate4you.com/images/NODC%20NorthAtlanticOceanicHeatContent0-700mSince1979%20With37monthRunningAverage.gif
“Please note the little warming from between 2005-2007 to 2008-2010 with ARGO maybe just an artifact caused by significantly increasing the temperature profiles as highlighted above.”
What is the evidence for your claim?
Calibrating for new instruments is something scientists are well aware of, and spend a lot of time doing.
What conclusion about a global hiatus can drawn from only one-half of the Atlantic, and only to 700 meters?
PS: Seven of eight datasets say there is no hiatus.
dbstealey August 27, 2014 at 3:05 pm
“Who’s speculating? I’m talking about the science.”
You’re still speculating, because you are trying to describe something that doesn’t exist.
What doesn’t exist? The pressure, temperature and composition of Venus’s atmosphere has been measured, its opacity in the IR has been measured (it’s only transparent in two narrow windows), thermal emissions are only observed from very high in the atmosphere (~210K and ~260K) due to the opacity of the lower atmosphere. The pressure broadening has been measured.
You may believe otherwise. But that’s how I see it, and I much prefer real world, empirical evidence as opposed to guesses, no matter how sciency they are.
No you don’t, because when presented with ‘real world, empirical evidence’, not guesses, on this subject you refuse to acknowledge it because it doesn’t agree with your beliefs.
Reprise: The partial pressure of CO2 on Venus is, what, 96 ATMs? On Earth its 0.0004 ATMs. Any idea what the difference in emissivity might be? Look up Hottle’s measurements and report.
Yes, thermal physics is a good deal more advanced than Climate Science, but since you seem eager to dive in…
CO2 as a low pressure gas absorbs in the 10 to 15 micron region, becoming bond-vibrational energy, i.e., latent kinetic energy which is shared with the surrounding gas on collision.
The emissivity of CO2 at 400 ppm is 0.0001 that of an ideal black body. Dirt and green leaves are 0.94, even snow is 0.75.
The speed of an interaction, the time required to effect absorption or emission, is directly proportional to emissivity. The black body emits ‘instantly’ on absorption.
In the Earth’s atmosphere the low emissivity means CO2 is comparatively transparent to radiation with regard to Venus’. Moreover, on absorption CO2 on Earth will invariably contribute the added energy to the surrounding gas, heating it ever so slightly, and not have an opportunity to emit ‘back radiation’.
There is, further, no possibility that CO2 can heat the surface by back radiation when the ratio in emissivity stands 1 to 10,000.
Correction, the emissivity of C02 at 0.0004 ATM is 0.001 that of the ideal. Sorry.
The atmosphere is a strong absorber (viz. a blackbody) at the infrared wavelenghts where water vapor, CO2, CH4 etc. absorb.
I Guess you mean Hoyt Hottel, author of ‘Radiative Transfer’?
Your mistake is to refer the emissivity of CO2 for all wavelengths, in the absorption band, 10-15 microns it’s close to 1 as would be expected from Kirchoff’s law.
As I pointed out above on Venus CO2 is much more opaque over a wider range of wavelengths, due inter alia to pressure broadening but in the absorption band it is fairly strong absorber. Excited CO2 does not ‘invariably contribute the added energy to the surrounding gas’, near the surface that is the main mode of transfer but higher in the atmosphere radiative transfer predominates.
Phil. says:
…you refuse to acknowledge it because it doesn’t agree with your beliefs.
Best psychological projection comment I’ve seen all day! Thanx, Phil.
Next, the anonymous coward, ‘scuse me, I mean “sonicguy” cherry-picks his faves. Two can play that game, and I shall trump sonic’s pathetic finds:
Declining trend chart #1. Not very scary, eh?
And here we have chart #2, the 2 meter temperature anomaly.
Now for some multiple data sets. Chart #3.
And of course, HADcru, chart #4.
Here is chart #5, showing four more declining temperature trends.
And here we have the globe, from 85º N to 85º S: Chart #6.
Here is another view of HADcru, chart #7.
Want more? I thought so: chart #8. Includes ARGO.
Next, we have chart #9, global temperatures since 2000.
That’s not enough? OK then, here is chart #10, 5 datasets.
And chart #11, with a declining trend line.
I got more charts showing the same thing. Lots more. These are just a random selection. But they show why the mainstream climate professionals are all in agreement that global warming has ‘paused’. Or, if you like, is in a ‘hiatus’. Of course, those terms mean that global warming has stopped, whether you want to say it’s five, or ten, or twenty years ago. Global warming stopped, many years ago.
The few true believers who cannot accept reality argue against that reality. But they aren’t in the current *ahem*… consensus, which agrees that global warming has stopped.
Their consternation is palpable. Why? Because that fact cuts the heart out of the “carbon” scare. But then, skeptics know that CO2 has simply gotten a bad rap: it is a harmless, beneficial trace gas. More CO2 is better. So…
Give us more ‘carbon’! It’s all good.
dbstealey: Still refusing to answer the Venus questions? Why?
Simple. It’s because you know those observations are direct evidence of the greenhouse effect.
@ Edward Richardson: August 27, 2014 at 7:03 am
“Why is the sun facing side of Mercury cooler than the surface of Venus despite it being half the distance to the Sun?”
———————
Edward R, please read the following “link” containing “quick facts” ….. and you will find the “answer” to your question
Planets For Kids
http://www.planetsforkids.org/planet-mercury.html
From the link you provided…..”Mercury’s sunny side has a temperature rising to 400° Celsius or 750° Fahrenheit. ”
…
There is no mention of Venus in the link
From http://www.space.com/18526-venus-temperature.html …..”The average temperature on Venus is 864 degrees Fahrenheit (462 degrees Celsius).”
Now why don’t you explain to all of us w hy is the sun facing side of Mercury cooler than the surface of Venus despite it being half the distance to the Sun?
@ Phil.: August 27, 2014 at 8:59 am
“Nothing, nice cherry picking of the quote, you were claiming that the increase of CO2 was due to the change in temperature whereas in fact it’s due to the introduction of previously sequestered Carbon into the atmosphere …… and its subsequent partitioning between the atmosphere and ocean per Henry’s law.”
———————–
Phil, please tell me and all your friends what it is that directly or indirectly “triggers” the action/reaction that is necessary in order to “transfer” and/or “introduces” the above said …… “previously sequestered Carbon into the atmosphere”.
“Phil, please tell me and all your friends what it is that directly or indirectly “triggers” the action/reaction that is necessary in order to “transfer” and/or “introduces” the above said …… “previously sequestered Carbon into the atmosphere”.”
Mining equipment and drilling platforms.
dbstealey August 27, 2014 at 9:33 pm
Phil. says:
“…you refuse to acknowledge it because it doesn’t agree with your beliefs.”
Best psychological projection comment I’ve seen all day! Thanx, Phil.
OK, so why when presented with ‘real world, empirical evidence’, not guesses, on this subject do you refuse to acknowledge it?
According to you, you ‘prefer real world, empirical evidence’ so why not in this case?
“Your mistake is to refer the emissivity of CO2 for all wavelengths, in the absorption band, 10-15 microns it’s close to 1 as would be expected from Kirchoff’s law.”
Completely false. By Kirchoff’s law, absorption precisely equals emittance. If it were the case that CO2 at a partial pressure of 4^10-4 interacted with every incident photon of the 10 and 15 micron wavelengths no trapping would occur. Yes, renaming Kirchoff’s law to Stewart’s law and claiming a quantum mechanical impossibility is standard Climate Science, but your physics is adumbrated.
As indicated, bond-vibrational energy is latent kinetic energy and not an electron raised to a higher orbit, and therefore has a much extended time of interaction. Your explanation is uneducated and fabulist.
Trapping results on absorption because the kinetic energy is transferred to the surrounding gas which does not emit at the 10 micron wavelength.
Samuel C Cogar August 28, 2014 at 5:49 am
@ Phil.: August 27, 2014 at 8:59 am
“Nothing, nice cherry picking of the quote, you were claiming that the increase of CO2 was due to the change in temperature whereas in fact it’s due to the introduction of previously sequestered Carbon into the atmosphere …… and its subsequent partitioning between the atmosphere and ocean per Henry’s law.”
———————–
Phil, please tell me and all your friends what it is that directly or indirectly “triggers” the action/reaction that is necessary in order to “transfer” and/or “introduces” the above said …… “previously sequestered Carbon into the atmosphere”.
I thought it should have been reasonably clear but here goes. The mining of coal and drilling for oil and gas and their subsequent combustion introduces previously sequestered Carbon in the form of CO2 into the atmosphere in Gtonne quantities. That causes an increase in the pCO2 in the atmosphere, followed by absorption of some of that CO2 into the ocean per Henry’s law. Some also enters the biosphere.
@ Phil.: August 27, 2014 at 1:37 pm
“Who’s speculating? I’m talking about the science.
CO2 has everything to do with it, …..”
———————–
“NO”, Phil, you are talking trash.
Iffen CO2 had all the “magical” properties that you claim it does …… then the US Federal Government would be DEMANDING that it be used as an “insulation” product to be “installed” in the walls and ceilings of all homes and businesses, ….. thus saving the owners of said homes and businesses thousands of dollars in their yearly energy costs.
Shure nuff, Phil, just pump the walls and ceilings of your homes full of 95% CO2 …… and your heating unit would only have to operate for a few minutes each day …… and would keep you warm, cuddley and comphy all winter long.
“DUH”, even the “dummies” should be able to reason out the fact that if CO2 “works” for Global Warming …… then it sure as hell will “work” for Home Warming.
So, get with “the program”, Phil, …… get with “the CO2 program”.
Be the verily firstest one in your neighborhood to “practice what you preach”
SonicsGuy August 27, 2014 at 6:46 pm
“Please note the little warming from between 2005-2007 to 2008-2010 with ARGO maybe just an artifact caused by significantly increasing the temperature profiles as highlighted above.”
What is the evidence for your claim?
Calibrating for new instruments is something scientists are well aware of, and spend a lot of time doing.
——————————————————————————————————–
Much of the remaining error in the difference estimates of heat content, thermosteric expansion, and temperature is due to inadequate sampling by the in situ data. In recent years, subsurface floats have begun to contribute a substantial fraction of globally available temperature profiles. Once the Argo float array is fully deployed, it will produce approximately 100,000 profiles per year, evenly distributed over the global oceans. Although this does not represent a large increase in profile density over the present, the more uniform distribution of the float array is expected to reduce the errors caused by undersampling, particularly in the Southern and Indian Oceans.
Calibrating instruments can’t resolve the problem caused by undersampling and the little/very short increase soon stopped once profiles become stable. An example over few miles comparing 3 temperature profiles earlier with 5 temperature profiles later.
earlier) A,B, and C = 1.2c,1.2c, 0.9c
later) A,B, C, D, and E =1.1c, 1.1c, 1.1c, 1.3c and 1.2c
Comparison between earlier and later only using A, B, C results in no temperature change. (1.1c v 1.1c)
Comparison between earlier and later using all available temperature profiles result in slight warming. (1.1c v 1.2c)
SonicsGuy August 27, 2014 at 7:04 pm
What conclusion about a global hiatus can drawn from only one-half of the Atlantic, and only to 700 meters?
PS: Seven of eight datasets say there is no hiatus.
———————————————————————————————————–
Based on the recent paper with the latest excuse stating the missing heat was suppose to be in the North Atlantic depths this doesn’t support it. Hence why I linked this, but forgot to link the global one also which does show a little warming very recently.
http://climate4you.com/images/NODC%20GlobalOceanicHeatContent0-700mSince1955%20With37monthRunningAverage.gif
Seven out of the eight data sets I linked before show the opposite of your conclusion from the ARGO time period. (ie one of eight show no hiatus)
Already described before why down to 700m because until ARGO has full distribution of temperature profiles then 1000m and below is not worth using. Before Argo it was like using two temperature profiles for the entire USA up to 2000m ASL.
@ Phil.: August 28, 2014 at 7:04 am
“The mining of coal and drilling for oil and gas and their subsequent combustion introduces previously sequestered Carbon in the form of CO2 into the atmosphere ….. ”
———————–
Phil, it appears that you have INTENTIONALLY neglected to specify what “triggers” your aforesaid subsequent “combustion” ……which I SPECIFICALLY asked you to do.
Maybe you should “focus” all your brain power on what it was that “triggered” the microbial combustion (oxidation) of previously sequestered Carbon (dead biomass) in the form of CO2 into the atmosphere ……. given the FACT that it produces/generates like 20 times more CO2 than does the “combustion” of fossil fuels.
And ps, Phil, the CO2 emissions resulting from the COMBUSTION of fossil fuels are so miniscule that they CAN NOT BE detected or determined in the daily, weekly, monthly or yearly Mauna Loa measurements of atmospheric CO2 ppm quantities.
But iffen you think otherwise, here is the “link”, to wit: ftp://aftp.cmdl.noaa.gov/products/trends/co2/co2_mm_mlo.txt
to the Mauna Loa average “monthly” CO2 ppm quantities for the past 56 years ….. so that you can “point out” the human emissions resulting from the burning of fossil fuels.
And NO “weazelworded” obfuscations, …. tripe ….. or piffle, …… or any more of your “circular questioning” or “roundhouse tactics”, …. just list the “year/month” that said “detected” amount occurred.
SonicsGuy
August 27, 2014 at 2:50 pm
“Also, explain the TOA-observation of Earth’s outgoing spectrum:”
It appears a slam dunk – without a doubt, GHGs in the atmosphere intercept outgoing radiation. That indicates beyond a doubt that, all things being equal, some quantity of GHG in the atmosphere should increase temperatures at the surface beyond what they would be with no GHG.
However, this does not establish that increasing levels of a GHG will, at all times and all quantities, increase surface temperatures. The global sensitivity (secant line) may be positive, while the local sensitivity (tangent line) is negative (as in the plot).
To establish local increasance, you must show that incremental additions of GHG produce a corresponding incremental increase in surface temperatures. The last 18 years suggest that, in the present state of the Earth’s climate, that relationship fails. Indeed, if you look at history over the past century, there is no evidence whatsoever that increasing CO2 has any effect at all in the present climate state. Since at least 1900 (measurements rapidly become poorer before then), the average surface temperature has been composed of a steady trend plus an approximately 60 year cyclical component.
This pattern was established long before CO2 levels markedly increased, and is evidently therefore due to some other driver. The peak of the ~60 year cyclical component occurred right on schedule in the mid-2010’s. The likelihood is that the established pattern will continue, and I predict that future temperatures will evolve something like this. All without any apparent dependency on CO2 concentration.
gary gulrud August 28, 2014 at 8:33 am
“Your mistake is to refer the emissivity of CO2 for all wavelengths, in the absorption band, 10-15 microns it’s close to 1 as would be expected from Kirchoff’s law.”
Completely false. By Kirchoff’s law, absorption precisely equals emittance.
Not true, Kirchoff’s law states that emissivity=absorptivity!
Gibberish omitted.
As indicated, bond-vibrational energy is latent kinetic energy and not an electron raised to a higher orbit, and therefore has a much extended time of interaction.
A point I have made many times here, I’ve not referred to electronic orbitals so I don’t know where you pulled that one from.
Your explanation is uneducated and fabulist.</em.
No, it's accurate
Trapping results on absorption because the kinetic energy is transferred to the surrounding gas which does not emit at the 10 micron wavelength.
As pointed out many times collisional energy transfer predominates in the lower troposphere whereas radiation predominates at high altitudes where the mean time between collisions is greater allowing sufficient time for the loss of a photon.
“Trapping results on absorption because the kinetic energy is transferred to the surrounding gas which does not emit at the 10 micron wavelength.”
It isn’t one-way. The surrounding gas can also transfer its kinetic energy to unexcited GHG molecules, which can then radiate that energy away, providing cooling. Which effect dominates depends inter alia on the relative concentrations, energy levels, and surface radiative input.
There are many ways to short-circuit this comic book sketch of one potential outcome of the melange. However, the running experiment, in which no effect on surface temperatures from rising CO2 is observed over the past century, argues this is not the outcome for the Earth in its present state. Doubly so for the past 18 years, in which we have seen no increase in surface temperatures at all, despite a sum total output of fully 30% of the sum total of CO2 produced by human industry since the dawn of the industrial age.
Discounting as gibberish that which you do not understand is the end of AGW. It should be plain that a quantum mechanical interaction does not change its spots because one looks at it alone. Your discrete spectral emissivity has no scientific foundation whatever.
“No, it’s accurate”
You are simply a congenital prevaricator.
Samuel C Cogar August 28, 2014 at 7:25 am
@ Phil.: August 27, 2014 at 1:37 pm
“Who’s speculating? I’m talking about the science.
CO2 has everything to do with it, …..”
———————–
“NO”, Phil, you are talking trash.
Iffen CO2 had all the “magical” properties that you claim it does …… then the US Federal Government would be DEMANDING that it be used as an “insulation” product to be “installed” in the walls and ceilings of all homes and businesses, ….. thus saving the owners of said homes and businesses thousands of dollars in their yearly energy costs.
We’re talking about heat loss from a planet which can only be by radiation, not heat loss from a building.
I don’t see any government mandating hermetically sealed double walls and ceilings pressurized to 1500 psi either!
dbstealey August 27, 2014 at 2:34 pm
Hanzo says:
“Something” is making Venus hot.
Yes. “Something”.
What is that ‘something’?
It is certainly not CO2, because CO2 canot have that effect:
It certainly can, especially when the concentration is about 250,000 times higher on Venus, and all the pressure broadening that I’ve explained to you.
Bart August 27, 2014 at 1:13 pm
“pCO2 is linearly related to the cumulative fossil fuel emission, the temperature effect is a minor modulation due to the Henry’s law coefficient variation etc.”
Quite impossible, given the data.
Try plotting it you’ll find it’s not impossible!
“… so sealey’s claim that it’s high temperature is due to it’s proximity to the sun is refuted.”
But, your argument was still non sequitur. Hey, you wrote it in haste. No big deal.
Is there any subject you know something about?
As stated because of its high albedo less solar radiation enters the Venusian atmosphere than the Earth’s, therefore the elevated temperature of Venus is not due to its proximity to the sun. Due to the increased opacity of the atmosphere to IR the radiational heat loss rate is much reduced leading to the higher temperature.
“Try plotting it you’ll find it’s not impossible!”
I did. It is. Atmospheric CO2 is diverging from emissions, while hewing to the integral of temperature.
“As stated because of its high albedo less solar radiation enters the Venusian atmosphere than the Earth’s, therefore the elevated temperature of Venus is not due to its proximity to the sun.”
No, that is not what you stated. You stated
At best, this would argue that Venus would have (2/3)^0.25 = 0.9 of the temperature of the Earth. And, that is only under the assumption that the albedo is independent of temperature.
Nope, sorry. This is beyond your level.
Here is what it looks like without the “derivative”
http://www.woodfortrees.org/plot/esrl-co2/from:1979/mean:12/offset:-380/plot/uah/from:1959/scale:0.22/offset:0.14
And, that is the wrong relationship.
If you want to look at it in that domain, here is the proper relationship.
[Snip. Invalid email address. ~mod.]
Again, nope, sorry.
Bart August 28, 2014 at 12:27 pm
“Try plotting it you’ll find it’s not impossible!”
I did. It is. Atmospheric CO2 is diverging from emissions, while hewing to the integral of temperature.
No you didn’t, read the post again!
It’s impossible, Phil. You cannot filter out the trend in temperature. Nature has no way of doing that and, if it could, which it can’t, it would leave telltale phase distortion, of which there isn’t any.
How long will it take for you to see the light? If emissions keep accelerating (which they will), and temperatures decline (which is already underway), the gap between virtual accumulated emissions and actual concentration is going to become very large in the not-too-distant future, with the former showing a distinct positive curvature, and the latter a distinct negative. At what point, I wonder, will you throw in the towel?
I’ve been pointing out this relationship for years now, and you’ve been arguing against me for years now. I predicted the temperatures would decline with the natural ~60 year cycle, and that CO2 rate of change would level off, both of which have come to pass. Do you really want to continue betting against me all the way to the bitter end?
Bart August 28, 2014 at 2:15 pm
It’s impossible, Phil. You cannot filter out the trend in temperature. Nature has no way of doing that and, if it could, which it can’t, it would leave telltale phase distortion, of which there isn’t any.
There’s no need to, the overall growth in pCO2 is so much greater than the change due to temperature that the temperature effect is just a small modulation superimposed on the overall change. (after all that’s why you detrend the data before you make your misleading graphs)
Ferdinand has been pointing this out to for years.
How long will it take for you to see the light? If emissions keep accelerating (which they will), and temperatures decline (which is already underway), the gap between virtual accumulated emissions and actual concentration is going to become very large in the not-too-distant future, with the former showing a distinct positive curvature, and the latter a distinct negative. At what point, I wonder, will you throw in the towel?
For that to happen would require a huge change in temperature, which even your crystal ball doesn’t foresee.
I’ve been pointing out this relationship for years now, and you’ve been arguing against me for years now. I predicted the temperatures would decline with the natural ~60 year cycle, and that CO2 rate of change would level off, both of which have come to pass. Do you really want to continue betting against me all the way to the bitter end?
You were wrong then and you’re wrong now, just as you were on turbulent mixing in the boundary layer last week.
“…after all that’s why you detrend the data before you make your misleading graphs…”
I don’t detrend any data. What are you talking about?
[Snip. Invalid email address. ~mod.]
No, using the derivative function takes the derivative of the data. The derivative maps 1:1 to the overall concentration modulo an integration constant. Since anthropogenic emissions have not been constant, they account for the integration constant.
Since anthropogenic emissions have not been constant, they cannot account for the integration constant.
[Snip. Invalid email address. ~mod.]
No, Edward, that is not at all what is happening. The linear trend component remains, but becomes a constant offset. The rate of change of atmospheric CO2 is proportional to temperature relative to a particular baseline temperature. We find that baseline temperature by comparing with the offset in the rate of change of CO2.
The model is
dCO2/dt = k*(T – To)
where To is the offset temperature, and k is a coupling factor. This is a first order expansion of the true relationship over a limited timeline. We do not know how long the timeline lasts over which the equation should be accurate, we only know that it is remarkably accurate over the past 56 years, since reliable measurements of atmospheric CO2 became available, and over which time the greater part of the modern rise is observed.
To fit anthropogenic additions in, we would have to decrease the k factor, but there is little room to do that and maintain a match with the higher order variability in the data. Hence, anthropogenic emissions cannot be a significant driver of atmospheric levels.
[Snip. Invalid email address. ~mod.]
Edward Richardson:
I believe you are confusing the global temperature with the time average of the global temperature once again. The “T” in Bart’s model is the global temperature while your “T” is the time average of the global temperature.
[Snip. Invalid email address. ~mod.]
@ Phil.: August 28, 2014 at 11:31 am
“We’re talking about heat loss from a planet which can only be by radiation, not heat loss from a building.”
————————–
“NO”, we are talking about the near-surface “warming” effect of “greenhouse” gases …… so quit trying to “change the subject” to better serve your “trash talking” crapolla.
“DUH”, the top of atmosphere (TOA) heat loss from a planet via radiation is in FACT a ”global cooling” function/process. And the 2nd FACT-of-the-matter is, …. no one really give a crap about that TOA heat loss of the earth …… any more than they care about the heat loss at the South Pole in Antarctica.
When the air temperatures are -60 C or greater at the surface in Antarctica and/or at the top of the troposphere, …… but only -20 C or less at the stratopause, ….. then who cares how much is being emitted (radiated) at the TOA (above the thermosphere). To wit:
http://www.windows2universe.org/kids_space/profile.jpg
Does anyone actually believe that the GREATER the “heat” radiation is at the TOA ….. the GREATER the “sucking” sound will be that is “sucking” the “heat” radiation out of the near-surface atmosphere?
“HA”, a belief in the existence of the Flying Spaghetti Monster is more sensible.
Anyway, Phil, iffen you are “talking” ……. “geenhouse” gases (CO2) and “burning” fossil fuels, …… then you are also directly “talking” heat loss from homes and building, …. regardless of whether it is the retention of said “heat” for warming purposes or the dispersal of said “heat” for cooling purposes. And both of said human perpetrated “heat” controlling functions are “energy intensive” …… and “energy intensive” infers fossil fuel “burning” and CO2 emissions.
So, Phil, best you explain to all your friends and neighbors exactly what this IR photograph is telling you about “heat loss” radiation from homes and buildings, to wit:
http://www.bbc.co.uk/schools/gcsebitesize/science/images/energy_saving_1.jpg
The “junk science” claims of CAGW are so intricately connected that they are akin to a “circular” row of Dominoes. All it takes is for one (1) of them to “fall” ……. and the remainder follows suite resulting in total collapse.
[Snip. Invalid email address. ~mod.]
Bart August 29, 2014 at 9:53 am
No, Edward, that is not at all what is happening. The linear trend component remains, but becomes a constant offset. The rate of change of atmospheric CO2 is proportional to temperature relative to a particular baseline temperature. We find that baseline temperature by comparing with the offset in the rate of change of CO2.
The model is
dCO2/dt = k*(T – To)
where To is the offset temperature, and k is a coupling factor. This is a first order expansion of the true relationship over a limited timeline. We do not know how long the timeline lasts over which the equation should be accurate, we only know that it is remarkably accurate over the past 56 years, since reliable measurements of atmospheric CO2 became available, and over which time the greater part of the modern rise is observed.
To fit anthropogenic additions in, we would have to decrease the k factor, but there is little room to do that and maintain a match with the higher order variability in the data. Hence, anthropogenic emissions cannot be a significant driver of atmospheric levels.
Incorrect as always Bart.
As your own graphs show you can only fit the temperature effect to the CO2 if you remove a large constant term from the slope.
A more correct model would be:
dCO2/dt = k1(dCO2ff/dt) +k2*(T – To)
Where k1(dCO2ff/dt) is the larger term, this is what the real world data shows us for annual data.
No, Phil. This is only the effect of the baseline temperature anomaly. It is true that this is an arbitrary parameter to fit, but there is also a slope in temperature, which is not arbitrary and cannot be removed.
That term matches the slope in dCO2/dt with the same scale factor with which the variations are matched. And, what that means is that there is no room for a significant effect from your dCO2ff/dt, because it also has a slope, and the slope is already accounted for by the temperature relationship.
[Snip. “beckleybud” sockpuppet. Banned. ~mod.]
pyromancer:
Can you provide specifics on how Phil has obliterated Bart’s post on this particular topic?
pyromancer,
We are always amused by assertions from the peanut gallery.
But if you want to be taken seriously, show where Bart is wrong. If you can.
Snip. Sockpuppet. ~ mod.
Snip. Sockpuppet. ~mod.
pyromancer76@gmail.com
No, that is not the argument. Please do not interfere and pollute the discussion until you do understand it. This is not high school. We do not need cheerleaders.
[Note: This sockpuppet is “H Grouse” and “beckleybud”. He has been banned multiple times. ~mod.]
Phil:
Let me attempt once more to explain this simply. Your having written this equation may help.
dCO2/dt = k1(dCO2ff/dt) +k2*(T – To)
There is a value for k2 which, with k1 set to zero, very capably fits the data. That value of k2 reproduces both the slope and the variability which match very closely.
If we boost the value of k1 to anything significant, we will have to decrease the value of k2 so that the slope will still match. If we do that, the variability will no longer match.
Note that this argument does not depend on the baseline anomaly offset. We would expect an offset, since the baseline chosen by the record keepers is arbitrary, and the odds are well against it being the precise value needed. But, that offset is, indeed, tunable. If that were all I had to go on, your argument would be apposite.
However, that is not all there is. We have to match both the slope, and the variability. The simplest way to do that is to choose k2 appropriately, and set k1 to zero. Occam’s razor alone therefore argues that this is very likely the answer. Beyond that, it is very typical behavior for a feedback loop, to suppress disturbances from the enforcement of the equilibrium condition. It is so typical that, this is almost surely what is happening.
Once again, everything is trending my way, and you are on the defensive. Emissions are accelerating. Atmospheric concentration is not. And, the lull in atmospheric rate of change matches the lull in temperatures. You would be well advised to rethink your position, before it comes tumbling down on top of you. Because, it is abundantly clear at this time that it will.
With only two adjusted parameters in this model, the projected temperature from Bart’s model matches the observed temperature with little error. Good job Bart!
The next step toward the development of a scientific model would be to determine whether the predicted relative frequencies of the outcomes of the events underlying this model match or fail to match the observed relative frequencies. Here we are hampered by the fact that these events do not exist.
gary gulrud August 28, 2014 at 2:16 pm
Discounting as gibberish that which you do not understand is the end of AGW.
Really, well that isn’t the case here because I understand the subject well enough to have taught it at the graduate level. However in this case there was no use discussing it with you since you couldn’t even get the definition of Kirchoff’s law right!
It should be plain that a quantum mechanical interaction does not change its spots because one looks at it alone. Your discrete spectral emissivity has no scientific foundation whatever.
More nonsense I’m afraid. The spectral emissivity is defined as the ratio of the spectral radiance emitted at a wavelength λ, to the spectral radiance at that wavelength emitted by a black body.
Bart September 2, 2014 at 7:43 pm
Phil:
Let me attempt once more to explain this simply. Your having written this equation may help.
dCO2/dt = k1(dCO2ff/dt) +k2*(T – To)
There is a value for k2 which, with k1 set to zero, very capably fits the data. That value of k2 reproduces both the slope and the variability which match very closely.
If we boost the value of k1 to anything significant, we will have to decrease the value of k2 so that the slope will still match. If we do that, the variability will no longer match.
That’s a problem of your model, you still ignore the Physics of the problem which is the known sensitivity of CO2 to T, to explain the annual growth in CO2 (~2ppm) by temperature increase alone would require a year on year growth of about 0.25ºC. that is an increase of about 4ºC over the last 16 years! I think we all know that that hasn’t happened.
However, that is not all there is. We have to match both the slope, and the variability. The simplest way to do that is to choose k2 appropriately, and set k1 to zero. Occam’s razor alone therefore argues that this is very likely the answer.
No, Occam’s razor says: “Entities should not be multiplied unnecessarily”, it does not say one should remove known parameters.
We know that there is an excellent linear correlation between pCO2 and cumulative FF emissions, you are not justified in arbitrarily ignoring it.
http://www.ferdinand-engelbeen.be/klimaat/klim_img/acc_co2_1900_2004.jpg
Since there has been a year on year growth in CO2 since 1960 your fit implies that To is rather low, what value do you use?
“…you still ignore the Physics…”
No, you are ignoring the data in favor of your pet hypothesis. Data are supreme. You have to fit your theory to the data, not the data to the theory. The data tell us the relationship in the modern era is well modeled by
dCO2/dt = k*(T – To)
Now, take that as your starting point, and then form your hypothesis for why.
“No, Occam’s razor says: “Entities should not be multiplied unnecessarily”, it does not say one should remove known parameters. “
It is not a “known parameter”. You are begging the question.
“We know that there is an excellent linear correlation between pCO2 and cumulative FF emissions, you are not justified in arbitrarily ignoring it.”
It’s a lousy fit, as is seen in the rate of change domain, where the variations do not match, and the long term evolution is diverging. Emissions are accelerating. Concentration isn’t.
“Since there has been a year on year growth in CO2 since 1960 your fit implies that To is rather low, what value do you use?”
You can see it in the plots. E.g., for the UAH data set, I’ve set
dCO2/dt = 0.22*T + 0.14 = 0.22*(T – (-0.63))
To = -0.63
That’s about how much the temperatures have changed since the previous temperature stall starting in about 1945, so not all that much.
I’ve been trying to follow this discussion which appears to attempt to design a model that relates CO2 with temperature. I may have missed key elements of the discussion, but I didn’t see any reference to the feedbacks present in the ‘real’ climate system, like water vapor feedback. In any case, the software depicted in the above video link might be of interest.
Hanzo
No, you are ignoring the data in favor of your pet hypothesis. Data are supreme. You have to fit your theory to the data, not the data to the theory.
Exactly, which is why your pet hypothesis of complete dependence on temperature has to be rejected.
The data shows that during the 90s the ocean absorbed a net ~2.0 PgC/yr, not the temperature dependent outgassing you propose. As Ferdinand has repeatedly told you the data shows that pCO2 increases by ~8ppm for a 1ºC temperature change, your fit requires a much larger coefficient than is observed. So as I pointed out and you ignored: “you still ignore the Physics of the problem which is the known sensitivity of CO2 to T, to explain the annual growth in CO2 (~2ppm) by temperature increase alone would require a year on year growth of about 0.25ºC, that is an increase of about 4ºC over the last 16 years! I think we all know that that hasn’t happened.”
Finally the data shows that there is “an excellent linear correlation between pCO2 and cumulative FF emissions”
In a vain attempt to counter this you do a bait and switch and plot the time dependence of monthly dpCO2/dt and annual emissions due to fossil fuels (not the same thing). The annual data is available why not use it? As explained to you multiple times the growth in pCO2 is not solely due to a single parameter as you appear to think, the major growth is due to FF emissions with modulation by Temperature variation so a matching between T and fluctuations in CO2 is to be expected but the total growth can not be just to T, the data doesn’t allow it.
To make matters worse your fit is not what you claim it to be:
You can see it in the plots. E.g., for the UAH data set, I’ve set
dCO2/dt = 0.22*T + 0.14 = 0.22*(T – (-0.63))
Where you use the monthly T anomaly rather than the actual temperature, why would you expect that to relevant? To get a decent fit between monthly data you’d have to include the seasonal change too (~2ºC).
“The data shows that during the 90s the ocean absorbed a net ~2.0 PgC/yr, not the temperature dependent outgassing you propose.”
The data show no such thing. Again, you are begging the question.
“Ferdinand has repeatedly told you the data shows that pCO2 increases by ~8ppm for a 1ºC temperature change…”
Ferdinand is wrong. The sensitivity is in ppmv/unit-of-time/ºC. That is an empirical fact. Why you (and Ferdinand) cannot wrap your head(s) around this simple observable fact, I have no idea.
“Finally the data shows that there is “an excellent linear correlation between pCO2 and cumulative FF emissions”
It’s a lousy fit, as I stated. It’s basically an observation that two series which are dominated by linear trends over the time interval examined are approximately affinely similar. That isn’t even noteworthy. Indeed, it is a tautology. To get the evidence to convict, you have to examine the fingerprints. And, the fingerprints for the anthropogenic culprit do not match. Those for temperature do.
Indeed, even the superficial match of low order polynomial behavior between virtual accumulation of emissions and measured concentration is currently diverging from affine similarity. Which is why, I suspect, that you cut off the data at 2004, fully a decade ago.
“…you do a bait and switch and plot the time dependence of monthly dpCO2/dt and annual emissions due to fossil fuels (not the same thing).”
This is getting bizarre. Annual emissions are a rate of change in units of mass per year. If I take yearly dCO2/dt, it shows the current lull even more distinctly.
“As explained to you multiple times…”
As you asserted multiple times. Your assertions are wrong. The data prove it.
“To get a decent fit between monthly data you’d have to include the seasonal change too (~2ºC).”
Not when the CO2 data are smoothed over twelve months.
This isn’t even remotely a close call, Phil. In years ahead, you will be embarrassed you took such an adamantly wrongheaded position. On the bright side, you’ll have plenty of company in the dunce corner. Since you have nothing new to add, show no indication of having given thought to the argument, and insist on repeating assertions without foundation, I see no further benefit to continuing this conversation.
Bart September 4, 2014 at 12:10 pm
“The data shows that during the 90s the ocean absorbed a net ~2.0 PgC/yr, not the temperature dependent outgassing you propose.”
The data show no such thing. Again, you are begging the question.
Indeed they do, for example:
M. Battle, M.L. Bender, P.P. Tans, J.W.C. White, J.T. Ellis, T. Conway, R.J. Francey
Global carbon sinks and their variability inferred from atmospheric O2 and δ13C
Science, 287 (2000), pp. 2467–2470
R. Keeling, S.C. Piper, M. Heinmann
Global and hemispheric CO2 sinks deduced from changes in atmospheric O2 concentration
Nature, 381 (1996), pp. 218–221
Takahashi et al.
Deep Sea Research Part II: Topical Studies in Oceanography
Volume 49, Issues 9–10, 2002, Pages 1601–1622
“Ferdinand has repeatedly told you the data shows that pCO2 increases by ~8ppm for a 1ºC temperature change…”
Ferdinand is wrong. The sensitivity is in ppmv/unit-of-time/ºC. That is an empirical fact. Why you (and Ferdinand) cannot wrap your head(s) around this simple observable fact, I have no idea.
Because it’s not true, read up on Henry’s law some time.
Indeed, even the superficial match of low order polynomial behavior between virtual accumulation of emissions and measured concentration is currently diverging from affine similarity. Which is why, I suspect, that you cut off the data at 2004, fully a decade ago.
No that’s the sort of trick you resort to, I just linked to Ferdinand’s plot. Here’s a plot of data up to 2013:
http://www.moyhu.org.s3.amazonaws.com/misc/ghg/m3.png
even better fit if land use change is incorporated too:
http://www.moyhu.org.s3.amazonaws.com/misc/ghg/m2.png
“As explained to you multiple times…”
As you asserted multiple times. Your assertions are wrong. The data prove it.
Actually the data is on my side as shown above.
“To get a decent fit between monthly data you’d have to include the seasonal change too (~2ºC).”
Not when the CO2 data are smoothed over twelve months.
So why do you use the unsmoothed monthly T anomaly in your equation for the smoothed CO2 data?
You take the monthly ML CO2 data, do a 12 month smooth of it and then take the derivative and plot it against the monthly UAH T anomaly (i.e. a sin term corresponding to the seasonal cycle has been subtracted).
You are not treating the fluctuations in the two quantities in the same way, why not detrend the CO2 and then subtract the seasonal cycle from it?
Since you have nothing new to add, show no indication of having given thought to the argument, and insist on repeating assertions without foundation, I see no further benefit to continuing this conversation.
Declaring victory and running away, a sure sign of a lost argument. Come back when you’ve learned something about the data and physics of the problem.
“Indeed they do…”
To the degree they are inferred from proxy measurements, they represent dozens of assumptions piled on top of one another. To the degree they rely on the predetermination that humans are driving atmospheric CO2, they are begging the question.
The direct measurements of CO2 since 1958 and temperatures in that interval contradict it.
“Because it’s not true, read up on Henry’s law some time.”
Wrong. You are imposing predetermined dynamics on the system. That is begging the question. You think that the dynamics ought to evolve according to Henry’s Law, but that is something that has to be confirmed. You cannot just assume it, and then proclaim it is so. This is a complex system. It does not have to behave as you think it should.
You must use the data to confirm your model, and in this instance, they disconfirm it. Your model is too simple, and does not match the behavior of this complex system.
“Here’s a plot of data up to 2013:”
And, as you can see, it is diverging from affine similarity near the end. If you plotted the data in the rate of change domain, you would see that the divergence is quite significant – emissions are accelerating, while concentration is not. Moreover, there is a better model which does not diverge at the end, and that is dCO2/dt = k*(T – To).
“…even better fit if land use change is incorporated too:”
If you torture the data, you can make it confess to any crime. The most direct, most modern, most reliable measurements confirm the dCO2/dt = k*(T – To) model.
“So why do you use the unsmoothed monthly T anomaly in your equation for the smoothed CO2 data?”
Because it is an anomaly, i.e., it has already had the periodic behavior smoothed out.
You’re clueless, Phil. Or, in denial. Or both. Haven’t we said all there is to say? You are arguing in circles, and refusing to deal with reality. What is the point of continuing?
This is no coincidence. You cannot refute it, so you turn a blind eye to it. Good luck with that. You are in for a rude awakening.
OMT: “…why not detrend the CO2 and then subtract the seasonal cycle from it?”
I do not want detrended CO2, I want the derivative. Subtracting the seasonal cycle out is a filtering operation. Averaging over 12 months is a filtering operation. Both filters squash the annual cycle. It really does not matter which you use. The WFT site allows easy yearly averaging, so I use it.
This is grasping at straws on your part. There is no legitimate different way of processing the data which will not lead to the same affine match between the rate of change of CO2 and temperature anomaly.
Bart. could you re-draw your graph using absolute T instead of an anomaly? It might make the relationship clearer.
It is the deviation from normal which drives the phenomenon.
You full well know that the “normal” used in the calculation of the anomaly is bogus.
I would need a clearer statement before agreeing or disagreeing. Let me replace “normal” with “pre-existing conditions”, and hopefully that will addresses your concern. Otherwise, you are going off on a tangent in which I am not interested.