 The peak of the Atlantic Hurricane season is rapidly approaching. See the NOAA Hurricane Climatology graph to the right. (Give it a click for a full-sized version.) Hurricane frequency tends to peak in mid-September.
In the May 2014 post Hurricane Development Region Sea Surface Temperature Anomalies as We Start the 2014 Season, we presented sea surface temperature anomalies for the Main Development Region (10N-20N, 80W-20W) and for the Gulf of Mexico (21N-31N, 98W-81W) in 3 formats: (1) monthly long-term (1854 to present), (2) monthly satellite-era (1981 to present) and (3) weekly satellite-era (1990 to present). In this post, we’ll only update the weekly data, and we’ll add the data for the Caribbean (10N-20N, 84W-60W) and the Extratropical Eastern Coastal Waters of the United States (24N-40N, 80W-70W). (A map showing where those regions are located is included as the final illustration.)
SEA SURFACE TEMPERATURE CLIMATOLOGIES FOR THE FOUR REGIONS
First, before we look at the anomaly data, I don’t believe I’ve ever presented how the sea surface temperatures for those regions normally vary throughout a year.
Figure 2 presents the average monthly sea surface temperatures, over the course of a year, for the base period of 1971 to 2000, which is the base period used by NOAA for its Reynolds OI.v2 dataset. In other words, they are the reference temperatures—the “normals”—from which anomalies are calculated. Sea surface temperatures (not anomalies) for the Main Development Region and the Caribbean normally peak in September and October. And the surface temperatures of the Gulf of Mexico and the Extratropical Eastern Coastal Waters of the United States normally peak in August.

Figure 2
I’ve included a red horizontal line at 26 deg C, which is considered the sea surface temperature needed for hurricane development. (I’ve also seen 26.5 deg C discussed.) Normally, the surface temperatures of the Main Development Region and the Gulf of Mexico reach that threshold about the beginning of May, while the Extratropical Eastern Coastal Waters don’t normally cross the threshold until June. Sea surface temperatures in the Caribbean are normally above the threshold year round. Obviously, there are factors other than warm water needed for hurricane development.
WEEKLY SEA SURFACE TEMPERATURE ANOMALIES
For the week centered on Wednesday, August 13, 2014, the surface temperature anomalies for the Caribbean (Figure 3) are slightly above the 1971-2000 “normals”.

Figure 3
Gulf of Mexico waters, on the other hand, are presently towards the high end of their recent range of variability. See Figure 4. In addition to variations caused by weather, the weekly sea surface temperature anomalies there appear to also have a strong seasonal component.

Figure 4
And as shown in Figure 5, the most recent weekly sea surface temperatures of the extratropical waters off the east coast of the U.S. are also above the 1971-2000 “normals”, but not exceptionally warm. Then again, as we discussed after Sandy strolled up those waters back in 2012, the sea surface temperatures in that region have cooled (not warmed) since the great New England hurricane of the 1930s. See the posts here and here.

Figure 5
Last but not least, Figure 6, the sea surface temperature anomalies for the Main Development Region are below (not above) the normals for 1971-2000.

Figure 6
IMPORTANT CLOSING NOTE
Current sea surface temperatures (absolute) are capable of spawning hurricanes…a result of the normal seasonal change in surface temperatures. See the map in Figure 7. And while the recent El Niño conditions in the Pacific tend to suppress hurricane development by effectively chopping the tops off the developing hurricanes (the result of wind shear in the tropical North Atlantic caused by the El Niño), hurricanes can still form and will likely continue do so this season.
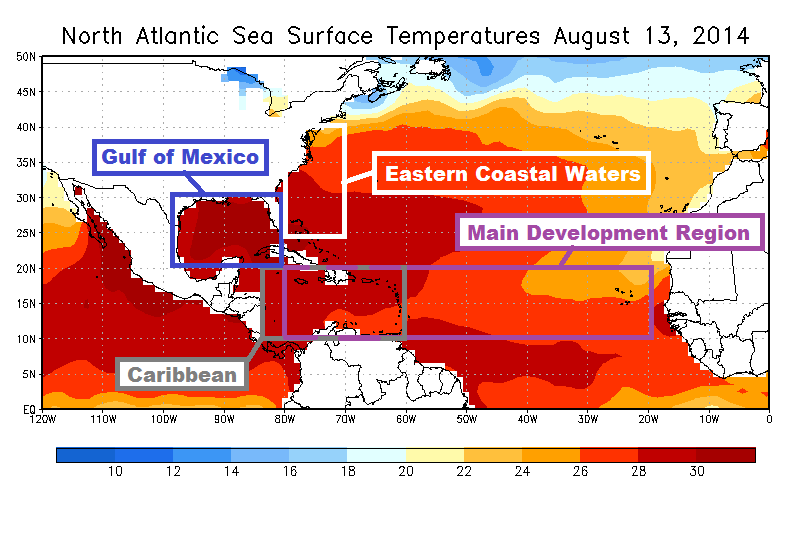
Figure 7
SOURCE
The NOAA Reynolds OI.v2 sea surface temperature data and maps are available in absolute and anomaly forms through the NOAA NOMADS website
ANDREW: Take a look … sudden larger swarm running full length
of fissure.
http://baering.github.io/
I have to wonder if eric holthause is eagerly watching for the next ‘kick ass’ hurricane.
Any body out there doing research on the correlation between dust from the Sahara and low Hurricane counts?
Bob, why are the anomaly graphs still using a base line of 1971 – 2000. That is outdated by now.
.
Is the Arctic atmospheric pressure a precursor of future hurricane activity?
Past data suggests that it could be.
Hurricanes vs. Arctic atm pressure
How does it work?
I have no slightest idea.
Coincidence then?
“Nothing in nature is by coincidence…something appears to be coincidence only because of our lack of knowledge.” Spinoza
Thanks, Bob. A very informative article.
Colorado State University Forecast of Atlantic Hurricane Activity from August 14-August 27, 2014 (.pdf, 14 August 2014) [two-week forecast]:
We believe that the next two weeks will be characterized by activity at below-average levels (less than 70 percent of climatology). The average ACE accrued during the period from 1981-2010 for August 14-August 27 was 12 units, and consequently, our forecast for the next two weeks is for less than 9 ACE units to be generated.
http://hurricane.atmos.colostate.edu/Includes/Documents/Two_Week_Forecasts/august_14_2014.pdf
And while the recent El Niño conditions in the Pacific tend to suppress hurricane development by effectively chopping the tops off the developing hurricanes (the result of wind shear in the tropical North Atlantic caused by the El Niño), hurricanes can still form and will likely continue do so this season.
Since good news are no news, i wonder how many people in the US are actually aware that American East Cost is currently experiencing the longest period on record without a major hurricane making landfall.
It’s been a while since i delved into the topic of what factors determine hurricane genesis, and more importantly hurricane track patterns.
This is one (of the many) papers, i found to be a good departure point for further research.
The average ratio between U. S. landfalling hurricanes and total hurricanes is about 25%. However, an active hurricane season does not necessarily mean more U. S. landfalling hurricanes because the hurricane track is determined by both the hurricane internal dynamics and large‐scale climate variations.
The 2010 Atlantic hurricane season had 19 named storms, 12 hurricanes, 5 major hurricanes and an ACE index of 166.3, all of which indicate that the 2010 season was extremely active. However, for the 2010 hurricane season, not a single hurricane made landfall in the United States.
In this paper, we mainly focus on the tropical cyclones (TCs) that formed in the MDR (main
development region) and investigate why and how an active hurricane season can occur without a hurricane to make landfall in the United States.
http://www.aoml.noaa.gov/phod/docs/Wang_etal_2011.pdf
Well, actually the peak of the hurricane season is approaching at the same speed it always does: one day every 24 hours or so.
Thanks for the update. Always interesting.
Tom in Florida says: “Bob, why are the anomaly graphs still using a base line of 1971 – 2000. That is outdated by now.”
That’s how NOAA presents the Reynolds OI.v2 data through their NOMADS website.
Moru H. says:
August 23, 2014 at 5:26 am
Any reader of this blog should know that. The most recent reference may be in yesterday’s http://wattsupwiththat.com/2014/08/22/antarctic-sea-ice-has-been-above-average-for-1000-straight-days/
As for everyone else in the US, very few know it.
Ric Werme says:
August 23, 2014 at 6:53 am
Yeah, i know and most readers of this or other skeptical blogs would at least be able to back up their statements with hard data. And yet, when the next major hurricane hits the east cost, which will inevitably happen sooner or later, the media will be full of reports linking it to climate change.
Sex sells, doom porn is no exception.
Is there a site where I can see sea surface temps plotted/displayed daily and current with regards to present time?
I had a link a couple of years ago but lost it due to computer crash. It may have been with the Naval Research Lab but I have not been able to locate it. My interest is following the SST drop in the wake of hurricanes.
Any assistance will be appreciated and likely interest other viewers here.
eyesonu says: “Is there a site where I can see sea surface temps plotted/displayed daily and current with regards to present time?”
Are you looking for maps?
http://wattsupwiththat.com/reference-pages/ocean-page/
Thanks Bob. I have viewed the WUWT reference pages. What I am looking for is the ability to zoom in to a particular region with much higher resolution. The link that was offered by a commenter on a thread here @ WUWT a few years ago was very informative and allowed the ability to track SST in the wake of Atlantic hurricanes. I think it allowed the ability to zoom in for a much higher resolution. Time frame of that thread was prior to the well known Irene.
Bob, in addition to the high resolution SST, I had a link (possibly at the same source) that would provide a high resolution image of sea surface currents, speed, and temp. By high resolution, I believe that it offered resolutions at less than 100 miles (?). I spent many hours viewing these.
Pencil and paper or other hard copies are the best source of reliable archives IMHO.
Bob, inspired by your research on ocean temperatures I have engaged my wife on a research trip to Bali to test the water temperature there. We are using the ‘skin contact method’ which entails making periodic trips to the beach for a hands-on investigation. This ‘skin contact’ approach uses sensation meaning the results are sensational and are not of the regular Celsius type.
In order to make a comparison with the Caribbean it will be necessary to make several extended visits to land-based observation sites in that region. I am thinking of applying for an NRC grant to support this new sensational measurement system and its novel metrics.
While I am here, and unlikely as I am ever to return, I am also testing Willis’ thunderstorm heat regulation hypothesis by carefully and patiently observing the development of late morning cloud cover using a regulation umbrella and beach towel which is repositioned on a regular basis, calibrated to the position of the sun.
I can report that on the first day of the expedition the consensus is that Willis is a genius. The sky was completely clouded over by 11:20 AM and this lasted for more than 2 hours. It had cleared completely by sunset, an event I photographed. I also made some mental notes for future reference.
I will be offering my services to Environment Canada in order to extend the research footprint, so to speak. As for results, it is much too soon to expect conclusions. Like Svensmark’s GCR hypothesis, it is going to take another five years of data collection which I and my friends are willing to do for a fraction of the cost of running CERN. We are both trying to answer the question, “Are sea surface temperatures cloud cover related? I am not sure, but early results are encouraging.
Bob, I located this from the NRL but is not the link that had in the past. http://www7320.nrlssc.navy.mil/GLBhycom1-12/skill.html
Information provided notes something about modeled data but I would assume that is should be a reliable representation of reality. The gif animation over the past 30 days appears to show a cooling in SST from one of the tropical storms in the eastern Pacific.
Not sure what other sources to search for to get the sites I had originally but will keep looking as time allows.
Vuk, looks like they are both responding to a common driver – quasi 60 year cycle, 0ne trefoil trip of the sun around the unmentionable barycenter.
eyesonu, I can recall the webpages you’re talking about, with the hurricane storm tracks sticking out like a sore thumb. I wanted to say it was the DMI website…
http://ocean.dmi.dk/satellite/index.uk.php
…but if it was them, they no longer provide those maps.
Somewhat OT for this thread but I was playing with nullschool wind/temp maps and clicked an area just to the north of hurricane Marie in the eastern Pacific and the temp was -2.9 C at 500 hPa which would be about 18,300 ft above mean sea level (msl) for dry air. According to the International Standard Atmosphere (ISA) and Pressure Settings the temp would normally reach a similar freezing temp around around 8,000 ft (+ or -) above msl. A difference of about 10,000 ft or double the height! Without the convection the temp would be in the range of -21.2 C @ 500hPa.
http://weatherfaqs.org.uk/book/export/html/174
http://earth.nullschool.net/#current/wind/isobaric/700hPa/overlay=temp/orthographic=-117.94,26.41,675
The power of convection in a storm to transport energy upwards if astounding.