There’s an information war on the recent Antarctic sea ice records
Guest essay by Frank Lansner
Today Cryosphere reports 2,112 million km2 more sea ice around Antarctica than normal.

Fig 1
Reality is that we right now have an area matching the size of Greenland of extra sea ice floating around Antarctica. The nightmare for the global warming believers is if the growing ice around Antarctica should be linked to cooling, and so:
1) Some Re-analysis papers and more have been made showing that the ocean around Antarctica is not cooling (as original data suggests) but is in stead warming fast.
2) Several mechanisms have been suggested to argue how come ice can grow so much faster when in fact the water is supposed to have warmed up.
Therefore in the following I will first (part 1) go through some data sources to evaluate if it’s cooling or not in the area of ice-formation around Antarctica, and then (part 2) I will go through the most frequent attempts to explain faster ice formation in supposedly warmer waters.
PART 1: ARE THE OCEANS AROUND ANTARCTICA WARMING OR COOLING?

Fig 2
The red box: I have inserted the red box 73S-63S 220W-50E because this area will be used in the following to evaluate the situation in the ice forming waters around Antarctica.
NOAA use a base period approx. 1983-1995 and they report that the waters around Antarctica today are colder than normal. In fact this is the case most of the time in the last decade in NOAAs graphics, especially in the zone where extra winter ice is being formed.

Fig 3
CMC Canada use base period 1995-2009, but still we see temperatures of the ice forming waters near Antarctica are lower than normal.
SST
NCDC ERSST v3b2

Fig 4
I use the KNMI online climate explorer to get data from the “red box” area 73S-63S 220W-50E, see fig 2.
HadISST1:

Fig 5
Fine agreement with NSDC.
TAO buoys surface air temperature:
[figure 6 was in error, and the error originated at KNMI, as you can see below and also in comments (h/t to Bob Tisdale for his interaction with KNMI to get to the root of the problem):

Bob Tisdale writes in email to me:
The problem was that Frank uncovered a problem with the KNMI Climate Explorer when he tried (and was successful) to extract what he thought was “TAO Air Temp” data for the Southern Ocean, from a dataset that only includes data for the tropical Pacific.
The data in Frank’s Figure 6 wasn’t data for the Southern Ocean, it was tropical Pacific data. That was the glitch at KNMI. I notified KNMI. They corrected the problem and we can only get data from that dataset at KNMI when the correct tropical Pacific coordinates are used…thus the error message you just got.
We hope to add a corrected graph from KNMI soon – Anthony]
Fig 6
Again, Cooling.
The SST´s and to some degree surface air suggest a drop in temperatures especially around 2008
TLT, Air temperature lower troposphere from RSS:

Fig 7
Data suggest some cooling, certainly not warming.
Thus it seems that recent years for the area of ice formation around Antarctica show:
A: Decrease in Sea surface temperatures
B: Decrease in Air temperatures
C: Growth in Sea ice
These observations are in compliance, I´d say generally in science you can hardly demand more solid evidence to support any conclusion.
* * * It’s getting colder around Antarctica and so the ice is growing * * *
PART 2: MORE ICE CREATION IN STILL WARMER WATERS?
None the less alarmist sites like “Skeptical science” in stead seem to disregard the above conventional data sources and use exclusively projects that somehow ends up showing warming around Antarctica.

Fig 8
Left: Zhangs Re-analysis ending in 2004. Right: NASA´s Earth Obs, ending in 2007.
Zhang achieves a stunning 4-5 K/century warm trend around Antarctica, and NASA perhaps a little less. Notice the “Horse shoe” shape on Zhangs illustration, left. This is the area that I have used for all graphs above. Right: NASA is using infared measurement of the very surface meaning that their data represents the extremely thin top layer ( 1 mm ? ) of the land or ocean surface. The so called “skin layer”.
Such an extremely thin skin layer is much more vulnarable to changes in precipitation or winds than any of the more conventional datasets I have shown in this writing, and the skin layer represents much less mass. More wind in an area of below freezing air temperature is likely to yield warmer skin layer due to mix with warmer water. Here are some attempts to explain matters as I have seen them in debates and on alarmist sites like “Skeptical Science”.
“More precipitation”
Since rain is ice- enemy number one, we will have to assume that this increased precipitation comes as (cold) snow?
In the Antarctic winter air temperatures are low. Snow landing on sea ice will opbviously insulate the ice from cold air temperatures. So how come more snow (precipitation) should increase sea ice areas?
The addition of fresh water should lower salinity and increase the freezing temperature of the water and thus create more ice. But can precipitation really change salinity notably in the deep ocean hundreds or thousands kilometers from the shore?
“Salinity”
The thing is, I don’t see many actual graphs of the salinity that is supposed to be decreasing fast in order to increase freezing temperatures notably.
If Salinity is really the key argument in explaining more ice growth combined with more heat, then why don’t we see several climate institutions focus on Salinity graphs?

Fig 9
From the KNMI online service it is actually possible to retrieve a salinity graph, “EN3”.
SSS = Sea Surface Salinity
The freezing point of water increase approx. 0,7 K per 1% fall in salinity.
From the Salinity data we learn that:
1) Variation is small: From 3,385 % to 3,399 %, that is 0,014 mass % over the years.
Not too surprising since we are in the middle of the deep ocean. Varitaion corresponds to a 0,01 K change in freezing point.
2) To explain MORE ice formation over the years we needed to see LESS salinity.
Problem is, the waters around Antarctica show increased salinity.
In other words:
Variations in salinity are TOO SMALL to even be considered in the first place.
And on top of this, waters are actually getting slightly more salty, thus lowering the freeze point a tiny bit. This would explain a tiny reduction in ice formation, not the opposite.
“The Ozone concentraion has declined”
Ozone concentrations has stagnated since the early 1990´ies.
But in recent years something changed.
KNMI MSR Ozone:

Fig 10
Since 2011 the ozone concentration has increased fast. The extra ice formations are sometimes explained with the drop in ozone concentration, but in recent years the development has reversed.
So in order to maintain ozone as an explanation for more ice around Antarctica you will have to claim that this effect of Ozone works whenever ozone concentrations make any change at all.
“The winds did it”
The supposed role of ozone is to trigger winds and the winds are supposed to be much stronger now when the ice area is growing faster.
So the explanation goes that even though we have a strong warming, and thus supposedly warmer waters around the Antarctic, then winds blow out ice from the Antarctic main land so that this ice will end up in waters that are quite warm. And then this ice is not melting fast as one might expect? I’m not sure if I got that explanation right…
Anyway if this was true we would see that and the ice was pushed out into warmer waters, and there would be no ice formation near the edge of the ice. In fact there should be at least some melting.

Fig 11
The illustration from NRL show actual temperatures and the question is: Are huge ice masses pushed out from the mainland Antarctica to be surrounded by warmer waters?

This color is zero degrees Celsius, so the ice is today clearly surrounded by waters well below zero degrees.
So at least at first glance the suggestion that ice is not formed on the edge but in stead being pushed out from land to warmer waters appears not supported, but what really we need is an investiagation that actually proofs or disproofs this idea and show a well supported estimate of how much ice is being formed this way.
Conclusion:
The conventional data sources like SST, MAT suggest that the bulk of the ocean surface mass is cooling in recent years accompanied by faster ice growth. Arguments based on Ozone or Salinity or precipitation appears not to be linked to the record levels of sea ice formation around Antarctica.
It is therefore fair to say the obvious:
* * * It’s getting colder around Antarctica and so the ice is growing * * *
I am developing my plans to kayak to the North Pole this September. If all goes well, I may plan to kayak to the South Pole when all of that polar ice cap is gone, as well.
* * * It’s getting colder around Antarctica and so the ice is growing * * *
I’m sorry, but that makes way too much sense and does not address whether the algorithm is working as designed.
It looks like I get to repeat it first: “But it’s rotten ice.”
* * * It’s getting colder around Antarctica and so the ice is growing * * *
Where’s the model to back this up?
“Since 2011 the ozone concentration has increased fast.”
Less active sun?
If ozone increases above the tropopause it will warm the lower stratosphere, push tropopause height down and force the climate zones equatorward leading to more meridional jets and middle latitude cooling.
And increasing Antarctic sea ice as the outward flowing cold winds reduce surface temperatures.
The Antarctic anomaly is presently at -3.45 here:
http://cci-reanalyzer.org/DailySummary/index_ds.php
UAH, version 5.6 came out yesterday, although nothing shows on WFT yet. It was interesting, but not unexpected for me that UAH went down from 0.327 to 0.303. However RSS went up from 0.286 to 0.345.
Please correct me if I am wrong about the reason. It is my understanding that RSS only goes to 70 degrees south, whereas UAH goes to 85 degrees south.
According to the above link, it has been brutally cold in the Antarctic lately.
I believe this brutally cold has been captured by UAH but not by RSS. Does this make sense?
* * * It’s getting colder around Antarctica and so the ice is growing * * *
In a world of some fields of Science degenerated enough to forget Occam’s Razor, it is so refreshing to see a simple model tying up cause and effect…
It appears that reality does not agree with the computer models.
How could reality be so wrong??? ;-))
Looks kinda like a hockey stick, doesn’t it?
When these pesky facts get in the way of the prevailing theory,they just modify the theory to suit the facts
Typo alert:
“Today Cryosphere reports 2,112 million km2 more sea ice around Antarctica than normal.”
That should be (according to the accompanying graph), a full stop / period, not a comma.
Clearly Frank has not tried hard enough to figure out why expanding Southern Ice is a validation of anthropogenic global warming.
I thought it was because the ice is sliding off of the land?…………….. 🙂
…good post Frank
And it looks like I get to repeat it second: “It was the wrong kind of snow.”
http://www.independent.co.uk/travel/news-and-advice/dont-blame-us-ndash-it-was-the-wrong-kind-of-snow-1847208.html
TheLastDemocrat says:
July 2, 2014 at 11:08 am
I am developing my plans to kayak to the North Pole this September. If all goes well, I may plan to kayak to the South Pole when all of that polar ice cap is gone, as well.
————————
I guess dragging a kayak over the ice could be considered kayaking.
It is all so logical, it is astounding that no one can catch onto a very simple principle.
At the north pole, when sea ice trends to diminish, that means it is a sign of global warming.
However, at the south pole, on the opposite side of the earth, sea ice is increasing. But since this is on the opposite end of the earth, increasing sea ice means that is a sign of global warming.
These are opposite poles you see, so the exact opposite trend means the same thing. It is all global warming!
Sheesh! (/sarc)
Just doesn’t fit the narrative, does it…
“There’s an information war on the recent Antarctic sea ice records”
There sure is.
The impartial BBC, famed for its unbiased Science/Environment reporting, launched its pre-emptive propaganda a fortnight ago:-
http://www.bbc.co.uk/news/science-environment-27831958
The land temperatures British Antarctic Survey from Mawson or Dumont d’Urville show no warming and even a slight cooling trend as I showed in the Emperor Penguin study

Ice ages are a consequence of global warming – its obvious (thats what they told me at Sks).
* * * It’s getting colder around Antarctica and so the ice is growing * * *
Gosh, that’s a bit embarrassing. The blindingly obvious….can’t have that!
Latitude says:
July 2, 2014 at 11:32 am
I see that “fact” thrown out all the time. I always point out that places like Vostok never get above the freezing point of water any time during the year (which is the case for the vast majority of the Antarctic continent), so how is ice supposed to melt? I’m told I have my facts wrong. Somehow. Facts are most of the time useless when trying to penetrate the mantle of belief so many people have pulled around themselves. To be honest, I no longer try. I just point out the facts and move on. Arguing with a true believer is like arguing religion. Pointless.
Oh come on … It’s so obvious. North Pole is at the top, South Pole is at the bottom … Ice is slippery… It slides downwards.
>> It’s getting colder around Antarctica and so the ice is growing * * *
> Where’s the model to back this up?
Reanalysis data is model data, tweaked by observations. Where there is very little observational data, such as around Antarctica, the model output overwhelms any of the actual observations.
Great analysis, by the way!
Another problem with the growing ice is that as we move from winter the earth gets closer to the sun with the southern hemisphere towards the sun reflecting more sunlight.
2 million km^2 can reflect a lot of W/m^2.
Can anyone say Hockey Stick curve?
Joe Public says:
July 2, 2014 at 11:30 am
Typo alert:
“Today Cryosphere reports 2,112 million km2 more sea ice around Antarctica than normal.”
That should be (according to the accompanying graph), a full stop / period, not a comma.
The comma is a continental European usage and in the context is the same as a decimal point as used in the US. I think SI specifies the “full stop” as used in the US, but many countries don’t follow that standard, any more than we use the metric system of measures commonly – i.e. for science and medicine but not much for personal or business. Remember, NASA managed to accidentally crash an “orbiter” into Mars because of an SI/SAE conversion hick-up.
phlogiston says:
July 2, 2014 at 12:09 pm
Ice ages are a consequence of global warming – its obvious (thats what they told me at Sks).
Then what are they worried about?
The well-known and linked phenomenoa of the bipolar seesaw and (inter hemisphere) heat piracy shouldn’t be forgotten when looking for explanations of Antarctic cooling.
Much of the NH warming over the last few decades, like the world’s economic growth over the same period, is not real, but borrowed.
It may be payback time. All that heat pirated from SH to NH may have to be returned – and then some.
At least Trenberth’s problem of the missing heat is solved. It’s the Antarctic that all that heat has gone missing from.
BTW if Antarctic ice growth has already engaged positive feedback through albedo, what will stop it?
Thanks Frank Lansner, Great Post.
@ Duster says: July 2, 2014 at 12:28 pm
“The comma is a continental European usage…..”
Via WikiP:- “The 10th resolution of CGPM in 2003 declared that “the symbol for the decimal marker shall be either the point on the line or the comma on the line.” In practice, the decimal point is used in English-speaking countries and most of Asia, and the comma in most of Latin America and in continental European languages.”
However the graph used to illustrate the point (no pun intended) uses the decimal point. This is an American site; written in English.
To avoid opportunities for misunderstanding – when in Rome etc.
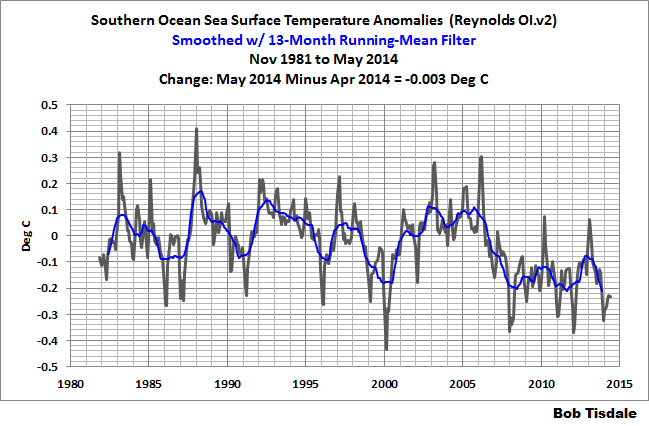
NOAA Reynolds sea surface temperature anomalies (rel to 1971-200) around Antarctica ( -73S to -63S, -180 to180) for the last decade:-
http://nomad1.ncep.noaa.gov/cgi-bin/pdisp_sst.sh?ctlfile=monoiv2.ctl&ptype=ts&var=ssta&level=1&op1=none&op2=none&month=nov&year=2004&fmonth=jun&fyear=2014&lat0=-73&lat1=-63&lon0=-180&lon1=180&plotsize=800×600&title=&dir=
It’s cool down there and has been for most of the last decade.
Difficult to deny the data and the subsequent logic.
Regarding:
“The addition of fresh water should lower salinity and increase the freezing temperature of the water and thus create more ice.”
Should this not read “decrease the freezing temperature? If so, there is also a problem with a sentence under the next header. A reduction in salinity lowers (decreases) the freeze point.
Nothing to see here. ‘our algorithm is working as designed’
So, colder oceans produce more sea ice?
who knew?
Obviously not Sks. Perhaps if you sent them some stick men diagrams with “Mr Freeze” freezing some water they may get it. As a learning incentive we could offer them some stars for their “star chart” if they understand. : )
Isn’t total antarctic volume/m3 more important as an indicator than ice area?? Or at least as important, when looking at antarctic ice shouldn’t area and volume be looked at together to get a coherent picture?
By the way, thanks for explaining the difference between sea ice extent and and area. I would love to see more of these types of 101 explanations for those of us trying to following the science;
The science of half truths sums up a lot of what you see published in literature nowadays regarding the climate. There will almost always be experimental variables left out of the study. But the half truths seem to bring about a higher impact these days…. so why not report them as such? Basically, what I’m saying is…. the waters/surface surrounding Antarctica may be warming at an alarming rate (one half)…. at an approximately 1 millimeter slice of the waters/surface surrounding Antarctica. Lots of folks get caught up in the title and introductions…. and conclusions of these “science” papers. The only thing that has always interested me… and the only thing that should interest you…. is the methods section. but who really wants to read that? especially when we have this agenda to support?
That hockey stick will be useful playing on all that Ice
Ben Howison says:
“Looks kinda like a hockey stick, doesn’t it?”
I’ll second that!
Is this a first signal that it becomes colder? The increase of the last 3 years is impressive.
Note: This increase occurred even after NOAA changed the baseline period from 20 to 30 years. Since the Antarctic ice has been increasing for the last 30 years, the change decreased the anomaly by 150,000 to 200,000 km2. With no data manipulation the value would be 2.312 M km2.
Not to belabor the concept: Could it be the Sun? To make this easy lets call 1960 Solar Cycle [19] -> 100% and use the area [Summation of value times month] under UV measurements [or Sunspots measurements].
Peak Year
~1960 [19] -> 100%
~1970 [20] -> 50%
~1980 [21] -> 75%
~1990 [22] -> 75%
~2001 [23] -> 50%
~2012 [24] -> 30%
Antarctica has no land to protect it! The Arctic is essentially surrounded by land.
I am guessing this is a byproduct of mother of all teleconnections, As the North hemisphere loses ice at the pole some instantaneous property of the h2o molecule causes its linked molecule in the Southern hemisphere to freeze. Doesn’t seem to matter if the first molecule melts or sublimates the teleconnection shifts the ice from pole to pole. Probably a byproduct of subatomic matter.Seems relatively obvious. At some point the teeter totter should reverse. /SARC
In the desert where I live, we have time at the extremes of cold and hot to contemplate things like this. By the way, teleconnections are talked about by people with straight faces when they are discussing hurricanes and tropical cyclones, so some think these connections actually exist.
There is a “theory” of ice cream ball.
When it melts, it spreads around.
They mean, Antarctics is the “ice cream ball”.
The record ice spread is an omen of melting Antarctics.
Or it could be getting less saline around the Antarctic and so the ice is growing.
I know of no microbe that eats sodium and chloride and so locks up the salinity… but it must exist (else warming is not happening) so please fund my research project to go find it.
on the Zhangs Re-analysis and NASA´s Earth Obs charts: how in the 7 hells to they have a resolution of 1/100th a degree C? if they had a more believable number, like 0.5 C, the only color they would show is white (for no change).
they also avoid mentioning that none of those minuscule changes will get the temps above freezing
phlogiston
l thinking that the warming in the NH has reached its peak.
A clue to this is the lack of warming at the peak of summer in the high Arctic.
All the warming that has taken place up there has been during the winter half of the year. There seems to be something going on over the Arctic that is keeping a lid on the temperature during the summer peak.
Am wondering if there is a link between this and the increase in “night shining cloud” that has happened over the last few years. The increase in this type of cloud suggests that the high atmosphere over the Arctic circle is getting colder during the summer.
Now is it possible that this cooling of the high atmosphere is in some way also stopping the Arctic from getting any warmer during its summer peak.?
I’m not try to piss of Leif so I apologize ahead…. close your eye sir 🙂
hm….. not try to re-ignite the ‘Sun did it…’ war…… but, the TSI start decreasing around 2003-2005 by a small amount…. and the Fig 4 indicate very nicely that tiny amount of temp drop
Watts Up With That ??
The article points out that since 2011 ozone has risen fast. Note that mid 2011 was the last ‘normal’ low point in tha last 3 years. The trend has been steadily upwards since then. That period of 3 years is a completely unique pattern on the 34 year graph.
The satellites have it wrong. It’s really just pond scum on top of the boiling seas.
Frank Lansner, in your Figure 6, for a discussion of Southern Ocean marine air temperatures, you presented data from the KNMI Climate Explorer for the TAO project buoys. Are you aware that the TAO project data from KNMI only covers the tropical/equatorial Pacific? Read the header at the top of the “TAO air temp” “Field” webpage. They list the coordinates of the data there. They run from 8S-9N, and from 137E-85W. That’s the equatorial Pacific, not the Southern Ocean.
The KNMI Climate Explorer should not have presented any data for the coordinates you entered, so I’ll notify KNMI. Please correct your post.
BTW, that’s as far as I got with your post.
Regards
Excellent post that addresses all of the unicorn dung that I’ve been reading and hearing about why the world is getting warmer which should result in the Antarctic growing more ice. Nice to see the salinity argument debunked.
lt has to be alittle worrying for these who live in the SH if the Sea ice extend anomaly carries on with the steady rise that has been going on since 2011.
They must be wanting it to reach its peak pretty soon.
The notion that cold water caused this extra freezing has heat flowing in the wrong direction. Suggesting that cold ocean currents created the extra ice is like claiming that the boiling water in the pot caused the element to heat up on your stove. The poles are where the sea is cooled by the air and ice and by direct radiation to space and not the converse.
Incidentally this cold water then sinks and flows into the deep oceans which makes me ask whether this extra ice in the antarctic might not be cooling the deep oceans. When they send instruments down below 2km to look for Trenberth’s missing heat they may be in for a shock. Not only could his missing heat be missing, but it is entirely possible that there is a whole lot of hitherto unobserved cooling going on down there.
“Today Cryosphere reports 2,112 million km2 more sea ice around Antarctica than normal.”
should be…
“2,112 million km2 more sea ice around Antarctica than 1978-2008 mean”.
Not that either mean anything dire.
To put the ice in perspective in Antarctica: there are some places with more than 1,000 miles of sea ice to cross to get to land or ice shelf – that’s the same as Washington DC to Omaha in terms of distance.
Re: Stephen Wilde says, “…If ozone increases above the tropopause it will warm the lower stratosphere, push tropopause height down and force the climate zones equatorward leading to more meridional jets and middle latitude cooling. …”
That’s very interesting, because during the Ice Ages all climate zones were moved equator ward and the tropical freeze line was around 1 kilometre lower than today. Could that hint at a solar process? If you are correct I think it does.
Rob Ricket says:
July 2, 2014 at 12:55 pm
No; the original post is correct (I admit I did a double-take at the same point and had to re-read it). Fresh water has a higher freezing temperature than salt water, so lowering the salinity of water raises the freezing point, which means you need to pull out less heat to achieve freezing than with the same volume of salt water at the same temperature. This should lead to more ice.
Sea ice is an excellent proxy for temperature – especially year old sea ice. See this graph by Kenneth Fritsch
http://imagizer.imageshack.us/v2/1600x1200q90/842/7f1f.png
It is hard to deny that sort of correlation.
Actually, you may want to slide that graphic into the headpost.
Hi Bob, you write: “The KNMI Climate Explorer should not have presented any data for the coordinates you entered, so I’ll notify KNMI. Please correct your post. ”
Let me hear the outcome from KNMI. The data shown have some similarity to SST´s in the area, so please ask which data it is then that they have used.
K.R. Frank
Maybe due to increasing CO2 levels, water freezes at higher temperatures in the south pole, say, 10 degrees celsius.
/sarc
jlurtz says:
July 2, 2014 at 1:33 pm
“Note: This increase occurred even after NOAA changed the baseline period from 20 to 30 years. Since the Antarctic ice has been increasing for the last 30 years, the change decreased the anomaly by 150,000 to 200,000 km2. With no data manipulation the value would be 2.312 M km2.”
This is very valuable information, thank you very much Jlurtz. Can you possibly link to some more info on that change og baseline period and the consequences it had?
Its priceless that guys like you pics up these things so it is never forgotten. Bravo!!
K.R. Frank
REPLY: Why do you sign off as “K.R. Frank”, but put Frank Lansner in the name at top? Is one of these some sort of acronym or pen name. Please pick one name and stick with it. – Anthony
===============================================
I sure hope that this isn’t the beginning of another “Hockey Stick”!
(Maybe if we released mote CO2…..)
Try a thought experiment with air temp below the freezing point of sea water. As the water cools it becomes denser and sinks.I does not freeze. now throw in a 40 km wind creating white cap misting, and you have sea ice forming. If the wind blows the sea ice away from land it does not count. Blow it towards land and it counts. If the wind piles the sea ice from one area to another the number can go down. Increase the volume and the area/extent can go up or down,depending on the wind.Sea ice area and extent is more a proxy of the wind than temp. ice formation at minus 20 or minus 16 will be determined more by the speed of the wind and the height of the waves.
The Antarctic is clearly in denial.
Jeff Id says:
July 2, 2014 at 2:56 pm
Jeff: An excellent example of non-Mannian correlation.
Anthony, I understood ‘K.R.’ to mean ‘Kind Regards’….
…but already reports from the Citadel tell us the days grow shorter. The Starks are always right eventually – winter is coming. This one will be long, and dark things will come with it. And when winter does come…gods help us all if we’re not ready! -Maester Aemon
Steve and Anthony:
Yes, I use “K.R.” in stead of “Kind Regards” . Perhaps its more UK than US English?
REPLY: What got me confused is that your emails would sometime show up with the name “Frank Lansner (K.R. Frank” in the name for you – Anthony
Thanks Alan Watt,,,I have seen the light!
alex says:
July 2, 2014 at 1:35 pm
There is a “theory” of ice cream ball.
When it melts, it spreads around.
They mean, Antarctics is the “ice cream ball”.
The record ice spread is an omen of melting Antarctics.
=============================================
The problem with that is that water coming off the land were is fresh water. Which it is. Fresh water has a higher freezing temperature than salt water. In and Antarctic when fresh water flows into the salt water it freezes almost instantly. This is isn’t theory. Divers working below the ice have documented it on film. It is awesome to see it. http://www.youtube.com/watch?v=AG_tKT0xLJE
Here is a movie of Antarctic SST anomalies over the last year. It does look cool around the edges of the ice.
Joe Public says:
“The impartial BBC, famed for its unbiased Science/Environment reporting, launched its pre-emptive propaganda a fortnight ago:-
….
The sea is freezing less so more icebergs are battering the shores of the peninsula, smashing the creatures that live there.
http://www.bbc.co.uk/news/science-environment-27831958
”
Hmmm… Its just sad that medias and politicians generally have no clue that they play a role as “useful idiots”. Will they ever figure it out?
K.R. = kind regards.
Assuming there is an net annual albedo component term to triggering the end of an interglacial, it is a darned good thing we have not been seeing expansive sea ice in the NH the past few years.
At any temperature below freezing, with the relative humidity below 100%, ice will sublime directly to vapor and skip the liquid phase all together. That’s why ice cubes disappear from the ice tray in your freezer, even though the temperature is around 10F (or so).
Walter Allensworth says:
July 2, 2014 at 2:19 pm
“Excellent post that addresses all of the unicorn dung that I’ve been reading and hearing about why the world is getting warmer which should result in the Antarctic growing more ice. Nice to see the salinity argument debunked.”
Im very happy that you find this writing helpfull , and your point is exactly my motivation.
Antarctica is so terribly cold that a warming world should make it grow even if it stays the same temperature, just like a freezer ices up more in humid summers than in dry winters. This is well known in climate “science” departments but it’s not good for the public to know, you see.
It’s always nice to read one of Frank’s posts. We don’t hear from him often enough.
Soooo if the oceans around Antarctica cool then the sea ice will be reduced? Or will it increase and reduce at the same time? Hey, this is Climastrology for ya. But what about the air temperature?
CAGW has moved from the scientific & the political into the financial realm at BBC & most MSM:
AUDIO 18 MINS: 2 July: BBC Business Daily: Ed Butler: Future of Coal
There are dire warnings about the heating of the planet. Coal is a significant contributor to global warming. So what is the future of this increasingly controversial fuel?
BUTLER: IEA tells us it is time for a carbon tax.
***BUTLER quotes American writer, Upton Sinclair: “It is difficult to get a man to understand something, when his salary depends upon his not understanding it!”)
(BUSINESS ADVISOR- potential for 300 foot ocean rise, extenction of everything on the planet, this is based in history; so catastrophic, people say “i might as well live it up”)
BUTLER: what is the sensible, sane reaction to that?
(BUSINESS ADVISOR): first reaction is let’s have a drink til it’s over, but the sane reaction is to aggressively get off coal, natural gas, oil…go to nuclear, solar, wind & hydro, but we have to stop using fossil fuels. must avoid Easter Island’s fate.
BUTLER: 3 heavyweights from both sides of US political divide – Paulson, Bloomberg & Steyer, issued a major report last week…
11.35 Lord Nicholas Stern:
BUTLER: Stern says biggest cause for optimism over coal comes from China, which alone was responsible for burning 50 percent of coal through its power stations. he (Stern) told me things were changing there…should reach peak coal use in 10 years.
STERN climate fatigue is more in Europe than in US, must accelerate investment in renewables…
risks are bigger than we recognised in 2006 & some effects of CAGW are happening faster e.g. THE MELTING OF THE POLAR ICE…
http://www.bbc.co.uk/podcasts/series/bizdaily
But all the world’s best Climastrologists disagree with this illogical statement.
On the salinity issue, shouldn’t Greenland’s peripheral ice be growing too? Or is that warmcold salty lessmore?
>The problem with that is that water coming off the land were is fresh water. Which it is. Fresh water has a higher freezing temperature than salt water. In and Antarctic when fresh water flows into the salt water it freezes almost instantly.
This sounds absurd? Isn’t that sea ice shelf at least dozens of miles wide? How is the glacier ice melting during their winter when it’s well below freezing?
By the way the IPCC says that most of the models it uses project a decrease in extent. So those that provide excuses are at loggerheads with the IPCC. Even if the salinity argument is correct imagine what all that extra albedo is doing in the SH spring and early summer. They talk about Arctic amplification, so is this the reverse?
strawbale23 says:
July 2, 2014 at 1:11 pm
Isn’t total antarctic volume/m3 more important as an indicator than ice area?? Or at least as important, when looking at antarctic ice shouldn’t area and volume be looked at together to get a coherent picture?
Correct me if I’m wrong, but if extent and/or area is increasing, wouldn’t it’s volume also increase?
“…. 2,112 million km2 more sea ice around Antarctica than normal.”
WTF? Why is the 1979-2008 mean “normal” ?
Does that just happen to be the perfect ice area of SH when the earth is in equilibrium with nature and the universe?
This site has, for at least the last 5 years, been decrying the warmists saying the Arctic X million km^2 “below normal” . Now you are adopting the same nonsensical terminology.
“At any temperature below freezing, with the relative humidity below 100%, ice will sublime directly to vapor and skip the liquid phase all together. That’s why ice cubes disappear from the ice tray in your freezer, even though the temperature is around 10F (or so).”
And I thought they disappeared because I took them out and put them into drinks.
“It’s getting colder around Antarctica and so the ice is growing.”
Further evidence is given in the study below, showing that increases locally happened exactly where it got colder.
http://notalotofpeopleknowthat.wordpress.com/2013/08/17/study-finds-antarctic-sea-ice-increases-when-it-gets-colder/
Frank ´Lansner says: “The data shown have some similarity to SST´s in the area, so please ask which data it is then that they have used.”
Frank, you apparently did not comprehend my comment. The TAO project data you are looking at is for the tropical Pacific, not the Southern Ocean. The graph you presented includes data for the tropical Pacific only. If you had bothered to scroll down to anomalies when you created your Figure 6, this is the graph you would have seen:
It bears a striking similarity to an ENSO index, because it’s from the equatorial Pacific. But it bears no similarity–no similarity whatsoever–with the sea surface temperature anomalies for the Southern Ocean:
Goodbye, Frank. Please correct your error in your post.
they hinge their position on antarctic ice mass loss and GRACE, anything else is just explained away with hand waving. since GRACEs data is based on models of the southern oceans, they can produce whatever they want and claim it to be due to warming.. which isnt actually there in the real sst data.
“Greg Goodman says:
July 2, 2014 at 5:14 pm
“…. 2,112 million km2 more sea ice around Antarctica than normal.”
WTF? Why is the 1979-2008 mean “normal” ?
Does that just happen to be the perfect ice area of SH when the earth is in equilibrium with nature and the universe?”
The 1979 and onward for polar ice is because that was the year picked as having ‘complete satellite coverage’…so that’s the start of the data.
Actually there’s pretty complete coverage before that (especially for the north pole), but that was the year some international body decided to use.
The real problem Frank you did create the proper Mann statistic model, if you had no mater what numbers you put in the would now be less ice than before. The proper statistic model is all you need, I suggest you get right on if you don’t there no Nobel Prize for you. /sarc off
Green Sand :
I would like, very much, to be able to reproduce the plot shown by your link. Can you provide a detailed explanation of the web tool(s) and steps to do so :
http://nomad1.ncep.noaa.gov/cgi-bin/pdisp_sst.sh?ctlfile=monoiv2.ctl&ptype=ts&var=ssta&level=1&op1=none&op2=none&month=nov&year=2004&fmonth=jun&fyear=2014&lat0=-73&lat1=-63&lon0=-180&lon1=180&plotsize=800×600&title=&dir=
Thanks !
Our ball of rock called the Earth will either turn into a ball of flame or a ball of ice if we consider the two extremes. Right now, and for the past 40 years, it has been heading toward being a ball of ice. There is more ice on the surface now than in the past and is continuously growing. Yet we’re told the planet is warming.
What really gets me is that the middle of this interglacial was much warmer than today. The past 100 years are just a tiny blip compared to the temperature changes of the past 10K years. Temperatures are going down over the long run. No amount of CO2 is going to change that. This interglacial is on its way out. Ice age is coming back. If other interglacials are anything to go by, we’re in the last 2K to 5K years where temperatures will drop another 4 to 6 degrees C.
Please excuse my stupidity or lack of sleep (up at 3AM today) but since when has a circle had more than 360 degrees?
i thought that longitude went to 180 degrees either way, then changes from E to W or vice versa and reduces in value back to 0.
In the last 10 years, ARGO has shown at addtional .02 deg C of heat added to the deep ocean. This is a clear peer reviewed sign that total heat of the planet is increasing at an even faster rate than before.
GRACE data show Antarctica ice mass dropping rather dramatically.
The mainstream clearly disagrees with this article
” John in Oz says:
July 2, 2014 at 9:01 pm
Please excuse my stupidity or lack of sleep (up at 3AM today) but since when has a circle had more than 360 degrees?
I have inserted the red box 73S-63S 220W-50E
i thought that longitude went to 180 degrees either way, then changes from E to W or vice versa and reduces in value back to 0.”
I think that comes from the way the map is laid out. The center line of the map is not 0, so by going 220W from 0 makes the box ‘inclusive’. Stating it another way would make it sound like it was describing the area outside the box.
Doing it this way 359 W is the same as 1 E.
Frank,
Comparing the ‘extra’ ice to Greenland is good, but I’m not sure exactly how many people realize what size Greenland really is…but the ice is about 1/4 the size of Europe or about 1/3 the size of Australia. Now that may be a little more understandable.
Or…France, Spain, Portugal, Italy, Belgium, Netherlands, Luxembourg, Liechtenstein, Monaco, Germany, Vatican City and the UK (and all the other little islands associated with it).
And, of course, that “the water freezes more easily because the ice melts” only works at Antarctica and not near Greenland, for instance. This is because ice behaves differently in the North, everybody knows that.
Mary Brown:
our post at July 2, 2014 at 9:12 pm says in total
Say what!?
Temperature is not heat. Assuming you mean that the temperature rise implies additional heat in the ocean then it is a stretch to say “ARGO has shown at addtional (sic) .02 deg C of heat added to the deep ocean”.
O.O2 K change averaged over the entire oceans has been determined over the last 10 years. Does it actually indicate any real changeover the 10 years: what are the inherent errors of that determination?
And if it is true then how can that be a “a clear peer reviewed sign that total heat of the planet is increasing at an even faster rate than before” when there were no ARGO measurements before?
Assertions of the “mainstream” media are not relevant to the above article.
Richard
@Mary Brown
>In the last 10 years, ARGO has shown at addtional .02 deg C of heat added to the deep ocean.
I presume you are aware that an ARGO float is not capable of making such a determination, right?
Even if the determination was 0.02, it has an error bar for 95% confidence, and that spread is more than 0.02 degrees. Numbers that are created from large groups of numbers do not stand alone as they are re-expressions of all the facts contained in the original data set, not ‘measurements’.
>This is a clear peer reviewed sign that total heat of the planet is increasing at an even faster rate than before.
The planet? The planet is cooling. Even Trenberth admits there is no extra heat to be found above the surface. That is why he went looking in the (largely unmeasured) deep oceans.
The planet warmed from 1976-1997. That is a peer reviewed fact. The rate was uneven (because it is unlikely the cause was a smooth rise in CO2). It is certainly not warming faster than that at present or alarmists all over the world would be crowing it from the rooftops. They have stopped using the term ‘global warming’ because, well, it isn’t. They now call it Climate disruption based on the idea that selling alarm can continue if the weather is ‘disrupted’, whatever that means.
>GRACE data show Antarctica ice mass dropping rather dramatically.
It does? And the amount of the drop is what? By t hat I mean what constitutes ‘dramatically’ in your neck of the woods? Antarctica has about 25,000,000,000,000,000 cubic metres of ice give or take a snowman at the South Pole (and not counting sea ice). If it were to melt away within 10,000 years starting now, the rate of loss would have to be 2,500,000,000,000 cubic metres per year, which is 2500 cubic kilometers. If that were happening, sea level rise would be about 7mm per year. It is 1.8. Based on that, Antarctic ice might be gone in only 41,000 years. If we count the expansion from heating you say is going on down there, it will take even longer. If that happens, it will break a 500,000 year series of recurrent ice ages which as everyone knows, starts with ocean cooling and the spread of ice over the planet – remarkably like what is happening now in the South.
E.J. Mohr says:
July 2, 2014 at 2:50 pm
Thanks, EJ, I’m glad someone is awake.
If ozone has stared increasing significantly above the poles then that goes a long way to validating my New Climate Model which anticipated just such an observation.
Standard climatology expected more ozone with an active sun and less with a quiet sun but I pointed out that higher up and towards the poles the sign of the ozone response to solar variations appeared to be reversed and that reverse sign ozone response then feeds down through the descending air column of the polar vortices in the stratosphere.
That is why the ozone holes grew when the sun was active during the 20th century, nothing or very little to do with CFCs.
That is how the climate zones shift latitudinally in response to solar variability.
http://www.newclimatemodel.com/new-climate-model/
Frank Lansner: KNMI said they would look into the problem. My contact also pointed out something else you missed. Your Figure 6 shows about a 27 deg C (80 deg F) average temperature. That is not consistent with Southern Ocean surface air temperatures.
Mary Brown says: “In the last 10 years, ARGO has shown at addtional .02 deg C of heat added to the deep ocean. This is a clear peer reviewed sign that total heat of the planet is increasing at an even faster rate than before.”
Mary Brown, the subsurface temperatures of the oceans to depths of 2000 meters may have increased over the past decade, but the warming took place only in the Indian and South Atlantic Oceans. Phrased another way, the North Atlantic and the largest ocean on this planet, the Pacific, show no warming to depths of 1.25 miles.
http://bobtisdale.files.wordpress.com/2014/02/figure-72.png
The fact that 2/3rds of the oceans show no warming to depths of 2000 meters (6600 feet) is not what we would expect from well-mixed greenhouse gases.
James at 48 says:
July 2, 2014 at 4:06 pm
Assuming there is an net annual albedo component term to triggering the end of an interglacial, it is a darned good thing we have not been seeing expansive sea ice in the NH the past few years.
Not so good if you live in the SH as I do.
We will know in the next couple of years whether the albedo feedback causes accelerating sea ice increases and accelerating cooling. We are already more than 3 SDs above the average which pretty much rules out natural variation ‘noise’. That is, it is a real and very likely accelerating trend.
Nothing can stop global warming, not even cooling. Period.
Rob Ricket says:
July 2, 2014 at 12:55 pm
Regarding:
“The addition of fresh water should lower salinity and increase the freezing temperature of the water and thus create more ice.”
Should this not read “decrease the freezing temperature? If so, there is also a problem with a sentence under the next header. A reduction in salinity lowers (decreases) the freeze point.
________________________________
If a negative temperature becomes more negative, doesn’t it increase negativeness? Or does it decrease the degree of warmth? I have to see my psychiatrist urgently…
…many countries don’t follow that standard, any more than we use the metric system of measures commonly – i.e. for science and medicine but not much for personal or business.
But we do use it every day and for business – amps, volts, watts.
Dear Bob,
Yes, KNMI are normally fast repliers to me too, so i dont see why we could not wait to hear them out as I suggested (??)
Summa: KNMI have made an error inserting data for TAO in koordinates near the Antarctic where they do not belong.
The unit from TAO is Celsius (not Farenheit) which then suggest tropical temperatures near Antarctic 🙂
You then ask me to correct the KNNMI error in my writing, but i have no such access. I will mail Anthony on what to do.
I think its beneficial that you discover this – which actually lifts WUWT over the level of KNMI – but honestly, your tone could be more polite and kind as allways.
Nick Stokes says:
“Here is a movie of Antarctic SST anomalies over the last year. It does look cool around the edges of the ice.”
This is a very good point indeed. If ice is created near the edges it suggests that it is indeed created due to low temperatures. And nimations like this show that alarmist postulates on the opposite have little if any support in reality.
Thank you for pointing this out, its the most complex argument in this specific discussion.
KR Frank Lansner
Mary Brown says:
” The mainstream clearly disagrees with this article ”
This statement.. its different.. and i like it!
James at 48 says:
“Assuming there is an net annual albedo component term to triggering the end of an interglacial, it is a darned good thing we have not been seeing expansive sea ice in the NH the past few years.”
Philip Bradley says:
“Not so good if you live in the SH as I do.”
You know, alarmists – including DMI – officially claims that the albedo changes here for Antarctica does not play any role!
The argument is, that in the Antarctic winter the angle of incoming Solar rays is too flat .
So the 1000$ question is:
WHAT MELTS AWAY THE ICE IN SPRING TIME ?
If it is Solar rays (!) then the albedo of shifting ice area obviously counts.
So even the Albedo if ice is attempted denied when we talk SH…
Manfred says:
“It’s getting colder around Antarctica and so the ice is growing.”
Further evidence is given in the study below, showing that increases locally happened exactly where it got colder.
http://notalotofpeopleknowthat.wordpress.com/2013/08/17/study-finds-antarctic-sea-ice-increases-when-it-gets-colder/
SPOT ON!!
Thank you Manfred. You are a Dane are you not? I dont see you much in the Scandinavian cliamte sites? Would be nice – we could use use you!
Mary Brown,
I enjoy your comments. There is one point that needs to be added. The Grace ice mass balance currently shows slight Arctic ice loss. The reason for that is because ice mass follows [lags] ice extent/area. As the ice recovers, second and third year ice begins to accumulate. Arctic ice recovered sharply this year. The ice mass balance will follow.
The mass balance argument is just another failed attempt by those sounding the global warming false alarm to try and show they are right. But they have been wrong all along, and this time is no different.
Frank ´Lansner says:
July 3, 2014 at 3:32 am
You know, alarmists – including DMI – officially claims that the albedo changes here for Antarctica does not play any role!
The argument is, that in the Antarctic winter the angle of incoming Solar rays is too flat .
That argument is nonsense. As I regularly point out, the place on Earth that gets the highest daily levels of solar radiation is south of the Antarctic Circle around the Austral Summer Solstice and that is precisely where we are seeing increased sea ice at that time of year.
It is the place and time on Earth where albedo changes have the greatest effect.
http://www.applet-magic.com/insolation.htm
See second figure
Frank,
I should have said.
‘That argument is nonsense, as I suspect you know.’
Apologies for my abruptness.
water below the seaice area is usualy warmen as there is no sea ice above.
Frank ´Lansner, KNMI has repaired the problem at the Climate Explorer. Try it again with those coordinates. You’ll receive a response that there is no data for those coordinates. Let me pass along a thank you from KNMI for your finding the problem, (without your realizing it was a problem).
Frank ´Lansner says: “Yes, KNMI are normally fast repliers to me too, so i dont see why we could not wait to hear them out as I suggested (??)”
Why would you want to wait? Your graph in Figure 6 shows an average marine air temperature of 27 deg C for the Southern Ocean and anyone with slightest bit of common sense knows that’s wrong. Let’s drop back to an even more fundamental question for YOU, Frank. Do you understand what the “T” in “TAO” stands for? It stands for “Tropical”…not Southern Ocean, not global….”Tropical”. Please tell us why you would think you would receive data for the Southern Ocean from buoys along the equator, Frank. You made a very basic error. It’s much easier to acknowledge the problem, correct it and move on.
I’m not going to waste any additional time on this. I made the effort to advise KNMI of the problem, because it needed to be corrected. That’s the only reason I got involved.
And I’ve made my suggestion to you, Frank, but as always, when someone finds an error in one of your posts, you fail to acknowledge and correct it immediately. Your post looks foolish with a graph showing 27 deg C marine air temperature for the Southern Ocean, Frank. Feel free to leave it, if you’d like to continue to look foolish.
Have a good day.
Frank,
I think you may have misunderstood the ‘The winds did it’ argument.
The sea ice grows in winter, there’s no real melting going at this time of year, even further out (up to a point, of course). So I think the claim is simply that the sea ice cover would not grow fast enough to account for the increasing extent/area simply by freezing from the outer edge. Strengthening continental winds aid the increase by in addition physically pushing this edge ever outward from the coast. In this, there’s the implication that these winds have indeed become stronger in later years. But have we ever been given any data to show that this is in fact the case …?
Frank ´Lansner says: “The unit from TAO is Celsius (not Farenheit) which then suggest tropical temperatures near Antarctic”
I did not say the unit were in Fahrenheit, Frank. Read my comment again, Frank. And yes, those are tropical temperatures in the Southern Ocean, so why did you post the graph, if the error was so obvious to you?
Frank ´Lansner says: “You then ask me to correct the KNNMI error in my writing, but i have no such access.”
Nice try at misdirection, Frank, but it didn’t work.
I did not ask you to correct a problem at KNMI. I suggested to you that you correct your blog post. KNMI is not responsible for the problem with this blog post. KNMI had a hidden glitch in Climate Explorer, but it’s one that did not appear if you used the coordinates for source data, which are listed by KNMI just above here you, Frank, entered the coordinates that were outside the listed range. The problems with this post were yours entirely, Frank, (1) for not understanding where the data came from, (2) for not understanding that the temperatures you presented in your Figure 6 were representative of the tropics, not the Southern Ocean, (3) for not understanding that the “T” in “TAO” stand for tropical, and last but not least, (4) for arguing instead of correcting the problem.
Good-bye, Frank.
Bob take it easy!!
you write “I did not say the unit were in Fahrenheit”
Well i did not write so..!
you write: “I did not ask you to correct a problem at KNMI”
But I wrote: “You then ask me to correct the KNNMI error in my writing, but i have no such access. “
***Its getting colder around Antarctica and so the ice is growing***
This year, sea ice growth set 30-year records in Baffin Bay between Greenland’s west coast and Baffin Island. Is it fair to say it’s getting colder there too?
Otteryd says:
July 2, 2014 at 12:15 pm
Oh come on … It’s so obvious. North Pole is at the top, South Pole is at the bottom … Ice is slippery… It slides downwards.
——————————————————————————————————–
+1 and a nomination for Quote of the week.
not try to re-ignite the ‘Sun did it…’ war…… but, the TSI start decreasing around 2003-2005 by a small amount….
I am an agnostic when it comes to the sun. Or, should I say Delta Sun, because it’s changes there that would result in changes here? But the change in TSI is %-small. Some of the components, however, show a %-large variance, such as UV. The various correlations looks less than horrible, but, esp when Willis puts the fat to the fire, not “good” enough.
But, the way it’s been going, the next Cycle may well provide at least a good partial answer.
So we wait and see.
Kristian, you say ” So I think the claim is simply that the sea ice cover would not grow fast enough to account for the increasing extent/area simply by freezing from the outer edge”
Im not sure really. If it is true that ice is pushed away from Antarctica due to stronger winds, then the ice on the edge would meet warmer waters. This should reduce creation of ice at the edge.
But as we both say, we need more proof and documentation on these matters before anyone can claim anything.
KR Frank Lansner
David when it comes to climate, surface area extent of sea ice is 1000x more important then volume.
That said there is much doubt about the volume of sea ice which is present.
Then again when you have sea ice anomalies running over 2.0 million square km. above average I doubt very much that volume is much less if at all. Which is the present situation in Antarctica.
Bob Tisdale, what you may not realize is that Frank Lansner does not have authorship privilege at WUWT like you do. Thus, he has to wait for me to make corrections, and I just woke up. We’ll get to it right away.
========================================
I will do my best!
First visit:-
http://nomad1.ncep.noaa.gov/cgi-bin/pdisp_sst.sh
Under “Control File”
Select – “monoiv2.ctl Monthly OIv2 SST” by highlighting the circle at the LH side.
Under “Options”
Leave as default with “include variable definitions and unit” selected
Under “Plot type:”
Select “time series”
Then click next page.
On the second page the heading should read ” display plot: monoiv2.ctl”
In “Field” box select via drop down “ssta *Olv2 SST monthly anomaly (C) rel to 1971-2000
Leave other headings in the box as default = “Level” 1, “averaging” (none) and “scaling” (none)
At “Initial Time” select your start date from drop down. I used “Nov 2004”
“Final Time” leave as default (latest available) “Jun 2014”
Under “Time series of a box average:”
“Latitude” enter “-73” in first box and “-63” in second box
Leave “Longitude” at default “-180” in first box and “180” in second box
Leave “Plot size” at default “800×600”
Leave Title blank
Cross fingers and press “Plot”
====================================
I trust the above helps, if not shout and I will give it another shot. In doing this I noticed I made a mistake in my original plot the “Initial Time” should have been “July 2004” to get the full 120 month decade. I had left the “Nov” default in.
Good luck!
Frank says
Since 2011 the ozone concentration has increased fast. The extra ice formations are sometimes explained with the drop in ozone concentration, but in recent years the development has reversed.
Henry says
In fact ozone has been increasing since 1995. The extra ice can be explained by arguing that the net effect of more ozone, & more peroxides and nitrogenous oxides, is that more radiation is deflected to space.
Chemists know that a lot of incoming radiation is deflected to space by the ozone and the peroxides and nitrogenous oxides lying at the TOA. These chemicals are manufactured from the extremely bad radiation (before UV) coming from the sun. Luckily we do have measurements on ozone, from stations in both hemispheres. I looked at these results. Incredibly, I found that ozone started going down around 1951 and started going up again in 1995, both on the NH and the SH. Percentage wise the increase in ozone in the SH since 1995 is much more spectacular.
We know that there is not much variation in the total solar irradiation (TSI) measured at the TOA. However, there is some variation within TSI, mainly to do with the UV (C). It appears (to me) that as the solar polar fields are weakening, more energetic particles are able to escape from the sun to form more ozone, peroxides and nitrogenous oxides at the TOA.
http://ice-period.com/wp-content/uploads/2013/03/sun2013.png
In turn, these substances deflect more sunlight to space when there is more of it.
to see this, you must try to understand this graph:
http://blogs.24.com/henryp/files/2011/08/Atmospheric_Transmission.png
Note how the ozone cuts a substantial portion of incoming radiation.
Trenberth knew this and he estimated that ozone is on its own is responsible for about 25%-30% of all that is back radiated by the sun. However, he forgot about the peroxides and nitrogenous oxides.
So, ironically, when the sun is brighter, earth will get cooler. This is a defense system that earth has in place to protect us from harmful radiation.
Henry said
Trenberth knew this and he estimated that ozone is on its own is responsible for about 25%-30% of all that is back radiated by the sun.
Henry says
oops
sorry
should be
Trenberth knew this and he estimated that ozone is on its own is responsible for about 25%-30% of all that is back radiated by the atmosphere
Figure 6 which has been in contention, has been removed and it cannot be replaced with a new figure because of an error in KNMI climate Explorer, and because there is now no TAO data for the area. Note also that Frank Lansner doesn’t have primary editing privileges at WUWT, so had to wait on me to correct this, and it was the first thing I did this morning after I woke up.
Bob writes in email:
He’s referring to the screencap I have in placer of figure 6 above.
It is clearly another case of “the algorithm is working as designed”.
As in, “That rotten ice is mucking up our models?”
Jbird says:
July 3, 2014 at 6:14 am
***Its getting colder around Antarctica and so the ice is growing***
This year, sea ice growth set 30-year records in Baffin Bay between Greenland’s west coast and Baffin Island. Is it fair to say it’s getting colder there too?
______________________
At least two more anomalies in the far North- there is a large area North of Nunavit and Greenland which has 5+ M- thick ice and Lake Superior froze over and had ice in June. Is it getting colder up there? Eyeballing the graph, the Arctic temp. trend seems to be flat, or slightly negative since about 2007.
ftp://ftp.ssmi.com/msu/graphics/tlt/plots/rss_ts_channel_tlt_northern%20polar_land_and_sea_v03_3.png
HenryP said:
“Incredibly, I found that ozone started going down around 1951 and started going up again in 1995, both on the NH and the SH. Percentage wise the increase in ozone in the SH since 1995 is much more spectacular.”
As per my New Climate Model.
Note, though, that despite the radiating ability of ozone its absorption capability heats it and reverses the lapse rate slope in the stratosphere.
More ozone for a warmer stratosphere and lower tropopause. Less ozone for a colder stratosphere and higher tropopause.
Introduce different variations at equator and poles and that gives us climate change as the entire global air circulation slides latitudinally bebeath the tropopause either towards the poles when it is warming or towards the equator when it is cooling.
Frank ´Lansner says, July 3, 2014 at 6:52 am:
“If it is true that ice is pushed away from Antarctica due to stronger winds, then the ice on the edge would meet warmer waters. This should reduce creation of ice at the edge.”
But apparently not until it’s reached far enough to set a new extent record, meaning the freezing rate at the edge grows progressively slower as it moves north and into less and less cold waters, until the edge, if pushed even further out by those claimed winds, will rather start melting.
I think the point that the warmists are trying to make is that, during winter, in situ ice production along the outer (northerly) edge of the cover would potentially occur even way beyond the ‘normal’ extent, but it could never reach that far without the stronger winds pushing it there, implicitly meaning the edge freezing itself is not fast enough and thus could not cover the distance in time before the season turned towards net melting.
I know, it’s veeeery far fetched and doesn’t take into account that ice formation doesn’t necessarily need an anchoring edge to occur, as long as the waters are cold and calm enough. Also, again, I don’t remember having seen their claimed mechanism being backed up with real-world data. But just trying to understand their actual argument, here …
Philip Bradley says:
July 3, 2014 at 2:06 am
James at 48 says:
July 2, 2014 at 4:06 pm
Assuming there is an net annual albedo component term to triggering the end of an interglacial, it is a darned good thing we have not been seeing expansive sea ice in the NH the past few years.
Not so good if you live in the SH as I do.
We will know in the next couple of years whether the albedo feedback causes accelerating sea ice increases and accelerating cooling. We are already more than 3 SDs above the average which pretty much rules out natural variation ‘noise’. That is, it is a real and very likely accelerating trend.
=================================
I’m a “glass 10% full” kind of person. As you note, from a global perspective we are in a net positive trend in terms of albedo and the SH bears the brunt.
Dear HenryP
I appreciate your interesting input, thank you!
You write on Ozone:
“In fact ozone has been increasing since 1995. The extra ice can be explained by arguing that the net effect of more ozone”
When the Alarmist site “Skeptical science” first used the excuse of Ozone we had year 2007.
http://hidethedecline.eu/media/Antarctica/10.gif
As you can see, at that time there had only been a decline in Ozone and then stagnation.
So in 2007 a lower Ozone concentration was a good explanation of more ice (via winds etc).
Now when we have record levels the Ozone has increased rapidly the last few years.
So if still Ozone concentrations explains things something in the argumentation must change…
Frank Lansner
HenryP:
Correction, 2010 is the Skeptical science article, and they mention a drop in Ozone, not a rise:
http://www.skepticalscience.com/increasing-Antarctic-Southern-sea-ice-intermediate.htm
“If the Southern Ocean is warming, why is sea ice increasing? There are several contributing factors. One is the drop in ozone levels over Antarctica”
But sadly, just after that article was online the strong increase in Ozone began…. And Ice area sky-rocketed…
Frank Lansner
I enjoyed this article. And yes salinity is fairly constant and only changes by small amounts over time. I studied that when I was in the Navy. You make your argument very well. You know though that Al Gore and Bill Gates will never agree with this.
Stephen Wilde says
Note, though, that despite the radiating ability of ozone its absorption capability heats it and reverses the lapse rate slope in the stratosphere.
Henry says
you [and Frank] have to understand the principle of absorption and subsequent re-radiation
I have tried to explain this here,
http://blogs.24.com/henryp/2011/08/11/the-greenhouse-effect-and-the-principle-of-re-radiation-11-aug-2011/
but still it seems there is much confusion.
Sofar, I have measured that earth’s global temperature is down by -0.2K since 2000.
You can see it is cooling from the top latitudes down, e.g.
http://oi40.tinypic.com/2ql5zq8.jpg
To me it is possible that this is entirely due to the increase in ozone & others. Although the formation of these compounds prevents harmful incoming radiation, more of these compounds deflect more radiation due to absorption, re-radiation and and subsequent more back radiation.
Trenberth never knew or forgot about the peroxides and nitrogenous oxides also being formed TOA. These are not being measured or monitored, I doubt we even have spectra on them….
HenryP
I have to reflect a little more on your input but notice that the first very strong increase in Antarctic ice are peaked around 2007-2008 where there were no increase in Ozone. So.. its fluffy to say the least .
Frank Lansner
So if still Ozone concentrations explains things something in the argumentation must change…
Frank Lansner
Henry says
Hi Frank
You are definitely on the right track. Just forget about SS. SS is a waste of time, as they have always removed my important comments.
You must try to understand the principle of absorption, re-radiation and subsequent back radiation.
I got hold of ozone results from a station in the swiss alps with data on ozone going back to 1927. That is where I saw the bending points 1951 and 1995 (in the polynomials fits of the third order with fair correlation (ca. 0.5)
I also saw a graph from a station in the SH with data going back to 1980. Clearly the trend there was going up, from 1995. %wise, quite spectacular. On short term results, [like the lower results you mention] you must expect variation in ozone [and others] as per the variation in radiation coming from the sun:
http://ice-period.com/wp-content/uploads/2013/03/sun2013.png
I was able to correlate the dates of the change in ozone [&others – not measured] with the change in maximum temperatures,
http://blogs.24.com/henryp/2012/10/02/best-sine-wave-fit-for-the-drop-in-global-maximum-temperatures/
look at both graphs….
There are more such correlations which ultimately lead me to believe that the sun will only change its course [to a more increasing field strength] around 2016, give or take a year.
taxed on July 2, 2014 at 1:48 pm
I’ve been following Arctic summer air temps as reported by DMI over the last few years and they have indeed been below average. However up to the last 2 years this has not stopped continued ice loss. My take on this has been that Gulf stream warm water was still flowing into the Arctic. However in the last couple of years it seems that the overturning of the AMO is correlated with weakening north Atlantic drift and thus reducing warm supply to the Arctic. Thus as you observed, summer cold at the Arctic is now accompanied by recovering ice.
Your observation about noctilucent cloud is interesting; however isn’t the stratosphere kind of inverse to temperature trends, cooling when the troposphere warms and vice versa – that at least is part of the warmists optical depth CO2 story. But I have my doubts. Maybe the beautiful night shining cloud could be an important indicator of something else.
Green Sand, thanks very much – I have been exploring the URL and will use your details to further my understanding – I appreciate your efforts.
phlogiston:
Today, 7/3/2014, the UV recorded 177 sfu. In one to two weeks [Sun in the Northern hemisphere] expect a jump in the DMI air temps. When the Sun is in the southern hemisphere, it takes about three weeks for DMI to pulse.
Isn’t it obvious that because of global warming of the oceans, all the heated water is rising to the North Pole and melting the Article Sea ice. The Antartic ice is growing because all the hot water is rising to the the top of the world. /sarc
Well it’s a more scientific theory than what Al Gore peddles.
HenryP
It has long been established that the reverse of the lapse rate slope in the stratosphere (warmer with height) is due to ozone directly absorbing incoming solar energy and heating up.
More ozone gives a higher stratosphere temperature and a lower tropopause.
Green Sand, yes, works !
I’m somewhat familiar with Christian inerrancy apologetics (using smoke, mirrors and rhetoric to explain away problems in New Testament documents). Frank’s article shows that apologetics is alive and well in the sciences, and he does a good job of dismissing some of it.
It’s my view that AGW theory is mostly apologetical in its nature. But I’m not a scientist, so what do I know?
Stephen Wilde thanks for your input.
I will check your site. I am particularly interested in Ice Age data that shows tropical freeze lines at 1000 meters lower than today with an implied steepened lapse rate. Richard Lindzen marvelled at this fact, and the fact that tropical oceans seem to be about as warm as today. Your ozone theory indicates there may be more to learn about ice ages. I guess that’s understatement for sure:) In particular it may be possible to surmise about solar activity during the Ice Ages.
‘Crispin in Waterloo but really in Singapore’ and ‘Richard’ and ‘Bob Tisdale’ …
all jumped all over my ARGO and GRACE claims of rising deep ocean heat and rapidly melting ice. I was just repeating what Hanzo has been arguing for a week over here…
http://wattsupwiththat.com/2014/06/20/the-washington-post-verifies-the-pause-in-global-warming/
dbstealey… has been involved in that and knows I find it lame, too.
I just wanted to see other responses here to Hanzo’s insistence that the warming is, to quote David Byrne, “Same as it ever was” even though SST, sfc temps and sea level are flatlining for a decade and a half.
“Snow landing on sea ice will obviously insulate the ice from cold air temperatures. So how come more snow (precipitation) should increase sea ice areas?”
Snow also insulates sea ice from sunlight during summer when sea ice is melting. Less melted sea ice in summer leads to more sea ice next winter as it accumulates year after year. That’s how sea ice gradually grows over time. BTW the variance in sea ice extent from summer to winter is huge, 7x larger than Greenland.
E.J. Mohr says:
July 3, 2014 at 5:40 pm
As regards ice ages I think the primary cause is Milankovitch cycles but that during those cycles the ebb and flow of solar power has a similar effect on tropopause heights as shorter term variations in the levels of solar activity.
A lot still to be learned, as you say.
Dr. Strangelove says:
Thank you for input, you write:
“Snow also insulates sea ice from sunlight during summer when sea ice is melting. ”
In the melt season there is rarely snow on icefloes. But anyway, the mechanism on precipitation supposed to increase ice area is the salinity drop supposed to take place – but it is miniscule.
Kind Regards, Frank Lansner
http://www.knmi.nl/research/global_climate/images/Bintanja_etal_NatGeo_2013.pdf
FYI says:
July 4, 2014 at 7:34 am
For your information – Frank Lanser’s article points out that salinity around Antarctica (the real Antarctica, not a computer model) has INCREASED, not decreased.
So Bintanja’s attempted fig-leaf is pure BS I’m afraid.
Typically more ice means colder. Trying to weave fantastic stories that more ice or snow somehow means warming is just silly. It is what it is – live with it.
Stephen Wilde says
It has long been established that the reverse of the lapse rate slope in the stratosphere (warmer with height) is due to ozone directly absorbing incoming solar energy and heating up.
More ozone gives a higher stratosphere temperature and a lower tropopause.
Henry says
http://blogs.24.com/henryp/files/2011/08/Atmospheric_Transmission.png
Note that the white area under the red line (left) is largely due to raleigh scattering and ozone. The white area is radiation deflected to space, mostly. The ozone gas has little mass. so the “heat” absorption is negligible, especially at such very low concentrations (not even measured in ppm).
Can you see/understand why Trenberth found that ozone on its own is responsible for about 25% of all that it being back radiated? Add to this that he/they ignored the peroxides and the nitrogenous oxides also being formed by the most energetic particles coming from the sun [for which gases we probably have no spectra]
Do you really understand the principle of absorption and re-radiation? We are looking at an anti greenhouse effect, basically.
HenryP
“ozone absorbs most of the shortwave UV radiation present in the total solar radiation. This UV absorption heats the stratosphere.”
from here:
http://www.eoearth.org/view/article/155102/
and:
“a high tropopause is correlated with low total ozone and a low tropopause with high total ozone.”
from here:
http://onlinelibrary.wiley.com/doi/10.1029/98JD01929/abstract
Just as I’ve been saying.
Stephen Wilde says
just as I have been saying
Henry says
I think that would still be wrong, I am saying the ozone (& others) have no mass to distribute that heat. Your books are not clear on how the atmosphere protects us against harmful radiation.
My theory is very simple
1) lower solar polar field strength means more energetic particles from the sun
http://ice-period.com/wp-content/uploads/2013/03/sun2013.png
2) more of that type of [harmful] radiation means more O2 converted to ozone & others
[otherwise we’d be dead – good design!]
3) more ozone and others means less UV in the oceans – this is earth’s biggest energy store. This is what the difference between the red line and the red areas should tell you: the white area [radiation] will not land up in the oceans. You have to agree with me on that?
4) water has some absorption in the UV and here that type of radiation eventually has to convert to heat. Here is the mass available. Almost all radiation ending up in the ocean has to convert to heat but if the UV part is getting less, the oceans will get cooler, somewhat, you have to agree?
5) eventually cooler water leads to cooler weather as my graphs are showing – we already cooled 0.2K globally since 2000.
We seem to be cooling from the top latitudes downward, as the increase in ice suggests. Alaska is also cooling quite significantly.
During a cooling period more water vapor condenses relatively somewhat more at the lower latitudes releasing enormous amounts of heat, keeping these regions more or less unchanged in temperature or some even some warming.
note that SST drop follows or leads global temperature – you tell me?
http://www.woodfortrees.org/plot/hadcrut4gl/from:1987/to:2014/plot/hadcrut4gl/from:2002/to:2014/trend/plot/hadcrut3gl/from:1987/to:2014/plot/hadcrut3gl/from:2002/to:2014/trend/plot/rss/from:1987/to:2013/plot/rss/from:2002/to:2013/trend/plot/hadsst2gl/from:1987/to:2014/plot/hadsst2gl/from:2002/to:2014/trend/plot/hadcrut4gl/from:1987/to:2002/trend/plot/hadcrut3gl/from:1987/to:2002/trend/plot/hadsst2gl/from:1987/to:2002/trend/plot/rss/from:1987/to:2002/trend
2 phlogiston July 4, 2014 at 10:04 am
From Bintanja’s article, fig. 3: “Austral winter half-year (April–September) zonal mean trends
(1985–2010) of OBSERVED salinity, vertical density gradient and potential
temperature, in the Southern Ocean … … The near-surface increase in salinity between 65° and 70° S is most likely due to brine rejection when sea ice forms. The sub-surface ocean
observations were taken from the Met Office EN3 analysis, which is based
on IN SITU observations”
[Ingleby, B. & Huddleston, M. Quality control of ocean temperature and salinity
profiles—historical and real-time data. J. Mar. Syst. 65, 158–175 (2005).]
… live with it… 🙂
FYI on July 4, 2014 at 3:53 pm
2 phlogiston July 4, 2014 at 10:04 am
A good effort and interesting data. But I find it hard to take seriously the agenda-driven output of a community of scientists who are all AGW activists.
So I’ll stay with Occam’s Razor on this one.
Antarctic sea ice growth for a couple of decades, now accelerating – looks like Antarctic cooling to me.
phlogiston says
looks like Antarctic cooling to me.
henry says
it is globally cooling from the top latitudes down
In Alaska I found it is cooling at a rate of -0.55K/decade
=average of 10 weather stations
http://tinypic.com/view.php?pic=2ql5zq8&s=5#.U7hSh5SSzJo
some warmer water of the gulf stream – left over from the warming period – is stalling more arctic ice, but it will be coming….from 2015-2040, same as from 1925-1950
http://wattsupwiththat.com/2008/03/16/you-ask-i-provide-november-2nd-1922-arctic-ocean-getting-warm-seals-vanish-and-icebergs-melt/
stephen wilde
SST drop follows or leads global temperature – \
I would be interested what your take is on that?
Re land ice: my simplistic idea is that growing ice sheets fragment at the expanding edge and form icebergs, while melting ice trickles away.