 Guest essay by David Archibald
A couple of years ago the question was asked “When will it start cooling?” Of course solar denialists misconstrued this innocent enquiry. There is no doubt – we all know that lower solar irradiance will result in lower temperatures on this planet. It is a question of when. Solar activity is much lower than it was at a similar stage of the last solar cycle but Earthly temperatures have remained stubbornly flat. Nobody is happy with this situation. All 50 of the IPCC climate models have now been invalidated and my own model is looking iffy.
Friss-Christenson and Lassen theory, as per Solheim et al’s prediction, has the planet having a temperature decrease of 0.9°C on average over Solar Cycle 24 relative to Solar Cycle 23. The more years that pass without the temperature falling, the greater the fall required over the remaining years of the cycle for this prediction to be validated.
The question may very well have been answered. David Evans has developed a climate model based on a number of inputs including total solar irradiance (TSI), carbon dioxide, nuclear testing and other factors. His notch-filter model is optimised on an eleven year lag between Earthly temperature and climate. The hindcast match is as good as you could expect from a climate model given the vagaries of ENSO, lunar effects and the rest of it, which gives us a lot of confidence in what it is predicting. What it is predicting is that temperature should be falling from just about now given that TSI fell from 2003. From the latest of a series of posts on Jo Nova’s blog:

The model has temperature falling out of bed to about 2020 and then going sideways in response to the peak in Solar Cycle 24. What happens after that? David Evans will release his model of 20 megs in Excel in the near future. I have been using a beta version. The only forecast of Solar Cycle 25 activity is Livingstone and Penn’s estimate of a peak amplitude of seven in sunspot number. The last time that sort of activity level happened was in the Maunder Minimum. So if we plug in TSI levels from the Maunder Minimum, as per the Lean reconstuction, this is what we get:

This graph shows the CET record in blue with the hindcast of the notch-filter model using modern TSI data in red with a projection to 2040. The projected temperature decline of about 2.0°C is within the historic range of the CET record. Climate variability will see spikes up and down from that level. The spikes down will be killers. The biggest spike you see on that record, in 1740, killed 20% of the population of Ireland, 100 years before the more famous potato famine.
I consider that David Evans’ notch-filter model is a big advance in climate science. Validation is coming very soon. Then stock up on tinned lard with 9,020 calories per kg. A pallet load could be a life-saver.
David Archibald, a Visiting Fellow at the Institute of World Politics in Washington, D.C., is the author of Twilight of Abundance: Why Life in the 21st Century Will Be Nasty, Brutish, and Short (Regnery, 2014).
UPDATE:
For fairness and to promote a fuller understating, here are some replies from Joanne Nova
I consider that David Evans’ notch-filter model is a big advance in climate science. Validation is coming very soon.
You mean: falsification is coming very soon [if not already there].
So if we plug in TSI levels from the Maunder Minimum, as per the Lean reconstruction
which is very likely not correct to begin with.
There is no doubt – we all know that lower solar irradiance will result in lower temperatures on this planet. It is a question of when
It is much more a question about ‘by how much’. If TSI falls to get stuck at the level observed at solar minimum, the temperature will indeed be lower by up to 0.1 degrees C, which is inconsequential.
Love that model because it can be put to the test soon, not convinced about the rapid change it predicts, though.
Here is the most important thing I have read in that series. For once someone in the climate game makes a real scientific prediction. Karl Popper call your office!!
The entire series of posts is worth your time and study if you are interested in the climate debate. I am not completely in agreement with him, but I do admire the honest scientific method in use. A falsifiable theory of climate! Shazzam!
(1) emphases is mine.
Mark Stoval (@MarkStoval) says:
June 28, 2014 at 7:06 am
Here’s the criterion: A fall of at least 0.1°C (on a 1-year smoothed basis) in global average surface air temperature over the next decade.
According to Figure above the criterion should be 0.5°C, not the measly 0.1°C.
Is TSI being considered as a driver here or as a chance correlate?
If this is correct and we do indeed begin to see measureable cooling,
then President Obama’s statement that climate change is happening now
will be validated.
Uh, sort of.
🙂
If I successfully predict a decade of global temperature with the flip of a coin, am I good or am I lucky? At least with the IPCC climate models, we know their prognosticators are neither.
Thanks, Leif, for your participation. Your measured, knowledgeable posts are interesting and insightful.
Looks like the cooling will be within normal bounds.
Therefore it can’t be the sun.
Note the similarity.
The warming we have seen is within normal bounds
Therefore it can’t be the co2
For cryin’ outloud. The “…vagaries of ENSO…”. Everybody’s get out of town card. A tuned model always looks good. And retuning it every year or so will keep the cash coming in for whatever you are peddling. GIGO…different ingredients…still GIGO. Until the ENSO models get it right the rest of you global modelers might as well sleep in.
There is a need to differentiate global temperatures from northern continental interior temperatures. What has happened to date suggests that global temperatures may fall only a few tenths, while northern continental interior temperatures may take a wallop.
Falsification is indeed required for legitimate hypothesis. With that said, and for those curious as to when the next major glaciation might be predicted, see:
https://www.dropbox.com/s/ygv83mwpytn4p65/AN%20ENGINEER%E2%80%99S%20TAKE%20ON%20MAJOR%20CLIMATE%20CHANGE%20F.53.pdf
Long winded but you’re likely to find it thought provoking.
“The biggest spike you see on that record, in 1740, killed 20% of the population of Ireland, 100 years before the more famous potato famine.”
I thought the Maunder Minimum lasted from 1645~1715. Isn’t a 25yr lag a little too long after the fact? I could understand attributing causation had the great famine occurred during the Maunder, but a 25-year lag seems a bit of a stretch.
What am I missing?
The CET record does, however, show considerable cooling during the Maunder Minimum.
It is worse than I thought. The TSI used by Evans is totally wrong http://jonova.s3.amazonaws.com/evans/graphs/prediction/total-solar-irradiance.gif
Apart from the use of the obsolete Lean TSI for the early years, the most blatant error is the statement that TSI has had a sharp unprecedented drop starting in 2003-2005 to now. This is complete nonsense. Here is TSI since 2003 http://www.leif.org/research/TSI-since-2003.png
There is no such drop. If anything TSI is now higher than it were in 2003. As far as I am concerned, the model is already falsified. Not by the observations but by the [almost fraudulent – as there clearly is an agenda here] use of invalid input to begin with. This concludes my comments as the prediction is worthless on its face.
Perhaps the “temperatures” measured are not the temperatures people think they are measuring.
Back to the 1st 2nd and 3rd laws.
QED
II am extremely pleased to see that this information is started to be seen on other sites. I think of this hypothesis as the unifying theory of Climate Science. It is a bare bones hypothesis with falicification points. It needs inputs from others like yourself. Hopefully it will put the stake in the heart of CAGW. I have a very limited income and fuel, energy and food costs are killer for everyone.
Steven Mosher:
Your post at June 28, 2014 at 7:32 am says in total
That is merely more non sequiter from you.
The logical matters you have failed to understand can be stated as follows.
Looks like the cooling will be within normal bounds.
Therefore it could be the sun.
Note the similarity.
The warming we have seen is within normal bounds
Therefore it could be normal and there is no reason to suppose it is caused by anthropogenic co2.
Richard
Excellent accurate information. Past history has shown us each and every time prolonged solar minimum conditions are present the temperature response has been down.
One item that could slow down solar effects somewhat is ocean heat content.
Anthony good article.
..
Leif, perhaps your tsi data validates the model and explains the flat temps and lack of cooling?
don’t worry we shall get a reply in december 2015 – great meeting in Paris concerning climate change – and Arnold Swarzenneger will be there (so maybe Al Gore too) – and the president will be Laurent Fabius –
so cheer up !!
it is clear to me that many “scientists” need to go back and learn some BASIC concepts……..there are NOT competing theories, in science a theory is the present best possible understanding…….there are competing hypothesis being discussed………..human caused global warming is NOT a theory in science it is a FAILED hypothesis…….the real word refuses to follow the hypothesis that humans by releasing co2 are causing warming and in so doing proves it to be FALSE…..really simple stuff folks.
James of the West says:
June 28, 2014 at 8:17 am
Leif, perhaps your tsi data validates the model and explains the flat temps and lack of cooling?
The model is based on wrong input and so is ‘not even wrong’, but meaningless and worthless.
Putting this post here may be purposed to the task of finally demonstrating how far afield David is in his knowledge base with regard to solar speculation. Truly, trolling for a solar indices that matches your speculation has to be the most obvious sign of research bias there is. Very much like Mann trolling for trees that only speak to his bias. Which one is worse? Flip a friggin coin. We will see which of the two learns from their past invalid practices.
mosher-
“Looks like the cooling will be within normal bounds.
Therefore it can’t be the sun.
Note the similarity.
The warming we have seen is within normal bounds
Therefore it can’t be the co2”
considering the climate on the earth changed BEFORE so called human intervention with steady co2 levels, there must be natural variation caused by some OTHER source.
by saying the warming is within normal bounds, therefor it cannot be the co2 is perfectly logical because this was the previous condition.
by saying the cooling is within normal bounds, therefor it cannot be the sun is illogical because the sun can not be ‘removed’ from natural variation. you could say the sun may not be causing the cooling, but you cannot say ‘therefor it cannot be’.
Mosher is finally starting to get it, the climate is normal.
He contemptuously said, ^some Republicans have even predicted that it will cool.^ What fun it will be if it does!
ive been told there are no stupid questions….
what does “0.0” represent? is this fixed or subject to the author’s interpretation and/or modeling?
Mark’s quote from David Evans:
“A fall of at least 0.1°C…”
That would be well within the adjustments we are seeing and not really definitive. However, it differs enough from the CO2 models to give Evans some bragging rights if it comes to pass, but such an outcome doesn’t seem much different from the way nature is already diverging from the GCMs.
What has to be watch gong forward are the AP index, Solar Flux values and Solar Wind Speeds.
This is what correlates best with the temperature not sunspot data or TSI per say. TSI being very hard to peg since some of it is in phase with the solar cycle while other parts are in anti- phase with the general level of the solar cycle..
I fully expect the following two climatic changes to happen in response to prolonged solar minimum conditions becoming more established once again as this decade proceeds. . They are a more meridional atmospheric circulation (more extremes or persistence in weather patterns) followed by cooler temperatures. The one factor that must be taken into consideration is ocean heat content which can act in opposition to the solar effect. . On the other hand another unknown will be future volcanic activity which seems to correspond with prolonged minimum solar activity which will enhance the given solar effects.
We saw during the very low recent lull in solar activity back around 2008-2010 that much blocking was present, I expect the same response to happen going forward .
Remember the climate is non linear, chaotic and random and the beginning state of the climate is always in flux meaning factors that impact the climate impact the climate solar for example are not going to give the same climatic outcomes.
To make it more complicated are possible thresholds that may or may not come about, this is why precise climatic forecast going forward are very hard to make. General trends are much easier to predict.
lsvalgaard says:
June 28, 2014 at 7:47 am
Aren’t you being a little hasty? Once you establish the correct record for historical TSI wouldn’t it be prudent to use that as the input to their model, and see what results?
Anthony all my future post if put on will be like the last post. I am just going to present my findings based on data I have to share with all of you.
James Strom says:
June 28, 2014 at 8:38 am
Aren’t you being a little hasty? Once you establish the correct record for historical TSI wouldn’t it be prudent to use that as the input to their model, and see what results?
It would seem that authors of the model should do that, but since they claim that their model fits the old, wrong data, then it would not fit any other data set, so I don’t see the need.
Much as I respect Leif’s solar knowledge and have adapted my views in light of it I do have some concerns about his comments here.
Note that I have no problem with his combative style.
In particular:
i) He seems not to be accepting that many contributors to the climate debate realise that TSI is not the primary indicator of the solar effect on Earth’s climate. There is some sort of amplification factor in play which David Evans labels as ‘force x’.
ii) TSI may be slightly higher now than in 2003 but is Leif denying that the peak of cycle 24 is lower than the peak of cycle 23?
In my opinion force x, which amplifies the effect of TSI variability, is the precise mix of wavelength and particle variations from the sun depending on the level of solar activity.
That variable mix appears to be capable of altering stratosphere temperatures differently between equator and poles so as to allow shifting of the climate zones and jet stream tracks between equator and poles.
That is what amplifies both the warming and cooling effects of solar variability.
That is what we perceive as climate change.
Nothing else fits the observations.
Pochas above: I agree 100% I think same will happen in the Southern hemisphere as well as Antarctica keeps expanding northward at an alarming rate (it seems),.especially in South America which is the only significant large land mass closer to Antarctica. The surrounding (relatively warmer unchanging temperatures) of the ocean prevent the same effect.I “shudder” (pun intended), to think what effect this will have on the Asian land mass on the Northern hemisphere over time
Table 1.Volcanoes of greater than or equal to VEI of 5 from 1650 to 2009. This list of large volcanic eruptions since 1650 was used as the baseline list for comparison against solar activity, i.e. periods of reduced sunspot count to determine any apparent associations. 5* = a class five VEI with potentially large date uncertainty, P* = plinian large class eruption, assumed >VEI 5. The study did not include activity associated with geological hot spots or caldera (super volcano) sites. Source: Smithsonian Institute.
Volcano Location Year VEI
1. Shiveluch Kamchatka Penninsula 1650 5
2. Long Island N.E. New Guinea 1660 6
3. Usu Hokkaido, Japan 1663 5
4. Shikotsu Hokkaido, Japan 1667 5
5. Gamkonora Halmahera, Indonesia 1673 5*
6. Tongkoko Sulawesi, Indonesia 1680 5*
7. Fuji Honshu, Japan 1707 5
8. Katla So. Iceland 1721 5*
9. Shikotsu Hokkaido, Japan 1739 5
10. Katla So.Iceland 1755 5
11. Pago New Britain 1800 P**
12. St.Helens Washington State, USA 1800 5
13. Tambora Lesser Sunda Islands,Indo. 1815 7
14. Galungung Java, Indonesia 1822 5
15. Cosiguina Nicaragua 1835 5
16. Shiveluch Kamchatka Penninsula 1854 5
17. Askja N.E.Iceland 1875 5
18. Krakatau Indonesia 1883 6
19. Okataina New Zealand 1886 5
20. Santa Maria Guatemala 1902 6
21. Lolobau New Britain 1905 P*
22. Ksudach Kamchatka Penninsula 1907 5
23. Novarupta Alaska Penninsula 1912 6
24. Azul, Cerro Chile 1932 5+
25. Kharimkotan Kuril Islands 1933 5
26. Bezimianny Kamchatka Peninsula 1956 5
27. Agung Lesser Sunda Islands, Indo. 1963 5
28. St. Helens Washington State, USA 1980 5
Chichon Mexico 1982 5
30. Pinatubo Philippines 1991 6
31. Hudson, Cerro So. Chile 1991 5+
************************************************************************
Of the 31 eruptions documented since 1650 with a VEI greater than or equal to 5, a total of 25 occurred during a reduced period of sunspots if not a major reduction in sunspots or a solar hibernation, e.g. the Dalton or Maunder Minimums. This preliminary study showed 80.6% of the largest eruptions took place during extended solar activity minimums. Significantly, the following list of the eight largest volcanic eruptions globally (VEI>6) since 1650, shows all but one took place
only during a solar hibernation, or significant reduction in solar activity as measured by sunspot count.
3
Dr S updated & improved the Lean reconstruction yrs ago & it’s been linked to many times. Anytime I see “Lean reconstruction” used for analysis, I dismiss it.
David, please get up to date.
That is what the data shows for volcanic versus solar. More data to follow.
Another model, BUT the predictive skill can be tested within a very reasonable amount of time. It is falsifiable! Good grief.
The only problem with Evans model AGAIN is using the “adjusted temperatures” against the model., If average temps are all C###, all bets are off (ie: there has been NO warming since 1880). Refer to Goddards analysis and recent posting at Judith Curry sites.
The sun is currently almost spotless based on a visual count of sunspots. How many sunspots do you see visually?
http://sdo.gsfc.nasa.gov/assets/img/…_4096_4500.jpg
It appears the sunspot count is being propped up which is a misguided effort as it will make the sudden fall in sunspot count more pronounced.
The below link shows pictures of ‘active’ regions on the surface of the sun. The picture of ‘active’ regions is created by an overlay of the magnetogram image of the sun and a visual image of the sun. The magnogram image is created by observing the sun with a filter that is restricted to a frequency that is produced by iron ions that occurs when the iron ions are in an magnetic field (using the Zeeman effect to determine the regions of the sun that are magnetic active). As you can see there are now multiple regions of the sun that have the magnetic residue of magnetic flux tubes that have been ripped apart in the convection zone as they no longer have sufficient strength to resist the turbulent forces in the convection zone and no sunspots.
http://www.solen.info/solar/
It appears based on observations that the sun will be spotless by late 2014 or early 2015.
Re: There is no doubt – we all know that lower solar irradiance will result in lower temperatures on this planet. Lower irradiance, yes .. but fewer sunspots? Willis really made an impression on me with: http://wattsupwiththat.com/2014/06/23/maunder-and-dalton-sunspot-minima/ His point was the questionable data quality of this feature for which “there is no doubt.”
My brain is short-circuiting.
Did I just read a climate scientist questioning his own work?
Climate scientists are not supposed to do that. That is science in the old-fashioned way.
Did I just read a climate scientist inform how a scientific theory or model can be tested?
That’s old school, as when Einstein, after presenting his Theory of Relativity, informed the world how his theory could be tested during a solar eclipse and even telling them what had to happen for the theory to be invalidated.
Mann, et al flew in the face of thousands of peer-reviewed studies and was immediately accepted, without question, by “2500 of the world’s top Climate Scientists”.
That’s the way climate science works. Please do not deviate from the path.
The science is settled.
William Astley says:
June 28, 2014 at 8:48 am
It appears the sunspot count is being propped up which is a misguided effort as it will make the sudden fall in sunspot count more pronounced.
Nonsense, William. Amateurs all over the world count spots and you cannot meaningfully claim that they are in on the hoax.
magnetic flux tubes that have been ripped apart in the convection zone as they no longer have sufficient strength to resist the turbulent forces in the convection zone and no sunspots.
As you have been told many times, ALL flux tubes are ALWAYS ripped apart in the convection zone.
David,
I think you are still right. Within 18 months, perhaps, but I’m still looking for 2015 as the start of cooling beyond ALL of the models. I don’t think the world will plunge into a Dalton, but your work has the advantage of strong observational evidence.
It is not imperative that the process be understood, but that the implications of observations be understood – if you are grounded. The pragmatist recognizes “cash value” as one of the determinants of truth: whatever you figure out has to have use, something that takes you forward, something that benefits you in a way you weren’t benefited before. You have seen a connection; that is the start, just as Copernicus saw a mathematical solution in circular (or elliptical) orbits that answered big questions about our universe. Copernicus did so without gravitational physics, and at the time nobody expected him to say why, exactly. It was enough to understand how it was; the “why” was someone else’s project.
We live in interesting times. The next couple of years I see as very exciting, because if the world cools by more than 0.2C, and the continental interiors by perhaps 1.0C, the CAGW narrative will be well and truly busted. But more importantly, Gore, Hansen, Romm, McKibben will HAVE to admit that they were fighting for a noble cause, not for the climate per se, in other words, the science was not important but a tool to them.
By the way, for our Canadian readers, Suzuki does NOT support explicitly or implicitly Gore, Hansen, the IPCC or Global Warming/CAGW. When pressed, his Foundation says he/they support “peer-reviewed studies”. That’s it. They USE CAGW, but do not necessarily stand behind it. Suzuki recognizes it is an edifice built on sand, and it and its believers are therefore useful even if, as time goes on, they are the “useful idiots” as identified by the Soviets.
The following is more research data and conclusions of many. Some will agree while others will not . But his need to be brought out which is what I am doing to show there is a strong case to be made for solar variations and the secondary effects these solar variations could have on the climate and why they could have those effects.
Solar interactions with EarthEdit
There are several hypotheses for how solar variations may affect Earth. Some variations, such as changes in the size of the Sun, are presently only of interest in the field of astronomy.
Changes in total irradianceEdit
◾ Overall brightness may change.
◾ The variation during recent cycles has been about 0.1%.
◾ Changes corresponding to solar changes with periods of 9–13, 18–25, and >100 years have been measured in sea-surface temperatures.
◾ Since the Maunder Minimum, over the past 300 years there probably has been an increase of 0.1 to 0.6%, with climate models often using a 0.25% increase.
◾ One reconstruction from the ACRIM data show a 0.05% per decade trend of increased solar output between solar minima over the short span of the data set. These display a high degree of correlation with solar magnetic activity as measured by Greenwich Sunspot Number. Wilson, Mordvinov (2003)
Changes in ultraviolet irradianceEdit
◾ Ultraviolet irradiance (EUV) varies by approximately 1.5 percent from solar maxima to minima, for 200 to 300 nm UV.[20]
◾ Energy changes in the UV wavelengths involved in production and loss of ozone have atmospheric effects. ◾ The 30 hPa atmospheric pressure level has changed height in phase with solar activity during the last 4 solar cycles.
◾ UV irradiance increase causes higher ozone production, leading to stratospheric heating and to poleward displacements in the stratospheric and tropospheric wind systems.
◾ A proxy study estimates that UV has increased by 3% since the Maunder Minimum.
See also: Error: Template must be given at least one article name
Changes in the solar wind and the Sun’s magnetic fluxEdit
◾ A more active solar wind and stronger magnetic field reduces the cosmic rays striking the Earth’s atmosphere.
◾ Variations in the solar wind affect the size and intensity of the heliosphere, the volume larger than the Solar System filled with solar wind particles.
◾ Cosmogenic production of 14C, 10Be and 36Cl show changes tied to solar activity.
◾ Cosmic ray ionization in the upper atmosphere does change, but significant effects are not obvious.
◾ As the solar coronal-source magnetic flux doubled during the past century, the cosmic-ray flux has decreased by about 15%.
◾ The Sun’s total magnetic flux rose by a factor of 1.41 from 1964–1996 and by a factor of 2.3 since 1901.
Effects on cloudsEdit
◾ Cosmic rays have been hypothesized to affect formation of clouds through possible effects on production of cloud condensation nuclei. Observational evidence for such a relationship is inconclusive.
◾ 1983-1994 data from the International Satellite Cloud Climatology Project (ISCCP) showed that global low cloud formation was highly correlated with cosmic ray flux; subsequent to this the correlation breaks down.[21]
◾ The Earth’s albedo decreased by about 2.5% over 5 years during the most recent solar cycle, as measured by lunar “Earthshine”. Similar reduction was measured by satellites during the previous cycle.
◾ Mediterranean core study of plankton detected a solar-related 11 year cycle, and an increase 3.7 times larger between 1760 and 1950. A considerable reduction in cloud cover is proposed.
◾ A laboratory experiment conducted by Henrik Svensmark at the Danish National Space Center was able to produce particles as a result of cosmic ray-like irradiation, though these particles do not resemble actual cloud condensation nuclei found in nature.[22]
Other effects due to solar variationEdit
Interaction of solar particles, the solar magnetic field, and the Earth’s magnetic field, cause variations in the particle and electromagnetic fields at the surface of the planet. Extreme solar events can affect electrical devices. Weakening of the Sun’s magnetic field is believed to increase the number of interstellar cosmic rays which reach Earth’s atmosphere, altering the types of particles reaching the surface. It has been speculated that a change in cosmic rays could cause an increase in certain types of clouds, affecting Earth’s albedo.
Geomagnetic effectsEdit
Magnetosphere rendition
Solar particles interact with Earth’s magnetosphere
The Earth’s polar aurorae are visual displays created by interactions between the solar wind, the solar magnetosphere, the Earth’s magnetic field, and the Earth’s atmosphere. Variations in any of these affect aurora displays.
Sudden changes can cause the intense disturbances in the Earth’s magnetic fields which are called geomagnetic storms.
Solar proton eventsEdit
Energetic protons can reach Earth within 30 minutes of a major flare’s peak. During such a solar proton event, Earth is showered in energetic solar particles (primarily protons) released from the flare site. Some of these particles spiral down Earth’s magnetic field lines, penetrating the upper layers of our atmosphere where they produce additional ionization and may produce a significant increase in the radiation environment.
Galactic cosmic raysEdit
File:Heliosphere drawing.gif
An increase in solar activity (more sunspots) is accompanied by an increase in the “solar wind,” which is an outflow of ionized particles, mostly protons and electrons, from the sun. The Earth’s geomagnetic field, the solar wind, and the solar magnetic field deflect galactic cosmic rays (GCR). A decrease in solar activity increases the GCR penetration of the troposphere and stratosphere. GCR particles are the primary source of ionization in the troposphere above 1 km (below 1 km, radon is a dominant source of ionization in many areas).
Levels of GCRs have been indirectly recorded by their influence on the production of carbon-14 and beryllium-10. The Hallstatt solar cycle length of approximately 2300 years is reflected by climatic Dansgaard-Oeschger events. The 80–90 year solar Gleissberg cycles appear to vary in length depending upon the lengths of the concurrent 11 year solar cycles, and there also appear to be similar climate patterns occurring on this time scale.
Cloud effectsEdit
Changes in ionization affect the abundance of aerosols that serve as the nuclei of condensation for cloud formation. As a result, ionization levels potentially affect levels of condensation, low clouds, relative humidity, and albedo due to clouds. Clouds formed from greater amounts of condensation nuclei are brighter, longer lived, and likely to produce less precipitation. Changes of 3–4% in cloudiness and concurrent changes in cloud top temperatures have been correlated to the 11 and 22 year solar (sunspot) cycles, with increased GCR levels during “antiparallel” cycles.[23] Global average cloud cover change has been found to be 1.5–2%. Several studies of GCR and cloud cover variations have found positive correlation at latitudes greater than 50° and negative correlation at lower latitudes.[24] However, not all scientists accept this correlation as statistically significant, and some that do attribute it to other solar variability (e.g. UV or total irradiance variations) rather than directly to GCR changes.[25][26] Difficulties in interpreting such correlations include the fact that many aspects of solar
David, there are a raft of problems with this analysis.
First and foremost, David’s Evan’s claim of a notch filter is a joke. If you run his model against white noise instead of global temperatures, you get an identical notch. Is it your contention that there is a “notch filter” in white noise?
Next, David Evans has not released the data, the model, the model results, the equations, the out-of-sample tests, or any of the details. This is the same garbage we got from Michael Mann and Phil Jones. And now, here you are cluttering up WUWT with the same kind of garbage. There is no transparency. There is no data. There is no code. In what alternate universe does this pass for science?
Next, as Leif points out, he’s using a bogus set of TSI data.
Next, he posits an incredibly intricate model, vis:
Really? We’re supposed to believe that the climate has all of these items, neatly connected in a very specific order?
In any case, this is one of the most complex and useless curve-fitting exercises I’ve ever seen … and to date, we still don’t even know how many tunable parameters have been harmed in the process of making the whole thing look realistic.
I’m sorry, David, but your attempt to channel Michael Mann’ data-withholding, code-withholding style is just as offensive when you do it as when he does it. I begged Jo and David to publish, and I got the same answer we’ve gotten from every other pseudo-scientist, that for me to ask was wrong, wrong, wrong, and that they’d publish the code and data and out-of-sample tests when they damn well felt like it … science at its finest.
In any case, David, since you are among the blessed few, how about you tune the model using the first half of the data, and then see what it predicts for the second half … Jo said that David has already done that, but they’ve refused to release the results.
The most bizarre part of this whole thing is that I’ve been saying that there is no 11-year cycle in the climate … and getting brickbats and abuse in return. Meanwhile, David Evans is saying the exact same thing over at JoNova’s, and people are genuflecting in awe and proclaiming that he’s a genius.
WUWT?
Finally, you say:
What? You mean that finally, after all these years, evil doubt has been banished and The Science Is Settled™? Gosh, that’s great to hear … how did I miss such a momentous occurrence? [/sarc]
In fact, as my recent series on the Maunder and Dalton minima have shown, IF (and it’s a big if) there is cooling from solar variations, it is so small as to be lost in the weeds.
I’m sad to see you and David Evans and Joanne taking up the habits of Mann and Jones, David. I’d thought y’all were scientists. Ah, well, live and learn.
w.
“Solar denialists”
For shame. Using “denialist” against your opponent is defamation. Period.
You concede that your own model (fantasy?) is iffy. So people that laugh at it deserve this label? You owe us all an apology.
What strikes me the most with the data I just presented is the significant increase in solar magnetic activity last century which corresponds to the temperature increase. In addition the increased solar activity of last century matches up quite strongly with ocean heat content changes.
Again because the climate system is so dynamic with so much noise cause and effect are not always going to be so obvious. which I talked about in my earlier post.
That is it thanks for the time.
David (Archibald).
I suspect that you may have overestimated the speed of system response from a fall in solar activity bearing in mind that the oceans have been accumulating energy since the depths of the LIA.
The thermohaline circulation takes 1000 to 1500 years to run its course and it does apply a moderating influence on sea surface temperatures.
As per the solar climate model of David Evans the thermal response of the Earth system to a single solar cycle is smeared across 3 to 15 years and ultimately negated by the thermal inertia of the system (probably due to the oceans) but we have had a lot of accretion to ocean heat content since 1600 and it is going to take more than one quiet solar cycle to start making a dent in that.
IMHO I think that if we just see a trend change towards net cooling over the next 5 years that will be enough to validate the solar theory without having to expect more.
Especially if our CO2 emissions keep rising at the current rate.
To validate the CO2 theory we would need to see a rise in atmospheric temperature DESPITE a quiet sun and a negative Pacific Multidecadal Oscillation (PMO).
We should stop using the term PDO in favour of PMO because Bob Tisdale correctly tells us that PDO refers only to a surface pressure differential which has no causative effect in itself.
New ideas are always welcome but I see several serious problem with Dr Evans’ idea that he has not replied to.
1. The idea of 0.5K worth of “nuclear winter” is frankly a fudge factor. If you look at how they present it you can see they know they are pushing the limits. A couple of years ago I tried to find some variation in temperature close to some of the major aerial tests, fully expecting to be able to find something. I was mistaken, I could not find anything, even speculative.
To get from there to 0.5K which is almost the total “global warming” over the last 100 years…. sorry, that requires some pretty firm evidence, not a fudge factor pulled out of the air.
2. The idea of the “notch” filter is an error of interpretation. He starts from the assumption that TSI is _the_ input and SST is _the output. Then does an EE’s FFT on input / FFT of output as a “blackbox” investigation.
This is to erroneously generalise a specific case ( in electronics ) where the input and the output are known and measured, to a much more messy case where he is guessing the two quantities are the input and the output.
Even is SST can be hypothesised to be the “output” there is not justification for thinking that the low frequency noise in SST is the LF part of SSN passed through the “transfer function” of the climate system. It almost certainly is not.
Of that is borne his , IMO, spurious idea of a notch filter. There is an 11y peak in the “input” and no 11y peak in the “output”.
What is more he clearly states that the “notch filter” is non-causal. This makes it physically meaning as a model for a physical system which must be causal. ( He also runs it backwards in time too, just as well it’s non causal ).
I see not reason to conclude an 11y “notch” filter, rather than a >11y low-pass filter which could at least be physically meaningful and easier to justify.
It would be equally valid to conclude from what he presents in FFT that there is no discernible connection between input and output. No doubt that will please uncle Willis.
Then he has to go fishing for another fudge factor to explain the lag he needs to make the notch filter line up.
At this point I think he needs to ask if the model is both physically realistic and parsimonious.
I would say it’s neither.
Now I recently showed that there is a roughly 10y lag between SSN and SST.
http://climategrog.wordpress.com/?attachment_id=958
( Correlation does not prove causation but it’s there, on average ).
I also showed that a more physically realistic, yet equally speculative, link can be obtained by a relaxation response to SSN:
http://climategrog.wordpress.com/?attachment_id=981
short term ( 11y ) detail shows phase drift as has often been noted ( except by cherry-pickers ) , however the underlying, long term trend seems to match rather well.
There is a notable divergence since about 1990 but it would be an easier starting point that the “notch-delay” scheme.
I think the idea of trying to construct a non AGW model is a good exercise but the Evans model has serious issues as it stands.
oops: What is more he clearly states that the “notch filter” is non-causal. This makes it physically meaningless as a model
Doug Proctor says:
“But more importantly, Gore, Hansen, Romm, McKibben will HAVE to admit…”
Will never happen. These guys, and their ilk, will always have a dodge or an excuse of some kind.
http://wattsupwiththat.com/2014/06/28/a-cool-question-answered/#comment-1671519
Willis’ block diagram simplifies it nicely from Evans’ verbiage. The the jonova posts are now at “Big News VII” without any maths being presented getting near to a joke. (Perhaps beyond)
Ah, the graphic is from jonova.
http://jonova.s3.amazonaws.com/evans/graphs/part-iii-fig-6-schematic-cotch-delay-solar-filter.gif
David Evans’ notch-filter theory of the climate is infinitely fine-tuned:
http://motls.blogspot.nl/2014/06/david-evans-notch-filter-theory-of.html
I last thought.
At this stage I believe neither side is going to be able to convince the other side they are correct. Everyone has dug in and are convinced they are correct.
Time will tell and it is not far off.
This has me confused. Total Solar Irradiance (TSI) varies from a smoothed high of 1366.5 W/m2 to a low of 1365.5, or +/- 0.5 W/m2. This represents a change of less than 0.04% in TSI over a complete solar cycle, i.e. 100*(0.5)/1366. This is responsible for climate changes of 0.5 deg C? If that is the case we never evolved because the earth is too sensitive to changes in TSI to support life.
The story of Icarus from Greek mythology should be borne in mind by anyone trying to predict the climate by looking ONLY at the sun’s output. Also bear in mind the theories of next years harvest based on previous correlations with sacrificed goats.
This article gives scepticism a bad name.
greg Goodman commented on A Cool Question, Answered?.
It does indeed please uncle w.. and I pointed it out to David Evans. You get the same result running his magic model against white noise instead of the global surface temperature.
All Evans has shown to date is that the surface temperature is immune to small changes in the solar input, either fast or slow … which I’ve been saying for some time now …
w.
For about three years now, I have read every paper I could find on the subject of the N. Atlantic, analysed records of the CET, NAO, AMO, AO, etc, .
What I have learned is that there are very few authors (mainly oceanographers) who understand the ocean-atmosphere system operating there. However that doesn’t mean that the complexity of causes is entirely clear to anyone I came across.
Therefore, I would suggest that anyone’s guess Archibald’s, Evans’, yours or mine is as good or as bad as any other is.
I await the rest of David Evans conjecture.
So far I like the roll out and approach.
If the solar data used is rubbish and the land based temperature record as flawed as I believe, then there is also a chance the proposed model can be useful.
G.I.G.O can produce weird truths.
What I do admire is the process, soon enough all of the Australian Duo’s theory will be on line for all to see and assault.
leif says
http://www.leif.org/research/TSI-since-2003.png
annum
henry says
I have recently updated my tables [to 2014]
and find that we already cooled from 2000-2014 by -0.014K/annum [for Means]
that is -0.2K in total since 2000, globally…..
If anyone does not get the same results, then that is your fault, not mine.
As to what is causing the cooling, [I think} I have figured that out too.
As you can see from Leif’s chart, the trend of TSI is somewhat up, rather than down.
I figure that there must be a small window at the top of the atmosphere (TOA) that gets opened and closed a bit, every so often. Chemists know that a lot of incoming radiation is deflected to space by the ozone and the peroxides and nitrogenous oxides lying at the TOA. These chemicals are manufactured from the UV coming from the sun. Luckily we do have measurements on ozone, from stations in both hemispheres. I looked at these results. Incredibly, I found that ozone started going down around 1951 and started going up again in 1995, both on the NH and the SH. Percentage wise the increase in ozone in the SH since 1995 is much more spectacular.
This is the graph (I think also from Leif) that is relevant here:
http://ice-period.com/wp-content/uploads/2013/03/sun2013.png
[if you can predict where it is going, which should not be so difficult for Leif?]
So it appears there is some variation within TSI, mainly to do with the UV (C). It appears (to me) that as the solar polar fields are weakening, more energetic particles are able to escape from the sun to form more ozone, peroxides and nitrogenous oxides at the TOA.
In turn, these substances deflect more sunlight to space when there is more of it. So, ironically, when the sun is brighter, earth will get cooler. This is a defense system that earth has in place to protect us from harmful UV (C).
Most likely there is some gravitational- and/or electromagnetic force that gets switched every 44 year, affecting the sun’s output. How?
You tell me?
Anyone got any ideas?
I consider that this analysis is dubious, at best.
that said, it appears that there is some measure of correlation between a quiet sun and lower temperatures. Why that is the case, the mechanisms etc involved is not clear, and since correlation does not necessarily point to causation, past observations may be nothing more than coincidental.
However, it does appear likely that the sun is entering a quiet phase. Obviously, this is not certain, but the balance of observational data, and such little understanding that we have regarding the workings of the sun and its behavoir, points towards that conclusion.
If the sun does go quiet over the next 10 to 20 years or so, we will get an opportunity to observe what happens here on planet Earth. In particular, we will get to see whether temperatures increase, continue to stay steady, or decrease, and if the ‘pause’ in temperature anonaly is broken, we will get to see the rate of change.
If the sun goes quiet and if temperatures begin to rise, then that will add weight to the (c)AGW theory, and will cast doubt on the sun being a major player. On the otherhand, if temperatures begin to fall, this will not prove that it is ‘the sun stupid’, but it will certainly lead scientists to consider in more detail the role that the sun plays in driving temperatures here on planet Earth. In this latter scenario, I would expect to see an increase in the number of papers suggesting that the sun is a significant driver of temperature, and conjecture as to why this is the case. These papers will also no doubt suggest that climate sensitivity to CO2 is less than previously suggested.
It will be insteresting to revisit this in 10 to 20 years time. If we see a fall of temperatures over the next 10 to 20 years of say 0.2 to 0.3 degC per decade, it will be interesting to see whether lief is less certain on his views as to the extent to which the sun and changes in its activity influence temperatures here on planet Earth.
Whilst any prediction is always interesting, especially since it leads to an opportunity of falsification, in reality we know and understand so little that these predictions are nothing more than a guess. I would not even clasify them as an educated guess, but of course where reasons are put forward, they are a reasoned guess.
Lets wait and see. Matters may well be much clearer in the coming decade. My only concern about sitting back and waiting to see what, if anything of note happens, is the risk that in the meantime our political leaders will have destroyed our energy generation, and will have locked us all into high energy prices put considerable stress on the consumer and rendering industry uncompetitive. thank heavens for the fact that the western economies are burdened by so much socialist debt and substantial deficits that the western economies have been forced to slow down there pursuit of green and renewable technoligies. This high level of debt probably means that we can sit back and see what happens over the coming decade.
I would not fault the Evans-Nova team for their roll-out. Think of the early posts as the abstract of the paper that they will release. OK, they set the all-time record for complexity and convolution in an abstract, but that seems to be the idea. They believe, for rhetorical purposes, that their paper will be more effective if the audience sees a semi-technical exposition first. That may be wrong, for some readers, but since the climate science world will get all the code and data within about two weeks, their approach hardly seems a crime against science. After all, there was a time when it would take more than two weeks to get a letter from Australia.
Their approach certainly compares favorably with the Team, whose data releases have been delayed for years or more in some cases.
In reply to:
“There is no doubt – we all know that lower solar irradiance will result in lower temperatures on this planet. It is a question of when. Solar activity is much lower than it was at a similar stage of the last solar cycle but Earthly temperatures have remained stubbornly flat. Nobody is happy with this situation. All 50 of the IPCC climate models have now been invalidated and my own model is looking iffy.”
To make an accurate prediction of what will happen next it is necessary to understand what is happening to the sun currently and the physical reasons why the planet warmed in the last 150 years. Roughly 90% of the warming in the last 150 years was caused by solar magnetic modulation of planetary cloud cover. There is now observation evidence that what was inhibiting the solar magnetic modulation of planetary cloud cover has started to abate. The planet has started to cool, there is record sea ice in the Antarctic and Arctic sea is starting to recover. Cloud properties and periods of cloud cover have started to increase in high latitude regions. The number of high precipitation events has started to increase.
There is a physical reason for the delay in cooling (something is physically inhibiting the solar modulation of planetary cloud cover mechanisms). If solar magnetic modulation of planetary cloud cover mechanism was not inhibited (the inhibiting started around 2003) the planet would have cooled due to the following:
1) Solar wind burst intensity has dropped by a factor of two due to the reduction in the heliosphere density by 40%
2) The number of high speed protons striking the earth is the highest ever measured during a solar maximum. During a solar maximum the solar heliosphere increases in extent and there is an increase in the number of magnetic flux pieces from the sun that are ejected into the heliosphere. A ‘stronger’ (more magnetic flux pieces and a greater extent) solar heliosphere deflects and blocks more high speed cosmic protons.
The high speed cosmic protons strike the earth’s atmosphere creating ions that strongly affect cloud droplet size and the duration that clouds persist. Due to the current weakening of the solar heliosphere the number and intensity of the high speed cosmic protons that strike the earth (the high speed cosmic protons are called galactic ‘rays’ (GCR) or cosmic ray flux CRF for historical reasons. The first discovers of the phenomena though the effect has caused by a ray rather than particle and the idiotic scientific community names phenomena after discoverers and keeps confusing terminology due to weird sociological reasons.) that are striking the earth is the highest ever measured during a solar maximum.
http://cosmicrays.oulu.fi/webform/query.cgi?startday=27&startmonth=03&startyear=1969&starttime=00%3A00&endday=14&endmonth=05&endyear=2014&endtime=00%3A00&resolution=Automatic+choice&picture=on
Comment: Solar wind bursts create a space charge differential that removes cloud forming ions from high latitude regions of the earth and changes the cloud droplet size in the tropic region clouds of the planet by a process that is called electroscavenging. At high latitude regions the removal of ions reduces the amount of cloud cover which causes high latitude warming. It should be noted that solar wind bursts are created both by sunspots and coronal holes. The cause of solar coronal holes is not known. If there are low latitude coronal holes during a solar magnetic cycle minimum there will be solar wind bursts which will remove ions from the earth’s atmosphere which makes it appear incorrectly that high levels of GCR does not correlate with an increase in cloud cover.
A reduction in GCR causes there to be less clouds in high latitude regions of the planet. The reduction in GCR has no significant effect in the low latitude regions are the GCR in question is blocked due to orientation of the magnetic field. (See Svensmark’s book Chilling Stars for an explanation of the GCR mechanism.)
The increase in cloud droplet size in the tropic region when there are electroscanvenging events, causes the tropical clouds to be less transparent to long wave radiation which amplifies El Niño events. As most are aware something is now inhibiting El Niño events. As most are aware there is now an unexplained increase in sea ice both poles which supports the assertion that cloud cover is increasing at high latitude regions. Both of these observations support the assertion that what ever has inhibiting the solar magnetic cycle modulation of planetary cloud cover is abating.
P.S.
The IPCC models are fundamentally incorrect. The AGW mechanism saturates at high altitudes (the lack of warming in the tropic troposphere at 10 km issue) and the planet resists forcing changes by an increase or decrease of clouds in the tropics (sensitivity issue).The majority of the warming in the last 150 years was caused by solar magnetic cycle modulation of planetary cloud cover. Observational evidence to support this assertion would be the sudden and rapid reversal of the warming in the last 150 years. The majority of the cooling will occur over the next 3 to 4 years, not 2020.
Leif:
This is a link to the latest visual picture of the sun. http://sdo.gsfc.nasa.gov/assets/img/latest/latest_4096_4500.jpg
How many sunspots do you see? Do you observe pores (tiny sunspots) or sunspots. Why are there no large sunspots as observed in previous solar cycles? How long are you going to keep up the charade that the solar cycle 24 changes are not unprecedented? I notice you have no explanation for what is happening to the sun and you have no prediction of what will happen next based on a physical model and mechanisms which can be used to falsify or confirm your ‘beliefs’ and what ever physical model those beliefs are based on.
P.S. Amateur solar observers have noted there is an unexplained change to solar magnetic cycle and that the sunspot count is rigged in a misguided effort to try to hide what is happening. P.S. The gig will be up when the planet cools.
HenryP says:
June 28, 2014 at 9:58 am
“Incredibly, I found that ozone started going down around 1951 and started going up again in 1995, both on the NH and the SH. Percentage wise the increase in ozone in the SH since 1995 is much more spectacular.”
Quite so:
http://www.newclimatemodel.com/new-climate-model/
“11) Solar activity passes its peak and starts to decline.
12) Ozone levels start to recover. The stratosphere warms.”
which is the reverse of standard climatology 🙂
http://gravity.wikia.com/wiki/Solar_variation
The above presents much data that supports the case that is being made by those of us who feel primary and secondary solar changes play a very important role in climatic outcomes over time.
Again I am going to repeat the climate is non linear, chaotic and random not to forget the initial state of the climate is in constant flux and thresholds are out there which means a given force put upon the climate is NOT going to give the same result. Lag times are also involved which are tied into the initial state of the climate.
There is so much noise in the climate system which often times in the short run will obscure factors which indeed correlate to the climate but not over the long term which is where we are now with the given prolonged solar minimum.
Enough duration of time and degree of magnitude change in activity has now taken place (once solar cycle 24 max ends which is happening now) which should start showing up in the climatic system. Year 2014 will be the last year with out a global temperature decline.
William Astley says:
June 28, 2014 at 10:14 am
Roughly 90% of the warming in the last 150 years was caused by solar magnetic modulation of planetary cloud cover.
There is no evidence for that. And all the rest of your stuff are misunderstandings, unsupported, and rambling nonsense.
This is a link to the latest visual picture of the sun. http://sdo.gsfc.nasa.gov/assets/img/latest/latest_4096_4500.jpg
How many sunspots do you see? Do you observe pores (tiny sunspots) or sunspots.
There are six groups with a total of 11 spots, so the official sunspot number is 0.6*(10*6+11)=43, which is what SILSO [formerly SIDC] reports for today http://www.sidc.be/silso/home
Since the spots are smallish, they will not be weighted.
You can cut the crap about sunspot counts being manipulated.
In due course this will boil down to a simple issue.
Solar changes cause albedo changes on the Earth which affect the proportion of TSI that gets into the oceans to drive the climate system.
Cloudiness is responsible for those albedo changes.
Svensmark suggests that changes in the amount of available cloud condensation nuclei (affected by cosmic ray amounts) are the relevant parameter.
I suggest that cloudiness changes are a consequence of changes in the length of the lines of air mass mixing when jet stream tracks become more meridional or zonal as a result of the permanent climate zones altering their latitudinal positions and that solar variability alters those positions via differential changes in ozone concentrations above the tropopause.
David Evans’s ‘force x’ is the change in the mix of wavelengths and particles from the sun which causes those differential changes in ozone concentrations above the tropopause.
Any better ideas?
We should see result even before the climate summit the coming year(november) in Paris, if it really would happen that the temperature have dropped by a little bit at that time that would be a blessing.
An what about the El Nino, would that be a false tune in the story.
Willis said:
“All Evans has shown to date is that the surface temperature is immune to small changes in the solar input, either fast or slow … which I’ve been saying for some time now ”
Yes, Willis, and you received credit for that limited insight.
I told you that you needed to expand it beyond tropical thunderstorms but did you listen ?
It is a matter of the entire global air circulation responding to solar (or any other) variations in order to maintain system stability.
The entire global air circulation is intimately tied to adiabatic uplift and descent which I was previously abused for drawing attention to on this very site.
C’est la vie.
I notice that I am being subjected to moderation these days simply for expressing an unpopular opinion.
Sceptics are right to scoff at the Team’s “gas jar” theories of the climate system, but should not then fall prey to much worse hubris, claiming to be able to predict the coupled Sun/Earth/Cosmic-ray system (complete with electromagnetic radiation, many gases, ionisation, water in 3 states, heat, biological systems, …) with a simple filter.
I can’t believe that some people are falling for this.
The real point is planning. Are you an ant or a grasshopper? 🙂
lsvalgaard says:
June 28, 2014 at 10:28 am
There are six groups with a total of 11 spots, so the official sunspot number is 0.6*(10*6+11)=43, which is what SILSO [formerly SIDC] reports for today http://www.sidc.be/silso/home
Since the spots are smallish, they will not be weighted.
Since there is a large sunspot just coming around the East limb, the final sunspot number for the day may be adjusted upwards [SILSO updates the count is real-time].
To all those commenting that if you perform the cross-correlation using white noise you get a notch filter, well yes that is true. I posted several places with my concerns about that that. I think that was Lubos’ concern and why he rejected it. I asked David Evans. Unlike some commenters here, he is not rude and arrogant and is prepared to have a polite debate. I finally understood where he is coming from. David Evans is saying IF we assume temperature change is linked to TSI (in some unknown way) what would the transfer function look like? The answer is a low pass plus notch filter.
David is not saying he is correct. He knows he is invoking some unknown “Factor X”. David’s position is very clear because he states in the latest blog, proposing his prediction but says very clearly “If the criterion does not occur: Then the notch-delay solar model is falsified and it should be thrown away.”
He knows the model could be rubbish and disproven. The experiment is taking place as we wait, over the next 5 – 10 years. It could be interesting seeing how it plays out.
For those complaining about his filter being non-causal, this is not strictly correct. In his analysis he divided the amplitude spectra of input and output to estimate the amplitude spectrum of the transfer function (under his assumption), but he did not estimate the phase spectrum of the “transfer function” because it was too noisy. The notch filter is clearly going to be SEEN as zero phase based on this analysis ie non-causal. The notch filter could just be an artefact ie TSI is not in temperature signals (that was my objection). But IF you make the assumption it is a real filter, then to make it causal it needs a delay, which is about 11 years (between 10 and 20 years).
David is fully aware of the assumptions he is making. And as he says, “If the criterion does not occur: Then the notch-delay solar model is falsified and it should be thrown away.”.
That is a pretty honest way to present your work.
And the spreadsheet is coming very shortly, as David has said many times, so a lot of the complaints here look to me rather premature.
ThinkingScientist says:
June 28, 2014 at 11:02 am
He knows the model could be rubbish and disproven. The experiment is taking place as we wait, over the next 5 – 10 years. It could be interesting seeing how it plays out.
We don’t need to wait. As he uses incorrect input the model is already rubbish.
JJM Gommers says
http://wattsupwiththat.com/2014/06/28/a-cool-question-answered/#comment-1671577
Henry says
Are you saying it is not cooling yet?
http://www.woodfortrees.org/plot/hadcrut4gl/from:1987/to:2015/plot/hadcrut4gl/from:2002/to:2015/trend/plot/hadcrut3gl/from:1987/to:2015/plot/hadcrut3gl/from:2002/to:2015/trend/plot/rss/from:1987/to:2015/plot/rss/from:2002/to:2015/trend/plot/hadsst2gl/from:1987/to:2015/plot/hadsst2gl/from:2002/to:2015/trend/plot/hadcrut4gl/from:1987/to:2002/trend/plot/hadcrut3gl/from:1987/to:2002/trend/plot/hadsst2gl/from:1987/to:2002/trend/plot/rss/from:1987/to:2002/trend
Check my comment here
http://wattsupwiththat.com/2014/06/28/a-cool-question-answered/#comment-1671561
“The model has temperature falling out of bed to about 2020 and then going sideways in response to the peak in Solar Cycle 24.”
It will do on CET up to 2024, but not for global temperatures, there will more frequent El Nino, like through the coldest years of Dalton (1807-1817), and a renewed warm AMO. Global temp’s will creep down slowly, then briefly nosedive when the first stronger La Nina happens.
Should not forget about gamma radiation – the weaker the magnetic field of the sun rise GCR including gamma rays and muons, which strongly ionize the atmosphere to the surface itself.
ren says:
June 28, 2014 at 11:11 am
Should not forget about gamma radiation – the weaker the magnetic field of the sun rise GCR including gamma rays
You can forget about gamma rays. The cosmic ‘rays’ are not rays and in particular not gamma rays.
Mr Svalgaard should beware of the solecism of the expert – to assume that because he knows something he knows everything. He has disgracefully accused Dr Evans of being “almost fraudulent” in that, according to Mr Svalgaard, the TSI data he is using are incorrect.
Here is the unique resource locator of Dr Evans’ TSI graph:
http://jonova.s3.amazonaws.com/evans/graphs/prediction/total-solar-irradiance.gif
And here is the unique resource locator of the graph covering much the same period from Krivova et al, which appeared in IPCC AR5 (2013) and has been updated since by the SORCE Total Irradiance Monitor team, the originators of Mr Svalgaard’s graph:
http://jonova.s3.amazonaws.com/evans/graphs/prediction/total-solar-irradiance.gif
The two graphs appear to me to be strikingly similar. On the data, therefore, Dr Evans (who should not be underestimated) is correct and Mr Svalgaard, the supposed “expert”, is not only wrong but libelously wrong. An immediate and abject apology seems in order.
“X”, an unknown quantity, “Spurt”, a drip under pressure.
Next, I had a look at Mr Svalgaard’s graph of total solar irradiance from 2003. The graph is similar to that of the SORCE/TIM graph, except that Mr Svalgaard, without saying so and without explaining how, has inserted trend data imaginatively covering a recent gap of about nine months in the data from SORCE.
Now, it is not for me to say whether Mr Svalgaard’s reconstruction of the trend on the absent SORCE data is reasonable, for I am no drip under pressure. However, to refer readers to a link to a graph that has been tampered with, and without also referring to a link that explains the tampering, and to use the tampered graph as the basis for accusing a diligent scientist of “almost fraudulent” conduct while suppressing a graph from the same source that confirms the rightness of Dr Evans’ data in every material particular, does not fill one with confidence in Mr Svalgaard’s scientific judgment, still less in his probity.
To Mr Eschenbach and others who deplore the absence of mathematics in Dr Evans’ slowly-unfolding blog account of his unpaid researches over many years, I should explain that he agonized long and hard about how to release his results and concluded, with great regret, that attempting to publish them in the once-learned journals would be pointless. Therefore, he is first giving an outline of what he has done – and, from the number of hasty comments from the usual suspects condemning his work before they have seen the details, his outline has inspired more than a little terror in the camp of the Thermageddonites.
In due course, when he is ready, he will no doubt make all relevant details available. You can be sure that he will not be taking the Michael Mann or Phil Jones approach to disclosure.
Finally, to those who, like Mr Svalgaard, inappropriately and repellently suggest that Dr Evans has a “hidden agenda”, anyone who knows Dr Evans would at once dismiss that notion. First, he has been working unpaid on his theory for years. Secondly, he was once a Thermageddonite himself: he was lavishly paid to write carbon-accounting models for the Australian Government.
He was cured of the Thermageddonite affliction on learning that “Dr” Mann and “Dr” Overpeck and the IPCC had attempted to abolish the medieval warm period. On seeing what arrant nonsense was being published about that period, he resigned his comfortably-paid government post and decided to investigate at his own expense what he regarded as an outrageous abuse of the scientific method for profit.
He found,– as so many of us have similarly found – that the official story-line did not withstand scrutiny. And what possible “hidden agenda” could he have for declaring in advance not only that he expects a sharp fall in global mean surface temperature at some time between now and 2024 but also that if no such drop occurs his theory will have been falsified? That transparent approach is the approach of an honest scientist – an approach that Mr Svalgaard would do well to learn to emulate.
ThinkingScientist says:
June 28, 2014 at 11:02 am
Well said.
David Evans’s description is based on a ‘what if ‘ scenario.
If there is some solar influence other than TSI which is affecting Earth temperatures with a delay in the region of one solar cycle then that could explain a great deal.
That idea has the merit of being readily falsifiable within one solar cycle, maybe within 5 years or so from today.
I have put forward one possibility.
Svensmark has put forward another.
AGW theory is yet another.
Let us see how the cards fall.
Anyone who claims to know at present is an idiot 🙂
@ren
I am not disagreeing with you that global cooling will cause more clouds at the lower latitudes [since we are cooling from the top latitudes down] and that these clouds at the lower latitudes cause more deflection of sunlight and hence more cooling. So it is a chain of events.
Trenberth knew and recognized that ozone on its own is responsible for 25% of all that is absorbed and reflected back to space by the atmosphere. You will understand that if there is more of it [ozone], that there is more cooling?
Trenberth forgot and probably never knew that there are also other chemicals being formed TOA back radiating energy to space. Hence the term, “Trenberth’s missing energy”
….
Willis asserted: “You get the same result running his magic model against white noise instead of the global surface temperature.”
Alas it’s a deeper rabbit hole than that since their result includes a massive nuclear winter adjustment thrown in due to atomic testing, and this locks them in with a serious fluctuation added to any white noise test data. I also suspect that this is how they obtain their sudden plunge at the end, but that’s just an intuitive extension of having my BS detector already pinging so loudly. They even suggest nuclear radiation being itself at work, their only reference for this massive kludge being a brochure about the potential numbers out there for a real nuclear winter in the future. Climate modelers rely mostly on pollution-based aerosols to adjust for post 1970s cooling, but Evans uses nuclear testing instead. This also defeats your suggestion of early/late model testing or Motl’s suggestion of time reversing the record to retain its spectral character as differing test data since much of their variation is hard wired.
If a signal analysis algorithm from the mostly causual world of electronics can perfectly match any causually entrained pair of signals then why the nuclear testing adjustment at all? For a good match it’s not needed, by definition of using a transfer function as a “model.” Then I think of it as loading a spring so it eventually pulls the future down into a plunge.
That these most elementary criticisms were not proactively anticipated but now lead to hurt feelings and tribal clashes is a bit of a red flag too, since using a the very idea of using a signal matching algorithm as a physical model (that must invoke an unknown Force X since that provides an perfectly matching 11 year delay to cancel an 11 year input signal along with a speculative nuclear winter effect based on radioactivity) barely passes the laugh test since its a textbook example of arbitrary wiggle matching with a wrench thrown in to thwart testing.
Where were the proactive tests of uniqueness? Does the “nuclear option” provide a future plunge by biasing unknown Force X and does it also defeat tests of uniqueness with test data? Is this exercise helping to throw away the skeptical advantage of checking our own work like real scientists outside of climatology do? That they promote only a *future* test instead of a careful internal one is a gambler’s outlook with quite good odds given the sudden plunges every few decades in the main Greenland ice core:
http://oi61.tinypic.com/2cxbxw4.jpg
Skeptics are fatiguing of being marginalized, but grasping for oversimplified answers only adds to that marginalization.
@Lord Monckton
It seems both Willis and Leif are playing the devil’s advocate, probably to keep everyone [sceptic] on their toes?
“NikFromNYC says:
June 28, 2014 at 11:48 am”
That isn’t true at all.
David Evans was puzzled by the mid 20th century cooling and referred to the 1950s nuclear testing as a possible cause. Indeed I recall that being blamed for the cooling at the time.
Now, however, it is clear that the lower activity level of solar cycle 20 plus the negative phase of the PDO could have povided the explanation.
David’s offhand conjecture does not in any way derogate from his basic hypothesis.
“Trenberth knew and recognized that ozone on its own is responsible for 25% of all that is absorbed and reflected back to space by the atmosphere. You will understand that if there is more of it [ozone], that there is more cooling?”
Eh ???
More ozone means more warming and less ozone means less warmimg !!!
The presence of ozone in the stratosphere reacting directly with incoming solar energy is what causes the temperature inversion at the tropopause.
More ozone more warming and lower tropopause.
Less ozone less warming and higher tropopause.
Basic meteorology.
.
I have a list of solar parameters going forward that if achieved should have a significant impact on the climate, and sunspots is not one of them . Reason being look at all the different sunspot counts that are out there, and it is so subjective. I never seen a parameter with such a diversity of values.
This is why total surface of the sun covered with sunspots should be used as a guide for sunspot activity but then again solar flux corresponds quite well to area coverage of sunspots on the sun, and that is what I am going with as far as how active or not solar activity is.
Monckton of Brenchley says:
June 28, 2014 at 11:16 am
The two graphs appear to me to be strikingly similar. On the data, therefore, Dr Evans (who should not be underestimated) is correct and Mr Svalgaard, the supposed “expert”, is not only wrong but libelously wrong. An immediate and abject apology seems in order.
Nonsense. As I pointed out the most blatant error and the one on which the forecast hinges is the assertion that there has been a sudden and unprecedented drop in TSI in the 2003-2005 time frame. I showed that that is false.
Next, I had a look at Mr Svalgaard’s graph of total solar irradiance from 2003. The graph is similar to that of the SORCE/TIM graph
It is the SORCE/TIM data plotted every day [blue curve].
except that Mr Svalgaard, without saying so and without explaining how, has inserted trend data imaginatively covering a recent gap of about nine months in the data from SORCE.
The pink curve is simply the 27-day running average. The plotting program interpolates across data gaps, but that is totally irrelevant as you can remove that interpolation without any consequence.
David Evans is quoted: “If the criterion does not occur: Then the notch-delay solar model is falsified and it should be thrown away.”
O.K., anyone can bet this way who anticipates a downturn over the next few decades with any model they choose, but that plunge doesn’t prove the model is right even as it falsifies mainstream models. I’ve already provided my Greenland “model,” that climate even on century time scales is highly chaotic, and by probability alone, temperatures always plunge upon peaking. I don’t even need Force Y to make that claim. Now whose model will a future plunge better support, theirs or mine? They have one big advantage over me here: I have no causality to offer a test of uniqueness using test data but they do. So why aren’t they offering it upfront but instead concluding only that future tests are available?
lsvalgaard says:
ren says:
June 28, 2014 at 11:11 am
Should not forget about gamma radiation – the weaker the magnetic field of the sun rise GCR including gamma rays
You can forget about gamma rays. The cosmic ‘rays’ are not rays and in particular not gamma rays.
Cosmic rays are particles (mostly protons) accelerated to relativistic speeds. Despite wide agreement that supernova remnants (SNRs) are the sources of galactic cosmic rays, unequivocal evidence for the acceleration of protons in these objects is still lacking. When accelerated protons encounter interstellar material, they produce neutral pions, which in turn decay into gamma rays. This offers a compelling way to detect the acceleration sites of protons. The identification of pion-decay gamma rays has been difficult because high-energy electrons also produce gamma rays via bremsstrahlung and inverse Compton scattering. We detected the characteristic pion-decay feature in the gamma-ray spectra of two SNRs, IC 443 and W44, with the Fermi Large Area Telescope. This detection provides direct evidence that cosmic-ray protons are accelerated in SNRs.
http://www.sciencemag.org/content/339/6121/807
In reply to:
lsvalgaard says:
June 28, 2014 at 10:28 am
This is a link to the latest visual picture of the sun. http://sdo.gsfc.nasa.gov/assets/img/latest/latest_4096_4500.jpg
How many sunspots do you see? Do you observe pores (tiny sunspots) or sunspots.
There are six groups with a total of 11 spots, so the official sunspot number is 0.6*(10*6+11)=43, which is what SILSO [formerly SIDC] reports for today http://www.sidc.be/silso/home
Since the spots are smallish, they will not be weighted.
You can cut the crap about sunspot counts being manipulated.
William:
I would strongly suggest everyone have a look at the latest solar visual picture. (See link above.) How many sunspots do you count? Do you or do you not agree with Lief’s sunspot count above?
You have no explanation as to why the magnetic field strength of newly formed sunspots is decaying linearly, you have no explanation why sunspots are being replaced by pores, and you have no prediction as to what will happen next to the solar magnetic cycle. The sun will be spotless by late 2013, early 2014.
The planet has started to cool due to the sudden and abrupt change to the solar magnetic cycle which supports the assertion that some physical mechanism was inhibiting the solar magnetic cycle modulation of planetary cloud cover and the assertion that the solar magnetic cycle modulates planetary cloud cover.
The warming phase of the last 150 years and the enhanced warming phase of the last 30 years has happened again and again. The planet cyclically warms and cools, sometimes the cooling is abrupt. The forcing mechanism is the solar magnetic cycle. Name calling and emphatic statements will not change the physics of what happened in the past and what is happening now.
http://wattsupwiththat.files.wordpress.com/2012/09/davis-and-taylor-wuwt-submission.pdf
Davis and Taylor: “Does the current global warming signal reflect a natural cycle” (William: Yes)
…We found 342 natural warming events (NWEs) corresponding to this definition, distributed over the past 250,000 years …. …. The 342 NWEs contained in the Vostok ice core record are divided into low-rate warming events (LRWEs; < 0.74oC/century) and high rate warming events (HRWEs; ≥ 0.74oC /century) (Figure). … ….The current global warming signal is therefore the slowest and among the smallest in comparison with all HRWEs in the Vostok record, although the current warming signal could in the coming decades yet reach the level of past HRWEs for some parameters. The figure shows the most recent 16 HRWEs in the Vostok ice core data during the Holocene, interspersed with a number of LRWEs. …. ….We were delighted to see the paper published in Nature magazine online (August 22, 2012 issue) reporting past climate warming events in the Antarctic similar in amplitude and warming rate to the present global warming signal. The paper, entitled "Recent Antarctic Peninsula warming relative to Holocene climate and ice – shelf history" and authored by Robert Mulvaney and colleagues of the British Antarctic Survey ( Nature , 2012, doi:10.1038/nature11391),reports two recent natural warming cycles, one around 1500 AD and another around 400 AD, measured from isotope (deuterium) concentrations in ice cores bored adjacent to recent breaks in the ice shelf in northeast Antarctica. ….
One item to remember is this period of below normal solar activity started in 2005 so the accumulation factor is coming into play.
Secondly it is not just solar activity within itself but the secondary effects associated with solar variability which I feel are extremely hard to predict as far as how strongly (to what degree)they may change and thus effect the climate in response to long prolonged minimum solar activity.
I strongly suspect the degree of magnitude change of the prolonged minimum solar activity combined with the duration of time of the prolonged minimum solar activity is going to have a great impact as to how EFFECTIVE the associated secondary effects associated with prolonged minimal solar activity may have on the climate. An example would be an increased in volcanic activity.To make it more complicated could thresholds come about? An example would be a changing atmospheric circulation pattern which may promote more snow cover/cloud cover and thus increase the earth’s albedo. How will the initial state of the climate play into it? An example of this would be the great amounts of excess Antarctica Sea Ice the globe has presently and how this might play out going forward under a very long period of prolonged minimum solar activity. Will climatic outcomes unknown come out of this?
Then one has to consider where the earth is in respect to Milankovitch Cycles (favorable )and how the earth’s magnetic field may enhance or moderate solar activity.
Given all of that I think at best only general trends in the climate can be forecasted going forward. I am confident enough to say in response to prolonged minimum solar activity going forward the temperature trend for the globe as a whole will be down. The question is how far down /how rapid will the decline be? I really do not have the answer because there are just to many UNKNOWNS. Further when you have unknowns in a system like the climate which is non linear, random and chaotic expect surprises.
lsvalgaard
Gamma rays, like muons and neutrons is part of the secondary radiation.
“For those complaining about his filter being non-causal, this is not strictly correct. In his analysis he divided the amplitude spectra of input and output to estimate the amplitude spectrum of the transfer function (under his assumption), but he did not estimate the phase spectrum of the “transfer function” because it was too noisy.”
Thanks, that’s something I forgot. IFAIR, he said it was “unreliable” not “too noisy”. An FT is a series of complex numbers, which can either be expressed as (x,y) or (magnitude, phase) . It is not clear how the magnitude can be regarded as reliable while the phase unreliable. That was not explained.
” The notch filter is clearly going to be SEEN as zero phase based on this analysis ie non-causal. The notch filter could just be an artefact ie TSI is not in temperature signals (that was my objection). But IF you make the assumption it is a real filter, then to make it causal it needs a delay, which is about 11 years (between 10 and 20 years).”
No. Dumping the phase then adding spurious fixed temporal lag which will represent a different phase for each component is yet another fudge. It in no way renders it “causal”.
“David is fully aware of the assumptions he is making. And as he says, “If the criterion does not occur: Then the notch-delay solar model is falsified and it should be thrown away.”.
…..
He knows the model could be rubbish and disproven. The experiment is taking place as we wait, over the next 5 – 10 years. It could be interesting seeing how it plays out.”
I think within that time frame we won’t need an alternative model to see whether AGW has even a grain of truth in it. However, I suspect this model will not last that long as it is. Some models don’t need more data.
His Lordship says: “He was cured of the Thermageddonite affliction on learning that “Dr” Mann and “Dr” Overpeck and the IPCC had attempted to abolish the medieval warm period. On seeing what arrant nonsense was being published about that period, he resigned his comfortably-paid government post and decided to investigate at his own expense what he regarded as an outrageous abuse of the scientific method for profit.”
Highly commendable. A large part of the problem today is that few in science seem to have that sort of cojones. Sadly, that does not fix the model.
William Astley says:
June 28, 2014 at 12:11 pm
The sun will be spotless by late 2013, early 2014.
At late 2013, early 2014 is when we observed the ‘second peak’, with average sunspot numbers around 75. Hardly spotless.
HenryP
Ozone is a strong greenhouse gas.
http://www.cpc.ncep.noaa.gov/products/stratosphere/strat-trop/gif_files/time_pres_TEMP_ANOM_AMJ_EQ_2014.gif
In fact, the step response of a physical notch filter must be causal. David Evans (for reasons that are very unclear – he originally said all notches were non-causal) chose a non-causal step response. He then further proposed to delay the response to make it causal (thus physical). But you can NOT make a non-causal step response become causal by using a delay unless the step response is finite duration (does not extend back to minus infinity), AND is symmetric about some center point (so that time reversal for the finite segment would not matter, since a delay does not reverse time). Neither special condition is a property of the step response David plotted in his Part II. Just engineering here.
greg Goodman says:
June 28, 2014 at 9:08 am
‘There is an 11y peak in the “input” and no 11y peak in the “output”.’
That would tend to make the result rather tautological.
FWIW, my prediction for the years ahead.
NicfromNYC: “Skeptics are fatiguing of being marginalized, but grasping for oversimplified answers only adds to that marginalization.”
It seems about half throwing their hats in the air, projected by blasts of bias confirmation and cheering. The other half are being duly sceptical and giving this as much of a grilling as a warmist model would get.
I hope that Dr Evans will learn from some of the comments be able to improve what he’s done since I thinks it’s worthwhile venture.
He may well be right about the futility of using the peer-reviewed journals and opting for an open science approach. I hope he did not think that would be an easy option 😉
On the other hand, it could be interesting to see how it works.
Bart: “FWIW, my prediction for the years ahead.”
So we’re due for another super El Nino in 2064 then ? LOL
On the proposed climatic effects of nuclear testing:
http://wattsupwiththat.com/2011/04/04/claim-nuclear-tests-stopped-global-warming-in-the-20th-century/
I spoke with Paul Ehrlich & the late Stephen Schneider about the problems with their & the astronomical Dr. Sagan’s blatantly political nuclear winter hypothesis. Ehrlich said if I wanted more data, he’d have to charge me. Schneider allowed as how their soot data were indeed problematical in various ways.
There are hundreds of papers based on the analysis a slew of different proxy data bases that supports the assertion that the planet cyclically warms and cools. Solar magnetic cycle changes correlate with the cyclic warming and cooling. The reason this problem has not been solved is the climate wars are blocking and inferring with the normal progression of science.
http://wattsupwiththat.com/2012/09/05/is-the-current-global-warming-a-natural-cycle/
As written in our rejected paper two years ago, if the current global warming event has the same underlying cause as the 342 previous similar NWEs spread over the preceding 250,000 years–and we can think of no obvious scientific reason to think otherwise–then based on the statistical properties of all natural warming events in the Vostok record, the current global warming event will reverse by 2032 with 68% probability and by 2105 with 95% probability.
If the current warming event is homologous with a HRWE, climate reversal and global cooling are already overdue. Here is how we put it in our rejected paper. ….
…We submitted these findings sequentially to Science Magazine, Nature, and Nature Climate Change. The editor of Science Magazine replied that the results were not of sufficient general interest, suggested we submit the work to a specialty journal, and declined to proceed with external scientific review. Nature also rejected the paper without external scientific review, for reasons that we considered spurious. Nature Climate Change initially rejected the paper, but after some discussion the paper was assigned to a senior editor and reviewed by two anonymous reviewers. Given the context of their comments, both reviewers appeared to be climate modelers.
The Nature Climate Change reviewers concluded that the natural warming cycles we identified in the Vostok record could not possibly be real or significant, but instead represented irrelevant statistical “noise” in the temperature record. We replied respectfully that the warming events we detected and measured are similar to or larger than many well-accepted temperature fluctuations in ice core records, including Dansgaard-Oeschger oscillations, Heinrich events, and Antarctic Temperature Maxima. Indeed, the Vostok HRWEs are similar to or larger than the present global warming signal. These arguments were ignored by the reviewers, however, and the paper was rejected by the chief editor of Nature Climate Change.
http://cio.eldoc.ub.rug.nl/FILES/root/1999/QuatSciRevvGeel/1999QuatSciRevvGeel.pdf
“The role of solar forcing upon climate change”
“A number of those Holocene climate cooling phases… most likely of a global nature (eg Magney, 1993; van Geel et al, 1996; Alley et al 1997; Stager & Mayewski, 1997) … the cooling phases seem to be part of a millennial-scale climatic cycle operating independent of the glacial-interglacial cycles (which are) forced (perhaps paced) by orbit variations.”
“… we show here evidence that the variation in solar activity is a cause for the millennial scale climate change.”
Last 40 kyrs
Figure 2 in paper. (From data last 40 kyrs)… “conclude that solar forcing of climate, as indicated by high BE10 values, coincided with cold phases of Dansgaar-Oeschger events as shown in O16 records”
Recent Solar Event
“Maunder Minimum (1645-1715) “…coincides with one of the coldest phases of the Little Ice Age… (van Geel et al 1998b)
Periodicity
“Mayewski et al (1997) showed a 1450 yr periodicity in C14 … from tree rings and …from glaciochemicial series (NaCl & Dust) from the GISP2 ice core … believed to reflect changes in polar atmospheric circulation..”
Monckton of Brenchley says:
June 28, 2014 at 11:16 am
Now, it is not for me to say whether Mr Svalgaard’s reconstruction of the trend on the absent SORCE data is reasonable, for I am no drip under pressure. However, to refer readers to a link to a graph that has been tampered with, and without also referring to a link that explains the tampering, and to use the tampered graph as the basis for accusing a diligent scientist of “almost fraudulent” conduct while …
This kind of remark is typical of politically motivated comments as the pink curve is irrelevant to the issue whether or not Mr. Evans assertion that TSI has dropped sharply since 2003 [which it has not, as the blue curve so clearly shows – even you should be able to see that]. Using words like ‘tampering with’ shows your agenda. In addition the ‘trend’ was downward, but even that is irrelevant. Here is a version with no interpolated downward curve http://www.leif.org/research/TSI-since-2003.png
In fact you may man up and apologize for your childish comment.
Monckton of Brenchley said in part June 28, 2014 at 11:16 am
Here is the unique resource locator of Dr Evans’ TSI graph:
http://jonova.s3.amazonaws.com/evans/graphs/prediction/total-solar-irradiance.gif
And here is ……..
http://jonova.s3.amazonaws.com/evans/graphs/prediction/total-solar-irradiance.gif
The two graphs appear to me to be strikingly similar.”
******************
Does this surprise anyone – aren’t these the same URL ! Am I missing something!
Just running the cosmic radiation above the Arctic Circle during the polar night.
The increase in ozone occurs in the vicinity of the magnetic pole.
http://www.cpc.ncep.noaa.gov/products/intraseasonal/temp50anim.gif
It seems Svalgaard is, vigorously, saying he doesn’t know how climate changes and he believes no else does either?
Bernie Hutchins says:
June 28, 2014 at 12:46 pm
Does this surprise anyone – aren’t these the same URL ! Am I missing something!
You are missing the political nature of the comment which was intended to insult [and hoping people would not pay too much attention to actual facts].
This is a very good discussion today. Balanced.
Mr Svalgaard, having been caught out in a false, nasty, libellous allegation against the blameless Dr Evans, fails to have the grace to apologize when his error is drawn to his attention.
He admits that he tampered with the TSI graph from SORCE that had nine months’ missing data. It was on the basis of that tampered graph he said that Dr Evans had deliberately used wrong data. Having made that admission, and having been given clear and compelling evidence, from the very source of his own data, that Dr Evans’ TSI graph is in substance correct, he must now apologize without any further evasion.
In passing, Mr Svalgaard will understand that a layman like me is baffled that the form which his tampering took was the imaginative application of a 27-day smoothing to a period when there were no data at all not for 27 days but for nine months. He says the tampering had no consequences: but it was on the basis of that fictitious graph that he falsely accused Dr Evans of having deliberately used false total solar irradiance data as the basis for his model.
Dr Evans interprets the longer-term record of historical TSI as suggesting that a rapid decline in TSI began in 2003 or thereby and is now under way. One can legitimately argue this both ways. On the one hand, as Mr Svalgaard points out, the current peak of the solar cycle is about the same as the peak of the previous cycle 13 or 14 years ago and may even be a tad higher. On the other, the very length of the cycle (for longer cycles are often followed by less active cycles), taken with the fact that between this cycle and the last the trough was deeper than at any time since before the Second World War, suggests at least the possibility of a quite rapid decline in solar activity.
But it is not acceptable that Mr Svalgaard should suggest that Dr Evans was “almost fraudulent” or that he has an “agenda” merely because Mr Svalgaard interprets the data differently from Dr Evans.
The fact remains that he falsely accused Dr Evans of being “almost fraudulent” in using incorrect TSI data, when the “Historical TSI Reconstruction” graph published by the very same academic source as the graph tampered with by Mr Svalgaard is visibly identical in all material respects to Dr Evans’ TSI graph reproduced in the head posting.
Here are the relevant links:
From SORCE/TIM, the IPCC (2013) graph of some 400 years’ total solar irradiance, updated by the SORCE/TIM team to 2014, a source as mainstream as one can get:
http://lasp.colorado.edu/home/sorce/data/tsi-data/
and click on the menu item “Historical TSI Reconstruction”, or search for that term with control-F, or simply scroll down the page a bit.
From Dr Evans:
http://jonova.s3.amazonaws.com/evans/graphs/prediction/total-solar-irradiance.gif
Or see the head posting.
Mr Svalgaard cannot plausibly deny that Dr Evans’ graph is very close to the official IPCC graph as updated by the very university from which he himself got the graph he tampered with.
Here is a reminder to Mr Svalgaard of what he wrote:
“It is worse than I thought. The TSI used by Evans is totally wrong. …”. TSI stands for “Total Solar Irradiance”.
(Then a rant about how Mr Evans has in Mr Svalgaard’s opinion drawn an uncongenial conclusion from the data). Then:
“As far as I am concerned, the model is already falsified. Not by the observations but by the [almost fraudulent – as there clearly is an agenda here] use of invalid input to begin with.” The words in square brackets, and the square brackets themselves, are Mr Svalgaard’s words.
Mr Svalgaard, confronted with the near-identity of the official IPCC graph and Dr Evans’ graph, must now apologize publicly and without reserve and without further circumlocution, evasion, excuse or delay, or forever forfeit all scientific credibility.
This is not a matter for any further bluster or wriggling on Mr Svalgaard’s part. By his conduct in reply to this thread, he will demonstrate to all whether he is a scientist or a quack. If he apologizes, he’s a scientist. If he doesn’t, he’s a quack. It’s his call. Many will be watching. Many will remember.
William Astley.
For predictions of a possible future cooling based on the 60 and 1000 year quasi periodical cycles in the temperature data and using the neutron count- 10 Be record as the best proxy for solar :activity” see esp Figs 3,4,5,6,7,8 (esp 8 C and D),9,at
http://climatesense-norpag.blogspot.com/2013/10/commonsense-climate-science-and.html
(Leif I see no point in rehashing our recent exchange on the Maunder Minimum thread)
lsvalgaard said June 28, 2014 at 12:52 pm
” Bernie Hutchins says:
June 28, 2014 at 12:46 pm
Does this surprise anyone – aren’t these the same URL ! Am I missing something!
You are missing the political nature of the comment which was intended to insult [and hoping people would not pay too much attention to actual facts].”
So – he was just being a smart ass? Very helpful of him! Especially in a posting criticizing the conduct of yourself!
Thanks Leif. Got it.
A very interesting video very related to this posting
Bernie, I think his Lordship was trying to point out in a humouristic way the data used by Evans was also used in recent IPCC AR5 (2013). The point was exactly that it was the same URL.
lsvagaard’s comment is that the IPCC don’t know what they are doing and have used wrong data.
(Would not be the first time).
Evans’ idea is to use the warmists’ sources to prove you don’t need CO2. Thus it does not matter if this is “wrong” in the same way it does not matter if hadSST3 is wrong and has been tweaked.
It’s interesting to note that my relaxation model turns lsvalgaard’s “correct” TSI into something not dissimilar to the ramped up Lean et al TSI reconstruction, except for the improbably drop at the end which is probably related to using a crap
filter“smoother”.http://climategrog.wordpress.com/?attachment_id=981
Will the world ever learn to find out what a filter does before using it?
https://climategrog.wordpress.com/2013/05/19/triple-running-mean-filters/
Steven Mosher says:
June 28, 2014 at 7:32 am
Looks like the cooling will be within normal bounds.
Therefore it can’t be the sun.
Note the similarity.
The warming we have seen is within normal bounds
Therefore it can’t be the co2
——————————————-
What a lame comparison. I thought you were one of the more intelligent ones here.
This is testable.
There is NO CO2 test for temperature effect.
If climate changes it’s CO2 wotdunit?
cn
@lord monckton
lsvalgaard is an atheist
it is not in his nature to apologise
Monckton of Brenchley says:
June 28, 2014 at 12:58 pm
He admits that he tampered with the TSI graph from SORCE that had nine months’ missing data. It was on the basis of that tampered graph he said that Dr Evans had deliberately used wrong data.
Not at all, the blue curve shows that Mr Evans assertion is false [and I maintain seems to be agenda driven – as your comments are]: http://www.leif.org/research/TSI-since-2003.png
The rest of your comment is not worth elaborating on.
There IS some science in what David Evans has done, an investigation of how closely the TSI time series resembles that of global temperature, plus estimation of a hypothetical sensitivity. Such an investigation would involve data smoothing filters to show better the major trends.
A SCIENTIST would call the work something like “Investigation of a simple (or toy) model of climate response to solar forcing”.
A PSEUDO-SCIENTIST would start calling it a theory involving mysterious forces, claiming it can make predictions, that it could bring down the CO2 theory, and would make elementary errors like claiming that notch filters are acausal, and that it is original. Glassman has done something similar, and probably many others.
http://journal.crossfit.com/2010/04/glassman-sgw.tpl
http://jonova.s3.amazonaws.com/evans/graphs/prediction/total-solar-irradiance.gif
Looking at the 25 year “smooth” on that graph running up to the end of the data , they must be doing some kind of Mannian padding. My guess is they’re padding the window by repeating the last value. That means the end of the 11Y “smooth” has last value represented 6 times. Hence the spurious drop. 2003-2005 is where they should have stopped when the data ran out.
There’s another way to get that sort of error but it’s about as bad so I won’t bother explaining in detail.
The “unprecedented” drop is nothing but illegitimate data processing, it would appear.
Monckton of Brenchley says:
June 28, 2014 at 12:58 pm
It was on the basis of that tampered graph
This comment is not only wrong, but outright stupid as everyone can plainly see. You do yourself no favours by pretending to be so dumb [I have a hard time believing that you are – but I could be wrong…]
Dr Norman Page says:
June 28, 2014 at 1:03 pm
For predictions of a possible future cooling based on the 60 and 1000 year quasi periodical cycles in the temperature data and using the neutron count- 10 Be record as the best proxy for solar :activity”
In a recent report http://www.nap.edu/openbook.php?record_id=13519&page=17 Muescheler points out that “there is no evidence of sustained periods on the order of 1,000 years of low solar activity in either the 10Be or the 14C record”
greg Goodman said in part June 28, 2014 at 1:19 pm
” ….Bernie, I think his Lordship was trying to point out in a humouristic way the data used by Evans was also used in recent IPCC AR5 (2013). The point was exactly that it was the same URL…..”
Greg – thanks. But I assume you mean the same GRAPH. Both the URL’s were identical and from Jo Nova’s site. If it was meant to be funny he really needed to provide separate links. Lazy. Wouldn’t have been the first time he fumbled – and that I had called his attention to his error, for which he thanked me. Engineers and details.
greg Goodman says:
June 28, 2014 at 1:48 pm
The “unprecedented” drop is nothing but illegitimate data processing, it would appear.
An issue here is whether this was deliberate. Now most of what we do is deliberate, and I have a hard time believing that Evans did not know what he was doing, but [as always – I could be wrong].
Number of comments were made about the notch filter delay, the main feature in the research by David Evans. Yes, filters do, as all transmitting systems do produce some delay.
When compared (any point in time) solar activity and the climate indices show a certain time shift, which often is characterised as delay.
However in number of indices, the shift is non-stationary, in which case is may not be a ‘delay’ of one variable related to the other, but it is likely that two systems are running on two different fundamental frequencies.
If both sources affect the global temperature, than the effect of natural variability or ‘oscillations’ such as the AMO and PDO would be observed.
Monckton of Brenchley says:
June 28, 2014 at 12:58 pm
Many will be watching. Many will remember.
And many will remember [one might hope] your silly comments trying to cover for Mr Evans.
Leif and Greg, the TSI data being used DOES show a drop-off in recent years, look at the troughs here: http://lasp.colorado.edu/lisird/tsi/historical_tsi.html
But, the source of the data mentions a splicing of 2 different data sets, so that may be an issue.
If I was going to predict a drop in temperature I’d check exhaustively that the TSI data supports it.
Mr Svalgaard said Dr Evans was deliberately using wrong TSI data. He now knows that was false. He said, on the strength of that false allegation, that Dr Evans was acting in an almost criminal fashion. Having been caught out, he has refused to apologize as he should have done, and has instead tried to explain away his absurd tampering which, like the USHCN tampering to invent data from non-existent temperature stations, fabricated a trend on nine months of missing data. He is a quack, not a scientist. This was not inadvertence on his part: it was plain wickedness. Nothing he ever says again on any scientific subject can or will be taken seriously. He is finished, dead by his own hand.
Oh dear, the text on the graph says they used mean of Jul 2012- Feb 2013 to pad out data to 2015. Credit due for colouring differently.
Looks like they must have padded the 25y SST in a similar way.
Part of what makes the drop remarkable is the distortions of the running mean. Note how the 1990 peak is inverted.. Also IIRC the Lean et al method adds back in the 11y average. to give their TSI reconstruction. That is presumably a trailing 11y mean, so that adds a 5.5y lag.
It starts to become clear why this is so similar to the relaxation calculation.
Action of cosmic radiation.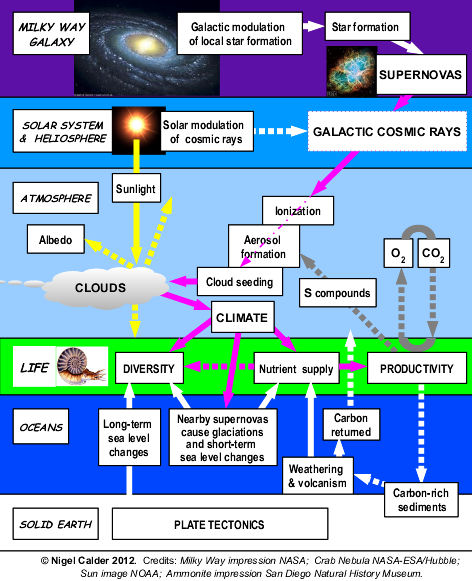 ?w=450&h=553
Despite Solar Cycle 24 having low sunspot activity, TSI is running slightly higher than SS23. The lull in TSI between SS23 and SSS24 is plainly evident in the UAH temperature record and wiped out all of the temp anomaly of the preceding years. Sunspots are only a proxy for TSI and until SS24 radiation levels start to tail off, we should not expect to see much change in global temperature averages.
MikeUK says:
June 28, 2014 at 2:40 pm
Leif and Greg, the TSI data being used DOES show a drop-off in recent years, look at the troughs here: http://lasp.colorado.edu/lisird/tsi/historical_tsi.html
But, the source of the data mentions a splicing of 2 different data sets, so that may be an issue.
It is indeed an issue. The splicing is done to the PMOD data which had a lower 2008 minimum than the preceding minimum. However, the PMD data suffers from unmodeled degradation and as W. Smutz has shown the 0.2 W/m2 difference is not real, but an effect of that degradation, see. e.g. slide 36 of http://www.leif.org/research/Another-Maunder-Minimum.pdf
So there is no evidence for a decline of TSI at that solar minimum
Monckton of Brenchley says:
June 28, 2014 at 2:44 pm
Mr Svalgaard said Dr Evans was deliberately using wrong TSI data. He now knows that was false.
No, he does not know that. On the contrary he has shown that Mr Evans used wrong TSI data. This is either incompetence [I will allow for that hence my ‘almost’] or a deliberate act [you made that call].
Folks who think they are experts would do well to read and understand the work of Philip Tetlock.
Some humility is in order.
MikeUK says:
Leif and Greg, the TSI data being used DOES show a drop-off in recent years
Indeed it does. You can see that reflected in my relaxation graph too. Though it is mostly the magnitude of the positive swing that changes not the base line.
However, what you link to is not “TSI data” it is a “TSI reconstruction”.
There seems to be less support for these ramped up recon. plots now, which is Leif’s main contention. TSI should be reconstructed from SSN directly , not adding back in some longer term average. That seems like double counting to me and I’m not sure on what theoretical grounds ( if any ) this was done.
There is recent decline which has been going for the last 3 cycles and to a lesser extent since 1960.
If one assumes the climate system equilibrates almost instantaneously, that would imply there should be a cooling since 1960. However, if there is some stockage of the incoming energy that dissipates over time, some kind of relaxation response should be expected. That seems a more realistic proposition than instantaneous equilibration.
I did a very quick stab at that with the most simplistic single slab ( single reservoir ) model, giving a single time constant. It fits rather well over all but shows divergence since about 1990. Due to the reservoir effect, the drop starts later.
A more realistic model would have a second reservoir with a longer delay and that would prop up the end of the data. Such a model would drop off slower too, leading to a slow decline rather than Evans’ sudden drop.
The divergence may also indicate some other factor is propping up recent temps. That may be AGW, or maybe the extra incoming SW since Mt Pinatubo:
http://climategrog.files.wordpress.com/2014/04/tropical-feedback_resp_ci.png?w=843
The other possibility is that all this is a total coincidence, there is no relation between SSN and surface temps, they just happen to go up and down in a similar way. Correlation is not causation etc.
Are there solar denialists? Do we have to use the term? Would Willis Eschenbach be called a solar denialist?
The study of solar influences on climate is in its infancy – there is no need to start dividing critics along supposed differences in belief while a proper theory is very far away.
Boy am I naive…. I thought skeptics were above name calling and slinging mud at each other. I thought that was an alarmist characteristic. My respect for many of you has dropped considerably based on this single post. Not that it matters to any of you, you are too busy playing in the gutter.
A good deal of ammunition (talking points) has now been created for the alarmists, thanks guys.
I have used this website as a reference in many past emails to friends but will no longer be doing so.
Dr Evans analysis is flawed but not fatally so. The early parts of it are insightful and useful. However his model pushes things too far in my opinion and the “bomb test” correction in his model looks like a massive fudge factor to me; a sign that the model has been stretched beyond the point of usefulness.
Leif – I understand your frustration that he seems to have ignored your work in correcting the sunspot/TSI record. At the very least, if he didn’t want to use your updated figures, he should have commented on them and explained why. However this doesn’t invalidate his work (at least the early parts) because the majority of his analysis is carried out in frequency space and is completely insensitive to the corrections you made. He WILL find the same “notch” using your figures.
Similarly, because almost all his analysis is carried out in frequency space, it is insensitive to “corrections” and “adjustments” to the temperature record as well. It doesn’t matter which temperature figures he uses and how they were massaged. As long as the adjustments don’t tamper with the frequency spectrum of the data he will get the same result.
Willis – you note that he would have found the same notch if he had used white noise for temperature. Well duh! If your input (TSI) has an 11 year oscillation and your output (temperature) shows no such oscillation (because you’ve replaced the real data with white noise) then there is obviously some kind of disconnect between input and output. If you model the disconnect using a filter, then the strongest frequencies present in the input will need to be most strongly filtered and you’ll see an 11 year notch.. That is precisely the point. Temperature should show an 11 year cycle because TSI has such a cycle. It doesn’t and that requires explanation. This observation is extremely robust to adjustments to either the TSI record or the temperature record.
The second insightful observation in my opinion was that the physical basis for such an 11 year filter has to come from an indirect solar effect, and that magnetic field strength has the correct timing to provide a physical basis for such a filter. Field strength is low when sunspot numbers and TSI are high. However field strength isn’t determined by sunspot numbers. At times of low solar activity (such as we are now starting to see) field strength becomes generally lower at all phases of the solar cycle. If field strength is your suggested physical mechanism then trying to impute it from TSI figures just using a simple delay is not good enough.
Beyond this point he loses me. I think his model is flawed. Clearly the model WILL be effected by corrections to the TSI record ( a la Leif ) and to the temperature record ( a la the various climate sausage factories ). Furthermore if magnetic field strength is the physical basis of his notch then an 11 year delay filter is a very poor way to model it. The “bomb test” fudge factor is a sign to me that he may have fitted an elephant.
Nevertheless there is value here. He is showing us where to look for evidence of an indirect solar effect. We need to look at the reason why the dog isn’t barking in the night – variation in TSI is not showing up as variation in temperature. An indirect solar effect in counterphase is the perfect explanation. And if this indirect effect originates from magnetic field strength then at times when the sun is quiet we should also see overall cooling.
They will never ever admit that the sun drives out climate and not human induced greenhousegasses. That does not mean we can polute btw. Because our way of living makes account a lot of UFP’s floating around in the air we breath. And UFP’s causes cancer.
What I like about this is that we will know whether or not the proposition is sound in a relatively short time, unlike all the thermogeddonists’ claims which conveniently project forward so far in time that they (and we) will all be dead before we know whether or not they are correct.
So, I have a question for the participants in the little spat which has been going on here. If Archibald and Evans (and by extension Monckton) are shown to be wrong in 10 years or so, will they admit it and apologise and, similarly, if they are shown to be correct, will Svalgaard do likewise?
Greg Goodman says:
June 28, 2014 at 3:42 pm
TSI should be reconstructed from SSN directly , not adding back in some longer term average. That seems like double counting to me and I’m not sure on what theoretical grounds ( if any ) this was done.
In addition the sunspot group that are created at a rate of about one a day, everyday thousands of little magnetic bipoles [called ephemeral region, ERs] are also created. It was once thought that those would add a significant contribution to TSI and that their emergence rate was a function of general solar activity: the more sunspots, the more ERs. So they would constitute a varying ‘background’ on top of which the regular sunspot-related TSI would ride. The assumption was that a running 11-yr average of the Group Sunspot Number would be a measure of that background [so indeed the sunspots were counter twice], see 34 of http://www.leif.org/research/Another-Maunder-Minimum.pdf
Hagenaar et al [2008] have shown that this assumption is false, and that ERs erupt at a rate that is almost, if not absolutely, unrelated to the sunspot number. Therefore all TSI reconstructions that assume that varying background are not correct. This is not controversial, see e.g. http://www.leif.org/research/2011GL046658.pdf
Thanks to Stephen Wilde and thinkingscientist for some civil discourse. A few levels above the vitriol expressed in the some of comments in this post. I suspect that I am not the only visitor to this and other sites that tend to ignore the vitriolic comments.
Monckton’s rabid response to a mere plot average that meaninglessly jumped a gap is yet another red flag that this whole exercise may be an organized PR stunt gone bad. I fear an insider circle has turned to the dark side and intend to fight fire with fire by themselves playing sensationalist dirty pool to compete with Steven Goddard at the same strategy. Those supporting this model don’t seem to enjoy critical feedback at all, an extremely valuable commodity to obtain compared to merely being ignored. Now Monckton is channeling prickly Mann in a world gone topsy turvy mad. Is Leif’s graph wrong I don’t know but his casual software average is no valid criticism of it and he does happen to be a working solar expert who does not overlap with the corrupt hockey stick team that was plotted graphically in the Wegman report:
http://climateaudit.files.wordpress.com/2011/05/social_network.gif
Leif posts a lot here too, which is against hockey stick team rules of Alinskyite engagement, tutored by real PR firms, so I judge his comments as valuable as I try to understand these claims. He doesn’t come off as one of the bad guys.
Would the TSI drop matter anyway for an “infinitely tuned” model that could wiggle match either way or is this also important for the future cooling prediction? All this nitpicking isn’t answering such fundamental questions that only David can answer until code is released. For now I’ll rely on my favorite string theorist who suggests this isn’t a model at all, just a mathematical stunt.
Mr Green Genes says:
June 28, 2014 at 3:59 pm
If Archibald and Evans (and by extension Monckton) are shown to be wrong in 10 years or so, will they admit it and apologise and, similarly, if they are shown to be correct, will Svalgaard do likewise?
Of course, that is what honest scientists do. I’m not so sure about the other guys, though. ‘Apologise’ is normally not the way it is done. One way is to say in a paper that one’s earlier ‘finding’ was incorrect but even that is rare – wrong papers are simply quietly forgotten.
cynical_scientist says:
June 28, 2014 at 3:53 pm
Leif – I understand your frustration that he seems to have ignored your work in correcting the sunspot/TSI record. At the very least, if he didn’t want to use your updated figures, he should have commented on them and explained why.
That is not the issue. The issue is that he used an obsolete reconstruction of TSI [see my comment at 3:59pm]. This has nothing to do with the revision of the sunspot number. My frustration is with people [such as Monckton] with an agenda.
NikFromNYC says:
June 28, 2014 at 4:02 pm
Monckton’s rabid response to a mere plot average that meaninglessly jumped a gap is yet another red flag that this whole exercise may be an organized PR stunt gone bad.
You may a point here. It certainly looks that way.
Everybody is talking this and that and letting their egos speak. Cut it out will ya? Nobody knows what the weather will do tomorrow, nobody. You can speak out in weather terms and nowcast all you want, the weather never does what you think it will do… Hell as i know, this could well be a counter operation website full of cons (i dont know, just meant it as a matter of speak)..
You see.. There is the main problem. People who think they can outsmart someone else by new data. As soon as you see the data, it is already the past. You can only enjoy the weather now, is by looking at it and be present, just be there and observe.
All the focus is on CO2., And it should not be. It should be focussed at UFP’s or Ultra Fine Particles. They are real danger and are spread by cars and plains. Nobody is looking at that, the problem we all create for ourselfs. And not only we are affected, other species too.
lsvalgaard says:
June 28, 2014 at 4:10 pm
Sure. But his main observation is so totally robust and insensitive to manipulations in the data that it almost doesn’t matter where he gets his figures from. It is astonishing how robust his result is. Working in the frequency realm has many advantages not least of which adjustments of the kind which plague climate science (and solar science) have almost zero impact there.
Yeah Monckton can be a bit of a loose cannon. It isn’t fun to be in front of him when he lets loose a blast in the wrong direction.
Brad says:
“Boy am I naive…. I thought skeptics were above name calling and slinging mud at each other. I thought that was an alarmist characteristic.”
I think the “solar denialist” thing was a tongue in cheek mockery of “climate denialist” name calling, it was not supposed to be a invitation to fight fire with fire and start throwing names back.
Apparently such subtle humour is beyond some. Not funny, not P.C.
cynical_scientist says:
June 28, 2014 at 4:24 pm
Sure. But his main observation is so totally robust and insensitive to manipulations in the data that it almost doesn’t matter where he gets his figures from.
I think not [as many people have agreed]. Certainly the drastic drop would not come from random data.
Yeah Monckton can be a bit of a loose cannon. It isn’t fun to be in front of him when he lets loose a blast in the wrong direction.
I would rather be in front than just behind him…
Belvedere106 says:
“All the focus is on CO2., And it should not be. It should be focussed at UFP’s or Ultra Fine Particles. They are real danger and are spread by cars and plains. Nobody is looking at that, the problem we all create for ourselfs. And not only we are affected, other species too.”
Oh don’t worry, that’ll be the next pretext to remove our freedom of mobility and have us all forced ride around in electric powered shoeboxes or solar assisted bicycles.
I think the rapidity with which some impugn motives is unfortunate and unnecessary.
As I read this work it starts with an assumption TSI => GST without recourse to GHGs, and looks at the consequences. It steps its way through making a number of further assumptions about cause and effect that are chosen not to violate empirical evidence and concludes we can reasonably model the process without having to include GHGs, if we assume an external Force X. (“If we had eggs, we could have ham and eggs, if we had ham” where ham and eggs is GST, eggs is TSI and ham is Force X).
Somewhat speculatively the model is also used to project future states.
Where does this leave us in the pursuit of our understanding of the earth’s climate system?
First, reductio ad absurdum is in the fine tradition of scientific method. If the process had led to a contradiction it would have disproved the initial assumption. Since the analysis comes down to the assumption of the existence of Force X that is what this turns on. If the existence of Force X or something that could manifest itself in that form is unphysical, this increases the evidence that GST does depend on internal states.
However reductio ad absurdum disproves things, it doesn’t prove them.
Second, the model produced does provide a basis for testing the various assumptions made along the way. If the model not only doesn’t reduce to a contradiction but also shows skill in projecting phenomena out of range of the information used to create the model (not just GST, but also intermediate results) then this adds credence to the assumptions (i.e. maybe we don’t need to understand the internal states to project GST). On the information I’ve seen so far however the investigators don’t seem to have used part of the historic information to independently project what the model would show for the balance, and are waiting for the future. This is a (unfortunate) limitation.
Finally, the approach is useful to remind that top down modeling does often help our understanding of a system – particularly by drawing attention to where greater effort in understanding a subsystem could be warranted, and where materiality suggests it is necessary.
David Archibald’s post is just wishful thinking. When will it start cooling ? Global temperature is unlikely to cool significantly in the short to medium term as there is no physical reason why it should. A major eruption would cause short term cooling, but we don’t know when the next one will be.
He overplays the temperature response to solar variation – and we have little real idea of what future solar cycles will bring.
Also, what are “lunar effects” in this context ?
HAS says:
June 28, 2014 at 4:36 pm
As I read this work it starts with an assumption TSI => GST without recourse to GHGs, and looks at the consequences. It steps its way through making a number of further assumptions about cause and effect that are chosen not to violate empirical evidence
Except that it does. The TSI reconstruction they use is not empirical evidence and we know today that it is wrong. Even Lean who is cited for her 2000 reconstruction has long ago given up on it.
Belvedere106 says:
June 28, 2014 at 3:53 pm
They will never ever admit that the sun drives out climate and not human induced greenhousegasses. That does not mean we can polute btw. Because our way of living makes account a lot of UFP’s floating around in the air we breath. And UFP’s causes cancer.
===
Well if the whole enviro movement would stop pretending that CO2 is pollution and wasting everyone’s time and effort, then maybe they’d have some time to take care of REAL pollution issues.
The trouble is at this stage, I suspect it’s too late and next time they try to “sound the alarm” about something, even if they are right, no one will listen, they’ve over played their hand so badly.
That is a shame and it will do no one any good. But that’s the way it is.
Well, I have never put much stock in the various attempts to deny that GHGs do indeed capture LWIR radiation emitted generally from the surface thus slowing its escape, and warming the atmosphere. The basic physics is not in much doubt.
But I have also always believed, that such perturbations, including variability of TSI, are simply washed out by the strong negative feedback due to clouds.
Less clouds, more surface insolation (ocean), more evaporation, more water in atmosphere, eventually more clouds, less surface insolation.
Or, more clouds, less surface insolation, cooler surface and lower atmosphere, more precipitation, less clouds, more surface insolation.
So it is not at all surprising, that the global Temperature, basically ignores a lower incoming TSI, regardless of what the primary cause of that lower TSI may be.
So when Leif says that a 0.1% lower TSI during a solar minimum, causes less than 0.1 degree change; about 78 m deg. C if you use a BB S-B assumption; that is a thermal equilibrium change one would expect if NOTHING ELSE CHANGED.
But the clouds do change, so the temperature pays no attention to small TSI shifts; either up or down.
Negative feedback works in both directions to oppose changes from any quarter. Le Chatalier’s Principle even says as much.
The true effect of global cloud cover, is something that cannot be monitored from out in space. Even with a flock of satellites giving 24-7 , and 4pi global coverage, you can’t see what makes it through the clouds to the surface.
And no adequate surface monitoring cloud system exists. The cloud level horizon, around any surface monitoring point is a few km, or tens of km at most. And clouds come and go in mere minutes.
So it is likely cloud negative feedback, that frustrates Willis E’s search for a 11 yr solar cycle signature.
Well that is my conclusion anyway. All are free to differ.
James Abbott says: David Archibald’s post is just wishful thinking.
I suspect you are right. A lot people seem to be jumping this because it’s what they want to hear. Bias confirmation.
“When will it start cooling ? ”
About 2005. But it won’t anything like the Evans projections.
The drastic drop you refer to is in the model part of his work, which is the part I don’t find much value in. I wasn’t reading carefully at that point. I’m sure you are right about this, although I would be very reluctant to impute malicious motives here. I believe Dr Evans to be a man of integrity.
This error however merely balances another error. His model will fail to pick up the overall drop in magnetic field strength due to the lessening of solar activity because he is inferring this totally from TSI using an 11 year delay filter. That will work when the sun is doing its usual thing, but not when the sun is entering a period of overall low activity. It is that overall low activity which will be responsible for cooling (should that occur) – and a model based purely on TSI won’t detect it.
cynical_scientist says:
June 28, 2014 at 4:49 pm
although I would be very reluctant to impute malicious motives here. I believe Dr Evans to be a man of integrity.
Incompetent thus. I did allow for that [‘almost’], and as they say “Never ascribe to maliciousness what can be explained by stupidity”
george e. smith says: So it is likely cloud negative feedback, that frustrates Willis E’s search for a 11 yr solar cycle signature.
Oh, he’s not at all frustrated, he’s very happy not to find it since that supports his global thermostat hypothesis.
The SORCE TIm instrument seems to be working again. Or at least, there is 3 months of recent data now.
It looks to be 0.3 W/m2 to 0.5 W/m2 lower than is should be at this time of solar cycle.
http://lasp.colorado.edu/data/sorce/total_solar_irradiance_plots/images/tim_level3_tsi_24hour_3month_640x480.png
Divide by 4 and multiply by 70% and the net solar irradiance is about 0.07 W/m2 lower than it should be. That is only about 0.02C worth of impact according to climate and the Stefan Boltzmann equations. (That is unless there is long-term accumulation of energy levels which is important which the seasonal cycle and the lags in the seasonal cycle tell us is actually important – this is about 10% of the daily change in energy levels that occurs in the seasonal cycle when temperatures change by 20.0C over 180 days, So the drawdown in energy of 0.07 W/m2/time is going to have an important temperature effect the longer this downturn in TSI occurs).
Climate science has gotten to this important energy flux over time question.
lsvalgaard, “The assumption was that a running 11-yr average of the Group Sunspot Number would be a measure of that background [so indeed the sunspots were counter twice], see 34 of http://www.leif.org/research/Another-Maunder-Minimum.pdf
Hagenaar et al [2008] have shown that this assumption is false, and that ERs erupt at a rate that is almost, if not absolutely, unrelated to the sunspot number. ”
Thank you.
So there is still the ER factor that is variable but almost, if not entirely, unrelated to SSN. That would mean that a purely SSN based reconstruction is incomplete. Even if ER is uncorrelated to SSN it seems that it was accorded a fairly significant magnitude. Has that disappeared too?
Is there an implicit assumption that whatever ERs do is random and is hoped to average out?
BTW, you were kind enough to provide a source to basic polarisation data that the rotation FFT was derived from but I don’t really understand the format.
There is daily binary “x” and “.” values, how is that processed to get to something that is FFT-able?
john robertson says:
June 28, 2014 at 9:56 am
Has the world gone mad? David Evans has said exactly the same thing that Michael Mann and Phil Jones told us—we don’t have to give you the data until we want to, and so far we don’t want to.
I begged David Evans, begged him please, please, to release the hidden code, to stop keeping the model equation a secret, to reveal the data, to expose the numbers of tunable parameters, to show the results of the out-of-sample tests that Jo says he’s already done … but no, he’s too busy channeling Lonnie Thompson and the rest of the serial non-archivers among the alarmists by hiding everything he can from public view.
John, while you may personally like his approach, the rules in science are simple. It’s like the sign you see in the restaurant that says “No shoes, no socks, no service” … except this sign says:
No code, no data, no science.
I find the actions of David Evans and Joanne Nova in this to be totally against science. Joanne said that they had sweated and gone unpaid for five years to develop their model, and it was their right to not reveal it right now if they didn’t want to … I told her I was sorry, but Anthony and Steve McIntyre and I have sweated in our respective hovels for five years as well, but that doesn’t buy any of us one minute’s exemption from the normal rules of scientific transparency.
As a result, it is terribly depressing to see my good friend Christopher Monckton once again defending someone who spits in the face of transparency and refuses to expose his work to the harsh light of day. Last time Christopher was defending Nicola Scafetta, another man who thinks he’s above the rest of us and has no need to show his work. The sad part is that in both cases Christopher was not defending science of any sort—as Steve Mosher observed, without data and code it’s not science, it’s just an advertisement for your ideas.
And David and Jo have been advertising for all it’s worth. And as a result, they have developed a whole coterie of suckers who’ve bought into the deal BEFORE GETTING THE TEST RESULTS! How dumb is that? Well, it’s dumb on the part of those buying in, but it’s genius on the part of Jo and David, because people hate to admit that they were wrong. So, sadly, we’re gonna see people advancing their cockamamie “notch theory” ten years from now, whether David and Jo ever reveal their secrets or not. They’ve got a guaranteed long-term cheering squad at this point … but no test results …
And it is more depressing how many people are standing up here at WUWT and applauding this kind of pseudo-science. Look, guys, the rules don’t just apply to the alarmists. You can’t say that Phil Jones was wrong when he refused to give data to Warwick Hughes on the grounds that Warwick might find fault with it, and then give David and Jo a big round of applause when they are doing exactly what Phil did, refusing to give us the data for fear we might find fault with it. Applauding them for that is venal hypocrisy of the worst kind. Busting your opponents for something and giving your friends a pass for the same thing is despicable. Applauding David and Jo for refusing to reveal their work is exactly like the alarmists applauding Peter Gleick for his actions. Both cases call for approbation, not applause.
When David and Jo decide to cut out the crap, come to the party like the rest of us mortals, and act like scientists by being transparent about their work, we’ll have something to discuss. But until then, as I told David and Jo, if I want advertisements I’ll watch Mad Men …
Sadly,
w.
Bill Illis says:
June 28, 2014 at 5:05 pm
It looks to be 0.3 W/m2 to 0.5 W/m2 lower than is should be at this time of solar cycle.
I don’t know where you get that idea from. If you plot TSI against the Sunspot Number, you find that TSI currently is actually a bit too high compared to what we what it should be for the current sunspot number.
Greg Goodman says:
June 28, 2014 at 5:11 pm
So there is still the ER factor that is variable but almost, if not entirely, unrelated to SSN.
I may have given you the wrong impression. The ER emergence rate is almost constant within the error bar. What little, inconsequential, variation there is, is not related to the sunspot number.
Greg Goodman says:
June 28, 2014 at 5:16 pm
There is daily binary “x” and “.” values, how is that processed to get to something that is FFT-able?
Assign -1 to the ‘x’ and +1 to the ‘.’
Willis Eschenbach says:
June 28, 2014 at 5:25 pm
As a result, it is terribly depressing to see my good friend Christopher Monckton once again defending someone who spits in the face of transparency and refuses to expose his work to the harsh light of day.
And ‘defending’ him in a such a rabid way that it demeans himself. Depressing indeed. How can some people sink so low…
In reply to Willis Eschenbach, if we were dealing with a rational scientific community it would be possible for David Evans to publish in a scientific journal and let people pick his work apart in an honorable and straightforward fashion. However, the climate debate is no longer rational. David and Jo have thought long and hard about how to announce their project, and they have decided to describe it in outline and then – quite soon now, in fact – to reveal all of the code and data, which Willis will find to be in an exceptionally transparent and user-friendly form.
It has been interesting to see how many of the usual suspects – the unspeakable Connolley for one – have been drawn out and are sounding off, doing their best to tear down David’s work before it is published. We all suspected that would happen. It shows how worried they are. David is using a brand of mathematics that most climate scientists have very little familiarity with. His work has very much impressed those scientists whom he has consulted. It is well above my pay-grade to say whether or not he is right: but he has at least conducted a genuine and quite difficult scientific enquiry. He may or may not be right, but at least he has made the effort to try to work things out for himself, and he has the courage – which is more than can be said for the “official” climate scientists – to say what will constitute falsification of his theory.
So don’t complain: everything will very soon be available to everybody, and then – and only then – will people be in a proper position to criticize David’s work. One hopes the criticisms will be less immature and more soundly founded than those of Mr Svalgaard.
Monckton of Brenchley says:
June 28, 2014 at 5:54 pm
David is using a brand of mathematics that most climate scientists have very little familiarity with.
None of this matters: Garbage in, garbage out. And it does not matter if it is deliberate garbage or just incompetent garbage.
Oh well at least I’M whiter than white . . . 🙂
Oops , hold on . . . what’s my name?
Neither Mr Svalgaard nor his apologists have been able to defend his malicious and uncalled-for attack on Dr Evans for having used TSI data virtually indistinguishable from the historical record on the SORCE/TIM website, which is an updated version of the data used in the most recent IPCC report. Mr Svalgaard can no longer be taken seriously as a scientist. Let readers compare the two graphs for themselves.
Well recent weeks ( with the David Evans and Steve Goddard work ) have told me something. There are huge egos involved in this debate on both sides. I am no expert, just someone who wants to learn and reads many sources to do so. Many people I have respected in this debate have gone down several notches in that respect in recent weeks. One in particular is acting like a spoilt teenager –I want it and I want it now. You won’t give what I want so I’ll throw the toys out of my cot.
The models we used to design fracture stimulations are built around known physical laws. They are generally very good these days. However in one basin the models were just wrong. We included a fudge factor on one of suspect variables and Bingo the model worked. To this day I do not know why trebling the value of a input variable to a quite unrealistic value made the model useful again. But it worked and we got good results and made money. The engineer in me is frustrated by not understanding the cause to this effect. But it would have been plain nuts not to use the fudge factored model. If Evans model turns out to be good, don’t ignore it just because there is no explanation for its abilities.
And here is confirmation, in detail, that Dr Evans is indeed shortly going to release all his code and data. It is frankly astonishing that he should have been criticized for lack of transparency when he has made it quite clear from the outset that he was going to release everything. The vicious attacks on him have shown just how worried the Forces of Darkness are that he might have stumbled upon something other than Man that drives the climate, and – alas – just how jealous some skeptics are of the attention that his idea is attracting.
This is what Dr Evans says about the forthcoming release of the code and data:
““Our climate model is in a spreadsheet that we will be releasing shortly. We chose to do all the work for this project, right from the beginning, in a single Microsoft Excel spreadsheet for PC. It’s not the fanciest or the fastest, but an Excel spreadsheet is the most ubiquitous and one of the friendlier programming environments. It runs on most computers (any PC with Excel 2007 or later, maybe on Macs with Excel 2011 or later), can hold all the data, makes nice graphs, and all in a single file.
“The models use VBA code, a form of the BASIC programming language that is part of Microsoft Office. The spreadsheet is professionally presented, and you press buttons on the sheets to make models run and so on. You can inspect and run or step through the code; it will be all totally open. Thank you for your patience, but giving away the spreadsheet early would pre-empt the blog posts and disrupt a focused discussion.”
RossP says:
June 28, 2014 at 6:19 pm
As I’ve had occasion to write here before, that’s just Willis being Willis.
I’m confidant that Dr. Evans will provide data & code in a timely manner. To compare him to Jones & Hansen is IMO absurd. Waiting to while promising promptly to present everything in support of a model is a far cry from fighting tooth & nail, grabbing & holding onto wood work while being dragged screaming & kicking to comply with a FOIA request to follow basic scientific procedure by showing your data & work.
NASA’s page on TSI shows both types of TSI plots, one Space Age and another longer term, and the long term one shows a recent uptick in the regular zig-zagging of a falling trend since about 1970:
http://lasp.colorado.edu/home/sorce/data/tsi-data/
A Photoshop overlay of Evans versus the NASA page shows a fair match with a downturn since 1970 and a recent uptick that corresponds to Leif’s bowl back only to 2003:
http://oi61.tinypic.com/2meafea.jpg
So the TSI is indeed falling but is noisy or chaotic in short term trend. The debate here seems to be about how the level of Leif’s bowl pulls down the average since 2003 even though the level itself recovers to that lower 2003 value. I don’t see much issue here either way now that I look at the plots in detail.
Monckton of Brenchley said in part June 28, 2014 at 5:54 pm:
“…David is using a brand of mathematics that most climate scientists have very little familiarity with….”
Possibly.
It is fair to flip this about to say that David’s theory crucially involves this “brand of mathematics” (signal processing) that many “non-full-time climate scientist” have a LOT of familiarity with? Indeed, isn’t David advertised first as a DSP engineer?
Yet he ignored, often with what seemed true resentment (on Jo’s blog), our pointing out clear mistakes. Well, engineers do their very best work standing around a blackboard, coffee cup in one hand, chalk in the other, calling out errors, laughing at our usual foolishness. In the end, we get things right. Blogs – not so much!
Cooling, unlike a lack of warming for 17 years, is a game changer. There will be significant cooling in time for the US presidential election. Cooling of the planet that correlates with an abrupt change to the solar magnetic cycle during a presidential election will be a major news story. There will be panic in the science community as the paradigm rapidly changes.
http://cc.oulu.fi/~usoskin/personal/nature02995.pdf
Unusual activity of the Sun during recent decades compared to the previous 11,000 years
Here we report a reconstruction of the sunspot number covering the past 11,400 years, based on dendrochronologically dated radiocarbon concentrations. We combine physics-based models for each of the processes connecting the radiocarbon concentration with sunspot number. According to our reconstruction, the level of solar activity during the past 70 years is exceptional, and the previous period of equally high activity occurred more than 8,000 years ago. We find that during the past 11,400 years the Sun spent only of the order of 10% of the time at a similarly high level of magnetic activity and almost all of the earlier high-activity periods were shorter than the present episode.
How many sunspots do you see on the sun. This is the peak of solar magnetic cycle 24. There will be no solar magnetic cycle 25. A simpleton can predict what will happen to planetary climate. There are cycles of warming and cooling in the paleo record that correlate with changes to the solar magnetic cycle.
http://sdo.gsfc.nasa.gov/assets/img/latest/latest_4096_4500.jpg
Is there any other physical explanation for the sudden and significant increase in Antarctic sea ice?
http://arctic.atmos.uiuc.edu/cryosphere/IMAGES/seaice.anomaly.antarctic.png
Antarctic sea ice is now more than 2 sigma greater than the 30 year average for ever month of the year.
http://nsidc.org/data/seaice_index/images/daily_images/S_stddev_timeseries.png
Arctic sea ice is recovering. The predicted minimum Arctic sea ice for 2014 is above the 30 year average.
To avoid career ending political retribution for climate gate type shenanigans, US government scientific agencies and US universities will suddenly become neutral concerning reporting of what is happening to the sun and cooling climate change. There will suddenly be discussion of past cyclic abrupt climate changes that correlated with solar magnetic changes. Those who were center in climategate type research and public discussion will suddenly become isolated.
OMG such debate. Plate tectonic theory next?
It’s obvious Dr Svalgaard wasn’t one of the scientists that Dr David Evans has consulted with in producing his model, which by the hysteria he shows here was a good thing. He doesn’t seem to have read all the posts at Jonova, along with other critics like Willis who also appear not to have. Otherwise he would not have had this outburst, which is not dissimilar to the worst kind of bullying from climatologists like Mann. Just shut up Dr Svalgaard, and wait until it’s all out there, then you can be free to criticize all you want.
This just proves Evans’ approach was right in a deliberate effort to educate the rest of us in a field few of us are expert in. As he said, if it turns out wrong, throw it out! Patience is a virtue.
Meh. We’re doomed anyway.
A lot of people are missing the big picture. All 50 of the IPCC models have been proven wrong, invalidated, shown to be worthless, demonstrated as no good, falsified by actual observation. Tens of billions have been spent on the basis that those models would be proven to be correct. That didn’t happen and it is like the weight of medieval superstition has been lifted from mankind, all over again. We are free to pursue what might really work. We are well into the 21st century and, as far as I know, there are only two models with predictive ability that are still in the game – mine and David Evans’. Of those two, the former is very blocky with an eleven year average forecast while the latter has monthly data input providing a monthly output profile. This much finer resolution, once validated, will be of great practical value to real world practitioners. People who speculate on corn futures perhaps, the longer dated contracts especially. His model is full of goodies – it is an Aladdin’s Cave of data sets all put together very neatly. Its release will be Christmas come early for all who have a natural curiosity re climate. Those in the pay of Soros won’t like it so much.
Willis E needs to grow up. Sheesh!
I am grateful to NikfromNYC for having compared Dr Evans’ graph of total solar irradiance with an official dataset and for having found the two to be substantially similar: certainly not dissimilar enough to make an issue of. Yet – let it not be forgotten – Mr Svalgaard made an issue of it, saying that Dr Evans had deliberately used wrong total-solar-irradiance data, saying he had an “agenda” and, for good measure, accusing him of coming close to fraud.
And Mr Svalgaard has unbecomingly ducked and dived and wriggled instead of apologizing promptly, which is what a true scientist would have done after having made such serious and – as NikfromNYC has now discerned for himself – baseless allegations about Dr Evans.
The bullying tone adopted by too many commenters here – whether through fear that Dr Evans may be right or through jealousy that he might get to the truth first – is unbecoming. I, for one, have less and less patience for those who make outright false allegations. Mr Svalgaard is very lucky that it was not I who was his victim.
It is beginning to look as though the only successful method of reminding true-believers in the New Superstition of their moral obligation not to make up falsehoods about those with whom they disagree, and to remind them also that the laws of libel apply to blog comments, is to take one of them to court. I have just discovered that a notorious individual on Joanne Nova’s site has been saying I “faked” a graph in whose design, production and publication I played no part at all. I am giving the individual in question a fair opportunity to back off. If he does not do so, I shall issue proceedings for libel. The outright mendacity of those who see the climate scare collapsing around them does them no credit. It reeks of the desperation of the cornered rat.
First, Christopher, my thanks for your prompt and thoughtful reply.
Monckton of Brenchley says:
June 28, 2014 at 5:54 pm
You, David, Jo, Phil Jones, and Michael Mann are all taking the identical position—we don’t have to reveal the data and code until we want to, and right now, we don’t want to.
I fail to see how this can be blamed on the scientific community. I manage to publish my data and code along with my theory. Steve McIntyre publishes his data and code. We don’t stand around and complain that the “scientific community” isn’t rational.
We just publish our data and code. How hard can it be, Christopher?
Ooooh, bad Lord Moncton, no cookies, logical fail. David has published all of the teasers and all of the advertisements for his work, but he has refused to publish the code, the data, the equation for the model, the number of parameters, or the out-of-sample tests.
Now, if you publish the uniportant half and refuse to publish the important half, when you come back and complain that people are attacking the half you’ve published, I’m just going to point and laugh. They’ve published I think seven posts now, ASKING FOR COMMENTS without posting the important stuff … so you simply cannot bitch that William Connelly (and I for that matter) have taken them up on the invitation to comment on the work. My comment to them was, stop faffing around and publish everything. Should I not have said that as well? They published in sections asking for comments, Christopher, and as a result, you absolutely can’t bust people for commenting. That’s not on.
If David didn’t want people attacking half of a theory, he has a simple option—reveal the data, reveal the code. The exact same thing Thompson refused to do. The same thing Phil Jones refused to do. Since David has steadfastly refused to do that, despite others asking and me begging him to reveal the data and code, you have no moral standing to complain when someone attacks the half-portions and teasers and advertisements that he has published.
Actually, I have noticed a whole group of scientists responding both on and off his blog to say that his math is badly flawed … in any case, aren’t you the guy who said that “appeal to authority” is a well-known logical fallacy? Except you said it in Latin, but still …
He has indeed put forth a genuine effort, and it is great that he has proposed a falsifiable test. It is a tragedy that he has spoiled it by channelling Phil Jones.
Christopher, I have a simple rule that has never failed me. When a man is hiding something, it’s because he’s got something to hide.
Let me suggest that you apply this rule to both David Evans and to Nicola Scafetta …
And while it’s wonderful to be assured that some day soon the great magicians will condescend to lift the veil of mystery and reveal to the undeserving polloi the code, the data, the equation for the model, the number of parameters, the out-of-sample tests, and everything else that they are keeping secret …
… I do not see what they are gaining by continuing to hide their light under a bushel. I mean, what is the gain in all of this? You’re left having to make excuses for them, and to come up with some BS claim about how it’s the fault of the “scientific community”; people who are honest scientists are pointing out that they are acting just exactly like the alarmists; nobody can check their work; people are giving objections based on half-information; we can’t answer Leif’s question because we don’t have the code and data … and for what?
What have they gained by this, other than deserved approbrium, and division among the people who should be their supporters? The only thing I can see that they’ve gained is a whole host of suckers who have signed on and are busily defending the theory before seeing the out-of-sample tests that Jo says are already completed. Was this their intention going in? I doubt that greatly … but it’s the situation coming out.
Now, perhaps you and they think that tradeoff, gaining devotees and losing scientists, is worth the approbation. Or perhaps you are amazed that I and others would hold David to the same standard to which we hold Michael Mann. Or perhaps you agreed with Jo, that their five years of hard unpaid work and dedication buys them exemption from scientific transparency. Or perhaps you just misjudged the outcome. I don’t know.
To me, every bit of what has happened is totally predictable. This is 2014, and science has changed. We got burned, Christopher, and burned very badly, by people doing just exactly what David and Jo are doing as I write this—hide the data, hide the code.
And as a result, the rules changed. Even Science magazine now has a policy requiring the authors to post data and code, not after the first seven publications as David is doing, but at the same time they post the theory …
But nooooo, you and Scafetta and David and Jo think you get some kind of special exemption from the rules because you’re on the side of the angels … never gonna happen. Scafetta will never be a scientist until he reveals his work.
In any case, if you have any swing with them, tell them it’s way past time, that their reputations are suffering along with yours, that their advertisement for their science is way past its use-by date, and the hour has come to extract digit …
As always, my friend. Please know that none of this is personal regarding you, other than my heartbreak at the fact that for the second time, I see you supporting someone who is spitting in the face of scientific transparency, and I want to shake you and say wake up, dear fellow, it’s 2014, wake up to the current scientific reality …
w.
PS—An exit question. If you had it to do again, would you advise them to post up the results when they posted up the theory? I mean … was all of this worth it?
It seems to me that you’all are talking about a change of maybe a little more than 1 W/m2. Would you even notice it if the left side (vertical) went from 0 – 2000 W/m2 instead of being centered on a tiny portion of that such as it is now?
On the contrary, medieval superstition is alive and well. In some cases it’s gotten worse.
Christopher, one more comment. You’ve read enough of my stuff to know that when I get interested in something, I go get the data and run the numbers myself. I don’t trust anyone’s numbers, including my own. In that way I can understand what the authors have done, I can evaluate their work, I can see if I can improve on their method.
So when I started looking at the “notch filter” hypothesis, and discussing it with David, I found myself at a huge disadvantage—he had all of the secret information, and I had none. So I could and did make objections, but he could just say oh, you misunderstand what I did, or wait until the data is published or …
And I was left with no possible way to show that he was wrong. Without the data and code, science comes to a grinding halt.
As a result of not revealing the data, code, and results, he has established himself in an impregnable position. A number of signal engineers have posted strong objections to his work … but he can just say the same thing, that they don’t understand his deep mathematics … the math he hasn’t revealed. So they, like me, grind to a halt with nothing to say.
As a result, nobody can show that his work is flawed, nobody can falsify it, nobody can get him to concede a single point, nobody can say anything. It’s not possible. He just goes on blithely, asking for comments, as though it were a discussion between equals, when in fact he holds all the cards.
And he has kept up this highly asymmetrical charade for I think seven posts now. Of course, the credulati think that he’s da bomb, here he is blowing all of these signal engineers out of the water, and even Willis can’t find anything to say …
I’m sorry, Christopher, but I find his whole charade deeply depressing. Have we really sunk that low, that some charming fellow who invites comments on seven successive posts about his theory but steadfastly refuses to show his out-of-sample tests has people like you claiming that he’s doing science?
w.
cynical_scientist says (emphasis mine):
June 28, 2014 at 3:53 pm
Thanks, cynical. As I told David Evans, we agree that the temperature record shows no 11-year cycle. We just differ on the cause.
David posits a hugely complex system involving something described as a thermal notch filter. I asked him if he know of one other example of a natural thermal notch filter … crickets. He has steadfastly refused to publish his results, and has no observational evidence to support his ideas.
His original claim was that the notch requires a notch filter. You disagree, saying “duh” to the alternative, but that was his claim. After I and others noted the “duh”, he changed it to say that IF we assume the system is linear (or semi-linear), so that a change in the input GUARANTEES a change in the output, then the system requires a notch filter. I agree … and I say that is strong evidence that the the system is not linear in the slightest.
In contrast to David, I say that the reason we don’t see the 11-year solar cycles in the temperature is the same reason the global temperature shows no sign of the ~ 5% increase in solar input over the last half billion years—because the earth has strong thermoregulatory systems that maintain the temperature within a very narrow range (e.g. it was temperature-stabilized to within ± 0.3°C over the entire 20th century, a remarkable record). And I have provided a host of observational evidence to support this theory, and published the data and code for each analysis of the observations.
Your choice …
Regards,
w.
I cannot understand what Willis Eschenbach is wittering on about. Michael Mann has refused, to this day, to part with all his code and his data, and spent a fortune trying to make sure that the courts did not get to see his emails about it either. I have given a plain and clear account of the manner in which Dr Evans will shortly make everything available to everybody. Unlike Mann, he has no intention of concealing any inadequacies in his work from the public so that he can go posturing around the world sure in the knowledge that no one will be able to falsify what he refuses to make available.
Mr Eschenbach complains simultaneously that Dr Evans has not published his math and that some who have not seen his math have criticized it. Well, they should be more careful. I was taught not to criticize what I had not myself read.
It would be much better if Mr Eschenbach were to campaign against those “scientists” and journals that have a policy of refusing to make everything public, and of spending large sums with lawyers to keep publicly-funded scientific research permanently secret, than to whine at such pointless length about someone who has said that he will imminently make everything available, and in the most transparent and accessible way. There is a clear distinction between these two positions,
One realizes that Mr Eschenbach has strong views on the Sun’s lack of influence on the climate. He is entitled to those views. But other views are possible. It does seem to have been very cold on both sides of the Atlantic during the little ice age, which coincided with – and may have been caused by – the prolonged absence of sunspots during the 70 years of the Maunder Minimum. And it is also arguable that, given the large quantity of square meters on Earth, and the fact that 1 Watt per square meter is one Joule per square meter every second, a prolonged change in the activity of the Sun can indeed alter the climate on Earth, particularly if the small variations in solar activity are amplified by cosmic-ray displacement or some other such factor.
Dr Evans, instead of starting by trying to work out by what mechanism the Sun influences climate, has started by trying to work out whether the Sun influences climate. His broad conclusions are that solar variability can influence the climate; that at present one may attribute all of the past century’s global warming either to the Sun or to CO2 or to any combination of the two, or to natural variability.
But the interesting point about the current stage of his drip-feed release of his project is that he now foresees the impact of the two theories diverging. For most of the past century, solar activity was rising. From 1925-1995, peaking in 1960, there was a quasi-Grand Maximum. That may have caused some of the 20th century’s warming, just as our adding CO2 to the air may have caused some warming. But solar activity is now in decline and, if the solar physicists are right, it will be in decline for 20-60 years. Yet CO2 concentration is rising. So now it may become possible to discern which of the two theories predominates. This is potentially very interesting. Let the man have his say before you shoot him down.
Willis , you’ve made it clear where you’re coming from. But it looks like a storm in a teacup.
In ‘Strine terms (Down Under Speak) you could be seen to be accusing DA of “under-arm bowling”.
But it looks to me like he’s gone out to face Denis Lillee , without even a box. Pretty damn gutsy for mine.
Sorry , that should be DE (David Evans)
” Let the man have his say before you shoot him down.”
Hear hear.
Brad says:
June 28, 2014 at 3:47 pm
Gosh, you mean skeptics are human too?
Brad, if you don’t think skeptics can sling mud, look at the abuse I’ve taken for saying that I can’t find evidence of the 11-year cycle in the temperature data.
However, if you think you’ll find a more “sciency” site out there, I doubt it. The truth of the matter is that science is a blood sport. You have to understand that the central activity in science is showing that some guy’s precious pet idea is wrong, wrong, wrong … surely you don’t think that will be all flowers and rainbows.
But that’s what scientists do. And if you can show that e.g. some guy’s idea that he’s given his life to is based on some embarrassingly obvious error … well, despite stereotypes, he’s not likely to shake your hand and thank you warmly for advancing the science. Like any cornered animal, he’s likely to lash out.
Finally, we are at a turning point in science. It used to be OK to post your ideas without archiving the data and the code. We trusted that the scientists were doing what they were saying.
However, we got burnt very, very badly by that trust. And as a result, the new scientific requirement is total transparency—for your work to be considered science, you have to show everything.
Some people, unfortunately, haven’t gotten the memo … and as a result, the fight is intense. Look, I tried nice. I literally begged David Evans to please, please stop hiding the data … and I got bupkis.
As a result, I now speak strongly about his actions. And you may not like that, but he’s doing damage to both science and to the skeptical cause, so I’m not going to just stand by. So I use hard words, but it’s not because I haven’t tried the gentler methods …
In any case, I’d advise continuing to read WUWT, if only to see how this all plays out. Grab a beer and some popcorn, it’s always a good show around here.
Best regards,
w.
Monckton of Brenchley says:
June 28, 2014 at 8:22 pm
Perhaps you haven’t noticed, but David Evans has refused, to this day, to part with any of his code and his data. How is that any different? Yes, one day Mann and Evans may come to their senses and reveal their code and data … so how does that help us today?
w.
i’m happy to let jo and dave have fun presenting their discoveries and interpretations. it’s interesting and fun.
at xmas i hide presents and we wait for the day. half the fun is the surprise of opening them.
i don’t think that makes me treacherous and deceitful, but a wall of text in 24 pt Calumny Bold might persuade me…lol
Monckton of Brenchley says:
June 28, 2014 at 8:22 pm
Thanks, Christopher. I begged David to reveal his work to the public. He refused. To date, David has concealed any inadequacies so that he can go posturing around the web, sure in the knowledge that no one will be able to falsify what he refuses to make available.
He has kept up this charade for seven posts now, inviting comments while he knows no one can falsify anything he says, and thus able to appear to defeat their counter-arguments.
Sure, now that he has done that, now that over the course of the seven posts he has convinced the true believers and the less inquisitive that he’s able to vanquish me and a bunch of signal engineers and other scientists with one hand behind his back, perhaps at that point he’ll reveal the secrets …
How you find this charade anything but depressing is beyond me.
w.
Patience is not your strong suit Willis,
There are a lot of riduculous unscientific comments on this, so I would like to point out the following
Dr Evans’ model is valid for any system, any system having a notched transfer function can be described by the collection of elements that David has described… it’s a model, an approximation of the way TSI maps to temperature.
He makes an assumption that temperature should be driven by TSI, that’s part of the hypothesis.
Leif, jumps to unwarranted conclusions. I understand David has updated the input data and that does not change the conclusion. Leif is also seemingly unacknowledging of the possibility that he doesn’t know everything about Sun-Earth interactions. Dr Evans is not so dismissive. I might point out that Leif hasn’t mentioned the biggest failing of the model… an exercise best left to the reader.
From a science/engineering point of view there is nothing wrong with the model put forward, other than it might not descrribe Sun-earth interactions adequately. For that we must wait and see, until about 2020.
From a personal note, it’s extremely interesting to note that TSI modulates temperature on a daily, annual and geologic scale, but not across the sunspot cycle. Dr Evans is seeking to find out WHY? This is an interesting question all on its own, the idea that thermal inertia irons out the 11 ripple doesn’t work, it doesn’t result in the empirically derived transfer function, indeed David’s model finds that effect, but limited to a 5 year response.
For those that think TSI is too small to be discernable, – you will note that GPS signals are about 20 dB below the noise floor, GPS works by adding up multiple samples over many repeated cycles, the signal is correlated, the noise is not, and the signal rises from the noise (otherwise GPS “can’t work”). Even with this technique 11 year ripple doesn’t appear in the output temperature… now isn’t that interesting?, where did it go? Maybe TSI doesnt affect temperature and our observations that winter is colder than summer is all in our imaginations?
Give this model a chance, if its wrong we’ll know in a few years. If you have criticisms, send them politely to Dr Evans. If you have other ideas then do your own competing model.
Guys cool it maybe good idea! Wait till it is all revealed shortly and then have your say, anything said now is just conjecture and looks from the reading like a cream pie fight in the comics to the viewer,guys Cool it!
Monckton of Brenchley says:
June 28, 2014 at 8:22 pm
Christopher, if you have been reading my work, then surely you must know that I have been doing exactly that. I’ve campaigned very loudly for scientific transparency. I’ve written a number of open letters on the subject to e.g. the head of the NSF and the editor of Science and another editor of Science and a variety of other people, arguing forcefully for them to require archiving of code and data as a condition of publishing. I’ve done exactly what you recommend, in spades.
I see. You think I should hold my opponents to one standard, and David to another. Not gonna happen, my friend. It is because I have done what you recommend, it is because I have strongly advocated transparency in science, that I have no choice but to hold the skeptics to the same standard to which I hold the alarmists. Any other position would be hypocritical.
At this point, David has kept up this charade for seven long posts now, in a position which you describe accurately as being “sure in the knowledge that no one will be able to falsify what he refuses to make available.” After the publication of the second one, I told him his tactics were unethical, and I begged him to publish … and I waited through another post … and another …
If the data and code were one post late, I wouldn’t care. If it were two posts, I’d get concerned.
At seven posts, I’m sorry, but this evasive behavior is way, way past its use-by date. He’s maintained the fraudulent position where no one can falsify him for seven long and complex posts now, with equally long and complex comment threads, during which predictably he has roundly and unfairly “defeated” every opponent including myself, which has clearly impressed the credulous to no end, but which is an insult to science.
Color me unimpressed …
I’m sorry, Christopher, but that’s not science in any form. David’s pulling the same BS Mann pulled, and with exactly the same outcome—no one can possibly falsify his claims. You sure you want to endorse that?
w.
Willis
I guess I’m one of those you accuse of being sucked in. Well I haven’t formed an opinion one way or the other yet. I will wait until all the information is out.
If you keep doing things the same way in life you are unlikely to get much change. So David Evans has decided to publish what is a quite big and complex issue in a new way. It is still to be seen if it improves the publication of the information. Obviously you do not like this. A number of others have commented that they like what are doing.
But it is his work , not paid for by Government or anyone else, so it is his right to decide how to publish it. It is certain he would not have got it published by any of the main journals.
May I suggest you take up a suggestion made on Jo’s site to you — contact David privately and ask him for the full details ( which he intends to make public in the near future) so you can look at it , on the proviso you do not make any public comments on it until he has released it publically in the way he wants to.
But if you have already made up your mind that his work is useless it would probably be a waste of time.
farmerbraun says:
June 28, 2014 at 8:23 pm
I fear you’re going to have to translate that for me, farmer. I’ve been to Oz more than once … but I have no clue what “under-arm bowling” is when it’s at home, I don’t know who “DA” might be, and I haven’t any idea what it’s like to face the mysterious “Denis Lillee”, a being who sounds like the local Australian equivalent of the Headless Horseman …
My best to you,
w.
RossP says:
June 28, 2014 at 9:18 pm
Thanks, Ross. In that case, you’re definitely not one of the ones I would say were sucked in.
w.
David Archibald asserts: “We are well into the 21st century and, as far as I know, there are only two models with predictive ability that are still in the game – mine and David Evans’”
Yet if you just turn down the water vapor positive feedback then the climate models should do fine. It’s not that they are falsified in spirit, only in overenthusiastic and alarming sensitivity. Their need to parametrize a bit doesn’t suddenly throw good light on mere wiggle matching models.
hmm –
http://solarscience.msfc.nasa.gov/images/bfly.gif
http://solarscience.msfc.nasa.gov/images/ssn_predict_l.gif
from mid 1997 to mid 2000 (3 year period) the ssn went from 10 to 170
from mid 2010 to mid 2013 the ssn went from 10 to 70 though there was a larger peak (about 100) later, but it is clear to see there has been a dramatic drop in the suns activity.
looks to me that the tsi follows the ssn pretty well-
http://spot.colorado.edu/~koppg/TSI/TSI.jpg
ultimately it does not matter that much because it seems we will be able to play with the model ourselves. congrats and thanks to evans and jo for taking the time to create the model. i am looking forward to playing with some of the variables and maybe plug in some other info as well.
the response from this series of posts from nova seems to be a bit out of proportion even before the series is over. whats the story? some toes being stood on or something? is this model going to cost us billions of dollars or something? who knows. but this last couple of months has had me revising the people i trust for an unbiased opinion, thats for sure.
RossP says:
June 28, 2014 at 9:18 pm
Certainly he can decide how to publish it. I’m saying that publishing it as he has done gives him a huge and unfair advantage over those with whom he’s spent seven posts discussing his theory. Christopher Monckton described his position accurately as being “sure in the knowledge that no one will be able to falsify what he refuses to make available.”
And that, my friend, is about as far from science as you can get. Sure, as you point out they can publish like that, and give David an unfair advantage over anyone who might not agree with him … but while they are free to do it, it is an underhanded tactic.
Absolutely not, I have no interest in that at all. The problem is not that I can’t access the data or read the results of the out-of-sample tests. It’s that no one can read or access them.
You have missed the point completely. There is no way that I can make up my mind about anything until I see the data and the code. Nobody can say whether it’s genius or garbage, and all the while David is prating about its advantages and “defeating” his naysayers … sorry, but to me that’s unacceptable.
Sure, I think his model wrong, just based on the improbable complexity and the lack of any other system that works in the way I think his model works … but at this point none of us know how his model works except the inner circle. Without the data and the code it’s not science, it’s just an advertisement.
Best regards,
w.
Mr Svalgaard is wrong and Monckton of Brenchley is right, Dr Evans is owed an apology. I’d like to make a verry important point here, just because data is slightly wrong doesn’t make the model invalid. The MODEL is correct as far as it goes, there is nothing scientifically wrong with it as a mathematical description of a system. The data that is fed into it, is another matter, it is NOT part of the model. The model is not defined by the data, just the parameters of it. I agree an apology is in order.
For those that dispute that radiant energy can exhibit notches at different time delays, please review the two slit experiment from high school, two radiant energy beams from the same source destructively interfere at certain time delays to create a null, same effect causes speckling in lasers.
Willis, needs to have patience, David is working with many people to see if his model can withstand criticism, he, I expect, will fix issues as they are pointed out to him prior to releasing his code. Willis, Doubtless he has already taken your criticisms into account. Let’s give him time to lay out his story and take feedback before we move to convict.
From Salvatore Del Prete on June 28, 2014 at 9:00 am (bold added):
ETC. You pulled the same stupid stunt at Maunder and Dalton Sunspot Minima.
If you’re gonna spew Wikipedia and pretend it’s relevant, then PLEASE provide the entry link.
https://en.wikipedia.org/wiki/Solar_variation
And clean it up.
Actually, next time can you PLEASE just provide the dang link, and stop cluttering the blog with nigh-endless nonsense requiring not-quite-nigh-endless scrolling to get past? Like you did here in this very thread.
Oh wait, I see what you did by what you have in that comment. My apologies. It wasn’t that you spewed Wikipedia. You spewed a Wikia entry which is using an uncredited copy of the Wikipedia entry.
So you presented the same info as evidence twice, except the first time was annoying.
Needless to say, such actions do not help your presentation.
Monckton of Brenchley says:
June 28, 2014 at 6:16 pm
Dr Evans for having used TSI data virtually indistinguishable from the historical record on the SORCE/TIM website
The plot on the SORCE/TIM website is not a ‘historical record’, but a flawed reconstruction by Lean dating back to 2000. Even Lean now acknowledges that this old reconstruction is not correct [she published another one with Wang in 2005], and recent work [Hagenaar 2008] shows that the underlying assumption of both reconstructions [that the emergence rate of ephemeral regions follows the solar cycle] is false, so the reconstructions are not valid. Mr Evans should have done due diligence before using flawed data. He clearly did not [to be generous].
Tom Harley says:
June 28, 2014 at 7:10 pm
Just shut up Dr Svalgaard, and wait until it’s all out there, then you can be free to criticize all you want.
No need to wait as it is already clear that the TSI data that goes into the model is garbage. And garbage in, garbage out.
Monckton of Brenchley says:
June 28, 2014 at 7:25 pm
Mr Svalgaard made an issue of it, saying that Dr Evans had deliberately used wrong total-solar-irradiance data, saying he had an “agenda” and, for good measure, accusing him of coming close to fraud.
I don’t think he did it nilly-willy, so shall assume that what he does is deliberate, but it is still the case that garbage in gives you garbage out. His and yours agendae are obvious.
And Mr Svalgaard has unbecomingly ducked and dived and wriggled instead of apologizing promptly
One should not apologize for stating the truth. One the contrary, one must be steadfast and not be bullied by threats [see below].
Mr Svalgaard is very lucky that it was not I who was his victim.
But you have now made yourself a victim now because of your accusations.
the laws of libel apply to blog comments, is to take one of them to court.
Ah, the Mannian method. If you can’t beat their science take them to court. Good luck with that.
Wouldn’t the suns orbit have some measure of temperature fluxes, including sun spot activity. And cloud cover generated by nutrinos (cosmic rays).
Monckton of Brenchley says:
June 28, 2014 at 6:16 pm
Dr Evans for having used TSI data virtually indistinguishable from the historical record on the SORCE/TIM website
The plot on the SORCE/TIM website is not a ‘historical record’, but a flawed reconstruction by Lean dating back to 2000. Even Lean now acknowledges that this old reconstruction is not correct [she published another one with Wang in 2005], and recent work [Hagenaar 2008] shows that the underlying assumption of both reconstructions [that the emergence rate of ephemeral regions follows the solar cycle] is false, so the reconstructions are not valid. Mr Evans should have done due diligence before using flawed data. He clearly did not [to be generous].
bobl says:
June 28, 2014 at 9:36 pm
I’d like to make a verry important point here, just because data is slightly wrong doesn’t make the model invalid.
The data is not slightly wrong, but verry wrong, and hence the prediction [which was the topic of the post until the hound of the PR-machine began to spew nonsense] is wrong, which was my point.
In response to my:
“As I read this work it starts with an assumption TSI => GST without recourse to GHGs, and looks at the consequences. It steps its way through making a number of further assumptions about cause and effect that are chosen not to violate empirical evidence”
lsvalgaard says at June 28, 2014 at 4:42 pm:
“Except that it does. The TSI reconstruction they use is not empirical evidence and we know today that it is wrong.”
Strangely, from a methodological view the primary assumption doesn’t have to be empirical, only not related to GHG concentrations. For practical purposes it is more useful if one can forecast it, and it is less credible without an empirical explanation, but if we found we could stick white noise into a model that didn’t rely on internal processes and it reliably and predictably reproduce the temperature series the same point would be made.
Willis, what farmerbraun is saying is you are accusing DA of behaviour that might not break the letter of the law, but isn’t (shall we say) “cricket”. Facing Lillie without a box is leaving oneself unprotected in the face of an extremely fast bowler. We Kiwis understand this stuff well as the former is typical behaviour from those from the West Island.
More broadly on your contribution to the debate, I get your point about lack of data and your desire for testable results (I got it before you said it the first time), but it surprises me the methodological issues aren’t of interest in the meantime.
Well I am sure David will be resilient enough to answer queries, just tune onto JoNova blog, he’s her husband.
mobihci says:
June 28, 2014 at 9:25 pm
looks to me that the tsi follows the ssn pretty well-
http://spot.colorado.edu/~koppg/TSI/TSI.jpg
And on the plot you can see that there is not a dramatic drop in either tSI or the SSN from 2003-2005 until today. On the contrary, TSI [and SSN] is now higher than in 2003-2005. This was my objection to the prediction of a sharp drop in temperature based on a [non-existing] drop in TSI. simple as that.
So where’s the improved TSI plot then, Leif?
Hagenaar 2008 doesn’t have one: http://iopscience.iop.org/0004-637X/678/1/541/pdf/0004-637X_678_1_541.pdf
Vast changes in the TSI plot have been noted here:
http://wattsupwiththat.com/2014/02/10/historical-and-present-total-solar-irradiance-has-been-tinkered-with-again/
The SORCE page claims their plot is not an ancient algorithm:
“The historical reconstruction provided here was computed using TIM V.15 data in February 2014. It is updated annually as new TIM data are available or as improved historical reconstructions are created.”
You have your own plot that doesn’t show much drama, but just as a web page;
http://www.leif.org/research/TSI-Reconstruction-2014.png
Again though, with a wiggle matching algorithm, any plot may do but future predictions might change.
farmerbraun says:
June 28, 2014 at 8:23 pm (Edit)
Willis , you’ve made it clear where you’re coming from. But it looks like a storm in a teacup.
In ‘Strine terms (Down Under Speak) you could be seen to be accusing DA of “under-arm bowling”.
But it looks to me like he’s gone out to face Denis Lillee , without even a box. Pretty damn gutsy for mine.
HAS says:
June 28, 2014 at 10:04 pm
Thanks, HAS. So farmerbraun saying that David’s actions aren’t “cricket”, but he deserves credit for putting his theory out there in the face of strong opposition …
Mmmm … what is the strong opposition that he’s facing that take so much guts?
And in any case, near as I can tell, withholding the code and data has given him a huge advantage over myself or anyone disagreeing with him. Lord Monckton accurately describes his position as being “sure in the knowledge that no one will be able to falsify what he refuses to make available.” I’ll have to ask the farmer, how on earth is that “gutsy”?
Until he releases the details of the method, there is no way to decide if such issues even exist. Seriously, he hasn’t released the equations that make up the method … so how can anyone discuss the method?
w.
NikFromNYC says:
June 28, 2014 at 11:17 pm
So where’s the improved TSI plot then, Leif?
http://www.leif.org/research/TSI-LEIF.png is close enough although there are recent [small] upgrades.
The SORCE page claims their plot is not an ancient algorithm:
“The historical reconstruction provided here was computed using TIM V.15 data in February 2014. It is updated annually as new TIM data are available or as improved historical reconstructions are created.”
SORCE/TIM began observing in February 2003. The “historical reconstruction provided here was computed using TIM V.15 data in February 2014” simply means that the old Lean 2000 reconstruction was spliced to TIM matching in 2003. Of course, if new ‘improved historical reconstructions’ are created TIM can be spliced to the end of those as well. There are, of course, no historical data before 1978, only guesses based on models and assumptions [some of which were wrong]
Well then Willis you will have to wait like the rest of hs won’t you?
Leif, if the data is so wrong then how about you furnish Dr Evans with better data?
While I am making this point Leif, are you claiming the reconstruction David used is wrong for every solar cycle it is trained on as David’s methods involves extracting the transfer function from the TSI data. To arrive at a grossly incorrect parameterisation of his model either time, or magnitude, the training data would have to be systematically wrong in both time and magnitude across a significant span. If you are worried about the last few years as in a recent post, then that will affect the prediction but not the MODEL, which is based on all 150 years or so of data.
It makes a difference whether you dispute the model, or the prediction.
I also wonder if you really understand what David has done here? It’s hard to know?, you are a very smart person, but everyone has gaps.
Willis, I should have added I take no view on what farmerbraun said, just a helpful sideline interpretation. You need to understand that part of the joke is the Aussie cricket team had one last ball to bowl in a limited over match and the Kiwis need a 6 to tie. The under arm bowl deprived the Kiwis of that opportunity. Since then under-arm bowling has been band in one day cricket.
Turning to more substantial issues than trans-Tasman grudges, each to their own but I’m surprised you aren’t more interested in top-down and mult-scale modelling as techniques in climate science, or in the application of signal processing to it. I found enough of interest in that alone without needing to see the definitive data and results, although they will be equally interesting when they arrive (although I don’t think they will prove to be the main game).
As to the PR effort surrounding this, I’d have to say we’re all guilty of that, all said and done.
… and that should of course been “banned”. Too busy keeping an eye on the dinner.
The notch filter idea isn’t that complex. Personally I wish he had avoided the term as it makes people think of it far too concretely. He is using the terminology of signals processing and all he is saying here is that the 11 year frequency in TSI isn’t showing up in the output (temperature). I like this idea of looking at frequencies. It has its limitations but it gets past so many issues with adjustment and reliabillity of data.
The notch defines the filter. Even if you simply disconnect the input from the output, you can model that disconnection as a filter. As to linearity – it isn’t a vital part of his analysis. He only mentions it because certain aspects of the fourier analysis he is using are only guaranteed to work properly (in the mathematical sense) if the system is linear. However all realistic systems are at least approximately linear so Fourier analysis continues to be useful even when the assumption of strict linearity does not hold.
I don’t think what you and David are doing needs to conflict. I found the early parts of David’s analysis very interesting and thought provoking. I don’t buy his model though as I seriously doubt you can build an accurate model with TSI as the only input.
I agree with your active thermostat approach (and your analysis of cloud formation and thunderstorms is spot on) but unfortunately there is much that this does not explain. To damp out the 11 year TSI signal completely that thermostat would need to react very quickly and strongly to the extent that the thermostat completely dominates over all other factors. It is an attractive idea, but if climate were that tightly regulated then how could the climate vary at all? Your hypothesis explains very nicely why climate does not change, but it is less satisfactory as an explanation for why it does.
My choice is that I think you both are right. I think David’s notch filter is indirect solar effects tweaking with the control knob of your thermostat. And the tweaking is happening in an approximately 11 year cycle in opposition to TSI further helping to damp out the 11 year signal.
Proving this numerically would be difficult though. It would be hard to separate out the active response of the thermostat from the effect of tweaking the knob.
Cheers
Cynic
I’ve advised folks in the past not to bet again Leif Svalgaard regarding the sun. I mean, the dude has a solar-related effect named after him. Mark Twain once commented, “Never argue with a man who buys ink by the barrel.”

Me, I’d say “Never bet against a man in a field where he has a scientific effect named after him” … this post is a good reason why.
Leif said that the input data for the Evans model is incorrect, because it shows a large recent drop in TSI. Here’s that data, from JoNova’s web site:
Note that the claim is made in the graph that from 2003-5 to the present, the TSI has been dropping almost vertically. Over that period, it’s supposed to have dropped almost half a watt per square metre … and regarding that graph, Leif said:
Since Leif made his statement, there’s been lots of noise about it. Lord Monckton and others have wasted lots of electrons claiming that Leif was incorrect, but so far nobody’s shown that he’s wrong about the claimed drop in TSI.

Now, some of you know my style—go straight to the data. I’d love to use the Evans data … but they haven’t published it yet, so I can’t …
However, upon re-reading this thread just now, I realized that in addition to the ACRIM etc. TSI data and the Lean TSI data, we also have 13 years of very good solar data from the CERES dataset. This would give me the chance to use an entirely different dataset to see if Leif is right, or whether the TSI actually has dropped from 2003-5 to the present … so went and calculated the TSI from the CERES dataset. Here’s the result.
As you can see, the CERES data says that Leif is totally correct. Not only is there no precipitous drop in TSI since 2002/3 as Evans claims. In fact, by 2013 the TSI was HIGHER than it was in 2003-5.
And as a result, what’s going into David Evan’s magic notch filter model is garbage, because TSI isn’t falling at all since 2003-5 as they claim … and there’s an old saying about what happens when you put garbage into a computer model …
w.
What is the average temperature? Does predicts in October half a meter of snow on the prairie? Does foresee in May snowfall on the field? Consider what people remember from the Dalton Minimum?
Perhaps Napoleon’s expedition to Russia? Durable changes in circulation will change our views.
Don’t worry about when the cooling will begin, it already has, and it’s right in plain sight.
The Antarctic Sea Ice extent is at a record 2m sqkm above ‘normal’, and the Arctic is busy rebuilding it’s 5 meter ice wall from Greenland to the northern tip of Banks Island, is back within the 1979 – 2000 (or 2010) mean, and readying for more of those balmy Polar Vortex droppings.
Just because it doesn’t arrive in the generally expected manner doesn’t mean that it isn’t happening.
It surely is starting. Besides, predicting with the ‘correct’ formula isn’t going to to stop it or make it any less devastating.
HAS says:
June 28, 2014 at 11:49 pm
Good question, HAS. I’m interested in both top-down modeling and the application of signal processing. However, I am also very aware that neither top-down nor bottom-up methods spontaneously generate emergent phenomena, which are generally far below grid scale. And without emergent phenomena the model is useless.
I am also aware that there are many things that work in the lab that have no counterpart in nature. For example, we commonly take a signal on a carrier wave, heterodyne it with an intermediate frequency, rectify the result, and extract the signal … but I know of no part of the climate that does anything like that.
So when David Evans claims that we can model the climate using just the TSI as input by feeding it into a delayed multiplier feeding a notch filter filter whose output goes to a delay filter, and the result is then added to a direct multiplier of the original signal and fed into a low-pass filter, whose output goes into a RATS multiplier … sure, that’s a 100% possible design for something we might build in the lab.
But as a model of a natural climate system? Sorry, not interested in the slightest. Evans is postulating a thermally based notch filter. I’ve never even heard of such an animal, and I have no idea how it would work. A notch filter works on resonance … and although I can conceive of the possibility of a thermal resonator, I’ve no idea what it would look like in a climate system.
Finally, HAS, because David has refused to share the method, to date we have no idea how many tunable parameters are used in the model. With enough tunable parameters and a free choice of mathematical transforms (notch filters, multipliers, low-pass filters, adders, delay filters, etc), I can match the global temperature data using nothing except for the price of US stamps as the input … but so what? Does that mean that stamps rule the climate? Hardly.
Regards,
w.
Agreed. You can’t use TSI to explain temperature regardless of what kind of filter you use. Nor should you try. Unfortunately I think this broken model and bad choice of data is going to overshadow the more useful ideas in the earlier parts of his work. In particular I think looking at the transfer function is a very useful approach.
To me the sad thing is that he has missed the point of his earlier observations. He observed possible evidence for a direct solar effect out of phase with TSI (magnetic field strength being a good candidate). But instead of switching his attention to magnetic field strength he persisted with modelling this indirectly from TSI via an 11 year delay when he KNOWS that this is unphysical. The problem is that by doing this he misses precisely all the interesting stuff that happens when the sun goes quiet and magnetic field strength drops across the entire solar cycle. He didn’t need to use old data with an erroneous drop in TSI. If he’d used actual magentic field strength he would probably have obtained a similar result without bending any data.
Willis (having finished dinner) no harm in a black box (or a series of black boxes) provided we are simplifying (aka, as you say, no over-fitting).
My point is that the technique is interesting, as is its application to this class of problem. The proof of the pudding will be in the eating, but in the domain of climate modelling I don’t see enough of this kind of discussion.
The problem is the dominance of bottom-up thinking in the modelling community. My response would be the same as that to the traveler seeking directions to Dublin “I wouldn’t start from here”. It is clear that this complex system will have parts that can be modeled on this basis, but we will make more progress by also using these kinds of “black box” technique.
So I welcome this discussion, and as you will probably have gleaned I’m surprised you too don’t also focus on this aspect, and hold your powder on whether this particular implementation adds value. IMHO this will prove too pat, but a robust discussion of the place of this and related kinds of approaches is to be encouraged.
Has anyone yet said we don’t actually know?
cynical scientst says:
June 29, 2014 at 12:07 am
Ummmm … errrr …

Simple???
w.
cynical_scientist says:
June 28, 2014 at 3:53 pm
……..
You made number of good and sensible points despite all the back yard’s flying feline fur.. Hemispheric magnetic field is rather weak at the earth’s orbit, however the Earth’s magnetic field shows similar long term trends but in the opposite direction, correlation is particularly strong in the Antarctica. The negative correlation (regardless which TSI model is used (Svalgaard’s or the earlier Lean one), gives R2 as high as 0.77.
Denying existence of something which is clearly in the data (as per Dr.S practice in this case) for either lack of understanding or any other reason, is contra productive. However the NASA-JPL’s scientist Dr.Dickey is of more open mind: http://www.nasa.gov/topics/earth/features/earth20110309.html
PMOD TSI at WoodForTrees stopped at 2011.75. Leif had mentioned there was more recent data but unfortunately I didn’t copy the link. WFT gave the FTP directory and said the file was “pmod_composite_latest.dat” but it’s not currently there.
ftp://ftp.pmodwrc.ch/pub/data/irradiance/composite/
Inside directory “DataPlots”, by the latest file date (5/20/2014), it looks like the recent stuff would be in “org2pmod_composite.dat” but that’s the composite and the different TSI series that went into the composite, and while informative it only goes to 9/17/2011.
Which makes the best remaining candidate “composite_42_64_1402.dat” which has “extended data” back to 1976 which WFT does not, and runs forward to 2/25/2014.
http://www.climate4you.com/Sun.htm is informative, with info on Ap Index and other things (and has the unfortunate Lean 2000 reconstruction), however it points to NOAA’s National Geophysical Data Center (NGDC) and an old 2003 PMOD file.
Hunting around, this looks like it should have the current info, in a directory similarly named to the cliamate4you-mentioned location: http://www.ngdc.noaa.gov/stp/space-weather/solar-data/solar-indices/total-solar-irradiance/
But aside from “Smithsonian Astrophysical Observatory 1902-1954”, nothing was updated since 2013, and nothing looks like the composite, just different series.
So is “composite_42_64_1402.dat” the most recent TSI data I want?
lsvalgaard
Cosmic rays also produces a quick electrons in the heliosphere.
A Very Local Interstellar Spectrum for Galactic Electrons
M.S. Potgieter, E.E. Vos, R.R. Nndanganeni, M. Boezio, R. Munini
(Submitted on 7 Aug 2013)
We present a new local interstellar spectrum for cosmic ray electrons over an energy range from 1 MeV to 70 GeV. Below (0.8 plus minus 0.2) GeV it has a power law form, E^-(1.55 plus minus 0.05), with E kinetic energy, which is consistent with previous studies. This is derived from comparing Voyager 1 electron data observed during 2010 with a comprehensive modulation model. However, reproducing the PAMELA electron spectrum observed at Earth during late 2006 and to address an unexpected increase in the electron spectrum between about 2 GeV and up to about 20 GeV, a spectral index of -(3.3 plus minus 0.1) instead of the reported -(3.18 plus minus 0.05) was found for this energy range. This feature cannot be caused by solar modulation or any other process inside the heliosphere.
http://arxiv.org/pdf/1308.1666v1.pdf
HAS says:
June 29, 2014 at 1:11 am
Thanks, HAS. I’m sorry, but my value threshold for a black box is much, much higher than that it result in “no harm” …
Regarding overfitting, since David has refused to reveal the secret knowledge, we have no idea how many tunable parameters there are in the model … but given that it is composed of a splitter, three filters, three multipliers, and an adder (weighted?), it’s going to be a large number. One diagram they show of a portion of the system shows no less than 11 tunable parameters.
Remember what von Neumann said about parameters and elephants, that with four tunable parameters he could model an elephant, and with five tunable parameters he’d make him wiggle his trunk … and Evan’s model has at least eleven tunable parameters.
As a result, while you may be impressed that David Evans’ model can make the elephant wiggle his trunk, me, not so much …
Best regards,
w.
If the current abortive el Nino is beginning to overturn toward a possibly much stronger La Nina then Evans’ model would appear to receive some initial support.
Yeah well that is a picture of his model not of the notch filter. The notch filter is the bit labelled “notch filter”. I offer no support for the model.
NikFromNYC says:
June 28, 2014 at 9:22 pm
David Archibald asserts: “We are well into the 21st century and, as far as I know, there are only two models with predictive ability that are still in the game – mine and David Evans’”
Yet if you just turn down the water vapor positive feedback then the climate models should do fine. It’s not that they are falsified in spirit, only in overenthusiastic and alarming sensitivity. Their need to parametrize a bit doesn’t suddenly throw good light on mere wiggle matching models.
========
You’re correct to a point but I think it goes a bit deeper than that.
http://climategrog.wordpress.com/?attachment_id=884
Volcanic forcing has been ‘tuned’ downwards, in order work with spuriously high sensitivity of the models. Not only are they tuning the model parameters, they are tuning the input data too.
There is also a long term warming effect once the volcanic “dust” settles. This is not recognised AFAIK and is being falsely attributed to GHG. see figures 3 and 10 in that post.
and this:
http://climategrog.wordpress.com/?attachment_id=955
ACE News #122 (4/30/2009) reported that the intensity of galactic cosmic ray (GCR) Fe at ~350 MeV/nuc, was ~12% greater in early 2009 than in 1997-1998 and also greater than ever before in the space age. The measurements were made with the Cosmic Ray Isotope Spectrometer (CRIS) on ACE. As 2009 progressed the GCR intensity continued to increase until approximately New Years Eve, when the intensities of major species from C to Fe were each 20% to 26% greater than in 1997-1998 (e.g., oxygen in Panel (a) at the right). Early in 2010 the intensity decreased to 1997-1998 levels.
http://www.srl.caltech.edu/ACE/ACENews/ACENews134.html
Ah Willis, if only we were simply making elephants wiggle their trunks (or their speedos for our Aussie friends).
The thought of 20 megs of error prone excel Excel fills one with horror. Could he not have used a real programming language where you can see what you are doing? One A4 is about the limit of what its safe to do in a spreadsheet – and no macros! Every single business model I have ever seen in Excel contained gross errors which use of a proper language would have avoided.
Stephen Wilde says
http://wattsupwiththat.com/2014/06/28/a-cool-question-answered/#comment-1671625
Henry@ren @Stephen
It seems you do not understand that ozone (& others) also back radiate
http://blogs.24.com/henryp/files/2011/08/Atmospheric_Transmission.png
Trenberth reports that 25-30% of direct radiation from the sun does not reach earth because it is absorbed and re-radiated by the atmosphere. Ozone on its own is responsible for about 25% of that 25%-30%. Hence, there is more back radiation (cooling) if there is more of it. However, Trenberth forgot or never knew about the peroxides and nitrogenous oxides also being formed TOA.
Although the new analysis suggests, perhaps surprisingly, that supernovae are on the whole good for life, high supernova rates can bring the cold and changeable climate of prolonged glacial episodes. And they can have nasty shocks in store. Geoscientists have long been puzzled by many relatively brief falls in sea-level by 25 metres or more that show up in seismic soundings as eroded beaches. Prof. Svensmark finds that they are what can be expected when chilling due to very close supernovae causes short-lived glacial episodes. With frozen water temporarily bottled up on land, the sea-level drops. – See more at: http://www.astrobio.net/topic/deep-space/cosmic-evolution/did-supernovas-boost-life-on-earth/#sthash.OGg8Q3wN.dpuf
HenryP says:
June 29, 2014 at 3:05 am
Stephen Wilde says
wattsupwiththat.com/2014/06/28/a-cool-question-answered/#comment-1671625
Henry@ren @Stephen
It seems you do not understand that ozone (& others) also back radiate
http://blogs.24.com/henryp/files/2011/08/Atmospheric_Transmission.png
Trenberth reports that 25-30% of direct radiation from the sun does not reach earth because it is absorbed and re-radiated by the atmosphere. Ozone on its own is responsible for about 25% of that 25%-30%. Hence, there is more back radiation (cooling) if there is more of it. However, Trenberth forgot or never knew about the peroxides and nitrogenous oxides also being formed TOA.
====
Which also relates to what I said above and:
http://climategrog.wordpress.com/?attachment_id=884
http://climategrog.wordpress.com/?attachment_id=955
This layman is tired of models though I understand the need to strive to prefect them in order to try to develop long term forecasts and understand our climate. But for now when it comes to determining global cooling or warming it seems to me the best course for the average guy is to watch the poles.
The second year the summer Arctic and Antarctic sea ice extents remain significantly above the mean during the summer months at each pole then I will start being concerned about cooling. No corruption or “adjustment” of temperature data can change those signs. It seems to me that the satellite measurements of these extents, while not perfect by any means, as has been proven in the past, are still far more reliable and less susceptible to tampering or error than temperature data at any level from any source.
Willis and Leif,
I think that now we have all gotten a pretty good grasp of your difficulties/objections to what David Evans and Jo Nova have done so far.
If David and Jo are as good as their word it will not be long before the full excel-based model is released (including full code and data). At that point both of you will be free to dissect it and/or run it with whatever data-set you choose or prefer. I struggle to see how you will be able to resist that Willis.
Until the release I don’t see how the endless argument conducted above between yourselves and others is going to achieve anything useful.
To Christopher Monckton: I think you are over-reacting. Until the model is released there is not much in what David has said that needs such a vigorous defense. You need to step outside and smell the roses as well.
By the way can I just say that most of those who have been following the series of blog posts by David and Jo seem to be comfortable with the way they are going about it, but still remain properly skeptical of the collection of hypotheses that have been advanced. That is the space that I put myself into at this stage. I look forward to the release of the model out into the wild. Once released there will be plenty of predators ready to rip into it. I hope David has braced himself for the event.
Neutral gas cloud is not at all indifferent.
http://www.srl.caltech.edu/ACE/ACENews/ACENews136.html
I am concerned about the lack of unity among skeptics, as displayed in comments here on this blog.
I have said it before: there is a simple way to determine a causal correlation of weather / warmth between the sun and earth, namely by observing the speed of the drop in temperatures over time.
here you can see my initial results, up until 2012
http://blogs.24.com/henryp/2013/02/21/henrys-pool-tables-on-global-warmingcooling/
For maximum temperatures I [we] have a warming rate of
0.036K/annum from 1974
0.028K/annum from 1980
0.015K/annum from 1990
-0.013K/annum from 2000
I have recently updated my tables to 2014
For maximum temperatures I [we] have a warming rate of
0.034K/annum from 1974
0.025K/annum from 1980
0.014K/annum from 1990
-0.008K/annum from 2000
You can critique me to say that the sample size is small (27 weather stations from each HS) but the downward trend is simply undeniable.
We also see a slight slowing down of the deceleration over the past 2 years.
[don’t be deceived that cooling is already over- we are looking at maximum temperatures – the effect is still coming]
When trying to explain this [to myself]: clearly, we can see some exponential downward trend?
Now look at this graph here:
http://ice-period.com/wp-content/uploads/2013/03/sun2013.png
It shows the field strengths of the sun.
Do you see that you can draw a hyperbolic curve from the top to the bottom and a parabolic curve from the bottom to the top that seems to reach a minimum/maximum around 2016?
Can you see that there is direct correlation with the drop in maximum temperature and the drop in field strengths on the sun?
Hence, I have been saying that decreased solar filed strength causes more of the more energetic particles to be released from the sun which convert to ozone, peroxides and nitrogenous oxides. If the atmosphere did not do this, we’d be dead. However, more ozone, peroxides and nitrogenous oxides TOA deflect more of the incoming SW radiation, especially of the UV type.
Hence the current cooling of the atmosphere and the oceans.
@Monckton, Willis, Leif, etc.
Why do any of you think any TSI is even remotely correct? The actual TSI ranges from neutron flux to atoms, in EM from gammas to radio waves. The last time I tried to estimate it (in the 80s), I couldn’t because the observations just weren’t available. I doubt very much whether our current TSI includes all known output. Why do any of you think one TSI is to die for vs. another TSI? I don’t think the data is there.
HenryP You can see how ozone absorbs ionizing radiation. It is much weaker than in winter.
http://terra2.spacenvironment.net/~raps_ops/current_files/rtimg/dose.15km.png
As the end of month of June is here, for those who wish to use the CET records to prove one thing or the another, just a brief reminder:
June is the month that clearly and indisputable shows that absolutely there was no warming (regardless of the CO2 content or emissions, notch filters, multidecadal natural or any other kind of variability ) for whole of its 350 years, of the longest and the most scrutinized temperature record that there is: http://www.vukcevic.talktalk.net/CET-Jun.htm
Over to you ….
bobl says:
June 28, 2014 at 11:49 pm
While I am making this point Leif, are you claiming the reconstruction David used is wrong for every solar cycle it is trained on
There are three pieces to the puzzle:
1) before 1978, no data, only reconstruction
2) 1978-2002, observations but with systematic errors
3) 2003-2014, observations [SORCE/TIM] that are reliable
One must splice the three pieces together to get a composite covering 1610-2014.
This must be done correctly, but even then one is hostage to the accuracy of piece #1. The Lean [2000] reconstruction is not correct [grossly in error] and the splicing of #3 to #2 is wrong.
Mr Svalgaard continues, embarrassingly, to fail to apologize to Dr Evans for having accused him of having acted near-criminally in deliberately using false TSI data. Instead, he tries to divert attention from his persisting falsehood by a variety of diversionary wriggles. One of the latest of these is his assertion that “The plot on the SORCE/TIM website is not a ‘historical record’, but a flawed reconstruction by Lean dating back to 2000”.
Actually, the reconstruction on the SORCE/TIM website to which I had provided a link was, as I had previously stated, by Krivova et al., though I suppose it is possible she might have relied on Judith Lean’s earlier work, as the IPCC itself has done in the past. I had also previously stated that the record went back some 400 years, not just to 2000 as Mr Svalgard has said. The TSI data on this official website is visibly strikingly similar to the TSI data in Dr Evans’ graph. On looking at the two graphs, there is certainly no respectable basis for Mr Svalgaard’s still-unretracted allegation that in using data remarkably close to that which is openly posted on the website from which Mr Svalgaard himself took (and then doctored) the graph on the basis of which he challenged Dr Evans’ assertion that solar activity had recently been declining.
It is really time for Mr Svalgaard to apologize to Dr Evans for his hasty and unjustifiable allegation that Dr Evans had knowingly used incorrect TSI data, and that in doing so he had acted in a fashion that was “almost fraudulent”. There is no respectable basis for any such allegation, and it must now be withdrawn.
The question whether Dr Evans is right to draw the conclusion from the data that TSI is falling in a manner that will have an effect on global temperature is one on which he may or may not be correct: as I have said earlier in this thread, the matter can be argued either way. But it should be blindingly obvious even to Mr Svalgaard, who is not known for his common sense, that there would scarcely be any advantage to Dr Evans in deliberately tampering with the data so as falsely to show a sharp decline in TSI, then to make a startling prediction that global temperature, far from remaining static as it has for the past couple of decades or rising as the usual suspects predict, will instead fall within not more than ten years, and then to say that if the temperature does not fall he will have been proven wrong.
It ought surely to be blindingly obvious even to the meanest and most knuckle-dragging intelligence that such behavior on Dr Evans’ part could not confer any conceivable advantage upon him. The fact is that Dr Evans did his best to put together a reasonable TSI dataset (close in all material respects to the Krivova historical reconstruction on the SORCE/TIM website); that one can apply his model to that or any other TSI dataset; and that if Mr Svalgaard does not like Dr Evans’ TSI dataset he will be free, within weeks, to apply any other TSI dataset to Dr Evans’ model.
By the same token, Mr Eschenbach should also apologize to Dr Evans. He too has used the word “fraudulent” of Dr Evans, this time because he would have liked Dr Evans to release his code and data before rather than after giving an outline of what his code and data are for. For heaven’s sake, stop whining. You have been plainly told all the code and data will be made fully and publicly available. Surely you can tell the difference between that honest approach and the approach of Mr Mann, who refuses to this day to release data for a paper that first appeared in 1998? If so, why did you accuse Dr Evans of being no better than Mr Mann in this regard?
Now, this bandying-about of the word “fraud”, when it is manifest that no fraud has been committed, is not the sort of language that marks out the man of science. To make an allegation of “fraud” is to suggest that criminality is present – in particular, a form of criminality that, where it is alleged, is calculated to damage the reputation of a man of science, in that the allegation is that the scientist has acted in a wilfully deceptive manner for his own profit or with the aim of causing loss to another. On any view, Dr Evans’ work does not fall within this definition.
Suppose that a group of researchers were to conduct a survey of many thousands of scientific papers to see how many of them stated their endorsement for IPCC’s notion that recent warming was mostly manmade. Suppose they marked their own datafile as saying that only 0.5% of the sample, explicitly endorsed that “consensus” notion. Suppose they then disregarded their own result, carefully failed to report it and instead reported that they had found 97.1% support for the consensus that defined. Suppose they then wrote another scientific paper, explicitly stating that they had found near-unanimous support for the consensus thus defined. Suppose that governments, acting on this supposed evidence of consensus as to the magnitude of Man’s impact on the climate, were to cite it as justification for predatory measures inflicting massive loss or hardship on people struggling to pay their fuel and power bills. Now, in UK law, there are two relevant offenses of fraud: fraud by misrepresentation, and fraud by abuse of the public trust that is expected of academic researchers for whose services taxpayers handsomely pay. I shall leave it to readers to decide whether, if the evidence I have outlined above is true, the group of researchers in question might, on the face of things, have committed fraud.
Now, suppose that a researcher abandons his former highly-paid job profiting from the global warming scam, shuts himself away unpaid for some years and comes up with a theory that, if it is wrong, will be shown to have been wrong within not more than a decade. How will he benefit from that, unless he is shown to have been right? To whom will he occasion any loss, other than to himself, if he is eventually shown to have been wrong? And what evidence is there of any deception? On examination, it turns out that there is none. Mr Svalgaard was simply incorrect in his allegation that Dr Evans had used incorrect TSI data. He might have used data that Mr Svalgaard disapproves of. It may even be that Mr Svalgaard is right to prefer one TSI dataset above another. But Mr Svalgaard has been too hasty in accusing the blameless Dr Evans of acting in an “almost fraudulent” fashion, and has been too dilatory in his persistent failure to apologize: a failure that will prove deeply embarrassing to Mr Svalgaard’s own reputation. For Mr Svalgaard has fallen well below the standard of probity expected of the true scientist.
As for Mr Eschenbach, he too should apologize. His use of the word “fraudulent” seems to have been more rhetorical and en passant than the calculated, deliberate and malicious use of the term by Mr Svalgaard, who accompanied it with an impertinent suggestion that Mr Evans had deliberately used wrong TSI data because he had an “agenda”, and has sullenly refused to apologize, repeating the libel on several occasions and demonstrating with each new libel and each new refusal to apologize and with each new diversionary tactic that he is not a scientist but a mere quack. Mr Eschenbach should appreciate that the use of such intemperate language is unscientific and ought to be avoided except where there is plain evidence of criminality, when, in the present instance, there is plain evidence of no criminality at all.
As for those who think I ought not to have made an issue of this, let them understand that the real battle in which we are all engaged is a battle to restore the use of reason to scientific discourse. At present, the world’s governing class has discovered that, thanks to the near-universal scientific and mathematical ignorance to which generations of State-controlled education has reduced the populace, it can manufacture scientific scare stories as justification for a vast centralization of power in the hands of new supra-national bodies elected by nobody.
In the end, the only defense against the extension of predatory, anti-democratic government to the global scale under the pretext of Saving The Planet is the truth itself. That is why it is essential that we should be careful to discriminate between actions that are genuinely fraudulent and actions that are not. And, though it is not easy to keep one’s temper while so much anti-science is peddled by the profiteers of doom, we should surely keep doing our best to try.
HISTALP long records show about the same thing until they get “corrected”.
Rob R says:
June 29, 2014 at 3:25 am
If David and Jo are as good as their word it will not be long before the full excel-based model is released (including full code and data). At that point both of you will be free to dissect it and/or run it with whatever data-set you choose or prefer.
Regardless of that, the data going in is grossly in error, so what does it matter if we have the code [the correct data we already have]. It matters not one bit.
Rob R says: “Once released there will be plenty of predators ready to rip into it. I hope David has braced himself for the event.”
I think most of the major flaws have already been pointed out. Those are not going to evaporate when the code gets released. They have so far published SEVEN “Big News” threads on this. It’s pretty ridiculous suggesting no one should comment “yet”.
I’m really not that interested in looking at how he coded this mistaken analysis into a spreadsheet.
Hopefully David Evans will be taking advantage of the open science approach he opted for and will be considering how he can address the major issues.
“Rob R” says I should not defend what Dr Evans says until it is made public. But Dr Evans’ TSI graph has been made public; it is transparently similar to the Krivova reconstruction on the SORCE/TIM website that Mr Svalgaard regards as authoritative enough to draw his own data from; and, therefore, Mr Svalgaard’s allegation that Dr Evans has knowingly used incorrect TSI data is demonstrably false.
I do not know enough of the relevant mathematics either to defend or to attack Dr Evans’ method. What I do know, from my many discussions with him during his long and often wearisome years of work on his method, is that he has taken good care to consult experts in all of the relevant fields before going public. As I have said before, it would not be wise to underestimate him. Indeed, his work has been paralleled by many other groups using Fourier analysis on the solar data. Some of them have published their results in the learned journals.
What is new is that he has not only discovered a notch-filter that appears in multiple datasets (and the fact that it appears in so many datasets provoked at least one of the eminent scientists whom he consulted to sit up and take notice); he has also devised a more precise form of Fourier transform, which seems better than most at filtering out the vast quantities of noise in the climate data. In addition to this – which is well above my pay-grade, so I cannot say whether the world of science will adopt it – he has many other interesting surprises and results to come. I suspect that the peculiar savagery of the attacks on him stems from a guess on the part of his attackers that he may have come upon a particular result that they will find as uncongenial as they will find it undeniable. In that guess, they may be right. Time will tell.
In reply to:
lsvalgaard says:
June 28, 2014 at 12:20 pm
William Astley says:
June 28, 2014 at 12:11 pm
The sun will be spotless by late 2013, early 2014.
At late 2013, early 2014 is when we observed the ‘second peak’, with average sunspot numbers around 75. Hardly spotless.
William:
Correction:
Based on observations and a physical model of the solar magnetic cycle, the start of spotless days will occur by late 2014 or early 2015, the sun will be spotless by sometime in 2015. (See current solar)
http://sdo.gsfc.nasa.gov/assets/img/latest/latest_4096_4500.jpg
The prediction the start of spotless days in 2013 was based on observations of the solar northern hemisphere. There were days in 2013/2014 when there were no sunspots in the solar northern hemisphere. The solar southern hemisphere is for some unknown reason lagging the northern hemisphere.
The hypothesis which I have outlined in this forum that the magnetic flux tubes are formed at the solar tachocline is the ‘standard’ solar model. As the magnetic flux tubes are buoyant and there is no physical means to hold them down in the convection zone, the solar specialists proposed that the magnetic flux tubes are formed in the solar tachocline (The tachocline is the name for the region that separates the solar convection zone and the solar radiative zone). The magnetic flux tubes grow (the seed for the magnetic flux tubes is a residue of the sunspots from the last solar cycle) in the tachocline amplified by the rotational difference between the convection zone and the tachocline. When the magnetic field strength of the amplified magnetic flux tube reaches the maximum value for current tachocline conditions they are released. The magnetic flux tube then rise up to the surface of the sun picking up rotational motion from convection motion in the convection zone. The movement and expansion of the magnetic flux tube in the convection zone explains what is observed in the movie Lief showed of a specific large sunspot. The sunspot in the movie moves about in a complex motion as it dissipates the angular moment the expanding magnetic flux tube picked up as it rose up through the convection zone.
The tachocline mechanism explains the butterfly pattern. The seeds require time to be amplified as they move through the tachocline and there is insufficient time for the high latitude regions to form a magnetic flux tube that has sufficient strength to be released (the tachocline may also change by latitude). The tachocline mechanism provides an explanation as to why the solar barycenter motion by the large planets correlates with solar long period changes. The motion and relative change in motion of the sun disturbs the tachocline region (creates oscillations in the tachocline which takes time to dissipate) which affects the release of the magnetic flux tubes. The tachocline mechanism explains why large sunspots are being replaced by pores.
The tachocline mechanism also explains why sunspots will be concentrated in certain regions of the sun and why the sunspot distribution is asymmetrical comparing one side of the sun to the other. The reason for the variance is differences in the tachocline.
Leif has provided no logic or observational evidence for a competing mechanism which he prefers for some unknown reason. Leif has provided no explanation as to why the magnetic field strength of the newly formed sunspots is decaying linearly and has no explanation as to why large sunspots are being replaced by pores.
There was an increase in sunspot numbers as the lagging southern hemisphere produced multi pores rather than large sunspots. As the magnetic field strength of the magnetic flux tubes continues to weaken the flux tubes are being torn apart in the convection zone and there is nothing left to form a pore. What is forming is a large region of high magnetic field strength.
As the solar wind and coronal holes continues to strip magnetic flux off of the sun and there will be no strong concentrated magnetic flux to move down back into the tachocline to form the seed for the next solar magnetic cycle, it appears the solar magnetic cycle has been interrupted and will therefore require a different mechanism to restart.
Observational evidence to support the assertion that the solar magnetic flux tubes are formed at the tachocline and that the solar magnetic cycle has been interrupted would be a spotless sun (before the normal solar minimum) and a gradual reduction of solar large scale magnetic field. Based on current observations the sun will be spotless by sometime in 2015.
Monckton of Brenchley says:
June 29, 2014 at 5:36 am
Rob R says I should not defend what Dr Evans says until it is made public. But Dr Evans’ TSI graph has been made public; it is transparently similar to the Krivova reconstruction on the SORCE/TIM website that Mr Svalgaard regards as authoritative enough to draw his own data from; and, therefore, Mr Svalgaard’s allegation that Dr Evans has knowingly used incorrect TSI data is demonstrably false.
The SORCE/TIM data is correct since 2003 and contradicts Mr Evans demonstrably false assertion that there was a sharp drop in TSI in the 2003-2005 time. On the contrary, TSI is now higher than at any time in the SORCE/TIM record, so Mr Evans has spliced the SORCE/TIM data incorrectly to the observations covering 1978-2002. The ‘data’ before 1978 is not based on observations but on incorrect and obsolete reconstruction. That the 2000 Lean reconstruction is invalid is well-known [even Lean agrees with this] so Mr Evans is either incompetent or deliberately using invalid ‘data’ without having done his due diligence. The Krivova reconstruction suffers from the same problem as Lean’s obsolete one: invoking a background based on the flawed Group Sunspot Number.
In all, it matters not what the code is, the ‘data’ is already so grossly in error that the prediction of a severe drop in temperature is worthless as is also the contention that the model [based on the incorrect data] explains the temperature in the past. As to whether Mr Evans did what he did knowingly, I’ll go with the assumption that he knew what he was doing. If not, then there is even less reason to take him seriously.
William Astley says:
June 28, 2014 at 12:11 pm
“The sun will be spotless by late 2013, early 2014”
William Astley says:
June 29, 2014 at 5:52 am
the sun will be spotless by sometime in 2015.
You sound just like one of those people who predict the end of the world at a certain time, and then when it doesn’t happen, predict yet another future date, and then yet another, etc.
The rest of your comment is nonsense mixed in misunderstood snippets.
I’m sick to death of Willis’ endless repetitions of his bleat about David Evans not yet having released all the data. I’m sick to death of his likening David’s slow release of privately funded data to Mann’s and Jones’ blatant refusal to release their publicly funded data at all. It all sounds like the petulancy of a toddler throwing a tantrum. Having enjoyed so many of Willis’ posts in the past I am quite upset by this. I’m also disappointed in Leif’s responses.
I thought I could enjoy a grown up discussion here. Thank goodness for some of the more thoughtful and gracious posts on here. FWIW…I think the possibilities David is putting forward are fascinating and I await developments with interest; whatever the eventual outcome.
William Astley says
it appears the solar magnetic cycle has been interrupted and will therefore require a different mechanism to restart
Henry says
I am finding your comments interesting. I don’t know much about the processes on the sun but I did figure out that something has to turn back in 2015 or 2016 : did you see my comment here:
http://wattsupwiththat.com/2014/06/28/a-cool-question-answered/#comment-1672201
?
I also determined that such change every 44 years happens always exactly 7 years after direct opposition of Saturn and Uranus
it seems to me you know why? Could you perhaps just clarify that again to me?
I am puzzled about it since the total of the mass of the planets is rather small compared with the sun
Annie says:
June 29, 2014 at 6:20 am
I’m sick to death of his likening David’s slow release of privately funded data to Mann’s and Jones’ blatant refusal to release their publicly funded data at all.
Mr Evans does not have ‘privately funded data’. but [mis]uses publicly available data.
TSI is not important. It is the variation within TSI whereby relatively more energetic particles are released that immediately react with the gases from our atmosphere…
When the sun is brighter, earth gets cooler
When was the peak of the last solar cycle?
Are we at the peak of the current solar cycle?
What is the difference in TSI between those two peaks.
2003 to 2005 is a diversion.
Leif said “We don’t need to wait. As he uses incorrect input the model is already rubbish.”
Once everything is published, you’ll be able to enter your own TSI data into the model and advise us of the results. Until then I’d like to know where you expect temperatures to be in say 2035, pick your own figure and date(s).
Greg said http://s1136.photobucket.com/user/Bartemis/media/tempproject_zps16578eaa.jpg.html?sort=3&o=0
Not unreasonable given a business as usual aproach from that big bright yellow thing in the sky. But business as usual would seem to be an unlikely expectation at present.
The difficulties that people faced during the Dalton and more especially the Maunder, will be very different today. We have central heating, better houses, better clothes, tractors, grain dryers, genetic crop capability, we can build snow removal equipment for farmers if needed and so on. Also we have very prudently and far sightedly boosted the ability of our farmers to grow food for us by adding extra co2 to the atmosphere in time for the expected possible cooling, should it occur, but if it doesn’t then who cares, continued warming will be beneficial, though the CAGW politicians will have destroyed our economies by then.
We might see some population culling here and there, as pensioners within the UK are forced to make an impossible choice between heating and eating for instance, but otherwise I wouldn’t expect a dip in temperatures to have a catastrophic impact, though I would hope that some of the more extreme CAGW fanatics find themselves on the scrap heap.
kadaka (KD Knoebel) says:
June 28, 2014 at 9:43 pm
Kadaka, everyone had been doing so good and you had to go and feed the troll 😉
And as for the big brouhaha between the big heads, I love it. It’s one of the reasons I keep coming back. Big heads with big minds bring about big passion. And a little name-calling never hurt anyone, as long as the discussion continues.
JDN says
http://wattsupwiththat.com/2014/06/28/a-cool-question-answered/#comment-1672210
henry says
Good point actually. I am not sure what measuring sensors can measure everything? Also, the way I understand it, TSI is measured TOA. What we perhaps should measure is irradiation at sea level – no clouds. That will give the information we need.
Monckton of Brenchley says:
June 29, 2014 at 5:16 am
Actually, the reconstruction on the SORCE/TIM website to which I had provided a link was, as I had previously stated, by Krivova et al.
No, not ‘actually’. The SORCE/TIM website used to [up to a few weeks ago] show Lean’s reconstruction. Now the website says:
“This historical TSI reconstruction is based on Wang, Lean, and Sheeley ( “Modeling the Sun’s Magnetic Field and Irradiance Since 1713″, ApJ 625:522-538, 2005 May 20), which was used for solar forcings in the 2007 IPCC estimates.”
So, no Krivova. But all that is irrelevant because Mr Evans claims to have used Lean 2000 as you can see in the upper left corner of his plot: http://jonova.s3.amazonaws.com/evans/graphs/prediction/total-solar-irradiance.gif
I had also previously stated that the record went back some 400 years
There is no ‘record’, only reconstructions.
The TSI data on this official website is visibly strikingly similar to the TSI data in Dr Evans’ graph.
Not at all. You are confused between versions and websites and have not done your homework. Here is an overlay of Mr Evans graph and the current LASP graph http://www.leif.org/research/Monckton-Flaw-1.png not strikingly similar. But all that does not matter, in the upper left-hand corner you can see that Mr Evans used the Lean 2000 reconstruction. If you want to play with the Big Boys, you better get your story straight.
from which Mr Svalgaard himself took (and then doctored) the graph on the basis of which he challenged Dr Evans’ assertion that solar activity had recently been declining.
The graph was produced by me from version 16 of the SORCE/TIM data and not doctored in any way [you here make a serious and libelous accusation – to speak in a language that is not above your pay-grade]. The pink curve is simply the running mean placed to make the run of the blue data curve easier to see: http://www.leif.org/research/TSI-since-2003.png
As for those who think I ought not to have made an issue of this, let them understand that the real battle in which we are all engaged is a battle to restore the use of reason to scientific discourse. At present, the world’s governing class has discovered that, thanks to the near-universal scientific and mathematical ignorance to which generations of State-controlled education has reduced the populace, it can manufacture scientific scare stories as justification for a vast centralization of power in the hands of new supra-national bodies elected by nobody.
And here you display your agenda and bias. The way to win the battle is not [as you advocate] to use bad science and heated, unconsidered rhetoric [viz. you comments], but to ruthlessly weed out attempts to do so [as I have embarked on here]. Time for you to crawl back into your hole. You are hindering the good fight.
Bill Illis says:
June 29, 2014 at 7:05 am
When was the peak of the last solar cycle? about 2000 or 2001
Are we at the peak of the current solar cycle? pretty much
What is the difference in TSI between those two peaks
We don’t know precisely..
2003 to 2005 is a diversion.
Was introduced by Evans as his [flawed] justification for a serious drop in temperature, so thank him.
J Martin says:
June 29, 2014 at 7:08 am
Leif said “We don’t need to wait. As he uses incorrect input the model is already rubbish.”
Once everything is published, you’ll be able to enter your own TSI data into the model and advise us of the results.
Will do, but it doesn’t matter as far as Evans’ claims right now [based on wrong input] are concerned. They are already worthless.
Until then I’d like to know where you expect temperatures to be in say 2035, pick your own figure and date(s).
Have no idea and that should go for everybody else too.
His lordship says:
“What is new is that he has not only discovered a notch-filter that appears in multiple datasets (and the fact that it appears in so many datasets provoked at least one of the eminent scientists whom he consulted to sit up and take notice)”.
That is highly unlikely, much more likely an artifact of his method, showing up on every input. I don’t mean to be rude, but if you get a “notch” every time at the exact frequency (11 years per cycle) of your input then it is a schoolboy and career-ending error not to think “artifact” rather than “physics”.
Monckton of Brenchley says:
……..
Dr. S tends to adjusts extent of required accuracy so as to be able to negate anything that it is not his liking, and this certainly it is not.
Example:
– Dr. S : What you find by mixing oranges and apples is some artificial period which is about the average of 27 and 28.5 days.
– vukcevic: …as an average of 27.85 days is an ‘excellent’ number.
– Dr. S. No, it is misleading and meaningless. Just like saying that the average speed of a man walking and a jet-liner is 300 miles/hour
Dr. S. fortifies his contra argument by comparing difference of less than 1% to one of 10,000%.
At that point, I walked away.
Lord Monckton, your argument is falling on the deaf ears, he has a whole pack of dogs in this race, and is not going to let your one even leave the trap, let alone run, or god forbid win.
David Archibald said “as far as I know, there are only two models with predictive ability that are still in the game – mine and David Evans”
Abdussamatov is perhaps still in the game, but could be falsified quite soon as he predicted cooling from about 2014, Tallbloke, Tim Channon, have produced models that are also still in the game as far as I am aware, I think there are others as well, including the model from the financial statistics world. Pattinson sort of did and said he could perhaps have done more, iirc.
All the GCM / IPCC models produce warming which has been consistently and very visibly falsified for 18 or so years now and so these are not in the game, though they could perhaps re-enter the competition if they took note of actual measured atmospheric moisture content declining trends instead of making assumptions that moisture content is increasing.
Might we get a Greg Goodman projection one day ?
J Martin says:
June 29, 2014 at 8:21 am
Abdussamatov is perhaps still in the game, but could be falsified quite soon as he predicted cooling from about 2014
He has been falsified already. See slide 37 of http://www.leif.org/research/Another-Maunder-Minimum.pdf
cynical scientst said in part June 29, 2014 at 12:07 am:
“…The notch filter idea isn’t that complex. Personally I wish he had avoided the term as it makes people think of it far too concretely. He is using the terminology of signals processing and all he is saying here is that the 11 year frequency in TSI isn’t showing up in the output (temperature)….”
and
“… Even if you simply disconnect the input from the output, you can model that disconnection as a filter. …”
Except for the fact that you should never call a disconnect a “filter”, Cynical is making very good observations and corresponds to one of my major objections voiced variously in the “7-Part + Lubos” posting over at Jo’s site.
Here is my point. If you were to enter a room and find the light bulb NOT glowing, would you suppose that someone had arranged to provide a cancelling current of exactly the right frequency, the right amplitude, and 180 degrees out of phase to cancel an original supply? This would constitute a notch, a (s^2 + 1) Laplace numerator for a transfer function. Or – would you guess first that the switch was off!
J Martin says:
June 29, 2014 at 8:21 am
Abdussamatov is perhaps still in the game, but could be falsified quite soon as he predicted cooling from about 2014
Henry says
here is the thing
despite earth’s capacity to store energy, and use it when required, when you look at energy coming in [through the atmosphere], it is either cooling or warming. There is no middle way.
Hence, you can see from the official data sets [ and from my own] that is was warming until around 2000 and it started cooling from 2002. There is no pause, really. It is globally cooling or globally warming.
http://www.woodfortrees.org/plot/hadcrut4gl/from:1987/to:2015/plot/hadcrut4gl/from:2002/to:2015/trend/plot/hadcrut3gl/from:1987/to:2015/plot/hadcrut3gl/from:2002/to:2015/trend/plot/rss/from:1987/to:2015/plot/rss/from:2002/to:2015/trend/plot/hadsst2gl/from:1987/to:2015/plot/hadsst2gl/from:2002/to:2015/trend/plot/hadcrut4gl/from:1987/to:2002/trend/plot/hadcrut3gl/from:1987/to:2002/trend/plot/hadsst2gl/from:1987/to:2002/trend/plot/rss/from:1987/to:2002/trend
Do you understand that we are globally cooling already?
From HenryP on June 29, 2014 at 3:47 am:
Not quite.
My Proposal to examine a possible solar/terrestrial correlation:
It is said there is a connection between solar activity and terrestrial temperatures, they should rise and fall together, if there is a lagged response then solar activity shall lead. It is recognized the oceans have a significant dampening effect on temperature variations.
Therefore we shall examine three regions presumably more likely to be affected quickly by solar variation: global land-only, North Hemisphere land-only, and the tropics defined as 30°N to 30°S. We are examining rates of annual variations, International SSN to Hadley Center/Met Office temperature indexes, to see if a change in solar activity results in a similar change in terrestrial temperatures.
All charts are from WoodForTrees. Whole years are specified, from 1950 up to 2014, the start date avoiding the pre-1947 (or pre-1945) proposed SSN correction issue. Monthly values are converted to annual by the Compress function. Annual values are converted to annual rates by the Derivative function which yields the first differences. Due to the small temperature variations, the temperature rates are scaled by x200 for clarity.
SSN and CRUTEM4 variance-adj. land global mean:
http://woodfortrees.org/graph/sidc-ssn/from:1950/to:2014/compress:12/derivative/plot/crutem4vgl/from:1950/to:2014/compress:12/derivative/scale:200
Results: There are some large peaks and some large troughs that line up in the same year, but not many. While searching for lag, among the nearby similar large features it is noted either could be leading. There is no clear correlation thus a possible connection is not evident.
There may a correlation in a broad sense, as circa 1965 and the end of data circa 2013 could be minimums of variance variability with a maximum of variance variability possibly circa 1990, the midway point. But there is insufficient data to consider a possible approx. 100 year cycle in variance variability.
SSN and CRUTEM4 variance-adj. land NH mean:
http://woodfortrees.org/graph/sidc-ssn/from:1950/to:2014/compress:12/derivative/plot/crutem4vnh/from:1950/to:2014/compress:12/derivative/scale:200
Results: With its higher percentage of land than the global amount, North Hemisphere should have a more obvious response. Instead it appears there is even less of a possible correlation thus again a possible connection is not evident.
The variance variability similarity is again present, possibly stronger, but the recent minimum could have been circa 2005. Again, insufficient data to determine possible cycle.
SSN and HADCRUT4 tropics (30S-30N) mean:
http://woodfortrees.org/graph/sidc-ssn/from:1950/to:2014/compress:12/derivative/plot/hadcrut4tr/from:1950/to:2014/compress:12/derivative/scale:200
Results: Having higher annual insolation in this region may yield a more noticeable response but it is confounded by the oceans and the frequent cooling effect of precipitation events, namely thunderstorms. There is no obvious matching of similar peaks or troughs, lined up or lagged. A possible variance variability correlation is not obvious. No correlation, no connection.
Conclusions: There are no clear or obvious correlations between the annual rates of solar variation and terrestrial temperatures within the selected time range and regions examined. There may be a correlation of variance variability, larger changes in solar activity yielding larger swings in temperatures. More data is needed to determine the possibility of a multi-decade cycle of solar variance which yields a similar cycle of terrestrial temperature variance.
J Martin says:
June 29, 2014 at 8:21 am
David Archibald said “as far as I know, there are only two models with predictive ability…..
……
J. Martin
David Archibald is wrong.
Here is one more .it is the CET based, it has been mentioned on the WUWT, Climate etc and RealClimate blogs.
The CET is already on the way down, as the graph shows. (see the link)
Extrapolation from only 3 principal components tends to exaggerate some of the min/max values; thus range of 1960-70s temperatures are projected for 2030s, followed by a nearly full recovery some 30 years later.
@kadaka
it seems you did not see the graph from the solar polar fields that I quoted?
I never ever proposed to compare global temperatures (T) or rate of change in global T with SSN, or TSI, for that matter.
Perhaps you should read my comment again?
http://wattsupwiththat.com/2014/06/28/a-cool-question-answered/#comment-1672201
I am finding this diversion proposed by the scholars in this field somewhat puzzling….
This sad story is Politics. Trying to prove a political scam with science
Will not and is not going to work.
Livingston and Penn predicted the sun would be spotless in 2015. Leif is that a cranky prediction? Impossible? Do you have any explanation as to why sunspots are being replaced by pores and what is causing the cycle by cycle drop in the solar polar large magnetic field? It appears we will have a chance to see if Leif can accept defeat gracefully and/or change his mind. The solar magnetic cycle has been interrupted there will be no solar magnetic cycle 25, the planet will cool.
In the past the planet cooled when the sun went in a deep Maunder minimum (Changes in the solar magnetic cycle are the cause of the cyclic warming and cooling that the paleo climatologists call a Dansgaard-Oeschger cycle or a Bond event named after the discoverer(s) of the phenomena). There is already the start of cooling in high latitude regions.
The sea ice anomaly in the Antarctic is the highest in 30 years and has been two sigma higher than the 30 year average for the last 2 years.
http://arctic.atmos.uiuc.edu/cryosphere/IMAGES/seaice.anomaly.antarctic.png
http://arctic.atmos.uiuc.edu/cryosphere/IMAGES/seaice.recent.antarctic.png
The Greenland ice sheet is one of the proxies that records the cyclic warming and cooling that correlates with solar magnetic cycle changes (see the late Gerald Bond’s paper linked to below for details).
http://www.climate4you.com/images/GISP2%20TemperatureSince10700%20BP%20with%20CO2%20from%20EPICA%20DomeC.gif
Greenland ice temperature, last 11,000 years determined from ice core analysis, Richard Alley’s paper.
http://rivernet.ncsu.edu/courselocker/PaleoClimate/Bond%20et%20al.,%201997%20Millenial%20Scale%20Holocene%20Change.pdf
A Pervasive Millennial-Scale Cycle in North Atlantic Holocene and Glacial Climates
https://ams.confex.com/ams/pdfpapers/74103.pdf
Solar Influence on North Atlantic Climate during the Holocene
A more recent oceanographic study, based on reconstructions of the North Atlantic climate during the Holocene epoch, has found what may be the most compelling link between climate and the changing Sun: in this case an apparent regional climatic response to a series of prolonged episodes of suppressed solar activity, like the Maunder Minimum, each lasting from 50 to 150 years8
Each of these cooling events coincides in time with strong, distinctive minima in solar activity, based on contemporaneous records of the production of 14C from tree-ring records and 10Be from deep-sea cores. For reasons cited above, these features, found in both 14C and 10Be records, are of likely solar origin, since the two records are subject to quite different non-solar internal sources of variability. The North Atlantic finding suggests that solar variability exerts a strong effect on climate on centennial to millennial time scales…
There was some discussion at WUWT in February http://wattsupwiththat.com/2014/02/10/historical-and-present-total-solar-irradiance-has-been-tinkered-with-again/ about changes to the reconstruction of TSI on what Mr. Monckton calls the ‘official’ TSI site. At the time the Website said that “This historical reconstruction of TSI is based on that used in the IPCC AR5 Working Group’s Assessment Report and based on TSI reconstructions by Krivova et al. (JGR 2010) and Ball et al. (A&A, 2012).”.
Today, the LASP site says: “This historical TSI reconstruction is based on Wang, Lean, and Sheeley ( “Modeling the Sun’s Magnetic Field and Irradiance Since 1713″, ApJ 625:522-538, 2005 May 20), which was used for solar forcings in the 2007 IPCC estimates.”. It is possible that the website has not been updated or that some clerical error has crept in. This is in a sense irrelevant for the present post since it is clear from his own admission on his graph [and from the curve on the graph] that Mr Evans used Lean 2000, but could be a source of silly bickering so needs to be mentioned. Both reconstructions suffer from the same problem: the use of the flawed Group Sunspot number to provide a varying background. In particular, that leads to an increase of TSI in the first half of the 20th century. And increase not supported by direct measurements of Calcium plages since 1890 and by the influence of the solar wind on the Earth’s geomagnetic field which can be reliably inferred back to 1845. But, again, since Mr Evans used Lean 2000, the problem at the LASP website does not matter.
Leif accused Evans of being almost fraudulent. I quote his words @: “…but by the [almost fraudulent – as there clearly is an agenda here] use of invalid input…”. I do think Leif has legitimately suggested that Evans’ work is affected by an agenda. Evans has been posing his thesis as legitimate in choosing a published data series. However that series is now understood to be questionable, and yet fails to point that out to his readers, which in my book too is “almost fraudulent”. The two choices then are Evans, as an investigator, is plausibly stupid, or is plausibly deceptive.
The good Lord however, flatly accuses Leif of “doctor[ing]”. I quote his words @ –Monckton of Brenchley says: June 29, 2014 at 5:16 am– “from which Mr Svalgaard himself took (and then doctored) the graph on the basis of which he challenged Dr Evans’ assertion”.
The apology is Monckton’s to make.
Just for the heck of it as the SSN does not have the proposed correction, here are the graphs for evaluating variance variability starting in 1850, the start of the Hadley Center/Met Office datasets:
Global:
http://woodfortrees.org/graph/sidc-ssn/from:1850/to:2014/compress:12/derivative/plot/crutem4vgl/from:1850/to:2014/compress:12/derivative/scale:200
The oldest minimum is not circa 1965, that’s a hiccup. It is actually about 1900 for SSN, but 1920 for temperature. My eyeball wants to say there are two sine signals lagged about 20 years, SSN leading, but there is only 1 1/2 cycles of data.
NH:
http://woodfortrees.org/graph/sidc-ssn/from:1850/to:2014/compress:12/derivative/plot/crutem4vnh/from:1850/to:2014/compress:12/derivative/scale:200
Same. Note the great variability coming out of the LIA.
Tropics:
http://woodfortrees.org/graph/sidc-ssn/from:1850/to:2014/compress:12/derivative/plot/hadcrut4tr/from:1850/to:2014/compress:12/derivative/scale:200
Same.
It appears people may have been looking at the wrong things in the wrong direction for too short a time frame. The solar/terrestrial connection apparently is in the rates, with a period of a few centuries, not the results, and definitely not with a period of one or two sunspot cycles. This indicates the Earth has robust temperature regulation. And that the oceans (what else has the heat capacity?) possibly provide a 20 year lag noticeable on land.
More data is needed, perhaps comparing adjusted SSN to CET, and SSN to SST. As greater annual variations can lead to greater weather variations, perhaps evidence could be found there, if we had enough trustworthy weather records.
lsvalgaard says:
June 29, 2014 at 9:41 am
There was some discussion at WUWT in February…
Consulting the original literary shows that the reconstruction shown today at LASP’s website is by Krivova, so the explanation to the graph on what Mr Monckton calls the ‘official website’ is wrong [screen cap]:
http://www.leif.org/research/LASP-Screencap-1014-06-29.png
As I said, this doesn’t matter as Mr Evans used by own admission the obsolete Lean 2000 reconstruction.
From HenryP on June 29, 2014 at 9:16 am:
The dynamite does not care about the match once the fuse has been lit.
–KD Knoebel 2014
@ Leif. I expect you have come across this and wondered what your thoughts on it might be ?
Coupling of Total Solar Irradiance and Solar Magnetic Field Variations with Time Lags: Magneto-thermal Pulsation of the Sun
Yoshimura, H.
in
Solar drivers of the interplanetary and terrestrial disturbances. Astronomical Society of the Pacific Conference Series, Proceedings of the 16th (sixteenth) international workshop National Solar Observatory/Sacramento Peak, Sunspot, New Mexico, USA, 16-20 October 1995, San Francisco: Astronomical Society of the Pacific (ASP), |c1996, edited by K. S. Balasubramaniam, Stephen L. Keil, and Raymond N. Smartt, p.601
Found by SunSword; http://joannenova.com.au/2014/06/big-news-viii-new-solar-model-predicts-imminent-global-cooling/#comment-1496830
This extract by, and comment from David Evans;
““We argue that the time lags between the TSI and magnetic field variations demand us to consider the influences of the Sun on the Earth and on the space environment through two channels which are physically linked together but their variations may not necessarily be in phase in time. One channel is through the irradiance variations and the other is through the magnetic field variations. Tim evolution of a phenomenon on the Earth that is influenced by the Sun can be in phase as well as out of phase with the solar magnetic cycle if this phenomenon is mainly caused by the irradiance variations of the Sun.” – Abstract (at end)
“In practice, since the sunspot number has the longest time interval of observation, we used the sunspot number as the index of the solar magnetic field to be compared with the ERB TSI data. We found that the multiplied correlation index of the two kinds of data has a sharp peak at around 10.3 years of delay time. This sharp peak means that similarity between the time profile of the ERB TSI and the time profile of the sunspot number is the best when the time series of the ERB TSI is displaced toward the past by an amount of about 10.3 years, which is one solar cycle prior to the observed time interval of the ERB data.” (section 8, bottom of page 606)
In other words (I think), he found the TSI leads the sunspot number (which represents the solar magnetic field) by 10.3 years. This hints heavily at force X as we detected it, an influence that lags TSI by 11 years and which is intimately tied to the solar magnetic field.”
William Astley says
The solar magnetic cycle has been interrupted, there will be no solar magnetic cycle 25, the planet will cool.
Henry says
I have been thinking the same thing, in fact I think the solar magnetic poles might switch over again before we can cycle the hill back up again, i.e. increasing solar polar field strengths.
Christopher (Monckton), thanks for your reply to Dr. Svalgaard and myself. You seen strangely unwilling to bite the bullet and admit that (at least according to their graph) they have made a wildly incorrect claim that the TSI has fallen precipitously since about 2004. It is on the basis of this supposed fall that they are predicting falling temperatures.
But as both Dr. Svalgaard and I have both demonstrated, THERE IS NO SUCH FALL IN TSI. And since both he and I are quite familiar with the data, one quick look at the graph was all it took to know that David Evans had made a horrendous mistake, one that totally destroys his claim of falling temperatures.
Now, we have two choices at this point, neither one of them pretty. EITHER Dr. Evans and all of the top scientists that you claim he conferred with are shamefully ignorant of the habits of the sun … OR David Evans has an agenda.
Me, I’ve taken no position on that question, as I prefer not to speculate about motives unless they are plainly apparent from the actions.
Dr. Svalgaard has. He’s unwilling to call David Evans shamefully ignorant. Would you have preferred that he take that path? I suspect that you would have been no more happy about him calling Dr. Evans “shamefully ignorant” than about his use of the word “fraudulent”.
But neither of us owe David Evans an apology. He’s the one that made the horrendous newbie mistake, not us. It would help matters greatly if you came to grips with that fact. We’re just the guys that have demonstrated the laughable error by showing the actual data. And while blaming the messenger has a long and honorable tradition … you sure you want to go down that path?
You go on to say:
and
Actually, Christopher, what I said was:
Show me where in that I have said that I wanted “Dr Evans to release his code and data before rather than after giving an outline of what his code and data.” I said no such thing, I give you the lie direct on that.
I said they should be released at the same time, and I could live with an outline and a delay of one or two posts … but that after eight posts with people begging him to release the data, it was no longer acceptable.
Next, you yourself have accurately described David Evans’ position as being “sure in the knowledge that no one will be able to falsify what he refuses to make available.” Of course, you actually used the words to describe Michael Mann’s position, but David is in exactly the same position for exactly the same reason. No one is able to falsify him because he refuses to make his results available.
So I’m puzzled here … it seems to be OK for you to point out that Michael Mann is acting highly improperly when he holds dialogs “sure in the knowledge that no one will be able to falsify what he refuses to make available” … but when I say the exact same thing about David Evans, you insist that I should apologize to him.
Sauce for the goose is sauce for the gander … so I’ll tell you what, Christopher.
As soon as you publicly apologize to Michael Mann for castigating him for holding dialogs with his scientific opponents while he was sure in the knowledge that no one will be able to falsify what he refuses to make available … at that same time, I will apologize to David Evans for for castigating him for holding dialogs with his scientific opponents while he was sure in the knowledge that no one will be able to falsify what he refuses to make available.
Do we have a deal?
You truly don’t seem to get it, Christopher. We are now up to eight posts where David has been requesting comments on his work, and refusing multiple requests to publish his results … and all the while he is sure in the knowledge that no one will be able to falsify what he has refused to make available.
I find that action to be fraudulent on the part of both Michael Mann and David Evans, although of course YMMV. It is pretending to hold a public scientific discussion while your scientific opponent is prevented from seeing all of the facts … how is that not a fraud?
But heck, if you don’t like “fraudulent”, I retract it entirely. Consider it gone. As Nixon said, “That statement is no longer operative”, I take it back root and branch …
… so in its place, would you suggest I use “deliberately deceptive” to describe David’s actions? Or would you prefer “sneaky and underhanded”? Would “taking a massively unfair advantage” fit the bill? How about “intentionally hobbling his potential detractors”? Hey, I’m open for suggestions … but since you castigate Michael Mann for doing what exactly David is doing, I’m not sure how swapping out negative descriptions changes anything. It is scientific malfeasance of the highest order, no matter who does it.
In any case, let me know when you decide to publicly apologize to Michael Mann, and I’ll join you on the podium …
w.
William Astley says:
June 29, 2014 at 9:25 am
Livingston and Penn predicted the sun would be spotless in 2015. Leif is that a cranky prediction? Impossible?
Based on a short series of observations. A later paper by Livingston, Penn, and Me [ http://www.leif.org/research/Livingston-Penn-Svalgaard.pdf ] revises that ‘prediction’ and does not advocate a spotless unless until the next sunspot minimum [when, indeed, the Sun will be spotless for a while]. The latest plot of Livingston’s data is here http://www.leif.org/research/Livingston%20and%20Penn.png
The solar magnetic cycle has been interrupted there will be no solar magnetic cycle 25, the planet will cool.
The solar magnetic cycle has never been ‘interrupted’ and there will be a cycle 25. Even during the Maunder Minimum, the cycle went on.
J Martin says:
June 29, 2014 at 10:57 am
Leif. I expect you have come across this and wondered what your thoughts on it might be ?
[…] “We argue that the time lags between the TSI and magnetic field variations demand us to consider the influences of the Sun on the Earth and on the space environment through two channels which are physically linked together…”
There is no time lag between TSI and the solar magnetic field so there is no mysterious ‘force’ at work.
Annie says:
June 29, 2014 at 6:20 am
It’s funny how when people agree with me I’m a genius and they enjoy my posts, but when they disagree with me I’m “bleating” and “petulant” …
And I’m sure that Michael Mann and Phil Jones would agree with you, that they are also “sick to death of [my] endless repetitions of [my] bleat about [their] not yet having released all the data” … so what? If you think that I’m going to stop advocating for scientific transparency simply because your health is too delicate for the fight and you are sick to death, think again. You can get as sick as you want, Annie, it will make no difference.
In any case, if you are “sick to death” of my comments, GO READ SOMETHING ELSE. Or read this thread and just skip over my comments … how tough can that be? Because accusing me of being a “toddler throwing a tantrum” is content-free babble. If you have an actual objection to something I said, QUOTE IT and show us where I’m wrong. Otherwise, your comments go directly to the bit bucket as being without substance.
w.
J Martin says:
June 29, 2014 at 7:08 am
Note this carefully, Lord Monckton. Another man secure in the fact that he can’t be falsified because the data hasn’t been released.
In any case, J, it appear you haven’t heard the term “garbage in, garbage out”. Leif and I have both demonstrated, using different reference datasets, that David Evan’s input is garbage. I’ll leave you to do the math as to whether we need to wait to make a judgment on the output …
w.
It was inappropriate for Mr Svalgaard maliciously to accuse Dr Evans of acting in an “almost fraudulent” manner merely because Mr Svalgaard disagreed scientifically with Dr Evans. Mr Svalgaard must stop wriggling and shouting like a small child and apologize, or continue to be regarded by all as a quack.
He says the graph at the SORCE/TIM website that shows the record of TSI reconstructed back some 400 years (not just to the year 2000, as he had previously tried to maintain) was by Lean et al. a few weeks ago and that therefore there is no graph by Krivova et al. at that website. Yet it is there for all to see. And, as his own overlay shows, that graph is strikingly similar to Dr Evans’ graph in all material particulars.
And he may care to enlighten us on why it does not matter that he has fabricated a 27-day-smoothed trend-line on ten times as many days’ non-existent TSI data but regards that doctoring as acceptable. Let him clean up his own scientific act before he starts calling out Dr Evans for being close to fraudulent. No more rests on Dr Evans’ allegedly incorrect choice of dataset than rests on Mr Svalgaard’s dodgy determination of a trend on data that do not exist at all.
Mr Eschenbach continues to condemn Dr Evans before he has seen his work or talked to those specialists who have seen it. Let him be patient until Dr Evans is ready. He will be able to put any TSI or other dataset he likes into Dr Evans’ model: then at least he will have some basis for picking nits.
Monckton of Brenchley says:
June 29, 2014 at 11:24 am
Mr Eschenbach continues to condemn Dr Evans before he has seen his work or talked to those specialists who have seen it.
None of this matters as the old adage ‘garbage in, garbage out’ still rules. Having the code will make it easier to show to you how wrong Mr Evans [and the eminent specialists – who are they? btw] is.
kadaka says
The dynamite does not care about the match once the fuse has been lit.
–KD Knoebel 2014
henry says
Obviously I did do various pairings but found the graph showing the deceleration of warming against the decrease in the solar polar field strengths the most convincing.
Having said all of that, I do not think that we will have catastrophic global cooling. In terms of past time, we are around 1925. So the weather of 2015- 2040 will be the same as 1925-1950. There will be droughts on the great plains from around 2020-2030 and again later. The farmers there would do good to move south.
My wife still laughs at me when I tell her of the drop in global temperature by about 0.2 degrees C since 2000. The difference of the temperature of the various rooms in our house is much, much bigger….
vukcevic says:
June 29, 2014 at 8:08 am
So … you make up a fantasy dialog about what Leif has said, a flight of total imagination … and then you abuse Leif for what he has said in your fantasy dialog?
vuk, all you’ve done with your imaginary dialog is to demonstrate that your fantasies about people are nasty and ugly, but that says nothing at all about Leif … you are a much better man than this. If you object to something Leif said, then QUOTE IT and show us where it’s wrong.
This shabby attempt to stuff your words in Leif’s mouth only proves that your words are repugnant, it says less than nothing about his words …
w.
Bernie Hutchins says:
June 29, 2014 at 8:37 am
Oh, well done that man! As I’ve said from the beginning, a notch does NOT mean that there is a notch filter …
w.
Willis Eschenbach says:
June 29, 2014 at 11:32 am
vuk says: June 29, 2014 at 8:08 am “At that point, I walked away.
The case with vuk is that he claimed that he had shown that the Sun rotated at a 27.87 day rate [or at least the solar wind did]. I pointed out to him that the solar wind exhibits two separate rotation rates: 27 d and 28.5 days which are both present at the same time, but that there was no unified rate of 27.87 days. That number is just an artifact of the mixture of the two real periods. Vuk failed to understand the issue, so I gave him the example of how silly it is to claim that their is any physical reality or entity to the average speed of a walking man and a jetliner. He didn’t get that either and ‘walked away’. Good riddance. Unfortunately he didn’t stay away.
Willis @ 5.25
Thanks Willis.
I do like the way David and Jo are doing this.
Bite sized pieces for the majority of us who do not instinctively understand what this conjecture is.
And I am really enjoying the roll out.
Following it as closely as I can at Jo’s site.
So many comments here, all in a lather.
These are a pleasure to read, far too many take themselves far too seriously.
Time will tell. Even David admits it may all be nonsense, then he invites us to consider a different view.
The picture being painted, a sales job?
Fine with me, I do not see anyone at Jo Nova trying to dictate my life or freedoms.
greg Goodman says:
June 28, 2014 at 12:36 pm
“So we’re due for another super El Nino in 2064 then ? LOL”
It is a little disconcerting to get heckled by someone when you have agreed with them. If you posit a linear system input/output relationship between two variables, and the designated input has a component which the output lacks in any significant degree, you are going to estimate a notch in the resultant transfer function at that component’s frequency. It’s a tautology. Or, at any rate, an equivalence. It’s two ways of saying, there’s something significant in the input which isn’t significant in the output.
Was the 1998 El Nino really a “super” El Nino, or does it tend merely to be more prominent than others because rapidly declining rate of temperature rise boosted the SNR, and made it more prominent than others?
I do not believe that the lack of significant 11 year cycling in the temperature data is due specifically to quasi-linear feedback. I believe it is likely due to modulation of the 11 year-ish heating cycle with ocean mixing cycles due mainly to terrestrial-lunar dynamics, which produces harmonics at something in the neighborhood of 60 years and 5 years.
Additional time lag responses attenuate the shorter period, and the ~60 year oscillation becomes more pronounced, while the ~5 year oscillations are split, much as the SSN data are split near 11 years.
Monckton of Brenchley says:
June 29, 2014 at 11:21 am
It was inappropriate for Mr Svalgaard maliciously to accuse Dr Evans of acting in an “almost fraudulent” manner merely because Mr Svalgaard disagreed scientifically with Dr Evans.
Mr Evans made a horrible mistake [deliberately or out of ignorance – your call] making his prediction worthless; one cannot scientifically disagree with such nonsense. Disagreement requires substance and there is none in Mr Evans’ work.
(not just to the year 2000, as he had previously tried to maintain)
Show me by quoting my exact words on that or admit you are just throwing mud.
there is no graph by Krivova et al. at that website. Yet it is there for all to see.
The website says that the graph is based on Wang et al.
http://www.leif.org/research/LASP-Screencap-2014-06-29.png
I showed by going back to the original sources [what a concept, eh?] that the website is misrepresenting the facts and that, in fact, the graph is by Krivova. But this does not matter as Mr Evans did not use that graph, but, as he admits, used Lean 2000.
And, as his own overlay shows, that graph is strikingly similar to Dr Evans’ graph in all material particulars.
I made that graph to show you that the two graphs are strikingly different. They both suffer from the same problem, though, namely using the flawed Group Sunspot Number as input combined with the erroneous assumption that there is a background of Ephemeral Regions that varies with solar activity, although Hagenaar [2008] has show that there is no such varying background. I go through these details to try to make you understand the issue.
And he may care to enlighten us on why it does not matter that he has fabricated a 27-day-smoothed trend-line on ten times as many days’ non-existent TSI data but regards that doctoring as acceptable.
The 27-day running mean is not a ‘trend line’, and is no ‘doctoring’ at all. The data to look at is the blue curve http://www.leif.org/research/TSI-since-2003.png . Your attempt to throw mud here falls completely flat, but is consistent with your overall modus operandi.
No more rests on Dr Evans’ allegedly incorrect choice of dataset
You are correct that nothing can rest on Mr Evans’ incorrectly doctored dataset.
@ Leif. http://www.leif.org/research/Livingston%20and%20Penn.png
That graph is very interesting it seems pretty clear that it won’t get to 1500 and so sunspots won’t be disappearing in 2022 as previously thought. That’d suggest that solar cycle 25, far from being next to absent might well be much the same as solar cycle 24. So the pause will likely continue, but significant cooling may not take place after all.
On the one hand I was hoping for a steep drop to piss off all the CAGW politicans hell bent on destroying economies, jobs and peoples hopes for their children, not to mention helping the third world get a decent future. But on the other hand would love to see Meditteranean temperatures in the UK, we’ve had close to that when the Romans grew vines up in the North of England.
@ Willis. I don’t have your analytical brain power, or experience in examining graphs and data etc., so I have found the multi post bite sized format about right for me and the limited time I can give it. I’m not sure what all the fuss is about as David’s projection if it comes to pass only takes us back to the temperatures of the seventies. No repeat Dalton or Maunder. Livingston and Penn’s (& Leif’s) latest graph would also suggest the same, assuming one can make such simplistic assumptions, but then the co2 crowd do.
I don’t doubt that David will release everything when he said he will which he repeated in the latest post, so you only have a few days to wait now. I am sure I am not alone in looking forward to your analysis of it all, also Leif will hopefully post on the same subject once he has had a chance to plug his SSN into it, if he isn’t beaten to that by David Evans.
Me, I am neutral. I have no models of my own, I just want reality and the truth. It’s clear that politicians and the CAGW scientists have no understanding of either of those concepts.
I don’t know what will happen. On the one hand I was hoping for a steep drop to piss off all the Catastrophic AGW people, but on the other hand would personally love to see Meditteranean temperatures in the UK. My guess has been that temperatures will go down significantly, but I am becoming slowly less sure of this, especially having seen Leif’s latetst LPL graph. So I guess the best guess might be that we see the ‘pause’ continue for some time to come, with a few wobbles.
Monckton of Brenchley says:
June 29, 2014 at 11:24 am
Lord Monckton, thank you for your comment, but no, sir, that is simply not true. I am not condemning Dr. Evans before I’ve seen his work. I am condemning him for hiding his work and refusing to reveal it despite multiple requests.
And I continue to condemn Dr. Evans for requesting comments and holding scientific discussions while he is secure in the knowledge that no one will be able to falsify what he refuses to make available, which is exactly what you have condemned Michael Mann for.
Next, Dr. Evans has repeatedly requested comments on his work, publishing post after post inviting people to comment on what he little he has revealed of what he has done … and now you want to bust me for commenting on what I can see of what he has done? Really?
How does that work? Are you saying that Dr. Evans was lying when he asked for comments? Or was he just soliciting positive comments, nothing negative need apply, and I didn’t get the memo? He’s spent eight full blog posts, an eternity in internet time, withholding his data while asking people to comment on his work, and when I comment on the small part of it that I can see, I’m the bad guy? Say what?
Finally, while I’m prevented by lack of knowledge from commenting on the work that he has repeatedly refused to reveal, I have condemned him for a part of his work that I have seen, his laughable claim that the TSI plunged precipitously starting in 2003-5. That part is a joke, and yes, I’ve pointed that out in less than laudatory terms … oh, and I’ve commented very negatively on the fact that his model obviously has to contain a very large number of tunable parameters, a failing condemned by none less than John von Neumann. However, I was unable to make a specific objection to the number of tunable parameters for the usual reason—Dr. Evans hasn’t revealed the number of tunable parameters, has he? … but despite that, he’s still soliciting comments on his work.
w.
Willis Eschenbach says:
June 29, 2014 at 11:32 am
……….
Perhaps you should have asked: “Vuk where this dialogue came from?”
I would have answered: “It came from your recent WUWT article: Maunder and Dalton Sunspot Minima
However, no harm done, I hope you would conclude that your statement is no longer operative.
p.s. Dr. S. is sufficiently robust commentator, he is in no need of his defences reinforcement.
I’ve worked on a few very hard to solve problems usually with a team – and typically, there are many ideas about the problem few of which turn out to have been correct. What I’ve found is that the less direct data there is to suggest the exact cause of the problem, then often the stronger the opinion is of the participants about their particular hypothesis. Eventually, when someone comes up with a method of gathering the right data – and that data finally describes the problem correctly, a solution is found and the disagreements are forgotten as well as quite a few incorrect hypothesis But until the right data is gathered, there are usually a wide variety of opinions.
The problem we have is that the climate has seemingly responded to changes in the sun. Seemingly because the relationship is not certain. Nor exactly how it is accomplished is certain either. If the temperature does not respond to the sun, then what causes it to change? Historically, we have had warm and cool periods in the Holocene without changes in CO2 nor can volcanic events be linked to many of the changes. The climate also does not appear to respond in ways that would seem logical to changes in TSI. At least nor immediately. There does not appear to be a linear relationship between TSI and temperature or CO2 and temperature. The proof that CO2 does not have the “logical” impact is simply the fact that the temperature is flat and the vast majority of climate models show increased heat.
My own not so learned view is that David Evans was somewhat maligned. I read David Evans on JoNova a few days ago and had some of the same concerns that Dr. Svalgaard expressed later. However, I felt that we needed to wait to see the entirety of the hypothesis before jumping to conclusions.
It appears that Lord Monckton got very angry at Dr Svalgaard for his apparent maligning of David Evans – I think he was very angry about this and exaggerated the offense. Dr. Svalgaard did the same thing when maligning David Evan’s – exaggerated the problem. David Evans’s point about 2003 was that about that time, based on the TSI chart available most places and used by the IPCC started going down. Dr. Svalgaard took this point in a way that I felt it was clearly not intended. I’m sure though that Dr. Svalgaard did think it was intended that way which is probably the root of the problem. Willis jumped in to support Dr Svalgaard also I think exaggerating what happened. Willis’s position being that he can’t find any such relationship between temperature and changes in solar cycle, TSI and etc., and he does not see a reasonable mathematical relationship based on what David Evans reported so far. The fact that he has not found one though does not mean that there is not some mechanism that will be explained in the future with the right theory and data.
I personally think that in the feedback mechanism for temperature change, what is missing is an understanding of ENSO and changes in the AMO, AO, NAO and etc. and how they fit together with other changes in the sun, CO2 and other factors. This means that a feedback mechanism might not be very linear … But just because the relationship has not yet been described does not mean it does not exist.
lsvalgaard says:
June 29, 2014 at 11:41 am
…..
Reading further on:
Thanks doc for putting out info for Willis.
You do underestimate value of us amateur (/ish, if you wish) enthusiastic researchers, posting our findings and then being in your view qualified as wrong.
– declared wrong, indicates to any of your followers that this was a dead end result.
– alternatively someone may wish to replicate my result and find it correct or wrong and consequently comes to a conclusion.
One way or the other, thanks again, your advice is always welcome, but not necessarily always followed.
Mr Svalgaard, who bafflingly continues to refuse to apologize to Dr Evans, asks where Mr Svalgaard had said the reconstruction by Lean that he says was on the SORCE/TIM website dated back to 2000. Mr Svalgaard’s exact words were: “The plot on the SORCE/TIM website is not a ‘historical record’, but a flawed reconstruction by Lean dating back to 2000.” He will find his own words earlier in this thread.
On the website the record is described as a “historical reconstruction”, it is not by Lean but by Krivova; and it is a 400-year record dating back to 1600. It does begin to look as though Mr Svalgaard has even less basis for his nasty and still unretracted allegation against Dr Evans than before. He should cease his vexatious squirming and apologize to Dr Evans.
And perhaps Mr Svalgaard will let us into the secret of why a “27-day running mean” on data for which approximately 270 days were altogether absent should be regarded as a credible scientific exercise, rather than the doctoring and fabrication that it was. The effect of the tampering was to conceal the missing data beneath, whose absence I only discovered when I went back to the SORCE source. One hopes that the concealment arose by inadvertence or ignorance rather than malice. I shall be referring the matter to an eminent statistician, for I am at a loss to discover any rational basis for calling any such exercise of the imagination a “running mean”, still less a “27-day” one, when there some 270 days’ data missing. And, acting on his advice, I shall consider – in view of the seriousness of the allegation that Mr Svalgaard has made against Dr Evans – whether the fabrication, and the part it played in Mr Svalgaard’s false allegation against Dr Evans, as well as the false allegation itself, should be reported as research misconduct. There are certain minimum standards in scientific discourse, and Mr Svalgaard, here as all too often before, has fallen well below them.
Mr Svalgaard now admits the possibility that Dr Evans used a dataset with which Mr Svalgaard disagrees “out of ignorance”. If that were so, then Mr Svalgaard’s allegation of “almost fraudulent” conduct on Mr Evans’ part was inappropriate. It is unscientific, as well as immature, to accuse Dr Evans of a serious, imprisonable, criminal offense if there is a possibility that he acted out of ignorance. The more likely possibility, of course, is that Mr Svalgaard’s allegation, both in its original form alleging the deliberate use of incorrect data and in its amended form admitting a less criminal possibility, is false and without foundation.
Mr Svalgaard says the graph at the website – and one assumes he means the graph at the URL I had previously provided – was not by Krivova but by Wang et al. No, it was by Krivova. The word “Wang” does not appear on the page anywhere. Here is what the caption on the page at SORCE/TIM actually says:
“These estimated solar irradiances for the last 400 years are based on an historical TSI reconstruction by N. Krivova et al. (see references below), which is used in the IPCC AR5 Working Group I’s Assessment Report. The values from this group’s SATIRE model have been offset a small amount (-0.30 W/m2) for agreement with SORCE/TIM values and replaced by SORCE/TIM annual averages from 2003 onward. The historical reconstruction provided here was computed using TIM V.15 data in February 2014.”
None of the “references below” mentions any Wang. Once again, the facts are altogether at variance with Mr Svalgaard’s constantly-shifting account (first it was Lean, then it was Wang, while in fact it was Krivova all along); and the carelessness with which Mr Svalgaard rushed to make a false, baseless, and nasty allegation against Dr Evans becomes ever more apparent.
Really, it would be more adult if Mr Svalgaard simply accepted that he has gotten far too much far too wrong. He should mind his language in future, and avoid making any further nasty allegations about Dr Evans. And he should not hesitate to apologize for his allegation of near-criminality against Dr Evans. In most British universities, an unfounded and – from the tone of Mr Svalgaard’s remarks throughout this thread – malevolent allegation of dishonesty in scientific research itself constitutes serious research misconduct. One hopes, for Mr Svalgaard’s sake, that he is safely retired.
BobG says:
June 29, 2014 at 12:37 pm
David Evans’s point about 2003 was that about that time, based on the TSI chart available most places and used by the IPCC started going down.
Mr Evans did much more than that, namely stated [and doctored his plot – the hard to see blue dashed line] that since the 2003-2005 timeframe, TSI has dropped by a serious amount up to the present. I simply pointed out that according to the most reliable data we have [SORC/TIM] TSI has not dropped and that it, in fact, is higher now than in 2003-2005. This invalidates his prediction, regardless of what else might be wrong [or right]. That is all.
Dr. Svalgaard took this point in a way that I felt it was clearly not intended.
I will agree that Mr Evans did not intend to have anybody discover his little ‘trick’. [One is reminded of Mann’s ‘Nature Trick’ of Climategate fame].
&
I still do not understand the obsession of everyone with TSI and SSN
where it is obvious that the declining solar polar field strengths are a much better parameter versus declining earthly temperatures.
Anyway, I did answer the cool question:
It is globally cooling
Live with it.
BobG says:
June 29, 2014 at 12:37 pm
David Evans’s point about 2003 was that about that time, based on the TSI chart available most places and used by the IPCC started going down.
Mr Evans did much more than that, namely stated [and doctored his plot – the hard to see blue dashed line] that since the 2003-2005 timeframe, TSI has dropped by a serious amount up to the present. I simply pointed out that according to the most reliable data we have [SORC/TIM] TSI has not dropped and that it, in fact, is higher now than in 2003-2005. This invalidates his prediction, regardless of what else might be wrong [or right]. That is all.
Dr. Svalgaard took this point in a way that I felt it was clearly not intended.
I will agree that Mr Evans did not intend to have anybody discover his little ‘trick’. [One is reminded of Mann’s ‘Nature Trick’ of Climategate fame].
David Archibald says ” “We are well into the 21st century and, as far as I know, there are only two models with predictive ability that are still in the game – mine and David Evans’”
For a forecast of the possible coming cooling based on the 60 and 1000 year quasi- periodicities in the temperature data and using the neutron count- 10 Be data as the best proxy for solar activity see
http://climatesense-norpag.blogspot.com/2013/10/commonsense-climate-science-and.html
and several other posts at http://climatesense-norpag.blogspot.com
There is altogether too much time spent on the short frequency 11 and 22 year cycles. These are really just froth on the lower frequency periodicities
The key periodicity for climate forecasting over humanly significant time scales is the quasi millennial cycle see Figs 4 and 3 at the first link,The question is are we just at, just past or just before a peak . The recent sharp decline in the HMF and increase in the neutron count at the 23/24/ minimum suggests that we are past the peak. Given the +/- 12 year delay in that decline showing up in temperatures we may look for a sharp drop in 2016-17. If this doesn’t occur I would have to rejigger my forecasts.
Reblogged this on The Next Grand Minimum and commented:
David Archibald considers David Evans’ notch-filter model is a big advance in climate science. Validation is coming very soon.
&
and I still have not seen any comment here by dr.Evans
unless I am missing something?
so why argue about anyone having to apologise?
Mr Eschenbach is of course free, in a free country, to comment on the general outline of Dr Evan’s research, though he would be wise, scientifically speaking, to avoid uttering truisms such as “there is a notch filter in white noise” as though they were arguments against Dr Evans’ work. And of course he is entitled to disagree with Dr Evans on whether or not solar activity is in decline.
But it continues to seem unreasonable that he should complain about Dr Evans’ non-disclosure, when Dr Evans has been working for years on making his model as transparent as possible, so that it will be more accessible than any previous model. He will launch it when it is ready, and – rightly – he will not be rushed.
He has very fairly outlined some of the main points in what he has done, to orient those who are interested so that they can start with an understanding of what he is trying to achieve. In the light of the more scientifically sensible comments he has received, he will be amending the code and the data somewhat, as every modeler does. He has plainly stated that it will not be long now before he releases everything. He has plainly stated the form in which the model operates – it is an Excel spreadsheet. As far as disclosure is concerned, then, any court in the land, contrasting his proposed conduct with the demonstrable refusal of Mr Mann to release data relating to the bent “hokey-stick”, would find that if he does what he says he will do he will have set the standard for disclosure.
And, given the extraordinary viciousness of the attacks on him for daring to do his own thinking, for daring to discuss it on his wife’s excellent blog, and for daring to promise disclosure more complete than anything any modeler of the climate has done before, he is taking a remarkable risk with that disclosure. The attitude of bellicose fault-finding that has been all too shamefully evident on this thread goes well beyond the appropriate desire of scientists to verify a new hypothesis and to falsify it if it is wrong. Nevertheless, Dr Evans will not be deterred by all the hate-speech, though he is as baffled as I am that so much of it comes from people who should know better, inferentially out of jealousy. He will make full disclosure anyway. He will take the knocks, as all of us who publish independent scientific research skeptical of the official position in or out of the journals have to take them. Either the world will warm as They say it will, or it will not. My best estimate is that it will not.
Mr Eschenbach’s remarks about Dr Evans’ alleged non-disclosure would be appropriate if Dr Evans had refused to disclose his workings. But Dr Evans is no Mr Mann. He has said he will disclose his workings. So wait and see. Or grow your own model.
Monckton of Brenchley says:
June 29, 2014 at 12:47 pm
Mr Svalgaard’s exact words were: “The plot on the SORCE/TIM website is not a ‘historical record’, but a flawed reconstruction by Lean dating back to 2000.” He will find his own words earlier in this thread.
Assuming English is your Mother Tongue you should have little difficulty understanding this to mean that Lean’s reconstruction dates back to the year 2000, meaning that she made the reconstruction in that year. So, just another attempt to throw mud.
and it is a 400-year record dating back to 1600.
No, it is not a ‘record’, just a flawed reconstruction
The effect of the tampering was to conceal the missing data beneath, whose absence I only discovered when I went back to the SORCE source.
As the blue data curves clearly extends above and below the pink running mean, nobody in his right mind would ever believe otherwise than there simply is no data for that interval. The pink curve does not influence the result in any way http://www.leif.org/research/TSI-since-2003.png
for I am at a loss
Obviously.
Mr Svalgaard now admits the possibility that Dr Evans used a dataset with which Mr Svalgaard disagrees “out of ignorance”. If that were so, then Mr Svalgaard’s allegation of “almost fraudulent” conduct on Mr Evans’ part was inappropriate.
That the possibility exists does not mean that it is plausible. It is possible I win the lottery tomorrow, but not plausible. And I consider it scientific fraud to base a prediction on a false statement. Perhaps your bar is set a lot lower, like “it doesn’t matter if you lie as long as it furthers the cause”.
It is unscientific, as well as immature, to accuse Dr Evans of a serious, imprisonable, criminal offense if there is a possibility that he acted out of ignorance. The more likely possibility, of course, is that Mr Svalgaard’s allegation, both in its original form alleging the deliberate use of incorrect data and in its amended form admitting a less criminal possibility, is false and without foundation.
What a bunch of nonsense. I had originally thought more of you, but now, I must downgrade my opinion.
Mr Svalgaard says the graph at the website – and one assumes he means the graph at the URL I had previously provided – was not by Krivova but by Wang et al.
The website says so. Do your homework. Click on the ‘About’ tab on the website
http://lasp.colorado.edu/lisird/tsi/historical_tsi.html
The word “Wang” does not appear on the page anywhere.
it states: “This historical TSI reconstruction is based on Wang, Lean, and Sheeley ( “Modeling the Sun’s Magnetic Field and Irradiance Since 1713″, ApJ 625:522-538, 2005 May 20), which was used for solar forcings in the 2007 IPCC estimates.”
Now, as I showed, LASP is misrepresenting this fact, which is disappointing.
He should mind his language in future, and avoid making any further nasty allegations about Dr Evans.
Mr Evans [and you for that matter] will be met with what you deserve. As the German proverb says ‘Jedem das Seine’.
Monckton of Brenchley says:
June 29, 2014 at 1:09 pm
desire of scientists to verify a new hypothesis and to falsify it if it is wrong.
The hypothesis does not matter as long as the data used is grossly wrong. Garbage in, garbage out.
Dr Norman Page says:
June 29, 2014 at 12:51 pm
For a forecast of the possible coming cooling based on the 60 and 1000 year quasi- periodicities in the temperature data and using the neutron count- 10 Be data as the best proxy for solar activity …
As I pointed out to you upthread, there is no 1,000 yr cycle:
“In a recent report http://www.nap.edu/openbook.php?record_id=13519&page=17 Muescheler points out that “there is no evidence of sustained periods on the order of 1,000 years of low solar activity in either the 10Be or the 14C record”
Russ Steele says:
June 29, 2014 at 12:52 pm
Reblogged this on The Next Grand Minimum and commented:
David Archibald considers David Evans’ notch-filter model is a big advance in climate science. Validation is coming very soon.
You mean that falsification is coming very soon. Garbage in, garbage out.
Bernie Hutchins clarified: “Here is my point. If you were to enter a room and find the light bulb NOT glowing, would you suppose that someone had arranged to provide a cancelling current of exactly the right frequency, the right amplitude, and 180 degrees out of phase to cancel an original supply?”
…and then also invoke sky radiation in a way that temporarily bent your correction function in a way that once the radiation subsided seemed to make your output plummet in the future.
Fixed link of Leif:
http://www.leif.org/research/LASP-Screencap-2014-06-29.png
He was off by a thousand years.
Someone please help me out here.
I stated up thread that it looked to me like the TSI difference in question is about 1 W/m2. If that is true, what’s all the hubbub about?
NikFromNYC says:
June 29, 2014 at 1:53 pm
Fixed link of Leif:
http://www.leif.org/research/LASP-Screencap-2014-06-29.png
He was off by a thousand years.
Thanks!
Too bad Mr Monckton has not dared click on it.
Tom in Florida says:
June 29, 2014 at 2:05 pm
I stated up thread that it looked to me like the TSI difference in question is about 1 W/m2. If that is true, what’s all the hubbub about?
It is about scientific honesty [or rather lack thereof]
Leif I clearly referred to the 1000 year quasi periodicity in the temperature data. Readers are invited to see see Figs 4 and 3 at
http://climatesense-norpag.blogspot.com/2013/10/commonsense-climate-science-and.html
and judge for themselves.
I use the neutron count mainly to look at the question of where we stand relative to solar activity over the last 3 or 4 cycles and what that may augur for the future.
Mr Svalgaard is using incorrect data. Plainly he has an agenda. The Krivova graph to which I had referred, demonstrating that Dr Evans’ data were remarkably similar and that, therefore, it was inappropriate for Mr Svalgaard to accuse Dr Evans of having deliberately used incorrect data. The Krivova graph, the URL of which I had supplied, is not, repeat not, by Wang et al. No doubt Wang et al. better suits Mr Svalgaard’s attempt to smear Dr Evans with his false allegation of fraudulent use of incorrect data. But who is it that is using incorrect data?
To remind Mr Svalgaard, the URL of the Krivova graph, given by me earlier in this thread, is here:
http://lasp.colorado.edu/home/sorce/data/tsi-data/
There is no reference to Wang et al. anywhere on that page. So Mr Svalgaard appears to have difficulty in reading, because I had specifically referred him to the Krivova graph. He even quotes me on the subject:
“Mr Svalgaard says the graph at the website – and one assumes he means the graph at the URL I had previously provided – was not by Krivova but by Wang et al.”
His response: “The website says so. Do your homework. Click on the ‘About’ tab on the website
http://lasp.colorado.edu/lisird/tsi/historical_tsi.html”
Notice that that is an entirely different URL. And if Mr Svalgaard could not be bothered to do enough homework to check the thread to find the URL, he had only to go to the SORCE website and type in “Krivova plot” and the graph would appear at once. But no.
I agree with vukcevik earlier: Mr Svalgaard is not good at apologizing when – as often – he is caught out not knowing his own subject.
I have given Mr Svalgaard every opportunity to apologize to Dr Evans but he has chosen not to take it. I shall now consult the statistician, verify Mr Svalgaard’s employment status and, if any academic institution is employing him, refer his allegation against Dr Evans to the appropriate authorities as an instance of gross and persisting research misconduct.
Dr Norman Page says:
June 29, 2014 at 2:23 pm
Leif I clearly referred to the 1000 year quasi periodicity in the temperature data.
So you no longer claim they are solar related. Progress!
Just before Climategate an accusation of using old data appeared after Monckton promoted Lindzen’s negative feedback claim on the Glenn Beck show. I was back then still looking for silver bullet debunkings of climate alarm but this development gave me pause. When confronted, Lindzen lamented that all the updates were in the alarmist direction. The updated result was then zero feedback, still falsifying climate models.
http://wattsupwiththat.com/2009/10/30/monckton-on-glenn-beck-video-now-available/#comment-215181
Later I found my silver bullets in old thermometer and tide gauge records that defied both claims of urban heating bias and of global warming alarm, since the trend remained the same in nearly all of those old records up to present. The big nail in the alarmist coffin was the bladeless input data of the latest hockey stick as plotted by Willis. That meant sweeping Mann’s old work under the rug as ancient history no longer worked as a PR move and the climate “science” remains BUSTED as being corrupt as long as those “scientists” remain uncharged with a crime just as Peter Gleick was never charged for brazen identity theft and slanderous document forgery.
This paper referred to on JoNova’s blog seems to add to the picture
http://adsabs.harvard.edu/full/1996ASPC…95..601Y
“”””””…..HenryP says:
June 29, 2014 at 7:30 am
JDN says
http://wattsupwiththat.com/2014/06/28/a-cool-question-answered/#comment-1672210
henry says
Good point actually. I am not sure what measuring sensors can measure everything? Also, the way I understand it, TSI is measured TOA. What we perhaps should measure is irradiation at sea level – no clouds. That will give the information we need…….”””””
Actually what we need is the irradiation at sea level, INCLUDING the clouds. That after all is what planet earth measures, which is why it always gets the Temperature correct.
TSI at TOA is after all not affected by the clouds; that is the input, no matter when and how it may vary.
It is what the cloud cover does to it subsequently , that determines how much energy the earth absorbs.
There is NO practical way to actually monitor, exactly what the earth surface monitors, and sets the Temperature by.
Well actually monitoring the Temperature itself, in a Nyquist legal manner, would allow using that as a proxy for total surface insolation.
But then as we now know, many of the surface Temperatures are just blatantly made up, with not even a thermometer present to take a reading.
“NikfromNYC” is correct: a number of adjustments were made to the ERBE data on the ground that its orbit had deteriorated without anyone having noticed. I was able to draw the adjustments to Dick Lindzen’s attention before he published the first version of his paper, in 2009. Subsequently he was attacked in all directions by the usual suspects. He and his postdoc student, Young-Sang Choi, very carefully revised their calculations and came to precisely the same conclusion as their original paper: there was an appreciable negative feedback in operation, which gave a final climate sensitivity of (best estimate) 0.7 K.
There are, however, many problems with the ERBE and CERES data. A NASA satellite with multi-channel capture capabilities would perhaps have provided confirmation one way or the other, and could well have decided the climate question definitively (probably in Dick’s favour). However, it unaccountably crashed.
Monckton of Brenchley says:
June 29, 2014 at 1:09 pm
I am not “disagreeing with Dr. Evans on whether or not solar activity is in decline”. I am pointing out that his claims of a precipitous post 2003-5 decline are totally contradicted by a couple different sets of observations, so it is obvious that he has made a newbie mistake. There’s no disagreement and no room for discussion. You get your own opinions, but not your own facts. You keep trying to claim that there is some dispute about it, but that’s just your unwillingness to grasp the nettle. He screwed up badly, and neither he, nor you, nor his coterie of tame scientists noticed.
And since his prediction of future cooling is predicated on that newbie mistake, his prediction is also meaningless. You’re welcome to keep trying to spin that, but I fear that even all of your well-known and rightly respected eloquence can’t spin an apple pie out of a cow pie …
And until then, I will continue to point out that he is doing exactly what Michael Mann did, that he is inviting scientific discussion of his claims while at the same time he is, in your exact words, “posturing around the world sure in the knowledge that no one will be able to falsify what he refuses to make available.”
I’m sure you can’t deny that given the reach of his blog he is “posturing around the world”.
And I’m sure you can’t deny that his is “sure in the knowledge that no one will be able to falsify what he refuses to make available”.
And while as you point out that situation might change tomorrow, to date we’ve gone through eight blog posts and discussions of his work all over the web, with me and other people asking and begging him to reveal his data … and to date, he has refused to do so, and has continued the discussion of his work, still sure in the knowledge that no one will be able to falsify what he refuses to make available.
So you agree with me that he has been requesting scientific comments on his unpublished work … and you are busting me for making scientific comments on his unpublished work. Nice.
As to the comment “He has plainly stated the form in which the model operates – it is an Excel spreadsheet” … well, I’ll just leave that as it stands.
This is absolutely preposterous. He refuses to reveal the data, and now you are lauding him for “taking a remarkable risk” when he does publish? Hogwash. If he wanted to take a risk he’d have published long ago. Instead, he has reduced his risk by gathering a coterie of the credulati who will defend him when and if he publishes, since they’ve already decided he’s right, and people do NOT like to admit they were wrong.
Of course it does, because transparent, ethical scientists wouldn’t dream of doing what Dr. Evans did, invite scientific discourse on a new hypothesis while refusing to reveal the data.
Really? You didn’t see this coming? I told him in post 2 that it was happening. You thought that him continuing to withhold his data for six more posts, despite numerous requests that he reveal it, would go swimmingly? Where have you been lately?
The furor arising from his insistence that he has the right to reveal his data when he feels like it and that so far he doesn’t feel like is entirely predictable. The fact that he and you are “baffled” by that outcome just means that you’re still stuck in dinosaur science, and you haven’t made the jump to 2014. In 2014, we don’t trust scientists, whether they say they’re going to stop hiding their data someday real soon, honest, or not. We’ve been burnt too often and too badly to put up with hiding science in any form, regardless of the excuses and promises of future compliance.
Whether scientists say they will do better in future is immaterial. Instead, in 2014 we judge scientists on whether they hide their data in the first place.
And I fear that David Evans has failed badly in that regard, as has Nicola Scafetta, another person you’ve defended for hiding his data. Are you sure you want to be known for defending scientsts who don’t reveal their work? Because you’re working on it …
I find this absolutely stunning. I begged, not asked but begged, Dr. Evans to disclose his workings. He flatly refused to do so to my face, and has repeated the refual since. Your claim that he has not refused to disclose his workings is a measure of your desperation. He has done so, not once, but repeatedly over the course of the last eight posts.
While I’m sure that they are very different as people, to date in this situation I see no difference in their actions. Both have refused to release their work, while at the same time inviting discussion of it and inviting scientific comments on it. No bueno. Might change in future, but that’s been the story for the last eight posts and correspondingly long discussions.
Perhaps you’d be so kind as to point out the difference between that and what Mann did.
Oh, please. Surely this kind of grade-school taunt to “grow my own model” doesn’t pass for science on your planet. We can criticize his model without making our own model, that’s nonsense.
And as to “wait and see”, unfortunately I have no choice but to wait in order to see, because he’s currently hiding his data, so there’s nothing to see … so your admonishment is merely an irritating reminder of his concealment of the important results, code, data, and tests. All you’ve done is to remind us all that there’s nothing to see, he’s hidden it … and most strangely, you’re defending him doing that.
w.
[Off topic. ~mod.]
James Abbott says:
June 28, 2014 at 4:40 pm
“David Archibald’s post is just wishful thinking. When will it start cooling ? Global temperature is unlikely to cool significantly in the short to medium term as there is no physical reason why it should. A major eruption would cause short term cooling, but we don’t know when the next one will be.
He overplays the temperature response to solar variation – and we have little real idea of what future solar cycles will bring.”
With an increase in El Nino frequency and a renewed warm AMO phase, no global temperature will not drop fast, but land temperatures will. As they do in every solar minima. The pattern in Dalton and the Gleissberg minimums was that the coldest run of years ran roughly between the peaks of the first two weak cycles, e.g. 1807-1817 and 1885-1896. Which would suggest that the coldest run of years in this minimum, would run from around 2015/16 to around the maximum of SC 25.
The heliocentric analogues that I use for forecasting already show a very cold run of years from 2016 to 2024 (1837-1845), regardless of whether it is a solar minimum or not. That this falls in the prime time for the coldest period in this solar minimum looks very severe to me. Time will tell.
Leif let’s not bore everyone by rehashing our discussion from an earlier post on this site. I have always derived the periodicities from the temperature data. I do think they are solar related but attribution of the mechanisms while obviously interesting and important is not essential as far as forecasting is concerned .I think the GCR data supports a solar origin – while you don’t think changing solar activity has any effect on climate .I’m happy to agree to disagree.
Leif Svalgaard is a quack? This is known by all? I don’t think so. Maybe a bit blunt at times, but he is consistently blunt.
Off topic?
The graph accompanied the BIG NEWS VIII article at JoNova’s. The only trace of it now is an update that says it has been replaced.
[Reply: This is not a Monckton bashing site. Lord Monckton is a valued contributor who writes regular articles. If you want to go on the attack, there are plenty of blogs available. You just won’t get the site traffic. That concludes this issue. ~mod.]
James Abbott says:
David Archibald’s post is just wishful thinking. When will it start cooling?
Well, the alarmist crowd failed totally to predict what you mistakenly label “the pause”, as if you know when global warming will resume.
But you don’t know that, do you? No one knows when, or if, warming will start again. Therefore, your comment is just wishful thinking.
Tell us, why would you wish climate disaster on the world? Just to be able to say that you were right?
Keep in mind that martyrs die to be right. That would fit in with your religion, no?
Steven Mosher says:
June 28, 2014 at 7:32 am
Looks like the cooling will be within normal bounds.
Therefore it can’t be the sun.
Note the similarity.
The warming we have seen is within normal bounds
Therefore it can’t be the co2
I have to say I’m with Steven Mosher on this one.
I agree with him that neither CO2 nor insolation are drivers of climate change in the direct linear sense.
The correlation of both with temperatures is too poor for that to be feasible.
The hydrosphere-atmosphere system (“climate”) is a dissipative nonlinear heat engine following Prigogine’s nonlinear dissipative thermodynamics. The best model for describing such a system was published in 1962 by Ed Lorenz, “Deterministic Nonperiodic Flow”. It shows that such a chaotic-nonlinear system evolving with NO CHANGE in its system parameters spontaneously changes on all scales. It needs no forcing. It forces itself. Use of the word “forcing” in climate is by people who have not read DNF62 by Lorenz and for that reason are wasting their own and everyone else’s time engaging in climate science.
GO BACK TO SCHOOL. DO NOT PASS GO. DO NOT COLLECT 200. READ DNF62.
http://www.astro.puc.cl/~rparra/tools/PAPERS/lorenz1962.pdf
From HenryP on June 29, 2014 at 9:03 am:
Your WFT call-outs make my eyes shriek in agony that reverberates to my anus.
http://woodfortrees.org/plot/rss/from:1979/to:2014/plot/rss/from:1979/to:2002/trend/plot/rss/from:2002/to:2014/trend/plot/hadcrut4gl/from:1979/to:2014/plot/hadcrut4gl/from:1979/to:2002/trend/plot/hadcrut4gl/from:2002/to:2014/trend/plot/hadsst3gl/from:1979/to:2014/plot/hadsst3gl/from:1979/to:2002/trend/plot/hadsst3gl/from:2002/to:2014/trend/
Whole years for proper trends, from start of satellite record to end of last full year (2013), using the latest versions of Hadley Center products rather than searching for desired trends among the old, only RSS shows a cooling trend worth possible mention, but then RSS diverges to go lower than the surface datasets about 2000.
http://woodfortrees.org/plot/rss/from:1979/to:2014/plot/rss/from:1979/to:2002/trend/plot/rss/from:2002/to:2014/trend/plot/hadcrut4gl/from:1979/to:2014/plot/hadcrut4gl/from:1979/to:2002/trend/plot/hadcrut4gl/from:2002/to:2014/trend/plot/gistemp/from:1979/to:2014/plot/gistemp/from:1979/to:2002/trend/plot/gistemp/from:2002/to:2014/trend/
Where words are many error is not absent.
He who holds his tongue is wise.
If the predicted cooling happens then Evans’ model might be correct.
If it does not happen then it is not correct.
Mr Eschenbach will not believe that Dr Evans proposes to release his data and his code. He is entitled to his belief, but Dr Evans has made it plain to me from the very start that he intends to release his data and his code. I believe him.
Mr Eschenbach also says it is somehow wrong of Dr Evans to outline his ideas in a series of postings before making the code and data available. Well, I’d guess that most people would see nothing at all wrong in that.
Finally, Mr Eschenbach says that Dr Evans is wrong to say a decline in solar irradiance has been going on since around 2003/4 and is likely to continue and is likely to be unusual. I refer him to one Leif Svalgaard’s research page, at http://www.leif.org/research/TSI-Reconstruction-2014.png.
There he will find Mr Svalgaard’s “guess” as to the future course of TSI. If I read the upper graph correctly, the total solar irradiance as inferred from sunspots (the blue trace) will reach its lowest point since 1820 by 2020. And 1820 was the depth of the Dalton Minimum, which, if I recollect correctly, killed one in five in Ireland. Thank goodness for all that nice CO2 keeping us from the worst.
If I’ve seen that revealing TSI projection, then you can bet Dr Evans has seen it too. As I’ve said before, he’s not to be underestimated. Quit the sneering until you’ve seen everything. Not long to wait now. Then there’ll be plenty to have a go at, for it’s a big body of work. Beyond my competence to say whether it’s correct, but at least Dr Evans has done his best to make it so, and he will make corrections where there are mistakes. On the basis of Dr Svalgaard’s own TSI projection, though, Dr Evans can legitimately say – as other solar physicists have been saying to me quietly for years – that the Sun is going quiet on us, and that cooling will be the result.
Dr Evans has done some math that suggests the solar physicists are not necessarily wrong. He has fairly pointed out that until recently the solar and CO2 drivers have been in more or less the same direction. Yes, I know solar activity has been gently declining from its near-grand maximum in 1925-95, centered on 1960, but now, if Mr Svalgaard’s graph is right, it will decline to a new low. And the length of the last solar cycle, so the experts tell me, suggests perhaps several decades of less solar activity. I have no idea whether Dr Svalgaard’s comments here about the incorrectness of such predictions or Dr Svalgaard’s graphs showing a prediction that seems not inconsistent with theirs are correct, and nor, I suspect, does Mr Eschenbach.
As I’ve said to Mr Svalgaard, there is no advantage to Dr Evans in fabricating data as Mr Svalgaard has outrageously persisted in suggesting, in proclaiming a forecast of significant global cooling to come, in stating that his theory will have been falsified if the cooling does not come, and then discovering that the cooling has not come. Dr Evans says what he says because he, like me, has consulted solar physicists who say that they expect cooling; and because his own math appears to confirm that cooling is indeed likely. Events will unfold as they will: but a little more gentleness in this debate would surely be a good idea.
“Phlogiston” demonstrates a concise grasp of the scientific method when he says that if cooling comes Dr Evans may be right, but that if it does not come Dr Evans must be wrong – a point openly and repeatedly made by Dr Evans himself.
Mr Eschenbach is throwing skeptics of “man made global warming” under a bus again, and Lief calling Dr Evans work fraudulent is unbelievable.
Monckton of Brenchley says:
June 29, 2014 at 6:16 pm
Lord Moncton, as much as I hate to say it to a good man and a good friend like you …
QUOTE MY WORDS! YOU HAVE ACCUSED ME OF A POSITION I DO NOT HOLD!
I measure my words with great care, because I know that people are always looking for holes in them, as well they should.
I have never said that I either believe or do not believe Dr. Evans will publish his results. You made that up out of the whole cloth. I neither said it, nor do I hold that position. I find it … well … surprisingly unethical that you would try that on. In any case, I hope it’s the last time. Please don’t try it again, it looks worse for you the second time.
=======================================
With that out of the way, as I said above, the problem is not there in any case. His promise is immaterial.
The problem is not whether or not Evans will release the data at some future date. We don’t judge scientists on that, because by that time they’ve already screwed up.
Instead, we judge scientists on whether they hide the data in the first place, and if not, whether they reveal it as soon as their omission is pointed out to them.
And that is what I said above. I don’t give a rat’s exhaust pipe about his promises, because they are immaterial to his current actions … action which are, in your words, that he continues “posturing around the world sure in the knowledge that no one will be able to falsify what he refuses to make available.”
That’s what he has been doing, that’s what he continues to do despite requests to stop, and that’s what I object to.
And that’s why his promises are immaterial. He’s already done the damage to the discussion. He’s already done the damage to his reputation and yours. He’s already used his unfair advantage to appear to defeat myself and a bunch of others in the discussion. And based on his proven ability to “defeat” his opposition, he’s already gathered a host of people who are obviously ready to defend him whether he’s right or not.
How do I know that last one? Because there are a bunch of people who are already defending him WITHOUT SEEING A SINGLE TEST OF THE MODEL OR A SINGLE RESULT. And since they are willing to take a position on his model BEFORE they know if he’s right, before he’s revealed the code, before they’ve had a single sight of the out-of-sample tests that Jo says are already done … well, obviously David’s been very successful in using his unfair advantage, he’s already gotten those folks primed and ready to defend him whether he’s right or not
Since all of those statements are demonstrably true, since the damage has been done, since he’s unfairly defeated all comers and used his success to gather the troops, you tell me, Christopher—why should I care whether he will or won’t reveal the hidden items.
He started out hiding the data, and has continued to hide it despite many requests to reveal it, he’s used his advantage to blow off signal engineers and defeat all opposition, he’s already assembled the faithful … so his promises about tomorrow don’t mean diddly squat to me, whether he fulfills them or not.
w.
Monckton of Brenchley says:
June 29, 2014 at 2:24 pm
To remind Mr Svalgaard, the URL of the Krivova graph, given by me earlier in this thread, is here: http://lasp.colorado.edu/home/sorce/data/tsi-data/
His response: “The website says so. Do your homework. Click on the ‘About’ tab on the website
http://lasp.colorado.edu/lisird/tsi/historical_tsi.html”
Notice that that is an entirely different URL.
But note that it comes from the very same institution:
http://lasp.colorado.edu/…
So LASP cites two different sources for the graph.
But that doesn’t matter, because Mr Evans admits and informs us that he used neither one of them but the old Lean 2000 reconstruction as you can see in the upper left-hand corner of his graph:
http://jonova.s3.amazonaws.com/evans/graphs/prediction/total-solar-irradiance.gif
“Data sources Lean 2000, SIDC sunspots, PMOD, ACRIM, Composite TSI for Mar 2013 to Dec 2015 assumed as average TSI value from Jul 2012 to Feb 2013, to extedn smoothed curve (dotted line)”
So Mr Evans fabricates out of thin air about 900 days of TSI and tags that to the end of the curve. Perhaps ask your statistician what (s)he thinks of that?
I shall now consult the statistician,
Bring him on. And then don’t forget to come back here and report the name and credentials of the statistician and tell us what his findings were.
verify Mr Svalgaard’s employment status and, if any academic institution is employing him, refer his allegation against Dr Evans to the appropriate authorities as an instance of gross and persisting research misconduct.
Good luck with that. I can’t wait.
Monckton of Brenchley says:
June 29, 2014 at 6:16 pm
Finally, Mr Eschenbach says that Dr Evans is wrong to say a decline in solar irradiance has been going on since around 2003/4 and is likely to continue and is likely to be unusual.
Both Willis and I have shown that Mr Evans invented the decline of TSI since 2003-2005. The actual data shows that TSI instead of declining is now higher than it was in 2003-2005. Therefore Mr Evans’ prediction is already wrong.
As I’ve said to Mr Svalgaard, there is no advantage to Dr Evans in fabricating data as Mr Svalgaard has outrageously persisted in suggesting, in proclaiming a forecast of significant global cooling to come
Of course there is advantage as it ‘helps’ the cause. And the fabrication is a fact as I showed above by Mr Evans’ own words.
Dr Evans says what he says because he, like me, has consulted solar physicists who say that they expect cooling
Which would they be? Are they afraid to stand up and be counted? or are there none? Now, don’t be shy, be honest for a change.
Events will unfold as they will: but a little more gentleness in this debate would surely be a good idea.
This is not a debate, but a vicious attack by you on whistleblowers who dare contradict your Golden Boy when he falters grossly.
“Phlogiston” demonstrates a concise grasp of the scientific method when he says that if cooling comes Dr Evans may be right, but that if it does not come Dr Evans must be wrong – a point openly and repeatedly made by Dr Evans himself
If he turns out to be right, it will be for the wrong reason, as the input on which the prediction is made is wrong from the get-go. So much for having a grasp of the scientific method.
Monckton of Brenchley says:
June 29, 2014 at 6:16 pm
Again, that’s total bullshit. I was and I continue to be unaware that Dr. Evans has made any prediction about the future of the TSI of any kind. So I’m damn sure I never said anything about his alleged prediction of the future direction of the TSI, because I’ve never heard of it.
Your claim is total fantasy. QUOTE MY WORDS, you’ll look a lot less foolish. You are a friend of mine, but I won’t let anyone, friend or enemy, spread that kind of misinformation about what I’ve said.
To be clear, what I said was that he has based his temperature predictions on the false claim that the TSI is falling like a stone … and my statement is verifiably true.
You are correct about part of the statement. I did say that that Dr. Evans is totally wrong when he says, in your words, that there has been a “decline in solar irradiance has been going on since around 2003/4”. That claim is a glaring error, apparent to anyone familiar with the TSI. It is contradicted by the satellite TSI data. It is contradicted by the link you offer to Leif’s page. And it is contradicted by the CERES data. In every one of those datasets, TSI goes UP somewhat from 2004 to the present. The graph presented by Dr. Evans showing TSI falling off a cliff in 2003-5 is a joke. Nothing even remotely resembling that has happened.
Your continued insistence that there is a precipitous recent decline in TSI does great credit to your friendship with David Evans … but it does little credit to your friendship with facts. There was no such decline post 2003-5, instead there was a slight increase. Check the records, my friend, you’re standing on quicksand …
My best regards to you,
w.
Messy science recrystallizes in blissful red but gets written up by bureaucrats devoid of love of math who can only sing in atomic gray by the same old numbers, one two three.
WWND = What Would Napoleon Do?
“Great tragic drama is the school of great men…. Tragedy excites the soul, lifts the heart, can and ought to create heroes.” – Napoleon Bonaparte
“The majority of men are weak, inconstant because of their weakness, seeking gain where possible, and…deserving to be pitied more than hated.” – Napoleon Bonaparte
“The publication of false news is a small means of producing incalculable effects on men whose calculations are not the result of cool heads and who each carries with him the alarms and prejudices of the clique.” – Napoleon Bonaparte
“Jesus should have performed his miracles not in remote parts of Syria…but in a city like Rome, in front of the whole population.” – Napoleon Bonaparte
“A soldier will fight long and hard for a bit of colored ribbon.” – Napoleon Bonaparte
“Subordination may only be the evidence of a strong mind.” – Napoleon Bonaparte
“Learn to listen, and remember that silence is often as effective as a display of knowledge.” – Napoleon Bonaparte
“The fool has a great advantage over an intelligent man he is always content with himself.” – Napoleon Bonaparte
“It is dangerous for people who are not rich to gain too extensive a knowledge of mathematics.” – Napoleon Bonaparte
“There is but one step from the sublime to the ridiculous.” – Napoleon Bonaparte
“Were I obliged to have a religion, I would worship the sun the source of all life the real god of the earth.” – Napoleon Bonaparte
lsvalgaard says:
June 29, 2014 at 8:17 pm
The suns polarity of +/- which drives your ‘dynamo’ theory will soon be at either geographic pole, how long will rotate and remain there?
The flaws in your understanding of polarity and magnetic field behavior is astounding, what are you suppose to be again?
Monckton of Brenchley says:
June 29, 2014 at 6:16 pm
I must admit, even before Leif pointed that out I was much puzzled by the question of the provenance of that data as well, and for the same reason. Regarding that, Leif says:
That quote from the graph itself clearly says that they have invented the data from March of 2013 to December of 2015, which is the 900 days of data that Leif mentions.
Now, I’ve used the word “invented” for that data. The graph itself uses the word “assumed” for that data. And Leif used the word “fabricated” for that data.
I see little difference between the three terms. We could just as well call it “made up” data, or “imaginary” data, what’s the difference? What they themselves say that have done is to add arbitrary numbers to real data, no matter what word you use
So I fear that you claiming that there is “no advantage to Dr Evans” from using “assumed” data makes no sense at all. Absolutely, there must be some advantage, or he wouldn’t have done it, would he?
I mean, it was a deliberate decision to place the invented data in exactly that location, and it was a deliberate decision to use the exact value that they assumed for the invented data … are you saying that David Evans did that for no reason, to no advantage?
If so … why did he do it?
w.
Sparks says:
June 29, 2014 at 8:36 pm
The suns polarity of +/- which drives your ‘dynamo’ theory will soon be at either geographic pole, how long will rotate and remain there?
The flaws in your understanding of polarity and magnetic field behavior is astounding, what are you suppose to be again?
Your comment is totally incoherent. Try again.
Who cares, stop arguing if you want to comment on David’s graph then contact him.
lsvalgaard says:
June 29, 2014 at 8:53 pm
Of course it is, you said so. You’re Leif!
Try this Leif, a 20% reduction of the solar maximum sunspot number after 1945 input into Dr Evans model does not effect the notch, nor does it effect the model output because the notch refers to ZERO sunspot activity.
Like a true engineer, “if in doubt short it out”.. you were saying? incoherent? don’t call Dr Evans work fraudulent.
The release of code and data serves a very important function, proof of honesty.
We know very well what it is like to be held hostage to data of unknown provenance, of questionable sourcing and inscrutable processing.
Does anyone else remember reading how the University of East Anglia’s Climatic Research Unit had apparently tossed out their raw data? Which conveniently barred replication and confirmation, leaving manipulated “data” that went to further processing, and likely still more processing to come, that we must accept on faith.
We are confounded by those withholding info, whose work we are to trust, as they are trustworthy scientists. Yet we complain. There are those who withhold as their work is proprietary and provides them income such as Piers Corbyn. Yet we complain.
For a long time we were told GISTEMP was released, anyone could download and run the code. Which wasn’t exactly true. Thence came the Clear Climate Code project, where for “clarity” they were converting it to Python. And discovered mistakes, headaches, flawed processing. It was a spectacular project. When here on WUWT we would ask for working code, many would pop up and point to CCC as the release of GISTEMP from GISS. I remember reading CCC reported how their code was so good, GISS was supposed to switch over to it.
GISS went to a new version of GISTEMP, hid away the code, CCC couldn’t rewrite to the new version. GISS would have to be trusted or else, CCC went under the bus.
We are told Dr. David Evans will release code and data “in the near future”. But even then, how will we know it is THE info used for his predictions? Archibald says he has a beta of a spreadsheet. What shall Evans really release, with what final tweaks and tunings to “prove” it works, that it will “predict” trends growing more evident with time, and be verified within mere years?
We hold ourselves to higher standards than the opposition. They withhold info, we complain. One of us withholds info, we should complain louder.
We should not accept the honesty of scientists without question, as we have been burned for doing so, multiple times. If Dr. Evans wants our trust, then he should show there is no deception, and release the code and data now.
Sparks says:
June 29, 2014 at 9:13 pm
Try this Leif, a 20% reduction of the solar maximum sunspot number after 1945 input into Dr Evans model does not effect the notch, nor does it effect the model output because the notch refers to ZERO sunspot activity.
Mr Evans’ error is to postulate a [non-existing] sharp drop of TSI from 2003-2005 until now, and based on that he predicts a 0.5 degree drop in temperatures. This has nothing to do with the sunspot number after 1945.
Sparks says:
June 29, 2014 at 9:13 pm
Try this Leif, a 20% reduction of the solar maximum sunspot number after 1945 input into Dr Evans model does not effect the notch, nor does it effect the model output because the notch refers to ZERO sunspot activity.
Then neither would a 30% reduction, or a 50% reduction, or a 70% reduction, or a 90% reduction, or a 100% reduction, right? So Mr Evans’ can predict with no input whatsoever. Is that what you are peddling” or at what percentage does the reduction matter?
lsvalgaard says:
June 29, 2014 at 9:18 pm
Mr Evans used a hypothetical Influence “x”, which can be interpreted as the suns polarity at rest, or when it is moving, both have an influence on earth. you know this to be a correct hypothesis, don’t call an idea “fraudulent” out of spite or for what ever reason!
Correct Leif,
Lets short out all data values, lets study it from ZERO.
Monckton of Brenchley says:
June 29, 2014 at 6:16 pm
As I’ve said to Mr Svalgaard, there is no advantage to Dr Evans in fabricating data
Then why does Mr Evans fabricate data? Even the data he claims is Lean 2000 has been tampered with and doctored into shape. Here are some TSI reconstructions http://www.leif.org/research/Monckton-Flaw-2.png Take a good look at them and don’t be like the cardinals who refused to look through Galileo’s telescope to avoid seeing an inconvenient truth.
What you are seeing [should you have the courage to look] is at the bottom Lean’s original reconstruction from her 2000 paper http://www.leif.org/EOS/Lean2000.pdf . The upper panel shows that reconstruction put on the modern SORCE scale [by subtracting 5.5 W/m2], the black curve. Above that is the Krivova reconstruction in pink, and above that, in dark blue, what is used in Mr Evans’ graph [and called ‘Lean 2000’]. The doctoring consists of removing the varying background, which should not have been there to begin with – so is not necessarily a bad thing, but then it should not be called Lean 2000. The doctoring should have been mentioned up front. As both Krivova and Lean used the flawed Group Sunspot Number [GSN] as input to their reconstruction, all values before about 1885 are too low [because the GSN is too low by about 50%]. The pink and blue curves should be moved up such that all the minima approximately are at the same level.
Sparks says:
June 29, 2014 at 9:37 pm
Mr Evans used a hypothetical Influence “x”, which can be interpreted as the suns polarity at rest, or when it is moving, both have an influence on earth
This is not even a hypothesis, it is just nonsense. I’m sure not even Mr Evans or his sidekick Monckton would subscribe to such nonsense.
From Sparks on June 29, 2014 at 9:45 pm:
That is a valid test of the model. With an input of zero TSI, it should show a very minimal rate of warming.
kadaka (KD Knoebel) says:
June 29, 2014 at 10:09 pm
From Sparks on June 29, 2014 at 9:45 pm:
“Lets short out all data values, lets study it from ZERO”
That is a valid test of the model. With an input of zero TSI, it should show a very minimal rate of warming.
Yes, totally dominated by factor ‘x’.
lsvalgaard says:
June 29, 2014 at 10:04 pm
“Then why does Mr Evans fabricate data?”
He doesn’t fabricate data he is using the available data.
dbstealey says:
June 29, 2014 at 4:31 pm
The untimely death of the late great Dr. Crichton could be proof that there is no God. Or it could be the Creator’s way of saying, all you lesser mortals who thirst after the right path are on your own. The shining light of truth, justice & the way has been snatched from you, so you’re on your own against the forces of darkness.
Sparks says:
June 29, 2014 at 10:17 pm
“Then why does Mr Evans fabricate data?”
He doesn’t fabricate data he is using the available data.
As Willis and I showed upthread:
Willis Eschenbach says: June 29, 2014 at 8:48 pm
Mr Evans does indeed fabricate and invent data. End of discussion.
No Milo, he had cancer, but I agree I loved his books, and he had a science background too.
lsvalgaard says:
June 29, 2014 at 10:08 pm
“This is not even a hypothesis, it is just nonsense. I’m sure not even Mr Evans or his sidekick Monckton would subscribe to such nonsense.”
This is nonsense too you’re just doing a “because I said so” song and dance..
Sparks says:
June 29, 2014 at 10:26 pm
“This is not even a hypothesis, it is just nonsense. I’m sure not even Mr Evans or his sidekick Monckton would subscribe to such nonsense.”
This is nonsense too you’re just doing a “because I said so” song and dance..
Trying to fit in with the rest of you.
bushbunny says:
June 29, 2014 at 10:24 pm
Yes, the good doctor & great gentle giant genius died of lymphoma. Even his many ex-wives didn’t hate him. Were he still with us, the fight against CACA would be easier. Maybe that’s why he was untimely snatched from among us.
lsvalgaard says:
June 29, 2014 at 10:21 pm
“As Willis and I showed upthread:”
You’ve been throwing “Anthropogenic global warming skeptics” under the bus for years, let them speak, let them have a say.
Sparks says:
June 29, 2014 at 10:17 pm
Actually, Dr. Evans himself stated that he made up ~900 days worth of data. See here for confirmation.
w.
lsvalgaard says:
June 29, 2014 at 10:33 pm
This is nonsense too you’re just doing a “because I said so” song and dance..
Leif says: Trying to fit in with the rest of you.
You’re not trying hard enough!
Sparks says:
June 29, 2014 at 10:46 pm
This is nonsense too you’re just doing a “because I said so” song and dance..
Leif says: Trying to fit in with the rest of you.
You’re not trying hard enough!
You are better at producing nonsense than I am.
Anthony, This is senseless bickering again, David Evans is on our side, and all those trolls following this thread, will be rubbing their hands in glee. They’ll use your negative comments to support their arguments not just against individuals but also about the alleged faults in skeptical hypothesis as wrong. Wake up AND CONTACT DAVID.
REPLY: My negative comments? I haven’t commented on this thread nor did I write the article – Anthony
Willis Eschenbach says:
June 29, 2014 at 10:42 pm
“Actually, Dr. Evans himself stated that he made up ~900 days worth of data. See here for confirmation.”
Did Dr. Evans fabricate the data or are you inferring that he did through the data he used?
lsvalgaard says:
June 29, 2014 at 10:49 pm
Sparks says:
June 29, 2014 at 10:46 pm
This is nonsense too you’re just doing a “because I said so” song and dance..
Leif says: Trying to fit in with the rest of you.
You’re not trying hard enough!
You are better at producing nonsense than I am.
It funnier when I said it thank you very much!
*was
Sparks says:
June 29, 2014 at 11:03 pm
Sparks, if you still have questions, let me suggest that you should ask Dr. Evans. I’ve said my piece on the subject, and linked to it above. You are more than welcome to read it again if you are still in mystery about my position, as it is explained quite clearly in that comment.
In addition, you might also read what Leif has said on the subject, as he is also quite clear on the facts.
My best to you, and I hope you find the answer to your question.
w.
Sorry Anthony, it was aimed at other posters not you personally.
bushbunny says:
June 29, 2014 at 8:58 pm
bushbunny, first, you say “who cares”, when I think you actually mean “I don’t care”. However, there are obviously people who do care about honest transparent science, even if you and many others don’t. I’m one of them. There are others. So if you are not interested, that’s fine, just skip the thread.
Second, I started this all out over at JoNova’s by publicly contacting David at the time of his second of what are now eight posts on the subject of his “notch filter” model. I got little response from him, basically he indicated that I should just stop asking questions of him until he published the secret doctrines.
So … I started out by doing what you’ve asked. I contacted him, just as you suggest. Paraphrased, I was told to be a good boy, be quiet, stop asking impertinent questions, and wait for the master to make up his mind to publish.
As you might imagine, I’ve taken a pass on his invitation … except of course for not posting over at his site. I told him then that there was no use in having anything to do with him until he published, so I wouldn’t be bothering him at all until then.
Do you have any more suggestions for me, bushbunny? Because your first one was overtaken by events long before you made the suggestion …
w.
As a layman reading this exchange. I think we can safely retire the Honorific “Dr” from anyone who isn’t a medical Dr, as it is clearly not given any respected by those who carry the title themselves. The attempts to demean, on both sides of this exchange, has been demeaning to both sides. If ever there was an example of wrestling with pigs in mud, the comments to this article has gone there.
I also find it Ironic that the esteemed commentators roundly ignore the two comments of the only polite adult in the room. I guess when you have changed the fabric of society, proved that your strategy was sound, and won a Nobel prize in hard science having proven expertise in the space science arena, no one wants to reply to you during a self destructive flame war.
Willis you suffer from graphamania, and maybe if you read my further comments, you will understand. I don’t like your posts and rarely comment on them because your are an arrogant know all. This distracts from no doubt your ability and scientific contributions. You tend to be rather precious not caring about the political side of AGW, to your chagrin, so long as it doesn’t involve any of your papers or research. I do care about David and his contributions over the years and he shouldn’t be sidelined like you and others have done. So good night, and forever hold your piece.
A Guy Named Jack (@JackHBarnes) says:
OK, I give up … who is this mysterious paragon of virtue with the Nobel prize?
w.
PS—Ever since watching the antics of the unlamented Steven Chu, I piss on Nobel Prizes as any measure of a man’s ability to understand practical subjects. But I am very curious who among the commenters has one, and what it was awarded for.
George.e.schmit says
http://wattsupwiththat.com/2014/06/28/a-cool-question-answered/#comment-1672783
henry says
what I have tried to explain is that the declining solar polar field strengths allow for more of the most energetic type particles to be released from the sun. If they were to hit us directly we would die. So the atmosphere catches these, to form ozone, peroxides and nitrogenous oxides. In its turn more ozone & others deflect more SW radiation to space, when there is more of it, due to absorption and subsequent re-radiation.
To add clouds top this mix as well becomes total chaos in terms of results.
Willis,
I stand to be corrected but, I believe that George Elwood Smith (born May 10, 1930) is an American scientist, applied physicist, and co-inventor of the charge-coupled device. He was awarded a one-quarter share in the 2009 Nobel Prize in Physics for “the invention of an imaging semiconductor circuit—the CCD sensor”. (wiki bio, stating it to be clear and not misleading in advance) attempted to twice join the conversation but sadly he wasn’t forceful enough to gain the attention of such illuminating conversationalist as those involved like yourself while busy mixing mudd.
Jack Barnes
PS It Is the Elwood part of his name that makes me smile, and for a movie almost as funny as some of the exchanges in this thread.
bushbunny says:
June 29, 2014 at 11:46 pm
OK. You don’t like my writing style. Got it. I wasn’t aware you were an authority on style, and I’m the most popular guest author on WUWT, so I must be doing something right … so I fear that anonymous opinions on my writing style are of little interest to me.
One thing I’ve found for sure after writing 500 posts to date … no matter what I write or how I write it, someone will tell me that the way I’ve written it is wrong. This time it’s you. I’m sure you can tell how important that is in my life.
And yet here you are, still reading my comments and commenting on them … conflicted much? If you dislike me, and you dislike my writing style as well, I have no problem with that. Read something else.
Next, dear lady, you suggested that I talk directly to David Evans. I had done so, long before your comment, and gotten no satisfaction. Sorry you don’t like my telling you about that, but you’re the one who made the suggestion.
I fear this makes little sense, and I’m not willing to guess what you mean.
I’m sure you do care about David, and that does you credit. Unfortunately, I do care about transparent science, and he should definitely be sidelined for what he has done in that regard.
However, I fear you overestimate my abilities—it’s far beyond my poor power to sideline anyone. For example, David has paid no attention to me at all. The internet is funny that way … he gets to do what he wants to do, I can’t “sideline” him in any way.
NOR AM I TRYING TO SIDELINE HIM. I’m trying to get him to stop hiding the data, code, tests, and other information. And I’m pointing out scientific problems with his work … but that’s the core of science. Science works because we all find problems in each other’s work. And no, the process is not always full of sweetness and light. I’m sorry you don’t like that, but if so, why are you here?
Because ugly old science, that’s what we do at WUWT—for example, whenever I post something, everyone does their best to poke holes in my scientific claims. And as you might have noticed, often they do so in a most aggressive or unpleasant manner … so what? That’s science, and people are passionate about it.
And I do the same, poking holes in David’s claims. I’d have been nicer about it if he wasn’t taking unfair advantage by refusing to reveal his data, code, tests and all the rest.
Here, people are passionate about things like transparent, honest science, and as a result, we call people on it when they do what David is doing, when they hide their results and refuse to show their data. But that’s just science too.
So if you don’t like that ugly scientific process, bushbunny, go find a knitting blog or something more to your liking, where everyone will always be lovely and nice to each other. This ain’t that place …
Dang, lady, “holding my piece” sounds mondo kinky, but I’ll give it a try …
w.
For what is said hereand promptly disposed of here and here
an astute Frenchman would have advised
A wise man is above any insults which can be thrown at him. The best answer is patience and moderation.
Willis Eschenbach says:
June 30, 2014 at 12:21 am
bushbunny says:
June 29, 2014 at 11:46 pm
Seriously Willis, Can’t you hold your tongue?
Why pick on the commenter “bushbunny”?
There is no reason for your “verbal overkill” and frankly it’s embarrassing!
Life is odd. George E Smith is on this thread trying to be heard, while on twitter tonight I am exchanging comments with Marc Andreessen, who founded Netscape and the WWW browsers as we know them.
Life is short, if you don’t engage, exchange and learn from the process you will never grow. While science is a non stop learning process, I find it ironic that the practitioners of it, feel little to no reason to exercise common courtesy while exchanging between themselves agreements or disagreements.
To be clear, hyperbole is a detraction from facts.
You are missing something. It is well known that climatological variables do not follow the TSI, and the reason is that variation in the TSI is almost entirely in the UV which is absorbed above the tropopause by ozone and oxygen
As Rosanne Roseanandana would say, never mind
A Guy Named Jack (@JackHBarnes) says:
June 30, 2014 at 12:12 am (Edit)
Thanks, Jack. Actually someone did reply to george, but that was all.
As to why Leif and I haven’t responded to george, well, both of us have been under sustained, unrelenting attack by everyone from Lord Monckton to bushbunny and all the other bunnies, both for pointing out David Evans’ newbie error about TSI dropping precipitously, and for pointing out that David Evans is acting just like Michael Mann, hiding his data and code and refusing repeated requests to reveal it.
So we’ve both been picking spitballs off of the wall at a rate of knots, all kinds of ludicrous attacks and improbable claims, complete with total misrepresentations of our positions … and as a result, I fear that george’s contribution didn’t get the attention it may have deserved.
Finally, I did read what george said, and he basically agreed with my hypothesis that the temperature is controlled by clouds and other phenomena … which is good, and is interesting, but other than indirectly it is about 5,000 miles from the topic at hand. So I didn’t respond, as I was focused on the David Evans question.
In any case, welcome to the party, grab a beer and some popcorn …
Regards,
w.
Willis,
Your latest reply to me, is the first I have seen from you on this exchange that made me smile and remember the Willis who makes me smile during your more settled posts. I am a fan of your research, even if I disagree with its approach at times.
I believe your intentional seeking of a single at bat approach to the holy grail in the time series is an intentionally obtuse approach toward proving there is no single smoking gun. Something everyone at this point probably agrees with (one hopes).
It is the intentional, tertiary level engagements that makes one blink.
Best to you and yours, thank you for the thoughtful exchange tonight, and in the past. I believe its been about 5 years since our last conversation.
Sparks says:
June 30, 2014 at 12:35 am
I responded to bushbunny’s suggestion that I should contact David directly. I just re-read it, and I find little to take offense at.
In response, she attacked me for everything under the sun, starting with:
and going on from there … and now I’m the bad guy?
I did not “pick on” bushbunny, sparks. I responded to her rather unpleasant attack.
In any case, she’s a grown woman, and if she doesn’t like what I said, from my history with her I have no doubt that she will say so. I can also assure you that from what I’ve seen of her, she doesn’t need your attempt to be a white knight and ride in and save her from the eeevil Willis, that’s just your last-century assumption.
Truth be told, I kinda like her; near as I can tell she’s tough as nails, she’s a survivor who doesn’t need anyone’s help, and she punches well above her weight class.
So I’m not sure what you’re doing interposing yourself in the middle of the conversation she and I are having—you’re about as useful here as a spare Richard at a wedding …
w.
During the discussion, the global ice reaches the highest state since 1979.
http://arctic.atmos.uiuc.edu/cryosphere/IMAGES/global.daily.ice.area.withtrend.jpg
Ren, the 96 period looks higher in total max, while the height on this date might be a record. Am I missing anything?
A Guy Named Jack (@JackHBarnes) says:
June 30, 2014 at 12:55 am (Edit)
Thanks, Jack. I’m passionate about honest transparent science, and getting attacked for it by skeptics who should be my allies in the fight has cast a shadow on my response. The hypocrisy is staggering.
If I knew what a “single at bat approach to the holy grail in the time series” is when it’s at home, I could respond … but unfortunately, I understand neither the simile nor the subject. What am I missing?
Again, what is an “intentional, tertiary level engagement”? It sounds like international diplomacy, but I doubt that’s what you mean.
My best to you as well,
w.
vukcevic says:
June 30, 2014 at 12:31 am
Vuk, it appears that you are saying that what I thought was imaginary dialog was actually a chopped up bunch of partial quotes from an interchange on another thread, with the subject of the quotes never mentioned by you in this thread.
My apologies for not recognizing it. However, as presented it was an unrecognizable mashup of the original interchange, which had been clipped, chopped, and carefully arranged to show Leif in a bad light … not my idea of an ethical move, but what do I know?
As to whether I should just sit here and let someone insult me, perhaps your un-named Frenchman would do that, but I’ll pass.
The problem is that unless I point out that bogus accusations are untrue, there are a host of lurkers and commenters out there who will not only be more than happy to believe that the false accusations are true … they’ll also think I didn’t respond because I’m too scared to do so or because I’m unable to disprove their allegations.
So I’ll leave the passivity to the French, I hear rumors they’re good at that although I never believe rumors. And you are certainly welcome to follow his advice.
But me, I’ll go on actively and vigorously defending myself from misquotations, misrepresentations, misunderstandings, and outright lies.
All the best, and thanks for the clarification of what you’d written,
w.
Willis,
“I believe your intentional seeking of a single at bat approach to the holy grail in the time series is an intentionally obtuse approach toward proving there is no single smoking gun. Something everyone at this point probably agrees with (one hopes).”
It is my poor mans attempt of saying that you have proven to one and all, there is no single variable in the data time series that can prove causality for what we see in the data. Volcano’s? Check. Sun Spots? Check, post after post, you have torn down the single solution examples people grasp too.
Your methods have been spot on, and illuminating, in most if not all cases. I am only commenting now, because this stream melted down to the point, even I felt compelled to comment.
Best wishes again,
Jack
Willis Eschenbach says:
June 30, 2014 at 1:29 am
…….
a) I do not advise anyone, let alone Mr Willis Eschenbach, how to comment or respond.
In respect of the Moliere’s quote, via an early advise from my grandfather, I myself try to follow whenever possible.
b) My initial comment was addressed to Lord Monckton; the quotes are accurate extracts from a prolong exchange with Dr. S, who is a robust follow, well able to look after himself, as it has been noted, never fails to do so.
I shall leave it at that.
[snip – way over the top -mod]
I’ve been critical of some of the ideas and methods of Davis Evans, but I think he deserves a lot of credit for raising the profile of the sun. Many are now squinting at plots of TSI measurements, trying to decide the trend, and I’m adding it to temperature, ice extent, sea-level and El Nino as one of the key indicators to monitor.
I’m not naming names but we need arrogant SOBs, you probably have to be one to believe that you can spot things that everyone else has missed.
I find it interesting and disappointing that a post such as this has elicited such wrath – both pro and con – from so many who I have come to respect a great deal over a very long time. I consider you all “fellow travelers”, who (I assume) understand that The Scientific Method is the final arbiter. I point to no-one. I point to everyone.
I have been a professional geophysicist for 40 years, and I am definitely no stranger to technical conflict – at times, extremely bitter. But I’ve tried to rule my technical life based on The Scientific Method as best I could for a very long time (in human terms). I failed that goal numerous times. But, of course, no-one is perfect. One thing I do Know is that hurling insults, insinuations, and charges (groundless or not) upon others, and insisting upon a specific response from the accused is not often fruitful.
Please understand that I absolutely do not discount that GIGO may certainly be in play in this specific case, but please take a few deep breaths – ALL OF YOU. Time will tell (I’m referring to the release of data/code/algorithm, not the prediction). The tenors of some of the comments I’ve read seem to belong more appropriately on the realclimate site. And that’s about the worst insult I can imagine.
On the other hand, my wish for all of you is health, happiness, and everlasting sharp, cogent minds.
Greg Goodman said:
It is quite usual for the phase spectrum estimate to be much more difficult than the amplitude spectrum estimate. That is defintely my experience. The explanation is quite simple.
As you say, after the FT, at each frequency is defined the real and imaginanry parts pf a complex number (r,i).
The amplitude at that frequency is:
amplitude(f) = sqrt(r^2 + i^2)
ie it is Pythagoras and is based on summing, which is well behaved in the presence of noise.
The phase at that frequency is:
phase(f) = atan(i/r)
Any ratio calculation in the presence of noise is unstable. Furthermore there are two other factors: its a tangent function so is difficult to unwrap, particularly when there are fast phase shifts with frequency. For David Evan’s case the phase estimate may also be more difficult because the solar cycle length is non-stationary in the time series. I have an idea how you could fix that for the FT….
A Guy Named Jack (@JackHBarnes)
Winter in the south has just started and the trend is clear.
http://www.cpc.ncep.noaa.gov/products/stratosphere/strat-trop/gif_files/time_pres_TEMP_ANOM_ALL_NH_2014.gif
http://www.cpc.ncep.noaa.gov/products/stratosphere/strat-trop/gif_files/time_pres_TEMP_ANOM_ALL_SH_2014.gif
http://arctic.atmos.uiuc.edu/cryosphere/antarctic.sea.ice.interactive.html
Greg and ThinkingScientist:
The phase response of the “notch” cannot be determined because the notch is based on absence of signal, i.e. there is nothing to measure the phase of, a bit of a fatal issue for the hypothesis of a notch IMHO.
The highest jump of sea ice in the Antarctic since 1979, greater even than in 2008.
http://arctic.atmos.uiuc.edu/cryosphere/IMAGES/seaice.anomaly.antarctic.png
We see high a concentration of sea ice in the Arctic Ocean.
http://arctic.atmos.uiuc.edu/cryosphere/IMAGES/seaice.anomaly.antarctic.png
Floyd says
I have been a professional geophysicist for 40 years, and I am definitely no stranger to technical conflict – at times, extremely bitter
Henry says
I agree with your sentiments. My understanding of a blog like this, is [was] that we are all teachers and students to each other. If I ask you a question then you assume the position of teacher and vice versa. The point is that we must at all times remain polite, just as if we were in college or at university\..REMEMBER, WUWT is a public forum. Just like the classroom or the lecture hall, this is not the place to have a bad mood and/or exhibit fits of jealousy or rage. As far as I remember people who could not contain themselves were simply asked to leave the room/hall.
If we just remember to have respect for each other, no matter how dumb the problem or simple the question, then we will both develop and grow and we will continue to be together because of our interest in each other.
Henry
Folks, I am very aware that 10s of thousands of eyes read this blog from the farmer in the dell plowing the field, to the research chair bent over her bunsen burner. If we truly want transparency in research we should all be careful to do two things and remember one:
The to do llist:
1. Speak slowly and thoughtfully, especially if I have no substantial active employment in this science.
2. Challenge vetted proposals, yes, but especially challenge unvetted proposals.
The remember list:
1. Wiser readers than I have been snookered about celestial things.
To the good Lord, I have always had a bit of a glitch with your otherwise wisely communications. The glitch for me has been in your now and again briefly mentioned solar piece when running through the science of climate change. That is not to say that you have not also listed other aspects of this debate that will stand the test of time. In this thread I fear your previously hardly mentioned solar piece has raised its head beyond the well-vetted and decent solar science understanding, thus your communication and behavior here has been to your detriment.
Pamela Gray says:
June 30, 2014 at 6:07 am
To the good Lord […] your communication and behavior here has been to your detriment.
I can second that. Perhaps his admiration for Mr Evans’ unfunded, unselfish, and not-for-financial-gain attempt on notoriety has gotten the better of him. We can all have a bad hair day, so we might hope that Mr Monckton’s behavior will be a but singular occurrence and that he soon will be back on track joining the good fight.
HenryP says:
June 30, 2014 at 5:57 am
……The point is that we must at all times remain polite, just as if we were in college or at university
It hardly likely that discussing a controversial science subject, as often we do, that we will agree, but civility in the exchanges is desirable and far more productive. To expand on the Moliere’s quote above: a wise man has no necessity for resorting to insults, and if subjected to such will not respond in kind.
Sorry.
We see high a concentration of sea ice in the Arctic Ocean.
http://arctic.atmos.uiuc.edu/cryosphere/NEWIMAGES/arctic.seaice.color.004.png
Does the variation in TSI (such as it is) occur at wavelengths that are meaningful to surface temperatures?
claimsguy says:
June 30, 2014 at 7:55 am
Does the variation in TSI (such as it is) occur at wavelengths that are meaningful to surface temperatures?
As TSI encompassed ALL wavelengths it also covers wavelengths that influence the surface temperatures. Now, it is possible, and there have been hints – but no conclusive evidence, that variations at some wavelengths are opposite to [and thus compensate for] variations at other wavelengths such as to produce less variation of the total. We would expect such variations themselves to vary with solar activity, so TSI or the sunspot number or any other indicator of solar activity would also be a proxy for those variations.
Let us summarize. Mr Svalgaard has accused Dr Evans, in increasingly malicious tones, of having acted “almost fraudulently” in that he used a dataset for total solar irradiance that Mr Svalgaard disapproved of. Now, having been informed that his gratuitous accusation of criminality, accompanied by a characteristically vicious allegation that Dr Evans has an “agenda”, has caused offense, he doubles down his nastiness, as he all too often does, by now accusing Dr Evans of seeking notoriety. This matter now passes to the authorities at the university with which Mr Svalgaard is associated, whose policy on good conduct Mr Svalgaard has grievously breached. I am asking the university to intervene with Mr Svalgaard in the hope that he can persuade him to apologize to Dr Evans and to moderate his language in future.
What is the scientific point at issue? There isn’t one. Dr Evans set a cut-off date for his data so that he could get on with other aspects of what is a formidably large project for one person to attempt. One of the reasons why he is not yet quite ready to release his code and data is that he is now updating more than 200 datasets that are or can be linked to the model. He has already made some adjustments to the total-solar-irradiance dataset in the light of comments made long before, and far more politely than, the rude, hate-filled comments of Mr Svalgaard. All of this is made quite plain in his various postings at Joanne Nova’s excellent website.
Mr Svalgaard says he does not think solar activity is in decline. He is entitled to his opinion. But if he will visit the splendid ClimateDepot website he will find an impressive and thorough list of the numerous scientists and groups issuing statements to the effect that they expect some cooling in quite short order, and that the main reason is that solar activity is in a steep decline, which, in Dr Evans’ opinion, became precipitous in 2003/4.
Now, Dr Evans may or may not be right about this, but when he releases his code and data anyone will be able to use any relevant TSI dataset, or perhaps adopt that of Mr Svalgaard on his research page, where his “guess” (that is what he calls it) is that total solar irradiance, as estimated from the sunspot count, will by 2020 reach a low not seen since the Dalton Minimum of 1820, when a fifth of the population of Ireland (to name just one country) died.
As I have said before, there is a general standard of courtesy in scientific debate which – particularly in the climate debate – tends to break down whenever a non-specialist in a given subject dares to say anything about that subject. Scientists do themselves no favors by trying to prevent the layman (in Dr Evans’ instance, a more than usually well informed layman) from taking an intelligent interest in their specialist field. Dr Evans’ model is designed not only to accept the input that he has been using, but to use any suitable input. To dismiss the model as worthless because one input dataset is uncongenial seems to be going rather too far.
Mr Eschenbach, meanwhile, continues to insist that Dr Evans should not have disclosed an outline of his research. He would have preferred him to disclose nothing at all until he was ready. Dr Evans, in the interest of the most rapid possible disclosure, has given a general account of his work ahead of time, for good and sensible reasons. Mr Eschenbach asks where it was that he said he did not believe Dr Evans is intending to release all his code and data when he is ready. Well, on several occasions in this thread, Mr Eschenbach says he is trying to get Dr Evans to release his code and data. Given that Dr Evans has repeatedly said from the get-go that he intends to release his code and data, the only reasonable inference is that Mr Eschenbach does not believe him. For otherwise Mr Eschenbach would find himself in the ludicrous position of arguing, in effect, that Dr Evans had disclosed the outline of his research too early: for that is equivalent to his suggesting that Dr Evans is disclosing the details of his research too late.
To those who say I have done myself no favors by standing up for Dr Evans against some unpleasant, unjustifiable and intemperate criticism, I say that it is better that some of the venom should be redirected at me, so that Dr Evans – and I declare an interest, in that I am proud to be a friend of the family – can concentrate on giving his mighty project a final polish, whereupon those who have adopted preconceived positions before seeing the full detail will have the chance to do their level best to tear down what he has created, crowing and cawing as they try to do so.
To those who assume I am defending Dr Evans’ conclusions before he has published them, I say that I have made it quite clear that much of what he has done is beyond my knowledge, but that the bits I can understand make sense and seem to be right. Dr Evans himself is a quiet and modest man. He has at no stage tried to claim that he and he alone has reached the definitive answer. He has at every stage, first privately and then publicly, said that if his theory is falsified by events or by those pointing out some fundamental flaw in the theory, then that will be that. But at least he has tried, which is more than can be said for some of his unreasoning detractors here.
http://notrickszone.com/2014/06/29/german-geologist-ipcc-models-a-failure-have-no-chance-of-success-sees-possible-0-2c-of-cooling-by-2020/
As they say the moment of truth is upon us. All the contrasting theories are out now the climate going forward will decide who is correct and who is not correct.
I plan on being correct.
REPLY: As history has shown us, even the best laid plans of mice and men can be rendered moot by Nature – Anthony
Monckton of Brenchley says:
June 30, 2014 at 8:23 am
Let us summarize. Mr Svalgaard has accused Dr Evans, in increasingly malicious tones, of having acted “almost fraudulently” in that he used a dataset for total solar irradiance that Mr Svalgaard disapproved of.
The fact is that I and others have pointed out that the assertion by Mr Evans that there has been a sharp drop in TSI from the 2003-2005 time frame to the present is false [and he should have known that] and that therefore his prediction is spurious. This is what I disapprove of. In addition to the fact that Mr Evans has fabricated 900 days of data at the end of the data series. Both of those are serious breaches of scientific propriety.
Eli Rabett says: June 30, 2014 at 12:40 am
You are missing something. It is well known that climatological variables do not follow the TSI, and the reason is that variation in the TSI is almost entirely in the UV which is absorbed above the tropopause by ozone and oxygen
Too bad UV can’t get through the atmosphere, the plants need it to live.
Here is a collection of comments [unbecoming a gentleman] by Mr Evans’ sidekick:
Monckton of Brenchley says:
June 28, 2014 at 2:44 pm
He is a quack, not a scientist. This was not inadvertence on his part: it was plain wickedness. Nothing he ever says again on any scientific subject can or will be taken seriously. He is finished, dead by his own hand.
Monckton of Brenchley says:
June 28, 2014 at 6:16 pm
Mr Svalgaard can no longer be taken seriously as a scientist.
Monckton of Brenchley says:
June 29, 2014 at 12:47 pm
There are certain minimum standards in scientific discourse, and Mr Svalgaard, here as all too often before, has fallen well below them.
Monckton of Brenchley says:
June 29, 2014 at 2:24 pm
Mr Svalgaard is using incorrect data. Plainly he has an agenda.
Monckton of Brenchley says:
June 30, 2014 at 8:23 am
the rude, hate-filled comments of Mr Svalgaard.
I agree Anthony. Still I think opinions are needed if based on research and study as long as the opinion is sincere and one does not make excuses if wrong.
Leif says: “Mr Evans has fabricated 900 days of data at the end of the data series”.
I don’t think there was any fabrication, just the problem of establishing an average TSI for recent years where the averaging “filter” runs out of data to operate on.
Might there also be an “invalid” decline introduced around 2003-2005 in the composite time series from the (presumably linearly tapered) splice of 2 data sets with slightly different calibrations?
NikFromNYC says:
June 29, 2014 at 8:29 pm
…
“Were I obliged to have a religion, I would worship the sun the source of all life the real god of the earth.” – Napoleon Bonaparte
//////////////////////
And that is, of course, precisely what Akenhaten (the father of Tutankhamun) did. This is the earliest recorded example of monotheistic worship, and it threw Eqypt into religous turmoil.
MikeUK says:
June 30, 2014 at 9:23 am
I don’t think there was any fabrication, just the problem of establishing an average TSI for recent years where the averaging “filter” runs out of data to operate on.
When the filter runs out of data the proper thing is not to plot anything beyound that point.
Might there also be an “invalid” decline introduced around 2003-2005 in the composite time series from the (presumably linearly tapered) splice of 2 data sets with slightly different calibrations?
This is irrelevant as no splice is needed for the 2003-2014 SORCE/TIM data.
lsvalgaard says:
June 30, 2014 at 9:04 am
///////////////////
i am sure that most impartial observers would have picked up that there has been name calling by both sides, unbefitting to both.
It makes better reading if everyone sticks to the science. Come on guys.
Kadaka says
Your WFT call-outs make my eyes shriek in agony that reverberates to my anus.
http://woodfortrees.org/plot/rss/from:1979/to:2014/plot/rss/from:1979/to:2002/trend/plot/rss/from:2002/to:2014/trend/plot/hadcrut4gl/from:1979/to:2014/plot/hadcrut4gl/from:1979/to:2002/trend/plot/hadcrut4gl/from:2002/to:2014/trend/plot/hadsst3gl/from:1979/to:2014/plot/hadsst3gl/from:1979/to:2002/trend/plot/hadsst3gl/from:2002/to:2014/trend/
Whole years for proper trends, from start of satellite record to end of last full year ….etc
Henry says
Come on. Perhaps I should explain to you the sun reaches its maximum brightness exactly 7 years after the exact opposition of saturn and ur anus.
Unless you were looking at specific cycles, why not add the half year of data from 2014 that we already have?
True, HADSST3 looks flat from 2002,
http://www.woodfortrees.org/plot/hadcrut4gl/from:1987/to:2015/plot/hadcrut4gl/from:2002/to:2015/trend/plot/hadcrut3gl/from:1987/to:2015/plot/hadcrut3gl/from:2002/to:2015/trend/plot/rss/from:1987/to:2015/plot/rss/from:2002/to:2015/trend/plot/hadsst2gl/from:1987/to:2015/plot/hadsst2gl/from:2002/to:2015/trend/plot/hadcrut4gl/from:1987/to:2002/trend/plot/hadcrut3gl/from:1987/to:2002/trend/plot/hadsst2gl/from:1987/to:2002/trend/plot/rss/from:1987/to:2002/trend/plot/hadsst3gl/from:1987/to:2002/trend/plot/hadsst3gl/from:2002/to:2015/trend
but what, exactly is the difference between HADSST2 and HADSST3?
Anyway, I have another global 3 data sets, compiled by myself, which all show cooling from 2000, namely at a rate of -0.014K/annum since 2000.
I am sure those worried about “global warming” will be pleased with my results.
richard verney says:
June 30, 2014 at 9:29 am
I am sure that most impartial observers would have picked up that there has been name calling by both sides, unbefitting to both.
As an impartial observer could you perhaps compile a list of my escapes into name-calling land. Thanks, it would be most helpful.
Leif
HenryP says:
June 30, 2014 at 9:30 am
Come on. Perhaps I should explain to you the sun reaches its maximum brightness exactly 7 years after the exact opposition of saturn and ur anus.
Nonsense.
Ah jeez Henry P not this uranus crap again…
phlogiston says:
June 29, 2014 at 4:38 pm
Steven Mosher says:
June 28, 2014 at 7:32 am
Looks like the cooling will be within normal bounds.
Therefore it can’t be the sun.
Note the similarity.
The warming we have seen is within normal bounds
Therefore it can’t be the co2
I have to say I’m with Steven Mosher on this one.
I agree with him that neither CO2 nor insolation are drivers of climate change in the direct linear sense.
The correlation of both with temperatures is too poor for that to be feasible….”
//////////////////////////////////////////
What is not often appreciated is that it would not take a substantial drop in temperatures to really throw the cat amongst the pidgeons.
According to the satellite data, we have already todate seen a drop of about 0.1degC since the high of 1998. If there is a further drop of about 0.15degC to 0.18degC between now and say mid to tate 2020s then we would find ourselves in a remarkable position.
If that were to occur (via any mechanism whether solar or otherwise), we would find that the temperature anomaly, according to the satellite data set, would be about the same as it was in 1979.
This would mean that over the entire period of the satellite data set, say by then just under 50 years, there would have been no measured warming.
This would be remarkable since in that time (assuming a BAU emission scenario) about 805 of all manmade emiisions (ie. emissions from 1979 through to late 2020s) would have occured and during all of that there would be no measured increase in temperature assessed by our most sophisticated and advanced temperature measurement devices.
If that were to come to pass (and I am not predicting the future) it would make the case for AGW very difficult indeed.
So we are not talking about the need to see huge drops in temperature, but rather quite a modest drop of about 0.12degC per decade (may be a little more) for a period of about 12 years (may be a little longer), and the case for AGW, in the light of observational evidence, would be very difficult.
So we may get to see, in the not too distance future.
@Anthony
that was funny!
leif says
claimsguy says:
June 30, 2014 at 7:55 am
Does the variation in TSI (such as it is) occur at wavelengths that are meaningful to surface temperatures?
As TSI encompassed ALL wavelengths it also covers wavelengths that influence the surface temperatures. Now, it is possible, and there have been hints – but no conclusive evidence, that variations at some wavelengths are opposite to [and thus compensate for] variations at other wavelengths such as to produce less variation of the total. We would expect such variations themselves to vary with solar activity, so TSI or the sunspot number or any other indicator of solar activity would also be a proxy for those variations.
henry@leif
it seems to me that you have changed your position on this….which is good. You know or are beginning to realize what is happening TOA. Paradoxically, earth is getting cooler, when the sun is getting brighter.
FYI
according to me the sun is more brighter now here, as seen in South Africa, more white than I have ever seen it before. It is full winter and the rays are still burning me on my head; I have to wear a hat during my midday walk with the dogs.
There are some typos in my recent post, the most noteworthy being “805” which should have read “80%”, ie.,
“This would be remarkable since in that time (assuming a BAU emission scenario) about 80% of all manmade emissions…..
I think the biggest issue here was that Monckton took issue with the word “fraudulent.” He is not an American so maybe he is unaware that “fraudulent” has other meanings (in America, don’t know about Mother England) meanings other than fraud for financial gain. I’ve read this entire thread, top to bottom, was following it from the moment the article was first posted. When the first time “fraudulent” was used, the context I garnered was more like “cock up” or “bunkum” or “sheesh what a mess this is.” I was shocked at Monckton’s reaction and why he kept coming back again and again about “fraudulent.” Then it hit me. Monckton’s definition of fraudulent is perhaps different than what was initially intended? He has mentioned he is close with Dr. Evans and his family. No wonder the bristles. And certainly no slight towards Lord Monckton when I make the “not an American” comment. I have nothing but respect (and heritage) in regards to the British Isles and their peoples. And their wonderful language of which I am an admitted hack.
Bottom line, all three parties have acted much like they have all along. Svalgaard made a blunt observation, Monckton took offense, Eschenbach came in with his usual wordy defenses, then none was willing to back down. I think the only reason people are freaked out is because the three of these men went at each other, and did so publicly. Me? I wasn’t shocked in the least. Some of the most opinionated firebrands I have ever met were men involved in the sciences. I remember well the fiery flame wars that went on in Usenet groups back in the day: alt.insert-topic-here or sci.whatever. Holy cow, there were flames flying for years on end, back and forth, threads like this one that lasted for years. It was often surprising to discover that the arguers were quite friendly towards one another outside their given rants; many times they worked at competing universities. So maybe folks are simply unused to seeing men get really passionate and really have a go at one another. Duh.
For the record, hands down, the most well written articles at WUWT are by both Mr. Eschenbach and Lord Monckton (I mean IMHO). I say this because there were outside statements that seemed to impugn and disparage this fact (at least where Mr. Eschenbach was concerned). They are both wonderfully enjoyable to read, reflecting excellent grammar, rich and compelling styles with knowledge of the topic. I admit that I am no scientist, but I have had deep interest in many things under the sun. Because of WUWT I now know about feedbacks, negative feedbacks, and now notches? Hoo boy, gonna have to get busy and find out what the heck notches are. But that’s it. This is most certainly an educational blog. I will never grasp all the bigger stuff, but I am certainly building a core understanding of the basics, and that makes me a powerful witness when discussing “Global Warming” with others who rely on the television for their info.
So, thanks for taking me back to the good ol’ days! A trip down memory lane. See you at alt.abortion.religion.politics.science and we can all have a big time.
HenryP says:
June 30, 2014 at 9:57 am
it seems to me that you have changed your position on this….which is good. You know or are beginning to realize what is happening TOA.
No, that is a misrepresentation. The fact is that the variations of UV [which have attracted the most attention in some circles] are still a small fraction [about 1/7] of the variation of TSI in terms of energy. The variation of the UV follows the solar cycle faithfully, as you can see here: http://lasp.colorado.edu/lisird/lya/ or here http://lasp.colorado.edu/lisird/mgii/ and so also follows the overall variation of TSI.
Gary says:
June 30, 2014 at 10:17 am
I’m an American who went to grad school in England. I never noticed a difference in usage or understanding of “fraudulent” between the US & UK. The OED definitions are similar to those in American dictionaries:
“Obtained, done by, or involving deception, especially criminal deception: (eg) fraudulent share dealing”
“Unjustifiably claiming or being credited with particular accomplishments or qualities: (eg) fraudulent psychics”
leif says
http://wattsupwiththat.com/2014/06/28/a-cool-question-answered/#comment-1673355
henry says
your graphs do not show me the variation in the UV wavelength range of particles that never ever reaches earth because these photons react with the oxygen, nitrogen and water TOA
HenryP says:
June 30, 2014 at 10:59 am
your graphs do not show me the variation in the UV wavelength range of particles that never ever reaches earth because these photons react with the oxygen,
Look up what the wavelength of the Lyman-alpha radiation, and UV is not ‘particles’.
I have read this entire thread. !
Thank you George E Smith for elucidating known-unknowns
Thank you cynical_scientist for constructive criticism.
Bucket o’ hubris for Eschenbach, lsvalgaard & Monckton.
T.A.G.H.L.A.Y!
milodonharlani says:
June 30, 2014 at 10:50 am
“Obtained, done by, or involving deception
Seems to apply in this case. ‘almost fraudulent’ = ‘almost deceptive’
But as the saying goes: “never ascribe to malice what can be explained by stupidity”
@leif
well, well, in order get the cool question answered, at least won’t you enlighten us with your theory as to why earth is currently cooling?
HenryP says:
June 30, 2014 at 11:32 am
well, well, in order get the cool question answered, at least won’t you enlighten us with your theory as to why earth is currently cooling?
There is no good evidence that it is. Oh wait, today was cooler than yesterday, sorry.
Monckton of Brenchley says:
June 30, 2014 at 8:23 am
“Let us summarize. ”
———————————————————————————————————————–
Your “summary” of course omits that it was YOU who first started the personal insults by referring to a person who has earned the designation of PhD as “Mr”. Since you know who Dr Svalgaard is the only reason for the deliberate and continued use of it is to attempt an insult. Apparently your childish emotions got the better of you. Here is your first post on this thread:
Monckton of Brenchley says:
June 28, 2014 at 11:16 am
“Mr Svalgaard should beware …”
And was it not you who made the following insults:
Monckton of Brenchley says:
June 28, 2014 at 2:44 pm
“He is a quack, not a scientist.”
Monckton of Brenchley says:
June 28, 2014 at 6:16 pm
“Mr Svalgaard can no longer be taken seriously as a scientist.
You may think you are appointed by God Almighty to be judge, jury and hangman on these matters but IMO you have simply shown yourself to be a pompous ass.
Leif says
http://wattsupwiththat.com/2014/06/28/a-cool-question-answered/#comment-1673400
henry says
we have supplied you with the proof that earth is cooling:
in fact multiple postings by various people on this thread,
e.g.
http://wattsupwiththat.com/2014/06/28/a-cool-question-answered/#comment-1673313
If you donot answer the question
http://wattsupwiththat.com/2014/06/28/a-cool-question-answered/#comment-1673396
it could be that most onlookers would assume you have an agenda.
Tom in Florida says:
June 30, 2014 at 11:48 am
Your “summary” of course omits that it was YOU who first started the personal insults by referring to a person who has earned the designation of PhD as “Mr”.
Referring to each other as Mr is fine with me, which is why I did refer to Mr Evans and Mr Monckton the same way.
HenryP says:
June 30, 2014 at 11:50 am
If you do not answer the question
[…] it could be that most onlookers would assume you have an agenda.
If they are dumb enough to assume that, let them.
lsvalgaard says:
June 30, 2014 at 11:15 am
Malice & stupidity are not mutually exclusive.
lsvalgaard says:
June 30, 2014 at 11:52 am
“Referring to each other as Mr is fine with me, which is why I did refer to Mr Evans and Mr Monckton the same way.”
———————————————————————————————————————
Thank you for that, so I will withdraw my objection to it. However, my reaction to the other insults still stand.
“””””…..A Guy Named Jack (@JackHBarnes) says:
June 30, 2014 at 12:12 am
Willis,
I stand to be corrected but, I believe that George Elwood Smith (born May 10, 1930) is an American scientist, applied physicist, and co-inventor of the charge-coupled device. He was awarded a one-quarter share in the 2009 Nobel Prize in Physics for “the invention of an imaging semiconductor circuit—the CCD sensor”. (wiki bio, stating it to be clear and not misleading in advance) attempted to twice join the conversation but sadly he wasn’t forceful enough to gain the attention of such illuminating conversationalist as those involved like yourself while busy mixing mudd.
Jack Barnes…….”””””
Evidently I need to re-issue that legal disclaimer:-
For the record:- I am not now; nor have I ever been, George Elwood Smith; co-winner of the 2009 Nobel Prize in Physics, as co-inventor of the CCD (Charged Coupled Device).
He had a distinguished career at the Bell Telephone Laboratories, where he did his CCD work.
I have not met Dr. Smith, but for some decades, our career paths crossed with some regularity. I would go to register at some conference; perhaps the IEEE Convention on Electron Devices, only to be told:- “Well Dr. Smith you are already registered, and there are several notes for you on the message board.”
Well I’m NOT a Dr. and I’m not him, so I still had to register.
There are some quite distinguished persons, who DO know both of us, personally and professionally; including one, who is in my humble opinion, the US scientist most deserving of the Nobel Physics Prize, who has not yet received one. I won’t name him, but he is one of the Giants of the history of LEDs.
Back in those days, there was at least a third George E. Smith, who was a director of Research, at another major Electronics Company. When I worked at Fairchild Semi-conductor, in the late 1960s, there were three George E. Smiths in the Company Employee phone book.
With a name like mine, it’s almost as good as being anonymous. I’m already registered at half the motels on earth; well maybe for only an hour.
My favorite namesake, was a young man, newly married, who was assigned to the US battleship Oklahoma, and sent to Pearl Harbor, before he could even have a honeymoon with his high school sweetheart, and new bride.
Oklahoma was torpedoed, and capsized in battleship row, and George E. Smith was thrown over the side into the burning harbor. He swam ashore, on Ford Island, and survived; horribly disfigured by his burns.
So when his bride arrived, her handsome Prince, was physically changed. She stuck with him for the rest of their lives; still high school sweethearts. I haven’t checked recently, if either of them is still alive, and still living in Oklahoma.
I refuse to ever watch that pseudo Pearl Harbor, piece of crap, starring that dirtbag Alec Baldwin as Gen. Jimmie Dolittle. The cheek of that piece of human detritus, masquerading as a hero, makes my flesh creep; and why they had to make up some phony baloney love story, to attract women filmgoers, is beyond me. They could have included the real life love story of sailor George E. Smith of Oklahoma, and his high school sweetheart.
So for Jack Barnes; thanx for the sentiment; but I’m the other guy. But as I said, there are credible folks, who know both of us. There is a somewhat exaggerated short bio out there somewhere. The author somewhat massaged the reality. Nowadays, it seems, you really can’t believe anything you read.
Tom in Florida says:
June 30, 2014 at 12:23 pm
However, my reaction to the other insults still stand.
And thank you for that.
A Guy Named Jack (@JackHBarnes) said in part June 30, 2014 at 12:12 am
“ I stand to be corrected but, I believe that George Elwood Smith (born May 10, 1930) is an American scientist, applied physicist, and co-inventor of the charge-coupled device. He was awarded a one-quarter share in the 2009 Nobel Prize in Physics for “the invention of an imaging semiconductor circuit—the CCD sensor …”
Good for him. Actually I believe that the rules for the Prize say it can be shared by no more than 3 persons/entities, so I suspect he got at least 1/3 of the Physics prize, not 1/4 of it.
Oh – but how silly of me. If you are a climate alarmist, the Peace Prize to the IPCC remained viable at very high dilutions. Rules ARE made to be broken – for a good cause. In fact, perhaps homeopathic multiplication applies.
george e. smith says:
June 30, 2014 at 12:23 pm
There may have been a George E. Smith on Oklahoma, but the survivor I knew named George Smith was George A. Smith, who did swim amid burning oil but wasn’t disfigured, didn’t marry his high school sweetheart & didn’t live in the State of Oklahoma:
http://www.theolympian.com/2013/09/15/2725138/pearl-harbor-vet-from-tenino-remembered.html
Could not agree with you more about Baldwin’s sickening portrayal of General Jimmy Doolittle, who was a friend of my brother & whose splendid grandkids are friends of mine, one of whom also lives in Washington State.
Steve Keohane says,
“Too bad UV can’t get through the atmosphere, the plants need it to live.”
Um, no,
“Fortunately for us, the upper atmosphere of our wonderful planet filters out most of the really high energy light before it reaches us and the plants.
What is leftover consists of about
4% UV,
52% IR or weaker light, and
44% visible light.
All of this light is available to plants to use, but they only use visible light in the process of photosynthesis.”
“””””…..
Eli Rabett says:
June 30, 2014 at 12:40 am
You are missing something. It is well known that climatological variables do not follow the TSI, and the reason is that variation in the TSI is almost entirely in the UV which is absorbed above the tropopause by ozone and oxygen
…………………. “”””
change authors.
“””””……
Willis Eschenbach says:
June 30, 2014 at 12:45 am
…………………………….
……………………………
Thanks, Jack. Actually someone did reply to george, but that was all.
As to why Leif and I haven’t responded to george, well, both of us have been under sustained, unrelenting attack by everyone from Lord Monckton to bushbunny and all the other bunnies, both for pointing out David Evans’ newbie error about TSI dropping precipitously, and for pointing out that David Evans is acting just like Michael Mann, hiding his data and code and refusing repeated requests to reveal it.
So we’ve both been picking spitballs off of the wall at a rate of knots, all kinds of ludicrous attacks and improbable claims, complete with total misrepresentations of our positions … and as a result, I fear that george’s contribution didn’t get the attention it may have deserved.
Finally, I did read what george said, and he basically agreed with my hypothesis that the temperature is controlled by clouds and other phenomena … which is good, and is interesting, but other than indirectly it is about 5,000 miles from the topic at hand. So I didn’t respond, as I was focused on the David Evans question.
In any case, welcome to the party, grab a beer and some popcorn …
Regards,
w…….””””
Well I don’t want to exclude too much of Willis’s comment; and I did want to specifically acknowledge Eli’s comment, by concatenating it with what Willis followed up with.
To emphasize what Willis opined;…….I absolutely DO agree….. with Willis, that the Temperature is controlled by clouds, and other phenomena, and I have already said that IMHO, this is why any 70mK or so consequence of the cyclic TSI variation, gets hidden from Willis’s search for its signature.
For the very same reason, Eli’s mentioned TSI UV variation, gets expunged by the feedback.
Electronic Amplifier negative feedback designers, fully understand that as applied, in that discipline, negative feedback applied from output, to input, cares not a jot what kinds of pestilence sneaks into the system, to create spurious outputs.
Negative feedback squishes, all perturbations that are not a part of the actual input signal; harmonic distortion, intermodulation distortion, random noise, even power supply variations, however they sneak into the system.
Now the climate system, is NOT an electronic feedback amplifier.
In my view, TSI (the sun) ….IS NOT….. the INPUT SIGNAL…… to the earth climate system.
IT’S THE DAMN POWER SUPPLY !! The sun simply provides the energy needed by the earth system to twiddle all the knobs, and eventually enable let the system settle to a rather well regulated comfortable living condition.
So the 0.1% TSI 11 year cyclic variation, is a power supply perturbation; not an input signal aka the system set point.
Likewise, Eli’ Rabbett’s UV variation in TSI, is something akin to a noisy electrolytic capacitor kicking up a fuss, with random internal breakdowns. Yes that will disturb the system, but the feedback will squish that too.
So what the hell, is the set point ??
Well that consists mostly of the physical, chemical, and biological properties of the H2O molecule, in all its three (common) phases.
The freezing/melting point ; the boiling/condensation properties; the latent heats of phase changes, etc., all conspire to define a range of conditions which the whole system is comfortable with.
If we mess with the CO2, or the aerosols, or the GCRs, or the solar charged particles, or anything else, the water molecule will re-arrange its distribution, in the various phases, including clouds, and ice/snow, to right the ship, and restore the stable state.
The gain is not infinite, so all perturbations are not reduced to zero, but the whole system operates against any and all disturbing influences, no matter their cause. We may not see a signature of some, or any of them, because the feedback simply wants to restore the stable state, and doesn’t care much who caused any ruckus. I believe that is why Willis’s 11 year solar cycle, appears to not leave a track.
Now the whole system, is clearly not immune to all abuses. Ice ages and comet crashes, demonstrate that a big enough event can take some getting used to.
But yes, I believe the cloud system is in control. I think Dr. Roy Spencer holds similar views.
That 104 degree bend in the water molecules, is what makes life on earth, possible, and comfortable.
Taylor B says:
June 30, 2014 at 1:12 pm
Plants appear green because chlorophyll uses the red & blue ends of the visible spectrum in photosynthesis rather than the green middle.
Steve Keohane says,
“Too bad UV can’t get through the atmosphere, the plants need it to live.”
Nothing at shorter wavelengths than ~305 nm gets through. The problem is, of course, that UV generally refers to < 400 nm, so there is room for hair splitting.
It is good to see “Tom in FL”, one of Mr Svalgaard’s friends, coming to his assistance. However, Mr Svalgaard made a baseless and serious allegation against Dr Evans in terms that went beyond those of civilized scientific discourse, and decided not to back off and apologize while the backing off and apologizing was good. Refusal to apologize when apology is appropriate is the mark of a quack.
And, I dare say, if and when Dr Evans has the time to address Mr Svalgaard’s malevolently-expressed criticisms, I suspect that it will become evident to all honest onlookers that Mr Svalgaard has made a quite spectacular scientific ass of himself. Well, it’s his reputation, and if he wants to trash it by calling fellow-scientists names and making vicious allegations against them rather than politely pointing out what he thought should be corrected, then he must take the painful consequences to his reputation.
His university will now be dealing with his misconduct, which is a very plain breach of the explicit terms of its academic conduct policy. If one belongs to a university, one plays by its rules, and cannot complain if one is called out for a flagrant and persisting breach.
In the meantime, I note that Mr Svalgaard appears to have disappeared the graph in which he had falsely applied a 27-day smoothing to a period when there were many months of missing data. I knew he had produced a new version with the false “27-year smoothing” line removed, but I hadn’t realized he had gotten rid of the original embarrassingly unscientific version.
Finally, if Tom in Florida wants to call me names from behind the anonymity of a pseudonym, then I am going to ask the moderators to act. If you want to post from behind a pseudonym, it is against site policy for you to call anyone names. You want to call me names, you post under your own name. Cowards have no place at WUWT.
Monckton of Brenchley says:
June 30, 2014 at 1:36 pm
In the meantime, I note that Mr Svalgaard appears to have disappeared the graph in which he had falsely applied a 27-day smoothing to a period when there were many months of missing data. I knew he had produced a new version with the false “27-year smoothing” line removed, but I hadn’t realized he had gotten rid of the original embarrassingly unscientific version.
Yes, all this time you have been complaining about a line which was not there. The very first version did have a line put in by the plotting program which simply connected adjacent data points, but since you didn’t understand that this had no consequence at all, I helped you out. Hope you agree.
Since you didn’t understand what the issue was, let me repeat an earlier summary:
“The fact is that I and others have pointed out that the assertion by Mr Evans that there has been a sharp drop in TSI from the 2003-2005 time frame to the present is false [and he should have known that] and that therefore his prediction is spurious. This is what I disapprove of. In addition to the fact that Mr Evans has fabricated 900 days of data at the end of the data series. Both of those are serious breaches of scientific propriety.”
Mr Svalgaard should realize that he will be on very weak ground with the authorities of his university when I show them his doctored graph, demonstrate that he earlier described the curve that joined the two data-points many months apart as “27-day smoothing” and now says it is not a 27-day smoothing but “a line … that connected adjacent datapoints” [separated by many months, so it cannot have been any sort of “27-day smoothing”, whatever else it was], and then used that doctored graph as the basis for a false allegation that Dr Evans had used the wrong data in his own graph, and had thus acted “almost fraudulently” and with an “agenda”. That is not scientific language, and Mr Svalgaard knows it.
Mr Svalgaard, or whatever incompetent program he used, had added many months of false data to his doctored graph. He then complained that Dr Evans had added many months of false data to his own graph. And he is sufficiently un-self-aware to appreciate that a third party, looking on, would see very little difference between the two errors – if, that is, Dr Evans’ graph contains an error. And on that point, Mr Svalgaard – who has throughout fatally misunderstood what Dr Evans has done – may yet be in for a most unwelcome surprise.
The point, really, is that Mr Svalgaard has himself been caught out using a doctored graph, then disappearing it and replacing it with a graph with the doctoring removed, providing at different times mutually-inconsistent explanations for the false data that he had added to the graph (which I noticed only because I was listing his needlessly vituperative and discourteous insults to Dr Evans by way of an attachment to my letter to his university), then using the doctored graph as the basis for making his false allegation. The matter begins to move from mere misconduct under the university’s academic conduct policy to research misconduct – and perhaps even serious research misconduct – in that Mr Svalgaard, having given two mutually inconsistent explanations for the doctoring of his own graph, cannot have been telling the truth in one of the two explanations, and yet considers it appropriate to call Mr Evans “almost fraudulent”. That will not do, it really won’t.
The first time Mr Svalgaard described the doctored portion of the graph, he told me it was not a trend-line, as I had characterized it, but a “27-day smoothing”. Now he says it is a line after all. Can he not see how very bad that is going to look, particularly in the context of Mr Svalgaard’s having falsely accused Dr Evans of having deliberately and “almost fraudulently” committed an error which Mr Svalgaard himself had perpetrated on his own graph – adding data to it that did not belong there and for which there was no scientific basis or justification whatsoever?
When in a hole, stop digging. Apologize to Dr Evans and the matter will rest there, albeit with monumental but deserved damage to your reputation for scientific integrity and probity, and to your standing within your university. And learn to be polite in future, for if you start out by being libelously impolite you must not be surprised if you are called out for what you are – a quack.
Milodonharlani,
I’m not sure what the significance of your observation is, but the way you format your comment makes it appear that you were quoting me, which isn’t the case. I just wanted to clarify that.
Monckton of Brenchley says:
June 30, 2014 at 1:36 pm
“Finally, if Tom in Florida wants to call me names from behind the anonymity of a pseudonym, then I am going to ask the moderators to act. If you want to post from behind a pseudonym, it is against site policy for you to call anyone names. You want to call me names, you post under your own name. Cowards have no place at WUWT.”
————————————————————————————————————————-
My name is Tom Bruno and I live in Venice Florida. I use “Tom in Florida” as there have been others named Tom who have posted here. It is easier to remember that I am in Florida when reading a post of mine. I have not used any other name on this blog. I spent 9 years in the
U. S. Marine Corps after which I worked in sales, mostly insurance and real estate. I am an average person who has raised two children and worked several side jobs to do that. In the past I have attempted to become active in local politics but could not stand the lies and back stabbing. I am 63 years old and intend on enjoying my later years working on my house and yard, playing golf, and keeping my wife happy. I also enjoy this blog (most of the time) and have learned very much from the writers and posters here, especially Dr Svalgaard.
So now I am no longer anonymous but you are still a pompous ass, in my opinion.
MikeUK says:
June 30, 2014 at 9:23 am
“… just the problem of establishing an average TSI for recent years where the averaging “filter” runs out of data to operate on.”
Yeah. I figured anyone worth his salt would have realized that, but I didn’t want to jump into the ridiculous fray.
To Lord M: A personal message, in regard to nothing in particular. Are you aware that there are certain insects in temperate climes which like to burrow under the skin and cause itching? When the afflicted person scratches the itch, it serves the purpose of bringing blood to the site, upon which the parasite feasts. The more one scratches, the more the little bugger delights in it. The only way to make it stop is to stop scratching the itch. Nature is fascinating, don’t you agree?
Monckton of Brenchley says:
June 30, 2014 at 2:23 pm
Mr Svalgaard should realize that he will be on very weak ground with the authorities of his university when I show them his doctored graph, demonstrate that he earlier described the curve that joined the two data-points many months , etc, etc, etc
Your broken record is not making any sense as should be clear to everybody involved, but does seem to scratch your itch.
While many are arguing over what I consider to be minutiae, I would like to remind everyone that the whole point and purpose of Science – is the ability to predict.
That’s it.
All of our climate and resultant weather is forced, from space.
That is where our Earth lives and we certainly are in the midst of climate change alright – to global cooling – and the one on its way will be a strong one at that.
There’s little time to prepare for it.
In my astrometeorological climate forecast, as I’ve been saying for years, global cooling will be soon among us by mid-December 2017.
It will last approximately 36 years and will be a pretty deep climate event. It’s going to get very cold and wet with blasting storms featuring long winter seasons and cold and wet spring seasons.
The Sun is going to enter a hibernation state as it nears solar cycle #25 and anyone who knows astrophysics and space weather knows for a fact that it is the Sun that controls the temperature on Earth (and everything else as well.)
We are currently in-between climate regimes, that of solar-forced global warming and that of solar-forced global cooling and this is the cause of the extremes of weather we’ve been seeing since the last decade.
The reason for global cooling will be the dramatic drop in solar radiation along with planetary modulation of the Sun’s condition and its coming hibernation state.
This affects the entire heliosphere of the Sun throughout our solar system. Now, according to solar records, there have been three strong declines in solar radiation over the last 400 years.
The first drop was in the 1600s that was called the Maunder Minimum, or the ‘Little Ice Age’ and noted as the coldest era of the previous four centuries.
The second drop came in the mid-to-late 1700s/early 1800s, and preceded the second coldest era also known as the ‘Dalton Minimum.’
The third fall is now gradually building and will lead to the official start of a new global cooling era, according to my calculations.
It will begin in mid-December 2017, as I have forecasted, and last 36 years.
Now, as much as everyone would like to argue over what I consider minor issues, also the fact that climate science is still very much in its infancy – all the talk in the world will not halt global cooling for a nanosecond.
It is incumbent upon everyone to get themselves prepared for what will turn out to be a rather strong era of global cooling for three plus decades.
I’ve also forecasted that the next ENSO cycle will arrive 2020-2022, with a major La Nina to strike under the new climate regime of global cooling. The winter of 2021-2022 will be particularly fierce, very cold and long. It will break all previous modern cold event records.
We will see a bad winter season at that time; worse than the most recent winter of 2013-2014 that featured brutal cold temperatures, heavy snowfall and ice throughout the northern hemisphere, including the Middle East.
In reality, the Earth has been cooling at 0.1C a decade since 2001-2002. And in my climate forecast, I see a cooling of 0.2C from now through 2017 at a rate of about 0.5C a decade with big temperature drops between 2017-2033.
If anyone wants to look at this mathematically; at the data that has not been tainted by the ‘man-made global warming’ nutcases in climate science, then you will note that since 2001-2002 we have observed a gradually cooling world and that overall trend has been negative since 1996.
This is climate change – the end of an interglacial period and the start of another round of global cooling – the worst one yet in modern memory.
We have proxy records that clearly show Interstadial pulses of the past. They persist for about half a precession cycle with the rate governed by orbital eccentricity.
I would like to mention the Bond Cycle here – abrupt cooling is coming.
The cycle is 1,470yrs, plus or minus 30 years, and is documented in all the ice core temperature proxies, or isotope analysis. That last very deep global cooling period coincided with an era historians called the ‘Dark Ages.’
Named after Gerald Bond, who discovered the evidence of this climate cycle that is externally forced and brings about abrupt cooling.
The last Bond event, or initial abrupt cooling means that all of us are looking at a Grand Solar Minimum that will easily match the Maunder event. I think it will be worse than that in my climate forecast of global cooling.
All the data indicates that our Sun’s internal rope conveyor is essentially shutting down and the Earth’s position in the Eccentricity cycle looks really precarious to say the least.
If you look at the data on the north polar insolation minimum, it is at or below levels of the past six interglacial terminations.
The brutal winter of 2013-2014 in many regions of the northern hemisphere was clear proof of these facts as we will have completed the fourth Eccentric beat in conjunction with the latest completed Precession and that is when all the recorded interglacials have terminated – in our recent era of dominant Obliquity.
In the winter of 2013-2014, we saw a surge in the mobile polar high production that began in December 2013 and that’s when regions like the Middle East got a real dose of winter, where it snowed in Egypt as other regions got blasted with cold and snow during that month.
All this means that the next Bond Cycle is due to begin and it will be the 8th event of the Holocene Interglacial due to the fact that all of the interglacials in the era of dominant Obliquity have ended on the 4th or 8th beat.
That depends on the amplitude and synchronization of the Precession; however it is always in synchronization.
Ulric Lyons has repeatedly – and correctly – said that we will complete the 179-year barycentric COM excursion. He’s right, as these cycles always intersect at interglacial terminations when reconstructed.
According to my climate forecast, it’s going to get very cold and wet out here people.
The winter seasons will be cold and made much longer by the cold and wet spring seasons, along with short cooler summer seasons (in both hemispheres) along with wild fluxes of the circumpolar vortex that will dip far south into North America bringing those powerful jet streams with it.
A heavy archaeomagnetic jerk is about to get itself going. All the interglacials in the era of dominant Obliquity have ended during such a Bond event and the one coming is really intense as our current interglacial period is coming to an end.
World temperatures look to fall at -0.5C a decade at the beginning, then will really start to pick up their temperature drops into the early 2020s and that is when I have forecasted the next ENSO cycle – a MAJOR La Nina.
Weather will go absolutely bonkers during the decade of the 2020s as global cooling will be fully underway.
So, while people want to argue climate change; oh, there’s going to be climate change alright, but it won’t be global warming, which is good for the Earth, but rather, global cooling, which is very bad for the Earth.
It is very wise of those in the know to make serious preparations, as for years now I have forecasted global cooling to officially begin in mid-December 2017. That is just three solar years from now. It will last 36 years long, and brutally cold years.
The party of our most recent interglacial period is about to come to an end.
Anyone who is not prepared is going to be very sorry. Global cooling is nothing to play with and those who made global warming the ‘bad guy’ will have to eat plenty of crow as they burn everything in sight in their effort to stay snug and warm in a brutally cold world climate.
Theodore White, astrometeorologist.Sci
george e. smith says:
June 30, 2014 at 1:19 pm [ “…” ]
After reading george’s comments for the past few years, it’s my opinion that he knows about as much as anyone how the system works. I’m glad to see him in agreement with Willis, who I would put in the same category.
As far as the recent mudslinging goes, and without naming names, my own policy has always been to not attack folks on the same side. That is the alarmist crowd’s job. And I wear my heart on my sleeve when it comes to them — no holds barred. But I won’t attack our team, even when they somtimes have a strong opinion about a comment I made.
Maybe the philosopher Rodney King might have had some advice on that for our side.
Theodore White says:
June 30, 2014 at 3:28 pm
While many are arguing over what I consider to be minutiae, I would like to remind everyone that the whole point and purpose of Science – is the ability to predict.
I agree except I think 2014 is the turning year. I will send over my latest. Next post. .
One item to remember is this period of below normal solar activity started in 2005 so the accumulation factor is coming into play.
Secondly it is not just solar activity within itself but the secondary effects associated with solar variability which I feel are extremely hard to predict as far as how strongly (to what degree)they may change and thus effect the climate in response to long prolonged minimum solar activity.
I strongly suspect the degree of magnitude change of the prolonged minimum solar activity combined with the duration of time of the prolonged minimum solar activity is going to have a great impact as to how EFFECTIVE the associated secondary effects associated with prolonged minimal solar activity may have on the climate. An example would be an increased in volcanic activity.To make it more complicated could thresholds come about? An example would be a changing atmospheric circulation pattern which may promote more snow cover/cloud cover and thus increase the earth’s albedo. How will the initial state of the climate play into it? An example of this would be the great amounts of excess Antarctica Sea Ice the globe has presently and how this might play out going forward under a very long period of prolonged minimum solar activity. Will climatic outcomes unknown come out of this?
Then one has to consider where the earth is in respect to Milankovitch Cycles (favorable )and how the earth’s magnetic field may enhance or moderate solar activity.
Given all of that I think at best only general trends in the climate can be forecasted going forward. I am confident enough to say in response to prolonged minimum solar activity going forward the temperature trend for the globe as a whole will be down. The question is how far down /how rapid will the decline be? I really do not have the answer because there are just to many UNKNOWNS. Further when you have unknowns in a system like the climate which is non linear, random and chaotic expect surprises.
NOTE: Ocean heat content could slow down the temperature fall at first. In regards to that I look first for more extremes in the climate due to low solar activity followed by a more pronounced drop in temperature as time goes by.
Still I believe year 2014 is the turning point for global temperatures as the maximum of solar cycle 24 comes to an end.
It can be shown that a strong correlation exist between sunspot numbers and ocean heat content. When the SIDC sunspot count is well over 40 (the long term average) like it was from 1934-2003 the energy gained from solar to the oceans is positive hence ocean heat content rises.
This is now changing with the exception of the maximum of solar cycle 24(2011-2014 early) which is on it’s way out.
y
lsvalgaard says:
June 30, 2014 at 3:16 pm
Hola! I think I’ve gotten one. Must. Not. Scratch.
Bart says:
June 30, 2014 at 3:50 pm
Hola! I think I’ve gotten one. Must. Not. Scratch.
Stick with that and you’ll be OK.
I am most grateful to Mr Bruno for having had the courage to say who he is. That is the honest way. And of course he is entitled to his opinion. I have come vigorously to the defense of a friend. Perhaps Mr Bruno would do the same. Let us see what Mr Svalgaard’s university thinks of his departure from the fundamental principle of conduct that it enjoins in the simplest and clearest terms upon all who are associated with it. If his university is disinclined to uphold that principle in the face of a manifest and persisting breach, then the libel courts of Australia are of course open to Dr Evans.
In the Britannosphere, accusations of fraud (and adding the word “almost”, particularly given the manner in which Mr Svalgaard has twice interpreted what he meant by “almost”, will not help the defendant much) are taken very seriously indeed by the courts. I have now compiled a list of some of the things Mr Svalgaard has said about Dr Evans. It has taken two hours. That’s a long list.
Thanks to my former career, I have had to become something of an expert in what is and is not libel in multiple jurisdictions. Mr Svalgaard’s remarks constitute what is known in British and Australian law as “a libel of Mr Evans in his calling” – and a grave one at that. Falsely and repeatedly to accuse a fellow scientist, in the most widely-read public forum on the climate worldwide, of having used wrong data and of having fabricated data, just at the moment when Dr Evans is preparing to launch the culmination of many years’ patient work, and to persist in these libels even after having been given numerous plain warnings to desist, would in my not inexpert opinion – if the case were proven – require Mr Svalgaard to pay Dr Evans not less than $100,000 in aggravated damages, particularly because Mr Svalgaard was given so many opportunities to apologize and persistently failed to take them.
Mr Svalgaard is particularly vulnerable because, in his extraordinary attack on Dr Evans, he chose to use a graph that he had himself doctored by the interpolation of a line representing several months for which there were no underlying data at all: yet, in one of his too many comments here, he expressly states that where there are no data no such practice should be adopted. The courts would dismiss any contention on Mr Svalgaard’s part that the doctoring of his graph had no bearing on his accusation that Dr Evans had doctored his, in a very similar way. For if one makes a very serious allegation about a fellow scientist, and if one repeats it over and over again, then one must come to the court with the cleanest of clean hands.
I do not speak for Dr Evans in any way, and I have no idea of whether he will decide to sue. As a first step, he might request Anthony to allow him to answer the allegations in a head posting, which would go some way towards expunging Mr Svalgaard’s nastly libel of him in his calling as a scientist.
Perhaps in the United States, as one thoughtful commenter has suggested, persistently and falsely calling someone “almost fraudulent” for allegedly “fabricating” scientific data is thought acceptable. Not in Australia. There, as in any British-law jurisdiction, such a libel is taken very seriously indeed. I had hoped I had made that plain to Mr Svalgaard, so as to give him the chance to get himself off the hook.
For my part, I am referring Mr Svalgaard’s long list of malicious comments about Dr Evans (but not about me: I give as good as I get) to his university, which will know best how to handle the matter, for there is a rather delicate aspect that I am not at liberty to discuss here. The university will most certainly realize that the do-nothing option is not an option. The libel is too grave and too persistent. My lawyers are looking at it tomorrow to see whether malice is present, in which case the damages would triple, to say nothing of the costs. Their corresponding lawyers in the U.S. will be giving advice on whether Dr Evans would count in U.S. law as a “public figure”, Probably not, from what I know of the “public-figure” test, in which event, in order to enforce the judgement of the Australian courts in the U.S., it would not be necessary to prove malice (for, though malice seems evident, the test in Australian law is high).
It would also be open to Dr Evans simply to apply to the court for a declaration (in Scotland, declarator) that he had not fabricated anything or engaged in any of the other varieties of scientific misconduct of which Mr Svalgaard has seen fit to accuse him with such vicious and unbecoming persistence. Given the sensitivity to which I shall be drawing the university’s attention, that might be the kindest course.
And there, I think, we had better leave it and let the appropriate authorities take over. I have only been as explicit as this because this posting will also go some little way towards expunging the libel and minimizing the damage to Dr Evans’ reputation that Mr Svalgaard seems to have intended.
From Monckton of Brenchley on June 30, 2014 at 4:16 pm:
Which would be very obvious once Dr. Evans releases code and data. I await the releasing of his great creation to the revealing powers of the steady sunshine, that such obvious truths shall be laid bare for all to witness.
Have you obtained his promise that all shall be revealed even if the predictions are proven inaccurate, so science may advance by examining his failure?
I know this is a long way down on an old thread but here goes.
Dr S is bordering on the arrogant, he appears to have no idea how the extraction of the transfer function works. If Lean 2000 remotely preserves the cyclic information, and is reasonably correct in the size of those cycles then Evans will have derived any approximately correct transfer function within limits. If lean 2000 contains “systematic” errors that for example bias sunspot numbers one way or the other, or transient problems with “connecting” different datasets, then the Evans method will largely ignore that. Despite shortcomings with Lean 2000 Evans probably has a reasonable proxy for the climates behaviour in his model, indeed we are not in a position to say otherwise. Evans, prompted by this point has apparently updated the data since freezing it early on and found this did not substantially change the conclusion, are you disputing that finding? And on what basis do you dispute it? do you have your own notch filter model?
Finally Dr S you keep carrying on about UV being a small component of TSI, the problem is that this observation is largely irrelevant, most physical systems, that engineers work with every day, don’t have consistent behaviour with frequency, particularly if there is time lagged feedback. Many have peaks and troughs in their frequency response, and it is possible that UV ( or any other frequency band for that matter) has a response or feedback that opposes the overall effect of TSI. In fact in nature this is pretty much the norm, who would have thought that electric current induced in a wire has a direction that Opposes the current that created it! No Engineer in his right mind would EVER make the assumption that any systems energy response would be flat
As for Willis, frankly, you have been behaving like a child that’s been told he can’t have a lolly at bedtime and will have to wait until tomorrow – Willis, it’s most unbecoming of you, have patience and be polite, take Dr Evans at his word about the code release and be polite enough to allow him to make some final adjustments based on what he has learned in the discussion period. That revision for example, I have no doubt, includes retraining on something other than Lean 2000 based on LS’s comments. That’s the way he wants to do it, and he’s entitled to be allowed that privilege. Keep an open mind, after all this is what being a sceptic is all about.
Wow..
Lots of informative comments and links above.
The TSI, we may learn in the future has its variables, as yet not fully understood, that should be considered. The UV and EUV and one other.. has conflicts already.
Wow.. Good thing you had your kryptonite for this Dr. S. Forgot the whole point of it by the time I got down here.. Seemed like such a waste of time for you.
Solar wind has differential rotation too…great just great..
..I pointed out to him that the solar wind exhibits two separate rotation rates: 27 d and 28.5 days which are both present at the same time, .. Thanks for that Dr. S.
Vuk’s good link here and info concerning relationship with Earth rotation, climate and the possibility of a solar driver for both.
NASA Study Goes to Earth’s Core for Climate Insights 03.09.11
http://www.nasa.gov/topics/earth/features/earth20110309.html
What about duct work coming out the core, that at one rate of rotation it uses X ducts and at faster rotation rate it uses Y ducts or something.. Switches between the different available ducts.
ren, good links from you..
Cool the way this link below shows both GCR and ACR moving along with the heliocurrent sheet tilt angle.
The upwind crescent at 1Au and the accretion models are similar. Accretion models were showing, by using different stellar magnetic field configurations, how the accretion changes from polar to multipole regions, kinda like we see with the lower solar dipole and heliocurrent sheet movement for ACR and GCR.
Anomalous Cosmic Ray Behavior at 1 AU During the Unusual Solar Minimum
http://www.srl.caltech.edu/ACE/ACENews/ACENews136.html
To anyone interested, in understanding the GCR, solar relationship, have go.. on this..
Update on Record-Setting Galactic Cosmic Ray Intensities in 2009-2010
http://www.srl.caltech.edu/ACE/ACENews/ACENews134.html
William Astley, good stuff mostly. Because we don’t see many solar sunspots, doesn’t exactly mean that the magnetic cycle has interrupted. I hope. How long will this cycle be? We already know it will be long and slow. Solar rotation variation, why?
rbateman, Polar Vortex Droppings, eeeeek, I live inside of the Great Lakes BASEMENT er ah basin. Watch the duct work that drops out them vortexs and some times from the outer walls eeeek.
Dear George Smith, my simple name also has the distinct reputation of internet notariety. From a googled search of my name, I am apparently, by and large, a … tart.
So.. lower dipole field, less magnetic flux available to flow from the polar regions to the equator. So is all the magnetic flux available at this time being centrally produced?
Carla, to read your long list of interesting links and comments, the warming/cooling could be caused by….I don’t know…say…butterfly wings positively interacting with UV in the equatorial regions which responds to Jupiter and Mars, whose bary manilo song affects TSI which then causes said butterfly to stop flying thus being a negative feedback. Which begs the question, what wouldn’t you think was worth investigating?
Monckton of Brenchley says:
June 30, 2014 at 4:16 pm
As little as I relish Dr. Svalgaard’s … well, now that people are talking legal nonsense, maybe I should daintily refer to it as his MO… I abhor the chilling effect of suggesting legal action over comments made in a blog atmosphere. I, personally, have not been influenced by Dr. Svalgaard’s comments to forming an adverse opinion of Dr. Evans capabilities or ethics, as I do not form my opinions based on what some other guy thinks. I doubt many people here do. That’s the kind of people a blog like this specifically attracts.
Let’s not make this into a Mannian circus, shall we? It’s a blog, not a formal conference proceeding. Leif is just some guy. In the end, does it really matter? If it does, I’m just going to quit, because my side will have become no better than the other one.
Slightly revised..
So.. lower dipole field, less magnetic flux available to flow from the polar regions to the equator.
So is all the magnetic flux available for the formation of sunspots at this time being centrally produced?
Lean 2000 results, annual, 1610-2000, easy to stick into spreadsheet.
ftp://ftp.ncdc.noaa.gov/pub/data/paleo/climate_forcing/solar_variability/lean2000_irradiance.txt
When does one use “11yrCYCLE” and when “11yrCYCLE+BKGRND”?
Has the assumption of an 11 year cycle been built into the reconstruction? Since the timing is so loose it is less of a “cycle” and more of an expected pattern. If you tried extending back a rigid timing, it would certainly not match what was reality.
Pamela Gray says:
June 30, 2014 at 6:19 pm
—————————————–
Yah, yah, yah Pamela,
Doggone butterfly wings, giving a winter cloudiness look to the basin I’m in this June.
And Jupiter and Mars will also be Responding to the lower solar outputs toooo… You will see…
I’m writing off June in Wisconsin as being cloudy. Sometimes mostly cloudy, sometimes partly cloudy and points in between. As for temps both ends of the spectrum around here, jeesh.
Plumes coming from plasmasphere or tail or belts? Dusk and or dawn.. With a midday lifting.. Something in the regime is a changin’.
From bobl on June 30, 2014 at 6:00 pm:
Inside your circuit breaker panel, there is enough energy available across the incoming mains to vaporize a copper bar placed across the lugs. It is not recommended to test this as it happens explosively. The energy will be available for only so many milliseconds until the fuse on the pole transformer opens the circuit, hopefully.
That much available energy is safely harnessed by the minuscule filament of an incandescent Christmas light bulb. That’s like tapping the bottom of the Hoover Dam Reservoir with a soda straw. The old waxed paper type.
I gave up wrapping my head around that one. I just stay the hell away from the lugs when I got the cover off.
Carla! I wasn’t being serious!
Jupiter has a very large magnetic field. Mars does not, neither does Venus, both had oceans of water. Why would AGW have any concerns about solar influences? The forecast before SC 24 was more of the same. I printed that off before it disappeared. You know a long duration high sunspot number, a double peak at that, and a short period of quite. Then things changed, the sun went quite. However, the sun is not as quite as it could be and this cycle is lasting a little longer than forecast. Of course if AGW is right, the temperature has already dropped. It has dropped by the amount the AGW said the temperature should have gone up.
Taylor B says:
June 30, 2014 at 2:38 pm
I was responding, apparently not well, to your question about possible similarities in the the initiation of glacial epochs.
Monckton of Brenchley says:
June 30, 2014 at 4:16 pm
I do not speak for Dr Evans in any way, and I have no idea of whether he will decide to sue. As a first step, he might request Anthony to allow him to answer the allegations in a head posting, which would go some way towards expunging Mr Svalgaard’s nastly libel of him in his calling as a scientist.
This is an excellent idea. Let Mr Evens himself explain the motivation for falsely claiming that there is a sharp drop of TSI from 2003-2005 until today – was it deception, ignorance, or just plain old wishful thinking – that got him to issue that claim which is contrary to the actual change of TSI [TSI is now higher than in 2003-2005] http://www.leif.org/research/Monckton-Flaw-3.png and also admit the fabrication of 900 days of ‘data’ for purpose of extrapolation. Those are the things I disapprove of. You seem to have a lower bar.
I have now compiled a list of some of the things Mr Svalgaard has said about Dr Evans. It has taken two hours. That’s a long list.
I am truly sorry that you have wasted so much time in compiling said list. You said ‘some of the things’. Do you mean that you missed some things. Can I help in expanding the list? [Send it to me]
bobl says:
June 30, 2014 at 6:00 pm
Dr S is bordering on the arrogant, he appears to have no idea how the extraction of the transfer function works.
You are missing the point and shooting your ball way beside the goal, not even in the same direction as the straw man. The issue is about Mr Evans’ false assertion that TSI is dropping precipitously and about his fabrication of 900 days of data.
Bart says:
June 30, 2014 at 6:22 pm
Let’s not make this into a Mannian circus, shall we? […] If it does, I’m just going to quit, because my side will have become no better than the other one.
I think this is an important point. If Mann can’t get the science to conform, he tries the courts. Mr Monckton seems to be made of the same cloth. I guess that being a hard-core activist eventually corrupts you.
kadaka (KD Knoebel) says:
June 30, 2014 at 6:53 pm
When does one use “11yrCYCLE” and when “11yrCYCLE+BKGRND”?
The background does not exist, so should not be used.
Willis and everyone. The term graphamania, is used by writers usually only creative writers and by psychologists. They have a nervous system that is unconsciously driving them to express their feelings and imagination into the written word. I form of communication, as writing is one of the hardest way when compared to art, music and other creative genres. Not their style of writing. Not many people have this urge, in fact the majority of the human race detest writing even a letter, but emails now has made those timid folk more prevalent. But it is good therapy when you can express hidden feelings or objections about a subject or person into prose without being charged with libel. You should write a novel Willis, titled ‘The climate changers’ would be good reading. LOL. But don’t use such an elitist tone and math as you’ll leave most lay persons turn the pages.
VisionLearning *had* a section on the ‘Misuse of scientific images’ with an image titled ‘Battle of the Graphs’ — but if you follow the link today you’ll find no such section.
If you use the Wayback Machine – and look at the page just one day ago (June 29th version) you’ll see it.
The lower panel of the graph that VisionLearning used as an example of the ‘Misuse of scientific images’ accompanied the David Evans BIG NEWS VIII: New solar theory predicts imminent global cooling post at JoNova’s. The graph has since been replaced after Stoat pointed out it was incorrectly sourced and not an IPCC graph as purported.
And the source of that image? JoNova had it linked to Junkscience – but the version there was preceded in an article by Christopher Monckton in the Telegraph on November 5, 2006.
Monckton has since been unwilling to take any responsibility for the ‘Battle of the Graphs’ image that accompanied his article 8 years ago. He has threatened libel suits against those who make him responsible for it. He has also refused to answer who *is* responsible for the graph.
VisionLearning’s section on the ‘Misuse of scientific images’ has been on the web since at least 2009. But the day after I mention it in a comment thread visited by Monckton the section disappears. A comment thread where he threatened a libel suit against a blogger for the making the obvious inference it was Monckton’s graph that accompanied the article with his byline. Or at the very least approved by Monckton. If not, Monckton had 8 years to correct the record. To my knowledge he has made no attempt to do so.
And while his legal threats are unlikely to sway Stoat, it would appear Monckton of Brenchley has succeeded with legal threats insofar as VisionLearning is concerned. Or pehaps it’s just a big coincidence they decided to delete the section at the exact same time that Monckton was threatening libel suits against all and sundry.
The Lamb 1965 ‘schematic’ is the most abused and misused graph in all of climate science. Monckton provides another sad chapter in its history.
Thanks for that Mr. O’Neill. I’ll respond tomorrow sometime. Late here.
Having left the thread for a period to allow it to develop a bit. I must confess … it’s heartbreaking to see what’s happened in my absence.
I am deeply disturbed by Lord Monckton’s rush to use whatever personal power and legal power he can muster to see if he can get Leif Svalgaard in trouble with his university and to bring legal action again. Perhaps that’s how Lords in England deal with the world … but on my planet, threatening legal action and threatening a man’s job, as Lord Monckton has done to Leif Svalgaard, has to date been the exclusive province of the worst actors among the alarmists, an action for which they have been rightfully excoriated. I am immensely saddened to see him take this path, as I consider him to be a friend.
In particular, it is disturbing because both Leif and I have made the same two points, over and over:
1. There is an obviously bogus, very precipitous drop in the TSI as used by Dr. Evans, and
2. Dr. Evans has included about 900 days of data which have been made up out of thin air.
To date, I find no acknowledgement by Lord Monckton of these two undeniable facts. I call them “undeniable facts” because Leif and I have both provided undeniable evidence for both of them, evidence which no one (including Lord Monckton) has challenged to my knowledge.
Now, we can discuss the “why” of these at leisure. For example, Mike (UK) says:
So he at least accepts the fact that Dr. Evans made up 900 days of imaginary data, and added it to the end of the actual dataset. I fear I find his excuse unresponsive, but at least he has his facts straight. I say it is unresponsive because I’m not aware of any standard method that just picks an arbitrary figure, whatever it might be, and tacks it on to the end of the dataset in order to allow a filter to reach the end of the real data. I’ve never seen that done.
But whatever the reason is … both things that Leif and I have said are absolutely true, no matter how much Lord Monckton might not like that fact.
I also find it particularly vicious for Lord Monckton to threaten legal action in the UK or Australia. In the US, quite reasonably, in general the truth is an absolute defense against libel—if you’ve told the truth, you can’t be attacked by some charming fellow claiming you’ve libeled him. That’s so obvious, that in the US no one questions it. I mean, how can it be libel if it’s true?
However, as Lord Monckton, the self-professed expert in libel, assuredly knows, this is not true in the UK or Australia. The good Lords in Britain obviously didn’t want the polloi to be pointing out their defects, no matter how true the unpleasant comments might be. So in UK law, you can get stitched up for libel even though every word you say is the absolute truth.
So it is no accident that Lord Monckton is threatening legal action where the law allows a man to be fined or thrown in jail for telling the truth … and it tells you something about the levels that Lord Monckton is willing to sink to when he can’t face the truth.
I must say, I am absolutely gobsmacked by Lord Monckton’s threats of legal action and of trying to make trouble for Leif at his university. For me, these threats are absolutely beyond the pale. I consider myself a friend of the Lord, but this is entirely unacceptable behavior. If there are any of his other friends reading this, if Jo Nova or David Evans read this, I beg you to please, please tell Christopher that he is risking his entire reputation by taking this path. If he joins swamp toads like Michael Mann and James Hansen in threatening a man’s job and livelihood through legal and other means, simply because he’s told the truth, Lord Monckton will never again be welcome in a conclave of scientists.
Dear heavens, Christopher, do you truly not realize how unutterably vile and despicable your threats are, of legal action in a venue where a man can be punished for telling the truth, and of using your well-known eloquence, your undoubted connections, and your power to try to get him in trouble with his university?
Come to your senses, my friend, you are at the edge of a precipice, and if you foolishly decide to jump, you will be throwing away everything. No one will ever, ever forgive you for trying to win a scientific argument with an honest man by underhanded legal means. To your death, you’ll be known by this one act—”Lord Monckton? Haven’t heard of him in donkey’s … wasn’t he the fellow who brought legal action against a scientist for telling the truth? Yes, that’s the chap, I remember him now … shame what he’s done to the family name” …
I cannot say this strongly enough … Christopher, you are on an insanely self-destructive path, a path on which the best you can hope for is an entirely Pyrrhic victory. As a friend, I implore you, reconsider your actions, and turn away from your mad course before you’ve done your reputation any more damage.
Be clear that I say this in friendship, and in truth it has nothing at all to do with David Evans or his theories. Your threats are totally unacceptable in a scientific discussion, and doubly so because of your acknowledged position, power, and wealth, regardless of the scientific issues at play. Give up this mad idea, I beg of you as a friend. You have already done yourself immense harm, I implore you to stop the threats before any more damage is done.
Sadly,
w.
i suggest that this blog has become a battle of words and sentiments, and the arch leader is Willis. The agreeing partners are tripping over their words, and personally its become boring, B-O-R-I-N-G. If one doesn’t agree with David then this should be done in an less argumentative and ad hominin manner and without personal judgement on his article being fraudulent etc. Otherwise it has become more of a alarmist censure than skeptical. And by the way, I am Patricia Lightfoot BA, GCA, (UNE Armidale), Diploma of Organic Agricultural production, plus some highest certs in teaching and assessment and Agricultural Horticulture methodology. The climate and weather patterns (especially precipitation) altitude and distances from the ocean, soil chemistry are generally one of the important factors governing agriculture and horticulture production and in Australia we have many different micro-climates from State to State, and even within one state. When Alice Springs in the red centre, gets minus temperatures, like it did the other day, and snow on the highlands we are suffering a cold winter. And more to come. I just think that this particular thread is not displaying a content that is more concerned in advertising some posters big noting themselves than being a supporter of what we all believe. AGW is a rip off and fraudulent. Argue between yourselves but not in away, we can sideline one of our best anti-AGW in Australia.
bushbunny says:
June 30, 2014 at 8:37 pm (Edit)
Thanks, bushbunny. I do try to use as little math as possible to include as many lay folks as possible. My target audience is the educated layperson, and many of them are allergic to math.
As to my tone, well, I fear it has proven resistant to change. I’ve been trying to become more Canadian, but despite my efforts, I tend to write’m the way I see’m. By that I mean if I’m happy about something I write happy, even when I try to write with some other tone. Or as in this case, I’m sad about the threats of Lord Monckton, so I write sad. And when I’m angry about say Michael Mann or … someone else … refusing to share their data, I write angry.
And in a way, that’s OK with me, because it is honest even if it may not always be appropriate, and it lets people know where I stand.
As to an “elitist tone”, I fear that if some knuckle-dragging mouth-breather starts making inane objections based on flat-earth fantasies, no, I don’t treat him as an equal. So if that’s what you call an “elitist tone”, I can only plead guilty and say that it’s unlikely to change.
In any case, it’s good to see that you’re still here …
My best to you,
w.
Theodore White says
In reality, the Earth has been cooling at 0.1C a decade since 2001-2002
Henry says
I can indeed confirm that result, in fact my result was -0.014K/yr since 2000. So we are already -0.2K compared to 2000. As to the rest of your argument: I do not know where you get it from. Perhaps you can enlighten us, as it seems you are telling us the [interesting] results of your investigation, without presenting us with any verifiable measured data.
For everyone here, let me make it clear again that [in my opinion] an inactive sun is not a cooler sun.
I am not at all surprised about Leif’s claim that TSI is now higher. In fact, personally I have never seen the sun as bright as it is now. It just that a brighter sun causes a cooler earth. This is because the increase in the release of more energetic particles due to the lower solar polar field strengths, see here,
http://ice-period.com/wp-content/uploads/2013/03/sun2013.png
simply causes more ozone, peroxides and nitrogenous oxides TOA. In turn these substances absorb and re-radiate and subsequently also back radiate more radiation to space when there is more of it.
If Evans were to simply use the proxy of maximum temperatures he would see that its drop closely correlates with the drop in the solar polar field strengths. Either way, from all of my investigations, I have to conclude that some switch must occur soon because we can all see that the solar polar field strengths cannot continue to fall forever. I suspect we might see another pole switch before we will slowly cycle back to normal field strengths.According to my various investigations and the position of the planets, I believe this will happen around 2016, give or take a year.,…
I don’t mind Leif calling my work nonsense provided he offers us an explanation as to why earth is currently cooling. I have learned to simply ignore his unsubstantiated comments.
bushbunny says:
June 30, 2014 at 10:31 pm
“Arch Leader” … I do like the sound of that, Bushbunny. Someone before called me “Willis the Merciless”, but I think I prefer “Arch Leader”, it has more of an upper-class sound. Unfortunately, I’m still extremely short on minions and henchmen, and no Arch Leader can take over the world without those …
I note that you’ve made a claim echoed by a number of others, that we should not disagree among ourselves. In my opinion, our disagreements and our diversity is what distinguishes the alarmist side from the skeptical side. Very, very few of the alarmists will say a single bad word about even egregious scientific malfeasance if it is done by another alarmist. It’s one of the reasons that people don’t trust the alarmists, they recognize defensive behavior when they see it.
So in my opinion it would be a grave error to hide or to diminish our disagreements. Science progresses not in spite of but because of disagreements.
Could we do it in a more genteel and peaceful manner? Sure … in a more genteel and peaceful universe populated by genteel and peaceful scientists. Unfortunately, on this planet, when a person’s world view or their pet scientific ideas are threatened by unassailable evidence, they are likely to not take it well. Their response will generally range from unpleasant attacks to dangerously extreme actions like threatening legal action in Australia, or trying to get their scientific opponent in trouble at their University … to pick an example at random.
The problem, if course, is that science progresses by one scientist proving another scientist’s ideas are wrong. And since a scientist’s job, and income, and professional standing all depend on his ideas being right, as you might imagine, when that is crumbling under undeniable facts, scientists do not go gently into that good night. Instead, they rage, rage against the messenger bringing the scientific light …
So while as you correctly point out, a peaceful dispassionate discussion is far preferable, it’s unlikely to become the norm until we can get some new humans to replace the old models…
My best to you, and thanks for naming me the “Arch Leader”, I’ll try to live up to the honor,
w.
Willis I have forty years of being involved in politics, and one thing we generally do is not complain or put out disagreements publicly about someone who we consider as an ally! However, we might have a quiet word in their ear when they cross the line of credibility! Especially when it does arm the opposition with more bullets to fire at our ideology. And to you personally, I’d rather have you on my side than against me. Take that as a sincere compliment. We need to keep in mind, we need the fighters who will not turn away from adversary and tenacity like a British bull dog. As Winston Churchill said, ‘Never give up, never give up, never give up’ Fight fire with fire, and they will burn themselves out eventually. Anyway must leave to get my birthday present from my son, I just hope it isn’t alive? It is most probably an interesting rock for my bonsai landscapes. Hope it is one I can carry easily this time! Good night Willis, and don’t take any criticism to heart as I won’t from you. You are right, I may be a old gray mare, but she still has a reasonable kick when necessary. LOL. Sincere best wishes always.
Willis Eschenbach said in part June 30, 2014 at 11:18 pm
“ I note that you’ve made a claim echoed by a number of others, that we should not disagree among ourselves. In my opinion, our disagreements and our diversity is what distinguishes the alarmist side from the skeptical side. “
Well said. Wheat and chaff are best sorted by a big wind storm.
Solar cartel found their territory invaded by a newcomer.
Such a fuss, ‘some speak an infinite deal of nothing’, it is turning into a farce.
I’ll say, good luck to the man who dares, for detractors and sideline hecklers it’s time to go and look for another victim.
bushbunny says:
June 30, 2014 at 11:26 pm
True indeed, bushbunny, and it’s the same in the US. It’s one of the many differences between science and politics. For example, Ronald Reagan’s “11th Commandment” was “Never speak ill of another Republican”. And that works well … in politics.
However, when scientists refuse to speak ill of the work of another scientist, science grinds to a halt. If scientists all obeyed Reagan’s commandment regarding each other’s work, science would be over.
In addition, what you recommend is one of the reasons that people don’t trust the alarmists, because they follow your advice—very few of them are willing to speak out publicly even when one of them commits an actual crime, like say Peter Gleick. And while that is exactly what you are proposing, never speak out in public about those on your side … are you quite certain that our best path is to emulate politicians and climate alarmists?
Me, I can’t think of two groups I’d less like to emulate, or two groups less trusted by the public, but of course YMMV …
All the best to you,
w.
“””””…..Pamela Gray says:
June 30, 2014 at 6:12 pm
Dear George Smith, my simple name also has the distinct reputation of internet notariety. From a googled search of my name, I am apparently, by and large, a … tart……””””
Well Pamela, we sort of guessed that much. So welcome to the club.
I seem to have disappeared my self, but find plenty of lookalikes, in the annals of gambling. And my PH Oklahoma chap seems to have also. I had his bio on my computer for years.
I did eventually escape from all the funeral homes, and found myself still on the green side of the grass.
But I had to know exactly where to look. I’m now merely in a list of graduates since 1870.
Well you behave yourself young lady; Tart really ain’t all that bad; almost a character asset.
George
I have been a reader of this blog from the pre climategate era. While I rarely post here, I have at times shared my thoughts.
I believe that Dr S, is an expert on the Sun. I trust Dr S to state his understanding of the best mechanism as he knows it. I am not paying for his comments. I am a consumer of his comments.
While I am personally open to more ideas then Dr S, it’s due to my lack of knowledge of the underlying principles. I have no doubt though, in time the knowledge of our Sun will advance beyond Dr S theories of today. I look forward to that future day. I hope Dr S is still around to eat that crow.
I don’t expect Dr S to ever solve the riddle of the Sun. I believe he, along with Dr Smith are why this site is the number one climate site in the Galaxy based on terrestrial monitoring. Where else can you ask real world experts on topical domain, who are willing to share as these gentlemen do in real time?
Sadly, Dr S & the crowd favorite voice of skepticism have decided to disagree to the point that honorifics were abused to the point that adults have quit acting like adults in public. This mudslinging on both parts have reached a stage that I am sadden to see.
WuWT has in the past been blessed with allowing divergent opinions… To allow the scientific process to develop as it should at nearly the speed of thought. The blog review process is an example of science at its best, not its worse.
I am a bit shocked that a couple of our voices here have reached a stage, where the very fabric of the skeptic process is attacked by the very best voices inside of it.
To be clear Lord M,
America and Americans do not and will never respond to stimuli the same as your own citizens do. I can state that you are attempting to destroy the very fabric of WUWT and its ability to allow “True Voices of Knowledge” a chance for give and take in a public arena with your intentional escalation of events.
The only outcome I can see from this Sir, will be a ugly exchange of legal bills, full broadsides of billable paper shuffling, and in the end, a draining of skeptics funds, until you have Scuttled the very process we are here to embrace, as different parties seek support for their side.
Is the future of skepticism valued so cheap in your heart that you seek to destroy it? If so, know that skeptics like me will step forward to fund and protect non skeptics like Dr S so he has and can maintain the First Amendment Right to Free Speech. Your actions in this case are now changing this to a very clearly Bill of Rights topic and one Americans do pay attention too.
Something a few Americans have died to provide to the rest of our nation and nations like your very own, For example, my Uncle hit the beach in June In France in 44, so people we don’t agree with, have a right to be a cranky old expert we don’t agree with in a white ivory tower. My uncle died in France, so you have the right to attack the freedom of speech enjoyed by all..
Please don’t bifurcate the skepticism process by making us stand up with our wallets and defend the non-skeptics rights to free speech. Because as Americans… WE WILL.
Good Day to each of you,
Sincerely,
Jack H Barnes
“I must say, I am absolutely gobsmacked by Lord Monckton’s threats of legal action and of trying to make trouble for Leif at his university.”
I have stayed out of the arguments thus far, but I agree with Willis. It is one thing to attack Dr Svaalgaard personally (he is a big boy and gives as good as he gets), but threats of legal action are a step too far. Sorry Lord Monckton, but hopefully you will think better of it when you wake up tomorrow.
It appears that several commenters here have underestimated the gravity of the damage that could have been done to Dr Evans’ reputation by the unpleasant allegations made by two or three commenters here. Those allegations go well beyond anything recognizable as civilized discourse.
Nor have I made any threats of legal action. Mr Eschenbach has broken his own rule by stating, incorrectly, that I have. I am not the victim of the libel evident here, so I have no standing to make any such threats. On the contrary, I have explicitly stated that, if the intended but unjustifiable damage to Dr Evans’ reputation persists, he might take the kindlier course of seeking a declaration from the courts that he has neither acted fraudulently nor fabricated data. I am not his legal advisor, and I am most certainly not going to presume to tell him what to do, but, as I have said, I am going to find out what his options are. That is my right: and the very fact of my stating that that is what I am going to do will have gone a long way towards containing the damage to Dr Evans’ reputation from the allegations that have been made. It was no doubt for this reason that my comment was allowed through.
Mr Eschenbach also seems to imply that I oppose the notion that scientists should criticize each other’s work. No, I don’t. However, I do oppose the making of baseless allegations that Dr Evans had fabricated data or deliberately used incorrect data, compounded by the further allegations that the conduct of Dr Evans was “almost fraudulent” and that Dr Evans had an “agenda” – inferentially, in context, an agenda other than that of seeking the scientific truth.
Whether Mr Eschenbach likes it or not, the law applies even to those who call themselves (whether justifiably or not) “scientists”. If they go entirely beyond the bounds of truth and reason, they can and should be held accountable for their misconduct. That is why, whenever I am directly accused of fabrication, and when I am able to demonstrate that whoever alleges the fabrication either knew he was not telling the truth or had no knowledge of whether I had fabricated data or not, I send a polite letter explaining that if the allegation be not withdrawn the courts will hear of the matter; then, if the response does not go far enough towards extinguishing the libel, I sue.
I have just acted thus firmly against an apparently-well-funded science “education” website that had posted up a quite spectacular libel to the effect that I had fabricated a graph, pretended it was an IPCC graph, and distorted the axes. Those who had made the allegation had no basis for it. I wrote and told them so and, within 24 hours, they acted with commendable promptitude and removed the offending item from their website.
Another person has unwisely decided to accuse me of having “faked” that graph. He too has been written to, but has not responded satisfactorily, though his response provides irrefutable evidence that at the time when he made the allegation of fabrication on my part he had not known whether the graph had been “faked” by me or not. He had made the allegation anyway because he had thought, unwisely, that he was entitled in law to jump to the conclusion that because the graph had appeared in connection with an article I had written, I had been responsible for it. I have made it quite plain to him that I had no hand in the selection, preparation, publication or circulation of the graph, which appeared on the page without my knowledge.
The next stage will be for me to track down his address and write to him personally asking for an apology and retraction in all the places (there seem to be several) where he has spread that libel. If he continues to fail to respond to my request, the matter will go to court; and, because he has been unwise enough to reveal that he did not know at the time he made the allegation whether or not it was true, he will have no defense. In the British system of justice, anyone who perpetrates a libel by asserting a calculatedly damaging allegation against the victim without knowing whether the allegation was true is every bit as guilty of libel as a person who knew it was not true, and no amount of excuses about how he thought it was OK to jump to an incorrect conclusion will weigh with the court. The case law on this point is extensive and unidirectional.
Mr Eschenbach, who seems suddenly prone to claim knowledge of various matters that seem beyond his competence, has suggested that in the British system of justice truth is not a defense against a libel claim. In fact it is the standard defense. In my long journalistic career, I was only once accused of libel, because I had reported that an extreme Socialist politician had said various things he did not want anyone to know he had said. He rang to threaten me with libel. I said he had said what I had said he had said. He denied it thrice. I asked him to hold the line while I fetched my shorthand notebook from the store where all the reporters’ notebooks were carefully filed. I read the shorthand note back to him – it was verbatim – and explained to him that it was extremely difficult credibly to fabricate a full shorthand note, which is why the courts, except in the face of the most compelling evidence to the contrary, would accept my shorthand note as a true and accurate record of what the Socialist had said. I explained to him that, though what I had reported him as having said was deeply damaging to him, it did not constitute libel at UK law because it was true, and that by my shorthand note I could establish to the court’s satisfaction, that it was true.
I am in a similar position in the matter of the person who has accused me of “faking” a graph. In this case, I do not even need to provide any proof that I did not fake the graph. All I need do is show the court that the perp alleged simpliciter that I had faked the graph at a time when he had not known whether or not the allegation was true, because in two different places he has admitted as much. In this circumstance, there is no requirement for me to prove that I did not create the graph, which is just as well because I have no idea who created it. The onus will be on the perp to prove that I created the graph, and I know he will be unable to do that because I did not create it.
That, I think, answers Mr O’Neill, who will no doubt act with due circumspection now that he knows how the UK courts would view any further attempts by him to give any support to that particular libel.
Eli Rabett says: June 30, 2014 at 1:30 pm
Steve Keohane says,
“Too bad UV can’t get through the atmosphere, the plants need it to live.”
Nothing at shorter wavelengths than ~305 nm gets through. The problem is, of course, that UV generally refers to < 400 nm, so there is room for hair splitting.
No hair splitting necessary, plants use UV for more than the photosynthesis others have noted.
DR. Archibald shows the CET graph (second) at the top of this article.
UK Met Office just released Min-Max daily temperatures for month of June.
As this graph shows (with Anthony’s permission):
http://www.vukcevic.talktalk.net/CET-dMm.htm
the June CET is still above the 20 year average.
Monckton of Brenchley says:
July 1, 2014 at 1:53 am
However, I do oppose the making of baseless allegations that Dr Evans had fabricated data or deliberately used incorrect data
You still do not get it. Both Willis and I have shown that Mr Evans did exactly that. A very important part of doing science is to conduct ‘due diligence’ [look it up, if you are unfamiliar with the term]. Not doing due diligence is a very deliberate act.
and that Dr Evans had an “agenda”
may I remind you of
Monckton of Brenchley says:
June 29, 2014 at 2:24 pm
Mr Svalgaard is using incorrect data. Plainly he has an agenda.
You, Sir, actually owe me an apology, but with your flexible morality I’ll probably will not live to see any.
Monckton of Brenchley says:
July 1, 2014 at 1:53 am
Nor have I made any threats of legal action. Mr Eschenbach has broken his own rule by stating, incorrectly, that I have.
And yet you are consulting your lawyers and talking about damages so what’s one to understand from that? It certainly sounds like a threat:
Monckton of Brenchley says:
June 30, 2014 at 4:16 pm
“For my part, I am referring Mr Svalgaard’s long list of malicious comments about Dr Evans (but not about me: I give as good as I get) to his university, which will know best how to handle the matter, for there is a rather delicate aspect that I am not at liberty to discuss here. The university will most certainly realize that the do-nothing option is not an option. The libel is too grave and too persistent. My lawyers are looking at it tomorrow to see whether malice is present, in which case the damages would triple, to say nothing of the costs. Their corresponding lawyers in the U.S. will be giving advice on whether Dr Evans would count in U.S. law as a “public figure”,
Mr Eschenbach, who seems suddenly prone to claim knowledge of various matters that seem beyond his competence, has suggested that in the British system of justice truth is not a defense against a libel claim. In fact it is the standard defense.
And yet the UK government saw fit to introduce legislation regarding libel a couple of years ago, saying:
Clarke, unveiling the draft bill on Tuesday alongside minister of state for justice Lord McNally, said the bill would “ensure that anyone who makes a statement of fact or expresses an honest opinion can do so with confidence”.
“The right to speak freely and debate issues without fear of censure is a vital cornerstone of a democratic society,” he added.
“In recent years, though, the increased threat of costly libel actions has begun to have a chilling effect on scientific and academic debate and investigative journalism.”
The bill includes a new statutory defence of truth which will replace the current common law defence of justification. It also includes a statutory defence of honest opinion replacing the current common law defence of fair and honest comment.
It is my understanding that the law was passed in January so once existing cases work through the system it will indeed be true that: It is a defence for defamation to show the imputation in the statement complained of is substantially true.
Also: It is a defence for defamation, to show the statement complained of was a statement of opinion. That it indicated in general or specific terms, the basis of the opinion. That an honest person could have held the opinion on any fact which existed when the statement was published, including any fact in a privileged statement that was pre-published.
It also includes the provision: A court does not have jurisdiction to hear and determine any action, unless the court is satisfied that, of all the places in which the statement complained of has been published, England and Wales is clearly the most appropriate.
Should Monckton wish to confirm this the bill is known as the ‘Defamation Act 2013 (c 26)’.
cannot we get everyone off their high horses and return to the science? Are we all agreed here now that TSI is not a good proxy for temperature on earth?
“Phil. has failed to quote me in full. He has – perhaps by inadvertence – omitted my statement that it would be kinder, should the damage caused by the libels against Dr Evans persist, for him to seek a declaration (which in Scotland we call declarator) that he has not deliberately used incorrect data or fabricated any data. And I had also made it plain that the Australian courts would hear such a case. The new UK defamation law that “Phil.” mentions above does not apply in Australia.
Though the truth defence was called “justification” before, it was different from the new defence of “truth” only in technical respects that have little bearing here. Truth has aye been the standard defence against libel claims in UK law.
And those who falsely allege that Dr Evans had fabricated data (whether this was indeed their opinion or not) would not be able to plead the “opinion” defence (this used to be called “fair comment”. The reason is that they are making an untrue allegation as to fact, as a posting at Joanne Nova’s website on the matter of the spectacular fall in TSI now makes clear to all but the most malevolently prejudiced. Red faces all round, I think.
Can somebody perhaps show me the graph of global temperature or rate of change in temperature versus TSI? The right TSI graph please, if it exists?
Gee whiz, Mr. Monckton, you sure do use a lot of words to say “I gone told your momma you fibbed! Now I done give you a whole lotta chances to take back what you said about my good friend. You didn’t, and now you is gonna get whats you got coming!”
Your journalism career shines through in all of this, like pyrite in a pigsty, following the same journalistic traditions as historical newspaper giants such as New York World, New York Journal, and the historic and contemporary New York Times. A truism for the modern and future ages: “Never pick a fight with people who buy their electrons by the barrel.”
All this argy-bargy and you-did-it-no-you-did-it back and forth debate is a distraction.
The important question is : is the suggested model correct. In my opinion is it not only wrong, it is a blatant distortion of the scientific method. From my reading of this thread it seems that David Evans argued thusly,
1. There is a detectible 11 year periodicity in the sun’s TSI.
2. There is no detectible equivalent variation in the Earth’s climate.
Now some people might argue with 2. but this is what was said. Then, following on,
3. But there should be an 11 year signal.
and therefore
4. So something must be blocking it
and
5. By analogy from circuit theory a “notch filter” is defined which is cutting out the 11 year signal, and by a bit of curve fitting a form is devised for this, which unfortunately requires a postulated unknown force.
Now Dr Svalgaard points out that this curve fitting is using the wrong data, so it is not just a curve fitting, but a meaningless fitting. However I think the whole procedure should never have passed point 3. as this is not an observation nor a justifiable hypothesis – it is a desired outcome, which has been inserted into the scheme, and has no part in science.
It is easy to create models that eliminate cyclic inputs. You can design such models both in time domain or frequency domain, its equal. The real question, is whether a model fits to the empirical measurements and the amount of data in relation to the number of adjustable parameters.
@vukcevik
thanks for those CET graphs
where do you get the insolation data (London) from?
HenryP says:
July 1, 2014 at 7:31 am
where do you get the insolation data (London) from?
Hi Henry
There are number of sources, the simplest is:
http://sunsprite.co.uk/?p=guides/energy_calculator
Solar Irradiance calculator (at the far right on the page)
Select country, town, select any direction and click on the ‘Flat surface’
I think I’ve never heard so loud
The quiet message in a cloud.
I’m sure the Nobel is simply lost in the mail. It’s terribly overdue.
============
Meh, Garbage In, Falsifiable Prediction Out. If it’s not falsified, then we can argue whether he was lucky or prescient.
===============
HenryP said on July 1, 2014 at 7:00 am:
HadCRUT4 global surface mean vs PMOD composite, whole years for temp for trend, all the data with no trend for TSI (too few cycles), TSI offset by mean of all data for alignment. Note WFT does not have the latest PMOD numbers.
http://woodfortrees.org/plot/hadcrut4gl/from:1979/to:2014/plot/hadcrut4gl/from:1979/to:2014/trend/plot/pmod/offset:-1365.9
Rate of change of temperature vs TSI, with the trend line of the derivative to indicate acceleration.
http://woodfortrees.org/plot/hadcrut4gl/from:1979/to:2014/derivative/plot/hadcrut4gl/from:1979/to:2014/derivative/trend/plot/pmod/offset:-1365.9
WFT reports “#Least squares trend line; slope = -5.67859e-05 per year”, so if you’re not picky about significance you might say the rate of the rate of temperature increase has been slowing, with even more CO2 in the atmosphere the Earth is not warming as fast.
I repeated with UAH and got “slope = -3.8594e-05 per year”.
Back at HadCRUT4, scaling the temp-related by 5 allows for comparison but would have messed up the derivatives so I presented those first. Here’s the scaling. Note the clear correlation.
http://woodfortrees.org/plot/hadcrut4gl/from:1979/to:2014/scale:5/derivative/plot/hadcrut4gl/from:1979/to:2014/scale:5/derivative/trend/plot/pmod/offset:-1365.9
Henry@vukcevic
That is a calculator. If there is no actual measurement done,[in London], it is worthless.
In that case, do not be relieved into finding that it is not globally cooling [by looking at CET only]. It is in fact globally cooling. CET just runs opposite the [global] wave. I knew that because I looked at CET, too. I think it has something to do with the weather.More rain and clouds cause a natural GH effect, causing a warming effect during a global cooling period [in London, also Washington DC].
Monckton of Brenchley says:
July 1, 2014 at 6:55 am
And those who falsely allege that Dr Evans had fabricated data
That is a demonstrable fact, already admitted to by Mr Evans himself.
as a posting at Joanne Nova’s website on the matter of the spectacular fall in TSI now makes clear
The other fact is that there is no spectacular fall in TSI as Mr Evans falsely claims.
Red faces all round, I think.
I can’t see yours, but am sure is on the purple side.
I have to say, apart from over-reacting to the demonstrably ridiculous remark by Lief Svalgaard that Dr Evans was “almost fraudulent” Christopher Monkton’s remarks are pretty reaonsable.
I am absolutely amazed at the position Willis is taking on this. He has insisted repeatedly that Dr Evans… “He refuses to reveal the data” (that’s a direct quote)…. when he explicitly has said that he will. If his position were to say that he should not have discussed anything about the model publicly until the data and code was ready to be published then that is one thing, but to continually pretend that he is “refusing” to and therefore behaving like Michael Mann is just absurd and completely at odds with reality.
Why is it unreasonable to canvas opinion and thoughts regarding this endeavour AHEAD of publishing and finalizing all the data and code?
Is it unreasonable because it was public? Is it not a valid reason that the data and code is not released yet because it is not ready, requiring perhaps some tidying up updating of code, checking for bugs, typos, missing meta-data, all the various things that could be missed in what appears to be a very large project?
Would a deadline help perhaps – if he knew it was coming by a certain date?
And it’s clear that if Dr Evans has been using the “wrong” TSI data as Lief contends then when the model is published he’ll be able to put the “correct” TSI data in and say something about how to falsify the model using that data instead of the data he objects to.
It’s clear as day to me as a completely disinterested outsider (I have absolutely no dog in this fight at all) that the positions of Willis and Lief on this are 1) utterly unreasonable 2) completely missing the point of what is being attempted by Dr Evans.
Like many here, I used to come to WUWT to read the many interesting analyses of in particular Willis’s – but after the debacle with Tony Brown aka climatereason (I’m still amazed he didn’t know who he was) and now this, I am afraid my estimation of him has dropped to the level of a William Connelly or a Tamino where I will always suspect some agenda behind an analyses.
It looks very similar to the “alarmist” scientists we so often complain about – hubris. Too quick to take a position before fully understanding the complexities of the issue and digging in the heels when that lack of understanding leads to incorrect and biased conclusions.
Monckton of Brenchley says:
July 1, 2014 at 6:55 am
“Phil. has failed to quote me in full. He has – perhaps by inadvertence – omitted my statement that it would be kinder, should the damage caused by the libels against Dr Evans persist, for him to seek a declaration (which in Scotland we call declarator) that he has not deliberately used incorrect data or fabricated any data. And I had also made it plain that the Australian courts would hear such a case. The new UK defamation law that “Phil.” mentions above does not apply in Australia.
Indeed, but you were particularly criticizing Willis’s characterization of ‘the British system of justice’
Though the truth defence was called “justification” before, it was different from the new defence of “truth” only in technical respects that have little bearing here. Truth has aye been the standard defence against libel claims in UK law.
I’ll take McNally’s statement over yours.
@Kadaka
the correlation is negative:
http://woodfortrees.org/plot/hadcrut4gl/from:1979/to:2014/plot/hadcrut4gl/from:1979/to:2014/trend/plot/pmod/offset:-1365.9/plot/pmod/offset:-1365.9/trend/plot/none
I already had figured something like that
The satellites are measuring TSI data to be 0.3 W/m2 to 0.5 W/m2 lower at this current solar cycle maximum.
And that is just the facts jack. Now one can argue all one wants that all the numbers should be “reconstructed” this way or that way. But the numbers are down.
And they are lower than they were at the last solar peak in 2000 to 2001. So when did it start falling? Well, that would have to be after 2001 or 2002 or so wouldn’t it.
HenryP says:
July 1, 2014 at 8:28 am
the correlation is negative:
http://woodfortrees.org/plot/hadcrut4gl/from:1979/to:2014/plot/hadcrut4gl/from:1979/to:2014/trend/plot/pmod/offset:-1365.9/plot/pmod/offset:-1365.9/trend/plot/none
The PMOD series is not correct. The sensor has uncorrected degradation and the extra deep minimum in 2008 did not happen. The fact is that there is no difference between the 2008 and 1996 minima, as admitted by W. Schmutz,: http://www.leif.org/research/Monckton-Flaw-4.pdf
This fact, obviously, has implications for the false claim by Mr Evans [and now by Mr Monckton] that there was a spectacular fall in TSI. This is all old hat, and should have been clear to any competent scientist during the necessary due diligence [which was clearly not done by Mr Evans for reasons or motives he should explain himself].
Bill Illis says:
July 1, 2014 at 8:42 am
The satellites are measuring TSI data to be 0.3 W/m2 to 0.5 W/m2 lower at this current solar cycle maximum.
Than when? Mr Evans falsely claims since 2003-2005 and that is not correct as everyone can plainly see:
http://www.leif.org/research/Monckton-Flaw-3.png
And, of course, TSI is lower now than at the previous maximum as TSI simply follows the sunspot number, but that is irrelevant for the discussion and for the demonstration of Mr Evans’ false assertions.
Leif, can we trust this picture from Gregg Kopp, showing a very slight decline in TSI since 1980?
http://spot.colorado.edu/~koppg/TSI/TSI_Composite.jpg
MikeUK says:
July 1, 2014 at 9:08 am
Leif, can we trust this picture from Gregg Kopp, showing a very slight decline in TSI since 1980?
You can always trust Gregg Kopp. The decline since 1980 simply follows the similar decline of the sunspot number. The point of notice is that the SORCE/TIM data [red] does not support Mr Evans false claim that TSI has dropped spectacularly since 2003-2005.
Look, the sun is a likely candidate, that there is a delay is not improbable. Leif, you’ve looked for an amplifier for TSI for years. If Evan’s method pulls predictability from the garbage(unknowably wrong TSI and temperature reconstructions) then that is a big clue. As is hemispheric asymmetry of the sunspots.
============
MikeUK says:
July 1, 2014 at 9:08 am
Leif, can we trust this picture from Gregg Kopp, showing a very slight decline in TSI since 1980?
You can always trust Gregg Kopp. The decline since 1980 simply follows the similar decline of the sunspot number. The point of notice is that the SORCE/TIM data [red] does not support Mr Evans false claim that TSI has dropped spectacularly since 2003-2005. You may also consult the latest TCTE/TIM data [blue] also showing that there is no spectacular drop of TSI.
[Leif: Delete this dupe? .mod]
kim says:
July 1, 2014 at 9:14 am
If Evan’s method pulls predictability from the garbage(unknowably wrong TSI and temperature reconstructions) then that is a big clue
From garbage you do not get predictability, only more garbage. So no ‘big clue’, except perhaps for the clueless.
ls, @ 9:17. I don’t think that is necessarily true.
===========
Those who persist in pretending that Dr Evans is wrong about the decline in solar activity since 2003 might care to look at his latest posting at Joanne Nova’s website.
Heh, it all depends upon what the meaning of ‘garbage’ is. I doubt the reconstructions are random garbage.
===========
Monckton of Brenchley says:
July 1, 2014 at 9:20 am
Those who persist in pretending that Dr Evans is wrong about the decline in solar activity since 2003 might care to look at his latest posting at Joanne Nova’s website.
It would be useful if you give an exact URL or other reference. Wading through it all to find occasional gems is a tedious exercise.
kim says:
July 1, 2014 at 9:19 am
ls, @ 9:17. I don’t think that is necessarily true.
Too thin. What URL?
Monckton of Brenchley says:
July 1, 2014 at 9:20 am
Those who persist in pretending that Dr Evans is wrong about the decline in solar activity since 2003 might care to look at his latest posting at Joanne Nova’s website.
Those who persist in pretending that Mr Evans is right about the decline in solar activity since 2003 might care to look at the actual measurements of TSI
http://www.leif.org/research/Monckton-Flaw-3.png and
http://spot.colorado.edu/~koppg/TSI/TSI_Composite.jpg
Agnostic says:
July 1, 2014 at 8:21 am
“I am absolutely amazed at the position Willis is taking on this. He has insisted repeatedly that Dr Evans… “He refuses to reveal the data” (that’s a direct quote)…. when he explicitly has said that he will.”
———————————————————————————————————————-
I once served on a civil jury where the plaintiff’s lawyer, in his opening statement, told us the “facts of the case” and that he would present evidence to prove that his facts would indeed support his conclusion of liability. While there were constant referrals to these “facts”, I did not hear or see any evidence to support the lawyer’s conclusion at all. He even used a distorted fact, one he hoped the jurors wouldn’t notice. He was almost successful in pulling the wool over the eyes of some jurors until I was able to bring in expert knowledge to easily show that they had not proven anything but that their case was based on the hope that the jury would accept the distorted fact and then come to a predictable conclusion in favor of the plaintiff.
My point being that saying you will reveal the data is far from actually revealing it, especially when the facts used in producing your conclusion are questioned.
(PS – for the curious the distorted fact was implying that a practicing, private physician with hospital privileges who was on weekend call was up and working 72 straight hours such as a resident physician does. The assumption was that common people would not know the difference and after watching numerous TV shows about physicians in residency would conclude he must have been overtired which lead to a wrong medical decision and thus liability. What makes it worse is that the medical decision was proven to be correct; a fact the plaintiff’s attorney never acknowledged but rather just kept on referring to it as an incorrect decision based on being over tired. )
Lief says
http://wattsupwiththat.com/2014/06/28/a-cool-question-answered/#comment-1674003
@Leif@Bill illis
Thanks Leif for that last comment. I knew about those problems with sensors and consequently did not trust TSI. I don’t have a clue how you can sense radiation <350 nm that simply destroys everything….
I refer to my previous comments made on this thread: I find that there is absolutely no influence of CO2 [on minimum temperatures]. In fact, I donot even trust most global temp. data sets [except my own] because I think they are not properly globally representative/ balanced. Unfortunately, for myself, I therefore have to reject the "Evans model" out of hand. I don't know of anyone here who supported it anyway – it seems even Lord M does not really understand it [the mathematics] , if I heard him correctly. Realizing that we are looking at non-linear processes, the best correlation I did find is the drop in the rate of change in maximum temperatures versus the drop in the solar magnetic field strengths. The drop in [solar field strength] comes from the deadstop top in 1972 to an apparent minimum in 2016/ at least that date, give or take a year, is what my various calculations and planetary positions imply. Something has to switch on the sun, to get the field strengths going up again. It looks like an electrical switch. The question I have, what is pulling that switch?
Leif, GIGO is a platitude. Don’t depend upon it in all cases.
==========
HenryP says:
July 1, 2014 at 9:35 am
Thanks Leif for that last comment. I knew about those problems with sensors and consequently did not trust TSI. I don’t have a clue how you can sense radiation …
That you don’t have a clue, does not mean that other people are clueless. TSI is today measured very precisely and there is no doubt about the results since 2003.
kim says:
July 1, 2014 at 9:39 am
Leif, GIGO is a platitude. Don’t depend upon it in all cases.
Well, carefully constructed garbage will give you other garbage that might show what you intended by manipulating the input garbage.
Meh, Leif, unresponsive to my point, and tangentially obnoxious and catty. Meow!
==============
Those who persist in pretending that Dr Evans is right about the decline in solar activity since 2003 might care to appreciate that the decline – as Dr Evans made explicitly clear on the graph that is for some unknown reason complained of – is in 11-year-smoothed TSI.
kim says:
July 1, 2014 at 9:53 am
Meh, Leif, unresponsive to my point, and tangentially obnoxious and catty. Meow!
I didn’t see where you had a point. Could you explain “If Evan’s method pulls predictability from the garbage…”
Henry says
Meh, Leif, unresponsive to my point, and tangentially obnoxious and doggy. Woef!
@Kim
we know him like that, when he does not know it himself?
The point is, Leif, that the reconstructions are tainted, just how is unknown. They are not completely garbage. If Evan’s method pulls predictability out of that mess, that means something. Note the ‘if’.
=================
Monckton of Brenchley says:
July 1, 2014 at 9:54 am
Those who persist in pretending that Dr Evans is right about the decline in solar activity since 2003 might care to appreciate that the decline – as Dr Evans made explicitly clear on the graph that is for some unknown reason complained of – is in 11-year-smoothed TSI.
Those who persists in pretending that Mr Evans’ 11-yr smoothed TSI are meaningful should appreciate that an 11-yr smooth to be meaningful must stop 5.5 years before the end of the data. Furthermore, real data is always better than botched smoothed data
http://www.leif.org/research/Monckton-Flaw-3.png
From lsvalgaard on July 1, 2014 at 8:43 am:
At ftp://ftp.pmodwrc.ch/pub/data/irradiance/composite/DataPlots/org2pmod_composite.dat it says it contains:
Thus I’m wondering which of the components is suspect. It was mentioned before ACRIM is erroneous. But there is this recent paper at arXiv by Nicola Scafetta and Richard C. Willson (grain of sea salt, anyone?) titled ACRIM total solar irradiance satellite composite validation versus TSI proxy models and stating in the abstract:
Thus these changes to ACRIM have not propagated to the PMOD composite values at WFT as they do not have the latest values.
Was ACRIM the sole major problem with the PMOD composite thus a correct fix is in the pipeline?
Or have I just completely misread the abstract, the official ACRIM series was not changed, and this is just an intellectual exercise of Scafetta and cohort? After all, the abstract does conclude:
kim says:
July 1, 2014 at 10:00 am
The point is, Leif, that the reconstructions are tainted, just how is unknown.
We have made great progress in understanding TSI and how to reconstruct, so to say that the errors are ‘unknown’ is much too strong. Of course, if you use older versions and make your own data then that is another story, but then not much of value can be extracted.
kadaka (KD Knoebel) says:
July 1, 2014 at 10:06 am
Thus I’m wondering which of the components is suspect.
PMOD is as I have shown and as the institute producing PMOD has admitted.
[PMOD = ? .mod]
Forget about the meagre changes in the TSI, head north to the Arctic.
Every meteorologist knows that the N. Hemisphere’s weather is dictated by what is going in the Arctic and its atmospheric pressure as it is shown here. .
.
kadaka (KD Knoebel) says:
July 1, 2014 at 10:06 am
Thus I’m wondering which of the components is suspect.
PMOD is as I have shown:
http://www.leif.org/research/PMOD%20TSI-SOHO%20keyhole%20effect-degradation%20over%20time.pdf
and as the institute producing PMOD has admitted:
http://www.leif.org/research/Monckton-Flaw-4.pdf
Leif, I have great respect for your knowledge, and suspect your reconstruction is the best, but regret it if you’ve developed in a world without unknown unknowns.
================
kim says:
July 1, 2014 at 10:38 am
Leif, I have great respect for your knowledge, and suspect your reconstruction is the best, but regret it if you’ve developed in a world without unknown unknowns.
It was developed in a world with known knowns. And as to the unknown unknowns, I’ll quote Wittgenstein: Wovon man nicht sprechen kann, darüber muß man schweigen.
Whereof one cannot speak, thereof one must be silent.
lsvalgaard said in part July 1, 2014 at 10:00 am:
“ Those who persists in pretending that Mr Evans’ 11-yr smoothed TSI are meaningful should appreciate that an 11-yr smooth to be meaningful must stop 5.5 years before the end of the data. Furthermore, real data is always better than botched smoothed data “
Absolutely. There is a too-common false impression that smoothed data are “better” than original data. In truth, it is no longer even data. The problem is of course greatly magnified at the ends. There are suggested “methods” of dealing with the end effects: windowing, padding with some averages, mirroring, mirroring and inverting, etc., all of which further remove us from reality. The inevitable nonsense is accompanied by a “menu” of outcomes against which our favorite theories are differently supported or disconfirmed. Real data please!
What amazes me is when a potential source for climate change is talked about how so many try to say wrong this can not be because the climate is not responding the way it should.
The problems with this line of reasoning are the climate first has noise in the system which can obscure a potential source producing climate change. Noise is always present. An example would be a strong ENSO EVENT, or a random large volcanic eruption.
Next is the climate has thresholds which when reached could cause the climate to change in a major way while if approached and not reached may cause very little
change to the climate. An example would be a increase in sea ice if it reaches a certain critical mass it has a major climate effect, if it increases but does not reach that critical mass it has a small effect or no effect. The same for snow cover and clouds perhaps. (albedo change)
Next are lag times . A potential source could be having a climatic effect but because of lag time needed the effect may not show up until several years later. This then complicates matters by obscuring a possible correlation. Ocean Heat Content change comes to mind.
Next the initial state of the climate can cause a potential source for climate change to have a big impact or a very small impact. If the initial state of the climate is such that it is near the threshold value of glacial versus inter- glacial then a potential source for climate change could have an a big impact. If on the other hand if the initial state of the climate is firmly in a glacial state or inter-glacial state then a GIVEN change in a potential source for climate change may have no impact or very little.
Next the climate is random and chaotic which means a potential source for climate change if it happens in the correct location on earth or correct part of the atmosphere could have a either a big impact or no impact, or it could result in positive feedbacks or negative feedbacks.
Next the initial state of the arrangement of the oceans and land masses have to be evaluated which can have a big impact on how much climate change a potential source for climate change could have.
The point of all of this is do not expect x plus x to equal x outcome and do not expect a given change in a potential source for climate change to give a given climate result in a given period of time and hence right it off as a non climate change player as so many keep doing. .
Since Mr. Monckton is clearly one who keeps count of apologies let me apologize in advance for whatever future slights he may perceive that humblest i may do to him when and if I take the time to comment upon his commentary. In this present marathon, Mr. Monckton surprised me and I imagine others with this really well-put observation:
“At present, the world’s governing class has discovered that, thanks to the near-universal scientific and mathematical ignorance to which generations of State-controlled education has reduced the populace, it can manufacture scientific scare stories as justification for a vast centralization of power in the hands of new supra-national bodies elected by nobody.”
I am not sure what this opinion has to do with in a debate by climate specialists about a TSI model, but that seems to be the pattern with perhaps 97% of the commentary posted by Mr. Monckton, so who am humblest i to complain?
Especially given Mr. Monckton’s lordly succinct summation of the presently stymied United States when it comes to climate change.
Indeed, the US educational “system”, which is controlled by the individual US States, has a pitiable record of performance, particularly in science and math teaching. And Mr. Monckton is correct again that this State incompetence seems to account for the susceptibility of a very large proportion of the US populace to the scare stories regarding global warming and climate change conspiracies propagated by the Heartland Institute among others. And, most tellingly of all, in my view, Mr. Monckton has witheringly explained how the ignorance and gullibility of these mis-led Americans has enabled the “vast centralization of power in the hands of new supra-national bodies elected by nobody”, namely the international fossil fuel industries and their institutional allies.
Well expressed, Mr. Monkcton!
Now, you get a little silly, Leif. Clearly, you’ve developed with an understanding that ‘unknown unknowns’ exist. So why your certainty about your reconstruction?
=====================
kim says:
July 1, 2014 at 10:51 am
Now, you get a little silly, Leif. Clearly, you’ve developed with an understanding that ‘unknown unknowns’ exist. So why your certainty about your reconstruction?
first, one is never ‘certain’, only ‘less uncertain’. second: we have learned a lot about how the measure TSI and what TSI depends on. This knowledge goes into the reconstructions, which then as time goes on become as better and better approximation to what we believe is the elusive ‘truth’.
Whereof one cannot speak truly, thereof one can speculate.
==============
leif says
http://wattsupwiththat.com/2014/06/28/a-cool-question-answered/#comment-1674096
henry@Kim
clearly, you must realize that dr.S does not know everything.
we saw that
he really has no idea how to measure radiation less than 350 nm, never mind the variation in that type of radiation over time
he has no idea what is causing the decrease in solar field strength nor what will turn it up again
he has no idea what is happening TOA, or at least pretends not to know.
However, we all know that scientists’ biggest problem with nuclear fusion is that a spectacular magnetic field is required to contain the heat. Hence, my theory that it is the declining solar field strength that is causing more energetic particles being released. These photons react TOA with O2 and N2 and H2O to form more ozone, nitrogenous oxides and peroxides. In turn, these substances absorb and re-radiate some of the important other incoming radiation [that heat the oceans], hence more back radiation of sunlight to space, hence more cooling. So, paradoxically, a brighter sun, causes a cooler sun.
This is not “my” theory. I have proven that ozone is increasing, since 1995. Trenberth has admitted that ozone on its own is responsible for about 25% of all that is back radiated to space by the atmosphere. In fact, it was Lief who showed me that paper. Unfortunately, Trenberth forgot about the peroxides and nitrogenous oxides also being formed TOA by the type of sun rays that would kill us if it came through the atmosphere. That is what is called: Trenberth’s missing energy….
kim says:
July 1, 2014 at 11:08 am
Whereof one cannot speak truly, thereof one can speculate.
Which is fine, as long as it is clearly labeled as ‘speculation.
I do it all the time slide 17 of http://www.leif.org/research/Eddy-Symp-Poster-2.pdf
From lsvalgaard on July 1, 2014 at 10:34 am:
Yes, the PMOD composite has degradation. You mentioned SOHO in 2010, although “org2pmod_composite.dat” from Nov 2, 2011 does not list SOHO as incorporated in the PMOD composite.
I do see starting at 20010927 the only series in PMOD is VIRGO, thus that is where the problem lies.
http://www.pmodwrc.ch/pmod.php?topic=tsi/virgo/proj_space_virgo
Ah, now I see it!
So VIRGO is at fault, and is an experiment on SOHO. To fix PMOD they have to correct the VIRGO results. Got it.
Can Michael Mann use the defence that he didn’t actually prepare his famous graph and that it was all down to a minion at the journal?
If his lordship did not draw up the graph, there are some questions that need answering:
Who did come up with the bad graph?
Why did Lord Monckton not ask the Telegraph for a correction to be printed?
Did Lord Monckton have no prior sight of the article at all, to proof read? Was he not asked about visuals?
In answer to Ms. Hardman, it will be for the individual who alleged that I had “faked” a graph, when that individual has since admitted that he did not know at the time of the allegation whether I had “faked” the graph or not, to provide proof that I had faked the graph. Since I had not done so, he will have no defence. The courts have no patience with those who make damaging allegations without knowing whether they are true.
Monckton of Brenchley says:
July 1, 2014 at 12:12 pm
In answer to Ms. Hardman,…
Why are you avoiding answering Ms Hardman’s three questions?
Who did come up with the bad graph?
Why did Lord Monckton not ask the Telegraph for a correction to be printed?
Did Lord Monckton have no prior sight of the article at all, to proof read? Was he not asked about visuals?
Here is your chance to come clean. Answer the questions.
Margaret H makes it clear that her complaints are a tempest in a teapot. She is merely piling on.
Consider Michael Mann’s widely debunked runaway global warming chart. Mann has never provided the data, methods, metadata and methodologies necessary to allow the Scientific Method to operate. $Billions are wasted every year, due in large part to Mann’s ridiculous propaganda chart, in which he deleted the MWP and the LIA.
But never one word from Margaret or anyone else in her crowd about that pseudoscientific nonsense chart, which has no connection to reality. Furthermore, scientific skeptics cannot ask questions like that at alarmist blogs. They get censored out of existence.
That shows that the motivation of the alarmist crowd is due to one of three things: self-serving self interest, such as Mann’s, or politics based on ignorance, or religious belief. Often a combination of the latter two.
Attempting to distract from Mann’s self-serving scare chart is the basic motive here. To resolve the dispute, I propose a fair, moderated debate in a neutral venue between Lord Monckton and Michael Mann. Guess which one will chicken out.
dbstealey says:
July 1, 2014 at 12:29 pm
I propose a fair, moderated debate in a neutral venue between Lord Monckton and Michael Mann.
They will probably end up suing each other for all kinds of unholy behavior. Would be fun to watch.
Regarding the Lean TSI reconstructions, it was posted on WUWT in 2011 (bold added):
There is a link there provided by Leif, however it is currently open access from Wiley:
http://onlinelibrary.wiley.com/doi/10.1029/2010GL045777/full
As Lean has adjusted her model, this adds further doubt on her reconstructions to what was pointed out earlier by Leif.
Leif,
You may well be right. But I am no fan of lawsuits. They should never enter into science debates, by either side.
Friends:
Please, enough.
People I have learned to respect are tearing each other apart. This is not good.
Watching it happening hurts.
It is good to disagree. It is not good to be disagreeable. Please, enough.
Richard
This thread represents the moment when the entire CAGW debate has jumped the shark. I feel like taking a long hot shower.
“Can Michael Mann use the defence that he didn’t actually prepare his famous graph and that it was all down to a minion at the journal?”
Of course not, Mann wrapped his hands around that mighty stick and loudly declared to the world it was all his own ages ago. To say otherwise now would be admitting to plagiarism. And that maybe the tip is fake. And the significance was inflated. And that the real stimulation value was woefully overstated. With real data and realistically evaluated, it is hardly noticeable, the Hockey Stick is a Bent Twig.
So much angst over such a small and very uncertain portion of a large number.
Two highly intelligent men that never heard of the phrase: “we agree to disagree”.
Dbstealey, you and I bicker so much people are surprised to learn we aren’t married to one another.
I posed three honest questions. The article that contained the graph in question was followed a week later by another in the Telegraph authored by Lord Monckton. There was an opportunity to disown the graph then and print a clarification but the opportunity was missed. I don’t know who draw up the diagram. I gave Lord Monckton a chance to give a definitive answer but, given an open goal, he missed. I don’t know why he chose to pass the buck, perhaps it was because the questions came from me.
If the answers are (1) a graphic designer at the Telegraph, (2) did ask for one but newspaper, (3) yes, but not the visuals, then there is nothing to argue against. Waving about courts and fakes isn’t helpful and does not help Lord Monckton’s case.
Whoops. (2) should have said did ask for one but newspaper refused.
Monckton of Brenchley says:
July 1, 2014 at 9:54 am
No comment on his ugly threats of legal action, no comment on his ugly threats to screw up Leif’s employment … ah, well.

In any case, so I go there, and I find this:
Unfortunately, Dr. Evans gives the following sources for his main claim, vis:
The first one goes to a KNMI page that says nothing about Lean or TSI.
The second link goes to the Lean TSI reconstruction up to 2008. I have no idea what he means by “WMO FUB TSI Data”, as it is a reconstruction, one that everyone agrees is faulty.
The third link goes to “Page not found”.
The fourth reference doesn’t have a link. Despite the existence of actual TSI data for the period, this is another model-based “spectral reconstruction”. Bizarrely, however, there are only three references on Google for that title, one of which of course is Dr. Evans post. The second one is the only one giving further data. It lists the following:
Unfortunately, none of those reconstructions go up to the present … nor has Dr. Evans said which of the various Lean reconstructions he is using.

Now, Dr. Evans is using a “composite” TSI index, using some unspecified splice at the end of the faulty Lean reconstruction. It is described only as “averaging Lean 2000 (to the end of 2008), PMOD, and ACRIM (from the start of 1992)”
Unfortunately, he doesn’t say exactly how he’s doing that, or why he’s thrown away the early part of the ACRIM data … and as you can see, the ACRIM, PMOD, and Lean datasets are staggeringly different …
Next, both the PMOD and Lean datasets have been admitted BY THEIR DEVELOPERS to be faulty … a fact which Dr. Evans somehow neglected to explain.
And once again, Dr. Evans has not released either his code as used or his data as used. Oh, I’m sure Lord Monckton will pop in to tell us that Dr. Evans will release it “someday” … but someday doesn’t pay the bills today.
Until that day comes, Dr. Evans hasn’t said whether he’s used some kind of weighted average of PMOD, ACRIM, and Lean data, or a straight average, or what. Actually, it appears from the data that he’s used an 11-year average of the 11-year average of each of the three datasets … but it’s not at all clear.
In fact, we’re back into the same old position—by not posting his code as used and his data as used, Dr. Evans has provided nothing but an advertisement for his claims. With no data as used, and no code as used, we have no way to falsify anything he’s done, and as a result, it’s not science in any form, it’s just an ad. He claims that everything is explained by the fact that he’s using an “11-year average” … but he’s neglected to say what kind of 11-year average he’s using, nor has he revealed how he has extended that average all the way up to 2014 … I’m sorry, Lord Monckton, but that is just as shabby an imitation of science as were his previous posts. While Dr. Evans may be correct, at present, there’s no way to determine whether he is correct or not.
Finally, none of this touches the sheer foolishness of using an 11-year “boxcar” average of a system which has an inherent cycle which varies from 9 to 14 years or so … that method is guaranteed to alias some portion of the frequency information into the amplitude. Take a look at what an 11-year boxcar average does to the sunspot data:
Note that from 1760 to 1790, the 11-year average actually inverts the data, putting peaks where there are troughs and vice versa … while at other times the average runs in parallel with the sunspot data. Not only that, but often, it shifts the timing of the peaks and troughs backwards and forwards.
This is a result of the fixed frequency of the average and the varying frequency of the data, which goes both above and below the frequency of the average. In fact, you likely couldn’t invent a filter which would do more damage to the sunspot (or TSI) data … yet that is what Dr. Evans is using.
It also doesn’t touch the problem that a centered 11-year average contains information about the future … and as a result, using it in a predictive model is cheating.
But then, because he hasn’t revealed his secret code for the analysis, of course we don’t even know yet if he’s using a centered average, or some other kind of average. And we don’t know how the fact that it includes the future affects the model, because he hasn’t revealed the model. So Dr. Evans can make any claim he wants about all of this, secure in the knowledge that I can’t falsify a thing he says.
Finally, in the original data graph to which Leif and I were objecting, Dr. Evans pasted invented data at the end of the actual data, in order to extend the 11-year average all the way out to 2013. I note that in his explanation/apologia of that graph, he hasn’t used the same process he used in the graph to which Leif and I objected … apples and oranges.
Conclusions? I suspect that Dr. Evans may be right, that IF you use an 11-year centered boxcar averaging method, and IF you tack invented data on the end of the actual data, and IF you use the faulty Lean and PMOD data, and IF you use an 11-year average of the 11-year averages of the PMOD, Lean, and ACRIM data as your input … you may indeed get something like his original graph.
Color me unimpressed …
Unfortunately, however, we don’t even have any way to know if my string of conjectures above is true or not, because Dr. Evans STILL has not released the code as used, the data as used, the out-of-sample tests that Jo says have already been done, and all the rest of the hermetically sealed secret information.
And while someday he may release it all, and I hope it’s soon for his sake, in his cited explanation of his study he has already changed the procedure that he used in the graph Leif and I objected to, and has not noted that change anywhere in the explanation.
So whenever he finally gets around to releasing all the hidden stuff, at that point we have no way of knowing whether what he’s releasing is what he has been discussing for the last ten posts … which is why data and code need to be released when the study is released.
Regards to all,
w.
From vukie on July 1, 2014 at 1:18 pm:
Which of the three main ones are you leaving out?
This is a disagreement among honorable men that has been elevated to a matter of honor. For this there shall only be two acceptable courses of action.
Drawn pistols at dawn, or crawling together to somebody’s home at 4AM after getting kicked out of the tavern with the issue forgotten many liters ago.
Margaret Hardman,
Just because you ‘gave someone a chance’ does not create an obligation. Plenty of folks like McIntyre and McKittrick have given Michael Mann a chance, ever since MBH98/99, but he completely disregards them. He even ridicules and insults them; see the Climategate emails.
Mann’s refusal to provide the data and methods that he used to create his hokey stick chart is far more serious than whoever made a relatively insignificant chart. Wouldn’t you agree?
Mann’s disregard of the Scientific Method has directly and indirectly resulted in a massive misallocation of taxpayer resources. Thus my point: your complaints are misdirection.
dbstealey says:
July 1, 2014 at 2:08 pm
Thus my point: your complaints are misdirection.
Monckton behaves very much like Mann. So Margaret’s questions are relevant. The lack of answers is telling.
I will state here and now that Monckton faked an IPCC 1996 graph. The proof is on page 6 of the reference materials that accompanied his 2006 Telegraph story. Yes, that’s right, not only was there a fake graph published with the story (a graph Monckton claims he had no part in creating) there is also a fake 1996 IPCC graph in the reference materials.
Is Monckton going to now claim that he had no part in the reference materials? They have the logo on them that he used when he was pretending to be a member of the House of Lords. The caption on page 6 says, “Upper graph: Temperature history from UN 1996 report, showing the mediaeval warm period.” No, it’s not. The graph was not used in the 1995/6 IPCC report. It’s a fake 2nd Assessment Report graph. And Monckton is the one responsible for it.
I don’t care about fake British royalty. Rather than threatening libel Monckton ought to own up to his mistakes. You want to sue me for libel? Fine. Have at it. I’ll win, you’re wrong. Even in England the truth is a valid defense – despite the fact I may be just a poor commoner.
It appears as if Jo Nova’s response to Leif & Willis hasn’t been linked here yet:
http://joannenova.com.au/
Sorry if a duplicate.
Db, Perhaps they are not obliged to answer but since they wish to assert their innocence, a straight answer would be better than an evasive one. Just seems obvious to me. It seems to concern you that Michael Mann is evasive (in your opinion, something I will check out) but not Lord Monckton, something I cannot comprehend.
Margaret,
Mann is more than ‘evasive’. Here is an ftp file that he labeled “censored“. Note that if he had used the more extensive data set, it would not have produced his hockey stick shape. So he hid it in a censored file.
To the extent that you attack Monckton, I will produce evidence showing that Mann’s actions were far more serious. I have plenty. Again, the attacks against Lord Monckton are simple misdirection. Mann caused real, quantifiable damage to the economy. Or do you deny that?
Let’s discuss Michael Mann’s chart actions, shall we?
Now for the proper link:
http://joannenova.com.au/2014/07/the-solar-model-finds-a-big-fall-in-tsi-data-that-few-seem-to-know-about/
I’ve already seen enough spurious shapes and trends pop up when smoothing to not trust basing a hypothesis off something that only shows up with smoothing.
Nope, let’s discuss Lord Monckton’s missed chance. No need to get side tracked. I said I’d look into it and I will. Give me some links to start me off but until I have done that I won’t discuss that matter.
kadaka (KD Knoebel) says:
July 1, 2014 at 2:00 pm
…………..
Ended in a wrong blog, Robert the Bruce & Eric Bloodaxe
[??? .mod]
vukcevic says:July 1, 2014 at 2:58 pm
[??? .mod]
don’t wish to be sued for calling anyone ‘highly intelligent’.
Margaret Hardman:
At July 1, 2014 at 2:53 pm you say
I agree that there is “No need to get side tracked”. Indeed, only egregious trolls deliberately attempt to sidetrack threads.
The subject of this thread is the climate model of David Evans. So, I assume you will desist from promoting what you call “Lord Monckton’s missed chance” and any other side track.
Richard
Let’s discuss Michael Mann’s chart actions, shall we?
henry
no, let’s discuss the science shall we?
Are we all agreed now that TSI is basically useless and that declining solar polar field strength
http://ice-period.com/wp-content/uploads/2013/03/sun2013.png
is a much better proxy for declining earthly temperatures?
So, has anyone here now figured out yet where that solar field strength is going to go in time to come?
Richard, I think David Evans’s idea has been thoroughly trashed. That Lord Monckton seems to think that waving his arms and shouting wins anything but bemused looks says it all really.
IEHO there actually is something serious here. The SORCE measurements do not really fit well with any of the models (and they mostly don’t agree with each other). Since one needs the models to go back before 1980, the cleft stick is either there is something wrong with the satellite instrument, or none of the models are really good enough.
Oh yeah, it is easy enough to sense
I heartily DISAGREE with sweeping this issue aside.
Skeptics rightly question the speculation that anthropogenic CO2 has driven the 20th and 21st century warming trend based on the anomaly data, but as a consequence we leave a void. All voids want to be filled and this one is no exception. Trouble is, all manner of speculation will try to fill that void. Therefore we, as a skeptical community, MUST be even MORE skeptical of OUR speculations than those posited by the AGW crowd. Why? We run the risk of bias among ourselves than we do looking across to the other side.
To that end, we must seek out the best actual data available and seriously vet the presentations of those here that speculate on other-than-CO2 drivers. We cannot run the risk of taking each other for their word and must vet what we propose against actual data. Leif is a source and expert of actual Solar data. Bob Tisdale is an excellent resource in terms of oceanic data. Roy Spencer provides close to the ground and up in the air information on global temperatures. Anth*** provides expert opinions on the reliability and validity of ground sensors. It is very interesting that at least the first two, Leif and Bob, have given notice that they make NO predictions or scenarios and have provided no models of future global temperatures. I haven’t seen a prediction from either Anth*** or Roy so they may also be reluctant to provide such predictions. It is wise to ponder this reluctance.
So, both David A. and David E., along with a host of others must present their speculations and graphs to a hopefully well trained down and dirty skeptical crowd who will wisely and diligently check everything that is proposed, IE will do the CORRECT job of peer review that we so often pan as “pal review” on the other side.
That this is a spirited conversation that is very much a blood sport is the way IT SHOULD BE! I’ve been there and done that in another area of research. I’ve experienced the political side (which I hated and which made me leave research) and the side that matters (vetted reproducibility). The fact that my work was vetted, torn apart, and eventually put back together and is now part of the growing “here is what we know” pool of understanding about my area of research is most satisfying and not the least bit upsetting from beginning to end. The political pal review side (in my case, who should publish first, etc) is what we want to avoid at ALL costs! And especially AMONG OURSELVES! We should NEVER give ourselves a pass. EVER!
Sorry about the shouting, but ya’ll got me feathers ruffled with this notion of playing nice with each other.
Leif has a download page here.
http://www.leif.org/research/download-data.htm
The first link provides a excel file of TSI reconstructions which provides for an identical TSI reconstruction to that linked by Joanne Nova. Leif’s own data is the same.
http://jonova.s3.amazonaws.com/evans/graphs/prediction/total-solar-irradiance.gif
2003 was the middle of down-turn from the last solar cycle. It was already 0.5 W/m2 lower than peak of the last solar cycle in 2000 and 2001.
So Leif’s chart of TSI since 2003 starts in the middle of a downturn and ends at the top of the solar cycle. The end is supposed to be 0.5 W/m2 higher, not the same as middle of the last downturn (something approximating the average – we are supposed to be at the peak, not the middle) .
http://www.leif.org/research/TSI-since-2003.png
I’m new around here, so I won’t offer advice to people who know more than I do, but it seems foolish to expend so much vitriol over a few days’ delay in publishing data and codes. Patience is a virtue.
Bill Illis says:
July 1, 2014 at 3:33 pm
2003 was the middle of down-turn from the last solar cycle. It was already 0.5 W/m2 lower than peak of the last solar cycle in 2000 and 2001.
TSI simply follows the sunspot number and since this cycle is much lower than the previous cycle, TSI at maximum will be correspondingly lower. That is not the issue, but the false claim that TSI now is lower than in 2003-2005 is. Stay with the ball, Bill.
I’m just an interested layman, so I’m not going to offer science advice, but it seems disproportional to generate so much vitriol over the matter of a few days’ delay in publishing data and codes. Patience is a virtue after all, and most of you will want to get along after this discussion is concluded.
For heaven’s sake. Being from a very isolated Oregon county that is supremely very pioneering gawd-damn-independent in tone, I could give a rat’s ass about royalty titles or Lord titles and who has one and who doesn’t. If the good Lord says he inherited a title, fine. That has nothing to do with the good Lord’s threats because of Leif calling Evans out on a chart, Hell, I call David Archibald out on supporting the entire Evan’s speculation! Why? Because I think David engaged in pal review and therefore did not do his due diligence in presenting the post on Evan’s proposal.
Word to the wise: Don’t sue a redheaded Irish woman. The odds are decidely against you.
Pamela Gray says:
Skeptics rightly question the speculation that anthropogenic CO2 has driven the 20th and 21st century warming trend based on the anomaly data, but as a consequence we leave a void.
I am only interested in what’s happening. If evidence appears that confirms AGW, I want to know.
But so far, there isn’t any testable, measurable scientific evidence that quantifies the fraction of a degree of global warming due to human CO2 emissions — and I have been asking for that evidence for several years now.
Speaking for myself, I am a skeptic. If evidence is produced, that’s OK with me. So far though… there is none at all. That may change. Or not. Either way advances knowledge.
From HenryP on July 1, 2014 at 3:18 pm:
Is it much better to use cow plops than chicken entrails to predict the weather? Of course it is! Then you can still have eggs with your morning glass of milk.
Steve Keohane says:
July 1, 2014 at 4:28 am
Plants can’t use UV as an energy source for photosynthesis, but some pigments (cryptochromes & other receptors) can detect it.
For photosynthesis plants use wavelengths that chlorophyll molecules can absorb, ie blue (410-460 nm) & red (630-670 nm) light. Maximum absorption for chlorophyll-a is at 430 & 662 nm, while for -b it occurs at 453 & 642 nm. As noted above, plants appear green because green light is not absorbed by any pigment, neither by chlorophylls nor by phytochrome, carrotenoids, xanthophylls or others.
In coccolithophores, UV actually hampers photosynthesis.
http://www.sciencedirect.com/science/article/pii/S0098847209001580
Coccolithophores are exposed to solar UV radiation (UVR, 280–400 nm) in their natural habitats. However, little has been documented on their physiological responses to UVR. We investigated the UV impacts on the photosynthesis, calcification, photochemical efficiency and growth of Emiliania huxleyi while culturing the cells under solar radiation. Presence of UVR significantly decreased the rates of photosynthesis and calcification. Shorter wavelengths of UV-B led to more damages to photosynthetic apparatus than to calcifying machinery, while longer wavelengths of UV-A resulted more harms to the calcification. As the cells were grown during long-term exposures to solar radiation, the ratios of repair to UV-related damage increased, indicating their acclimation to UV. The specific growth rate of the acclimated cells was inhibited by natural levels of UVR by about 25%, and the cells became bigger with more coccoliths, reflecting a slower cell division and enhanced calcification per cell, a trade off to counteract the UV-induced harms. The absorptivity of UV-absorbing compounds (peaked at 280 nm) increased tremendously in response to the exposure of UVR. UV-induced stress led to a protective strategy of E. huxleyi, sacrificing the growth by allocating energy for accumulation of these compounds and calcification.
Agnostic says:
July 1, 2014 at 8:21 am
So in your view it is “reasonable” for Lord Monckton to threaten legal action over a scientific question, in a venue where the truth is not a defense against libel? And it’s “reasonable” for Lord Monckton to threaten to try to have Leif fired or demoted?
OK, we can see that you are not “Agnostic” at all … so I’ll call you “TrueBeliever” instead.
Regarding Dr. Evans actions of continuing to conceal the data, the code, the out-of-sample test, and the rest of the secret items, back at post II I asked and even begged David Evans to release the whole thing.
He told me he was under no obligation to release the data until he felt like it, and he didn’t feel like it. This condition has continued for another 8 long posts, along with endless discussion both there, here, and around the web, and despite a number of people other than myself asking him to reveal the data.
As a result, my statement that “he refuses to reveal the data” was true then, and it is still true now.
Yes, it may not be true in the future, but that’s why we have tenses in English, so we can tell the difference between “Dr. Evans refuses …” (present) and “Dr. Evans will continue to refuse …” (future). You should read up on this whole “tenses” deal, it will keep you from making foolish mistakes in future.
So I fear your objection is simply false, and my statement is demonstrably true. Dr. Evans has refused, and continues to refuse, to reveal his data, his code, his averaging method, his out-of-sample tests, the equations underlying his model, and just about everything.
Will he reveal it in the future? Who cares? The damage has already been done. He has been using his position of power, what Lord Monckton described in his usual eloquently manner as being “sure in the knowledge that no one will be able to falsify what he refuses to make available”, for ten long posts now, using that unfair advantage in each and every one of his posts to “defeat” all those like myself who might question his work … imaginary “victories” which seem to have impressed the credulati. Along the way, he’s gathered a host of less-than-inquisitive folks like yourself, who are defending his model despite never having seen one single test of his method, tests which Jo says have already been done, but which despite repeated requests have never been revealed.
So yes, ‘TrueBeliever”, Dr. Evans does refuse, and has refused numerous times, to reveal his manifold secrets.
Which is what I said.
w.
A note: A search on the English libel law shows that new provisions came into effect in January of this year. As a result, I was slightly out of date, and Lord Monckton is correct about the current British libel law. It does allow for truth as a defense.
However, it also introduces the following provision, per the UK Parliament web site:
http://services.parliament.uk/bills/2012-13/defamation.html
Is there one person here who thinks that David Evans has “suffered serious harm” from Leif comment on a blog post?
In addition, there are still Australian states where truth is NOT a defense against libel … and regarding that, Lord Monckton states:
So once again, Lord Monckton is threatening a libel suit in a jurisdiction where truth is not a defense …
Now, if there is one person reading this who thinks that Lord Monckton’s repeated threat of legal action against Dr. Svalgaard in a scientific dispute, and bringing action in a place where truth is no defense is not a vile, sleazy, underhanded action, now is the time for you to speak up. Lord Monckton needs your help.
And for those who think it is a vile, sleazy, underhanded action … now is the time for you to speak up. Ethical behavior needs your help.
w.
At the beginning of this post I said that there are 50 IPCC climate models. Apparently that is not correct. There are at least 90 of them. Perhaps there may be more. Perhaps there are as many of them as there are stars. Anyway, the important thing is that they are all wrong. So you are all free to go about your lives without worrying about global warming. Great news indeed.
Mr Eschenbach, who has lost all reason, is yet again saying I have “threatened legal action”. I have not, and have no standing to do so. I have suggested that, if Dr Evans sustains damage from the disgraceful allegations on this site, the kindest course is to seek from the courts a declaration that he has not fabricated anything. Stop shouting and read.
And it is not for Mr Eschenbach to decide whether Dr Evans has been damaged. It is for Dr Evans (and, if necessary, the courts) to decide. The likely effect of the libel, if Dr Evans’ work turns out to be as important as the snappers and snarlers apprehend that it may be, for otherwise there would be no point in their snapping and snarling, would be that the climate communists would gleefully spread it everywhere. That has happened to me before, because I was not firm enough quickly enough.
As to the libel law, truth has always been at the core of the standard defence against libel in the law of England of Wales; of Scotland; and in all Australian states. And the purpose of the libel law is to prevent damage to the reputation of the innocent by malicious falsehoods. The wider the circulation, the greater the libel; and this blog has the widest circulation of all the climate blogs. I have now had some preliminary advice; and, subject to one or two details, it is that, as I had suspected, the attack on Dr Evans is a grave, unjustifiable libel and that damages, were he to decide to go down that route, would be substantial.
And Dr Evans is working hard to update all the datasets, make sure the model is working as it should, take account of legitimate comments as opposed to petulant screeching, and to release his code and his data, in the most accessible and most comprehensive manner, just as soon as it is ready. He has admirably disclosed an outline of his work in advance, though he had no obligation to do so. And he will release the detail just as soon as he can. He is rightly not prepared to be bullied into releasing half-finished work.
And those who think I should have “corrected” a graph published without my knowledge alongside an article of mine would assist me if they were to let me know, after looking at the page in question, what corrections they would have made. The graphs did not purport to be the IPCC’s graphs and were not labeled as such: they were plainly schematics (as was the 1990 IPCC graph); and they seem to have been drawn with the intention of demonstrating that the 1990 graph showed the medieval warm period and the little ice age and no 20th-century uptick, while the 2001 graph showed no MWP or LIA but did show a 20th-century uptick (which the squidging of the graph to make it fit the page had the effect of minimizing).
I did get the date of the 1990 graph wrong by five years because the graph was sent to me by an eminent professor who had inadvertently misdated it, and I was not able to verify it directly because the IPCC reports in question were not then online and I was a very sick man, confined to barracks and quite unable even to travel to the nearest village, let alone to the nearest university library 150 miles away. It was not until two years later that I was cured, and by then the world had moved on.
The fuss over these graphs seems to have been circulated by a particular individual with the intention of doing harm to my reputation, and not with the intention of making any legitimate or serious scientific point. But, if there is some scientific significance to whatever is thought to be wrong with the two graphs in the form in which they appeared in the Telegraph, then I should be interested to be let in on the secret of what the significance is.
You guys certainly have stamina. I can’t believe that you have not moved on.
To an impartial observer, neither side is covered in glory, and neither can rightly lay claim to the high moral ground in this unedifying spat.
In due course when Evans finally formally publishes his paper, hopefully he will at the same time release his data and codes. If he fails to do so, and fails to comply with a request, after his paper is formally published, then if the data and code is not released, it will undermine what he says in his paper, and may render his paper valueless. That is the time to put up, or shut up. It is not now.
Come on guys, let go, and move on. It is getting boring, and it is not advancing either side’s case. .
PS. If anyone cares about English Law, and I can’t believe that anyone does, since what ‘we’ on this site are all interested in is the science, not the law, truth has always been a defence to the tort of defamation. It is a requirement of the tort that a false statement be published. That is not some recent development, and of course, most former colonies (and I include the States in that) have much of their law rooted in English Law. Of course, English Law, like other systeems of Law, is in a state of flux regarding how to deal with the advent of social media.
Good Lord I don’t care a flying fig about your graph or chart or legal issues (or that others have brought it up – don’t care about their opinion on that topic either). I care about alternate proposals, such as Evan’s ill-prepared pre-print speculation to CO2 AGW. He is the one who put it out there for public inspection so it should be sternly critiqued and thoroughly vetted. If he can’t stand the heat, get the hell out of the kitchen and good riddance. In fact I dare say the same thing about myself. That I could not stand the political nature of research was a good sign I was not cut out for such a career.
As for the topic of this thread. We should be FAR more diligent on our side. If a proposal has even the scent of hiding something, or cherry picking, or guesses, or whatever, the author should be brought to task immediately and with unfettered firmness. Why? To cut through our own bias crap as oppositional voices to CO2 proposals. And you dear sir, appear to be loaded with such bias crap. Thank God for the enema immediately provided by true friends. As for a fan club pal review environment, that should be soley the love child of CO2 AGW.
This thread is an embarrassment to the sceptical community. Much douchebaggery has been demonstrated here. Calling someone Jones and Mann. Really? Close to fraudulent? Haven’t released the data in a week. Must have something to hide. Wth? I don’t have half of the scientific knowledge of the average poster here, but I know shameful BS when I read it.
Disgusting.
Travis, it’s been way more than a week.
Ms Gray appears incapable of being civil.
I see that Evans has been updating the dotted end of his graph related to the PMOD data. Yet it appears he still uses Lean’s 2000 TSI reconstruction which she no longer proposes. In addition, why the 11 year smoothing for TSI compared to a 25 year smoothing for temperature? Did we go fishing for a fit? Hmmm? Do tell, what is the complicated reasoning for such a difference in smoothing? There must be some scientifically valid reason supported in the literature review for such a statistical maneuver. Otherwise, without such vetting Evans would not use such a technique I am sure.
Me thinks it is the case, in substantial probability, that Evan’s has modeled the wriggle of an elephant’s trunk, not the holy grail of solar driven temperature trend.
http://joannenova.com.au/2014/06/big-news-viii-new-solar-model-predicts-imminent-global-cooling/
A week, a month, a year. The man, who has impeccable credentials, has pledged to release everything and will undoubtedly do so once some wrinkles have been ironed out, deserves a modicum of respect from supposedly like minded individuals. I have followed the big news posts on the other blog with excitement and anticipation. To come here and see people say these kinds of things is disturbing. A scientist who is willing to admit his hypothesis may prove to be rubbish in x number of years based on observations should be commended and at least given the opportunity to publish his entire assertions before being lambasted.
Lord Monckton, I’ve watched deliberations in your parliment. I’m a well-mannered lamb compared to both sides of your parlimentary setup.
Travis, it is my opinion that it is rubbish now. No need to wait. That Evans would update the PMOD information (which indicates he had to rely on others to do the work he was charged with doing) but not use publically available and more accurate reconstructions (IE NOT Lean’s debunked 2000 data) is telling. Besides, he stepped out in public. Heat, kitchen, that sort of thing.
Sorry about the bad use of apostraphe. Fingers flying faster than internal grammar check.
Mr Casey is right at all points. Ms Gray, as usual, is relentlessly wrong. The 11-year filter is present in all the TSI datasets: Dr Evans’ result is not dependent on only one dataset. Not is it particularly dependent upon a continuing downturn in solar activity. It is a shame that a few know-it-alls have shot their foul mouths off prematurely. As Mr Casey says, Dr Evans, who is fully competent to handle time-series, and much more so than your average climate scientist or solar physicist, will disclose his results in detail in due course, when he has finalized everything. Best not to assume the worst until the full picture is revealed.
And relentlessly a bad speller! Apostrophe for cris sake
Good Lord, I was questioning the comparison of an 11 year smoothed series with a 25 year smoothed series. Why that comparison? Does the graph “picture” change if you change the temperature filter? I would guess so. It would be a good guess because I’ve done a bit of filtering myself on brain waves and sound waves.
Recent advances in reconstructions of solar activity can be described thus [I’ll number them for easy reference. Papers and analyses can be given for each point, but are better presented if and when a point is up for discussion]:
1) Variations of TSI are the result of variations of the Sun’s magnetic field.
2) The sunspot number is a very good measure of solar magnetic fields.
3) Variation of the UV flux is due to variations of the Sun’s magnetic field
4) The F10.7 microwave flux is a very good proxy for the UV flux and it at the same level at every solar minimum.
5) The variation of the diurnal variation of the geomagnetic field is caused by the UV and is a very good proxy for said UV since 1781
6) The solar magnetic field is dragged out into the heliosphere and can be measured directly by spacecraft or almost as accurately by its effect on the Earth’s ring current (Van Allen Belts) whose magnetic effect can be measured on the ground, since 1830s.
7) The magnetic effects caused by the solar wind can also be monitored at auroral latitudes, allowing determination of both the solar wind magnetic field and the solar wind speed. Different research groups agree on these determinations.
8) Cosmic Rays modulation depends [inversely] largely on the heliospheric magnetic field.
8) These various determinations [by several researchers] of the solar magnetic field agree, so we know with good accuracy the solar magnetic field back to at least the 1830s, and hence also TSI.
9) The sunspot number has recently been revised and the result is that solar activity in each of the centuries 18 to 20 is very similar: a minimum about every 100 years near the turn of the centuries.
10) There is therefore no Modern Grand Maximum.
11) A result of all of the above is that solar activity reaches almost the same low level at every solar minimum.
12) Early reconstructions of TSI assumed that the solar cycle variation was riding on a varying background level which itself varied as a function of solar activity
13) This background was assumed to be caused by a solar-cycle dependent emergence of small magnetic [so-called] ephemeral regions. Modern measurements show that this assumption is false and that the emergence rate of ephemeral regions is constant in time and thus does not vary with solar activity.
14) Thus, reconstructions that show varying background level [e.g. Lean, Krivova, Wang, and others] are not correct, and conclusions based on them are similarly suspect.
15) All our determinations show that solar activity recently are very much the same as a century ago.
16) This means that the decrease of solar activity from the 1870s to the 1910s is very much similar to the decrease from 1980 to now. In particular, TSI [and any force ‘x’] now is very likely the same as it was 100 years ago
17) If our climate depends strongly on solar activity [be it TSI, magnetic field, UV, cosmic rays, what-have-you] then our climate the last 30-40 years would be very similar to that a century before [even allowing lags of several solar cycles], and it is not.
20) nobody sustains damage to their scientific reputation by being wrong. Being wrong is the normal in science. That is how science progresses and all true scientists wish science to progress.
The two points 8) should perhaps be called 8a) and 8b), respectively.
From Monckton of Brenchley on July 1, 2014 at 6:48 pm:
http://lasp.colorado.edu/data/sorce/total_solar_irradiance_plots/images/tim_level3_tsi_24hour_640x480.png
Not there.
http://lasp.colorado.edu/home/sorce/data/
Not in the daily values.
Willis [snip] with this claim:
“Exactly the same thing” – show the quotes from all parties then we can decide if they are all saying “Exactly the same thing”. Your rules, not mine.
David Evans has explained the timeline and given us a rationale and has said all will be revealed as the timeline progresses. Your interpretation that equates it to what ever Jones and Mann may have said is just that – as meaningless as any opinion can be. The author, not the reader, sets the schedule.
kadaka (KD Knoebel) says:
July 1, 2014 at 7:47 pm
“(…) The 11-year filter is present in all the TSI datasets: (…)”
Not there. [and] Not in the daily values.
You cannot expect the lay person Mr Monckton to know what he is talking about.
Pamela Gray says:
July 1, 2014 at 6:16 pm
“I see that Evans has been updating the dotted end of his graph related to the PMOD data.”
—————————————————————————————————————————
Yes, I see the update also. It seems now to better reflect the TSI graph here:
http://www.leif.org/research/TSI-since-2003.png
H/T to Dr Svalgaard for bringing this to Dr Evans’ attention so that he was able to provide a more accurate graph.
Tom in Florida says:
July 1, 2014 at 7:55 pm
Yes, I see the update also. It seems now to better reflect the TSI graph here:
http://www.leif.org/research/TSI-since-2003.png
H/T to Dr Svalgaard for bringing this to Dr Evans’ attention so that he was able to provide a more accurate graph
This is what true science is all about: correcting errors in a cooperative spirit. Activists such as Mister Monckton would not understand that, but, hey, he has no grasp on the science in the first place, so perhaps we should not fault him too much.
Willis, hold your piece? The Bloody bastard of an editor of my book, told me that is how one should spell it. Actually it made less sense, than peace. Good job it was a humorous book, eh? I fell out with him after the launch as a friend who bought the book, saw 169 errors. Some editors are not too good, eh.
That is an astonishing thing to write and an even more astonishing thing to read. In your opinion do we lay persons have a role or do we all just accept from on high the spewage you elitists choose us to consume? At your service, always,
dp – a devoted lay person humbled by your eminence
dp says:
July 1, 2014 at 9:38 pm
You cannot expect the lay person Mr Monckton to know what he is talking about.
That is an astonishing thing to write and an even more astonishing thing to read. In your opinion do we lay persons have a role>/i>
Lay persons can be very smart and are not easy to fool. Mr Monckton [self-professed lay person] fools himself and shows how little grasp he has on science. Some other lay persons present a challenge to the scientist demanding great precision of expression without jargon and with little hope for the scientist to hide behind mumbo-jumbo. In general, though, we all have to trust in some measure the experts in other fields. When I’m having a medical check-up I need to in general trust the results and act on my doctor’s advice, and I must trust the heart-surgeon operating on me.
Monckton of Brenchley says:
July 1, 2014 at 5:22 pm
My apologies to you, sir, you are correct. You didn’t directly threaten legal action.
Instead, you personally accused Leif of libel a number of times … and you publicly advised your friend David Evans regarding taking legal action … and you put your lawyers on the case, viz:
So … as you say, no threat of legal action … just repeated accusations of libel, advice to a friend that he should consider suing for libel, plus paying your lawyers to go to working on the libel case.
My friend, after admitting that you are paying your own personal lawyers to advance a libel case against Leif, I fear that your pettifogging hair-splitting means nothing. When a man tells his opponent that he is paying his lawyers to investigate a libel case against him, and trying to figure out how to triple the damages, he is threatening legal action.
All your well-known eloquence can’t peanut-butter over the fact that you have informed Leif that you are paying your lawyers to figure out how to screw Leif to the wall with triple damages for libel … and out here in the real world, we call that “threatening legal action”. Pretending your hands are clean in this one doesn’t pass the laugh test.
In addition, you say that:
I’m sorry, but I find both of those equally wrong. For you to discuss legal action in any context, whether by you or Dr. Evans, as a solution to a scientific dispute is an abomination.
And to use your position and reputation to attempt to threaten Leif’s employment his University? That is equally unacceptable.
To date, that kind of cowardly attack has been the exclusive province of the alarmists. I know of no other occasion when a climate skeptic has threatened to cost a man his job because of his scientific beliefs. I am deeply distressed that you have brought such filth to the skeptic side. Threaten a man’s livelihood because you disagree with his science? Advise your friends to sue him in an attempt to shut him up and cost him money? Pay your lawyers to figure out how to nail him to the wall?
For shame. Look, I’m not a British Lord, I’m just a guy. It would be unacceptable for a man in the street like me, with little in the way of resources, to do those things.
But you have a position, and a reputation, incredible eloquence, wealth, a title, privilege, lawyers on call, money to pay the lawyers, powerful friends … and you threaten to use any and all of that to damage Leif’s position at the University, and shaft him with triple damages?
I truly feel sorry for you, my friend. I’d read before of people having this kind of vindictive response to someone telling them the truth … but my goodness, I never, ever thought I’d see that kind of behavior from you.
I beg you on my knees as your friend, give up this crazy path! It is destroying your reputation. Nobody likes a bully. Nobody trusts a man who says he has not “threatened legal action” when at the same time he’s paying lawyers to find out how to get triple damages. You’ve lost your way on this one, Christopher, and it breaks my heart to see it.
It is my sincere wish that you cut your losses, stop paying your lawyers, and stop discussing legal action in any form. Truly, I wish you well, and I say that in the fervent hope that you stop doing yourself damage.
Finally, let me return to what this ugly tempest in a legal teapot is all about. Leif pointed out that in addition to using the Lean and PMOD datasets, which are widely accepted as being incorrect, David Evans had made up 900 days worth of imaginary data with an arbitrary value, and appended them to the end of the actual (albeit terribly flawed) dataset. I know of no scientific basis for such an action, nor have I ever heard of it being done.
Leif said of that combination of using known-bad data and imaginary data that …
First, does David Evans have “an agenda”? He’s not only got an agenda, he has a timetable for the rollout and presentation of the whole circus. Note that I don’t see having an agenda as a bad thing. I have one myself—I’m in thrall to transparent science, and I want to advance my hypothesis that the climate is ruled by emergent phenomena. There’s no problem with having an agenda. It’s only when your agenda leads you to use bad data and to make up data that it’s a problem.
Next, Leif described the use of the known-bad datasets plus imaginary data as “almost fraudulent”, a term which you have violently objected to. And I admit, I’m not entirely comfortable with it myself.
So … to try to remove this from the legal arena and return it to the scientific, how would you describe Dr. Evans large departure from the scientific norms? Most people will just look at the graph, they won’t even realize that the Lean and PMOD data are known to be bad and that on top he’s added bogus datapoints. So we can assume that people will be deceived, intentionally or not, by Dr. Evans’ choices.
So rather than “almost fraudulent”, would you prefer “deceptive”? I mean, some people will assuredly be deceived by the use of imaginary data plus bad data. Or would you describe it simply as “newbie mistakes”? Would ” woefully inadequate due diligence” be a better term in your opinion? How about “didn’t check the literature”? I’m open to alternative terms.
As far as I’m concerned, you’re welcome to take your pick of terms, because no matter what terms you use to describe the David Evans patented secret combination of bad data and imaginary data, Leif’s underlying point is totally true—the model is already falsified because of the use of invalid input. Garbage in, etc …
Look, Christopher, I’m not trying to bust your chops here, truly I’m not. I suspect you don’t understand many people’s visceral reaction to what you’ve done. Americans don’t stand for that kind of thing. Calling the law on somebody in a scientific dispute is seen, and properly in my opinion, as the unacceptable last desperate throw of a man who is a unmanly coward and not only a loser but a bad loser … e.g., Michael Mann …
Now, in my experience, you are neither unmanly, nor a coward, nor a loser … but good heavens, you are doing your very best to pass yourself off as all of them.
And please, I beg of you, stop with the hair-splitting. When you inform Leif that you are already paying your own personal lawyers to figure out how to screw him out of triple damages for libel, you are definitely threatening him with legal action, no matter how you might try to spin it … and your attempts to spin it just make you look deceptive.
My advice, which you are free to disregard, would be to man up, admit you threatened Leif with legal action, admit it was the result of an unfortunate rush of blood to your head, stop trying to diss him with his employers, save your money and stop paying your lawyers, leave the legal threats to Michael Mann and his unpleasant ilk, and let’s get back to the science, can’t we … please? Pretty please?
In the ever-optimistic hope that you will take steps to end what appears to be your determined quest to achieve a final completely and utterly Pyrrhic victory, I remain,
Your friend,
w.
lsvalgaard says:
July 1, 2014 at 9:57 pm
dp says:
July 1, 2014 at 9:38 pm
You cannot expect the lay person Mr Monckton to know what he is talking about.
That is an astonishing thing to write and an even more astonishing thing to read. In your opinion do we lay persons have a role
Lay persons can be very smart and are not easy to fool. Mr Monckton [self-professed lay person] fools himself and shows how little grasp he has on science. Some other lay persons present a challenge to the scientist demanding great precision of expression without jargon and with little hope for the scientist to hide behind mumbo-jumbo. In general, though, we all have to trust in some measure the experts in other fields. When I’m having a medical check-up I need to in general trust the results and act on my doctor’s advice, and I must trust the heart-surgeon operating on me.
Don’t know much about sophistry but MN had just had its coldest winter in 130 years. Today, July 1st, was 61 F and rainy. A number of farmers will have a bust year after a bad 2013, median farm income $43K, exasperating LP shortages last winter with that used to dry corn for Ethanol contracts. This is not weather, it’s climate and your ‘Solar Science’ is a load of crap.
It is strange, nay suspicious, that certain people here are becomming violently opposed to an idea that may or may not be accurate but by all accounts can be falsified in a short period of time. Why are some people so worried as to completely discount the theory without giving David Evans the respect to let him complete his postings (and even to wait a few years)> I am a natural Sceptic, and I feel that something sinister is happenning here. Rather than helpful discussion we get attacks and outright denials, perhaps we have some dopplegangers amongst us, pretending to be sceptics but all along deep undercover agents for the “consensus”
Just a theory but there re lage stakes in the argument and I dont trust the establishment notmto have placed a few deep cover agents ready to sabotage any promising theory as it emerges.
Stupendus says:
July 1, 2014 at 10:07 pm
It is strange, nay suspicious, that certain people here are becoming violently opposed to an idea that may or may not be accurate but by all accounts can be falsified in a short period of time.
Is already falsified.
Willis Eschenbach says:
July 1, 2014 at 10:01 pm
Instead, you personally accused Leif of libel a number of times … and you publicly advised your friend David Evans regarding taking legal action …
Thanks you Willis for your insight into this matter. I feel, though, that your friend has dug himself a hole that is too deep to slither out of. We shall see if Mr Monckton is a man and a gentleman.
Then we all agree than solar activity does influence weather and climate? You should by now! But the orbit of the sun, constantly spinning in space with its satellites, ie. planets and asteroids, have influenced our climate and weather, between interstadials and seasons. This is the crux of the question, Greens don’t believe the MIA ever happened.
Stupendus says:
July 1, 2014 at 10:07 pm
The groupies around here are pretentious stupes, is why.
1. dp said to Leif July 1, 2014 at 9:38 pm
“That is an astonishing thing to write and an even more astonishing thing to read. In your opinion do we lay persons have a role or do we all just accept from on high the spewage you elitists choose us to consume? At your service, always,
dp – a devoted lay person humbled by your eminence”
*************************************
I think the two-way nature of the situation you are concerned with is perhaps unappreciated by yourself.
I have lived about 50 years in a college town where a lot of people who could have “pulled rank” intellectually nonetheless restrain themselves. Perhaps this is because most of us do recognize that within about a 1 mile radius there is almost certainly a person who is not only much smarter than us in general, but knows a lot more than we do about any one topic that might surface. It is unwise to take ourselves too seriously! We are ALL laymen, and almost certainly always will be. Personally, I find this reassuring. Thank goodness there is someone in reserve who knows more than I. With luck, and good sense, we won’t be annoying enough that we will need to be reminded of this fact.
Original:
Trivia questions: how did they get global average surface air temperature from UAH and RSS? How did they work CET into a global average?
Currently posted revision, changes bolded:
Trivia questions: There are two lines for TSI, one for temperature. Where is SIDC sunspots? They already have TSI.
Why are PMOD and ACRIM listed? ACRIM-I and ACRIM-II are already in PMOD. Were they using ACRIM-III?
Monckton of Brenchley says:
“I did get the date of the 1990 graph wrong by five years because the graph was sent to me by an eminent professor who had inadvertently misdated it, and I was not able to verify it directly because the IPCC reports in question were not then online and I was a very sick man, confined to barracks and quite unable even to travel to the nearest village, let alone to the nearest university library 150 miles away. It was not until two years later that I was cured, and by then the world had moved on.”
Too poorly to check a graph but well enough to write two lengthy articles for a national newspaper and forty pages of supporting material including references. Enough said.
SIDC unsmoothed June SSN=71.0, down on May (75.2). Second peak of SC24 is over, and looks like as the Max is over too, even if SC24 goes well beyond 11 years.
bushbunny says:
July 1, 2014 at 9:10 pm
Here in the US, if I said I was holding my piece, I’d either be referring to holding my gun, or holding my Johnson … I figured it was a typo on your part.
I believe it’s from the wedding vows, something about “If someone objects to this wedding, speak now or forever hold your peace”, in which context it simply means “speak now or forever remain silent on the subject”. Hang on, let me look it up … yeah, more info here.
All the best to my favorite Antipodean wildcat,
w.
you want drama? fine!
NJoY!
Willis: So in your view it is “reasonable” for Lord Monckton to threaten legal action over a scientific question, in a venue where the truth is not a defense against libel? And it’s “reasonable” for Lord Monckton to threaten to try to have Leif fired or demoted?
READ what I WROTE!!! You even quoted it for crying out loud! I said apart from over-reacting to the demonstrably ridiculous remark by Lief Svalgaard that Dr Evans was “almost fraudulent”.
How is this me declaring that Monckton’s postion on that was reasonable? It’s plain English. I said “apart from”. I do not think the tack Monckton has pursued in this regard was sensible. People say all sorts of stupid things on blogs all the time. Totally justified in calling him on it but after that, move on.
You are doing the very thing you most complain about – putting words into peoples mouths.
Worse you go on: Along the way, he’s gathered a host of less-than-inquisitive folks like yourself, who are defending his model despite never having seen one single test of his method, tests which Jo says have already been done, but which despite repeated requests have never been revealed.
WHERE have I defended his model? Quote exactly where I said his model was valid.
What is the difference between a “True Believer” and a “True Unbeliever”. Shall I start referring to you as Willis “Unbeliever” Eschenbach shall I? Not “Disbeliever” but “Unbeliever” – totally unable to believe anything anyone else but yourself says despite all evidence to the contrary?
Here is what I had hoped would happen; you would have followed Dr Evans’ posts to gain a rough idea about what it was he was trying to do with the model, reserving judgement or serious comment until you had seen ALL the data and code and were able to play with it yourself. I would have looked forward to it – a serious and unbiased examination by you, pointing out some potential mistakes and oversights, with interesting responses either justifying something or correcting. You know, science.
Instead what we have is both you and Leif shooting your mouths off and digging your heels in the face of very reasonable arguments to examine more closely and/or wait until you have had a chance to look at the promised data and code. Calling the fact that it has not yet been released as a “refusal” to release it is absurd. It’s perfectly reasonable to say “Look, until we have had a good look at how he’s done it I can’t be sure it’s not utter nonsense.” That’s good healthy skepticism. But you seem to assume that everything is all good to go, to be put out to public, that there aren’t last minute corrections, revisions, updates, bug fixes and that any delay is just withholding or refusing to share data and code.
Mate, can you really not see how absurdly unreasonable that is?
Now, when finally the model is published, and you deign to look at it, any criticism you may have of it I will likely suspect of being biased. That’s properly a shame.
I AM Agnostic – I have read up a bit on what he is suggesting and while I think it’s an interesting approach all round, I have no views either way as to whether he is right. I was hoping to see it kicked around once the model was published before coming to any sort of conclusion about it at all. You would have been one of the guys I would have thought would have done a good an unbiased and interesting analyses. But now…..
@dbstealey says
“Thus my point: your complaints are misdirection.”
And your attempt(s) to pull the thread discussion over to a completely unrelated topic is what?
The legal position is now clearer. A grave libel has been committed – not, as I had thought, by only one person here, but by several. It has been persisted in after warnings to desist. The libel is based on a failure to pay close attention to what has already been revealed of Dr Evans’ work, and on a failure to wait for the imminent full disclosure before making serious criminal allegations, which have already begun to be repeated by others. However, it is open to Dr Evans either to ignore the libel, on the ground that my rebuttals here may have done enough to avert damage to his reputation; or to sue; or to go to the court merely for a declaration that he did not deliberately use incorrect data and that he did not fabricate any data. The allegations that he did so are regarded as grave not only in the British-law sphere but also in the courts of the United States, and for the same reason. The allegations were circulated on the world’s most-read climate blog. Damages – on both sides of the Atlantic and in Australia – would be enormous.
So to the scientific point at issue. The courts, contrary to what Mr Eschenbach says, are a very good place to sort out disputes of this kind, where one side is making allegations of dishonesty and deception about the other. The courts would have regard to the following scientific considerations:
1. Motive. Dr Evans has nothing to gain and everything to lose by making a prediction that solar activity has been declining since 2003 at a rapid rate, and that within a decade the world will cool by not less than 0.1 K and perhaps as much as 0.5 K in consequence. The court would have particular regard to the fact that he has openly stated that if the expected cooling does not materialize his hypothesis will have been falsified.
2. Method. Dr Evans’ basis for saying a decline in solar activity began in 2003 or thereby is founded upon 11-year smoothing of the data. The court would have regard to the fact that Dr Evans had made that plain from the outset, but that those who had alleged that his conclusion was deliberately false had shown a graph of data with 27-day smoothing, which had been tampered with to extend the smoothing curve across a period of several months were there were no underlying datga. The court would have regard to the fact that those who have accused Dr Evans of having added bogus data to his system had themselves explicitly stated that if there were no data the analysis should stop there, and yet one of them had himself done, and can be proven to have done, exactly what he had condemned in Dr Evans. The court would take particular note of the fact that the 11-year smoothing produces similar results for the relevant recent period, whichever dataset is used, and that in any event Dr Evans has included multiple datasets with his model, so that the allegation that he had wilfully used an incorrect dataset must fail. The court would also place very considerable weight on the fact that, when the principal libeller had had the fact drawn to his attention that 11-year smoothing was the basis for Dr Evans’ contention that solar activity was in precipitous decline, and had had his attention drawn to a specific graph by Dr Evans showing the decline across multiple datasets, the libeller had sneeringly replied that 11-year smoothed data should be truncated for the last 5.5 years, implying that Dr Evans had not thus truncated it, when on Dr Evans’ graph to which his attention had been drawn the data had indeed been thus truncated. The court would also have regard to the fact that Dr Evans had made it plain that he had applied various smoothing periods to various datasets, so that criticism of him for focusing only on one dataset or for focusing only on an 11-year period is misconceived and would not impress the court.
The court would conclude that the attack on Dr Evans had been widely circulated, intemperate, unscientific, excessive, premature, unsoundly founded in logic, persisted in beyond reason and after repeated requests to desist and calculated to damage him in his calling as a scientist, and to do so at a moment when the libellers knew he was about to release the fruit of many years’ work, and that the principal libeller, having demonstrably tampered with a graph himself in a fashion not dissimilar to that of which he had wrongly accused Dr Evans, did not in any event come to the court with clean hands. Damages would be, as I suspected, substantial.
It is impertinent of Mr Eschenbach to say that I have paid my lawyers for the advice they are giving me on this matter. Whether or not I am paying them is a matter between me and them. I repeat that my purpose in consulting the eminent international arbiter well experienced in scientific cases who is assisting me, and in letting it be known that I am consulting him, is to help to expunge the libel – and, paradoxical though it may seem, to minimize the likelihood that an action will have to be proceeded with – by making it very plain that, however some commenters here may view the matter, and however sincerely they may feel that it is fair game to make and persist in public allegations of criminality against Dr Evans, the court would view all such allegations in a very serious light; would find them baseless in fact and repugnant in law; and would come unhesitatingly to the defense of the blameless Dr Evans against not only the four who have perpetrated and perpetuated the libel to date, but also against anyone else who might – but for my intervention here – have been tempted to repeat the libel or give it wider circulation.
To those who are joining in what they presumably think is the fun by accusing me of having fabricated a graph myself, I shall be hoping to offer a head posting here on that not uninteresting subject in due course. The startling extent to which that libel had been circulated and compounded only became apparent to me very recently, and it nicely demonstrates how important it is that the horse is apprehended before it bolts from the stable.
Cream Bourbon,
I responded to Margaret H. What is the topic of this article? If your unusual friend Margaret can discuss off-topic personalities, it is my opinion that she is misdirecting the topic away from the central knave of the entire runaway global warming scare.
I would prefer staying on-topic. And you?
gary gulrud says:
July 1, 2014 at 10:04 pm
Thus it begins. I have a book on my desk “Climates of Hunger” by Bryson and Murray describing how the area you are living in was abandoned by Indian corn-growing tribes during the LIA.
@dbstealey
Dragging in crticisms ofMichael Mann graphs? Suggesting debates between Monckton and Mann? That is your idea of on-topic?
Skeptics……. acting poorly…….. This behavior is not worthy of this site…….
From Monckton of Brenchley on July 2, 2014 at 2:02 am:
http://woodfortrees.org/plot/hadcrut4gl/from:1979/plot/hadcrut4gl/from:1979/mean:13
The world has cooled by the lower amount within only a few years many times. Thus it’s within natural variability.
HadCRUT4 land+sea global has a 0.754°C anomaly in 1998.08 (February), and 0.146°C in 2000.92 (December). That’s a drop of -0.608°C in just 2 years 10 months. Also 0.433°C in 1983.0 (January) and -0.274°C in 1984.92, so a drop of -0.707°C in just 1 year 11 months. Thus there are greater drops in less time than the upper amount without solar influence.
As Dr. Evans prediction is easily within natural variability, it cannot be concluded a drop of global average temperatures within that range is a consequence of a decline of solar activity since 2003.
Conversely, cooling less than the lower amount or even a small amount of warming cannot be said to definitively falsify Dr. Evans model, as an amount within the predicted range can be claimed to be hidden by natural variability.
If the model can’t be shown to rise above the noise, then what can it show?
Monckton of Brenchley says:
July 2, 2014 at 2:02 am
Do you realize that most readers by now have probably stopped reading your posts? Your continual beating of the same drum is boring. If you feel you haven’t made your point by now, perhaps you are not as good a communicator as you think. Time for you to go back to the House of Lords and speak on the important issues there.
I have been a regular viewer of wuwt for many years and have noticed both leif and Willis have aggressive tendencies. This blog how ever has shown them both to be bullies of a kind I would avoid like the plague. Australians tend to be very kind and tolerant people, this disgraceful attack shows them both in a much lesser light and totally unbecoming on a scientific site. Science is the endeavour to find the truth, it is not a blood sport, if some ones ideas do not fit yours it is best to listen and learn. Shame on you both.
Scotch mist and other stuff …
A Finer Malt – now with volcanoes and deltas the right way up!
Uncorrected SSN based TSI proxy versus CET monthly
Corrected SSN based TSI proxy versus CET monthly
I’ll go with Leif’s correction and leave a small part of David Evan’s speculation on the table for now. Very suspicious of the CET record, it’s a composite mish-mash churned out by you know who; may well be full of artefacts. Need to look at something a bit more vanilla when time allows.
Please quit the willy-waving it’s getting embarrassing. You all seem to be arguing at cross purposes over a smoothing algorithm. It probably goes something like this:
1. Differentiate the time series (i.e. deduct value n from n+1). You lose the first value.
2. Reintegrate (i.e. just do a running accumulation) to centre the [now virtual] start on the axis.
3. Differentiate again. You lose another value.
4. Now do a centred running standard deviation over the desired period, losing the ends obviously.
5. Reintegrate again and you’re done. Admire the knobbly bits where spikey bits should be!
Do you see how that works? Simple calculus with a slice of lemon.
And Monkton, do you see these Danish axes? Do stop throwing Eton Mess about the place man, the 4th of June has been and gone. Regardless of a detour via Normandy for a couple of centuries, watching a Johnny-come-lately descendent of some Victorian paper pulper trying to slag off a one-time fellow countryman I hold in the highest regard is unpleasant if somewhat amusing.
If you wish, I can knock on the old fella’s fake tomb and ask if he wants to join in. But I should warn you, he really was into blood-sports big time. Short legs and huge lungs (genes he seems to have passed on to me unfortunately); he could swing away all day. My 90-year old mother currently holds the tree. She’ll do as a surrogate if the old guy’s not in the mood but I wouldn’t wish that on anyone either. This and your sort of bollocks would last about 10s flat old son. Look, life’s a hoot … put your pompous ego out to grass and yet stuck in! Otherwise, as with my lot in times of yore, sooner or later one brother will hack another’s head off and what a sad waste of highly evolved water and carbon that would be.
Toodle Pip.
Mr Knoebel makes the elementary statistical error of assuming that a fluctuation over a decade is as likely as a fluctuation over a year or two. Except in rare circumstances, it is not. Over a decade, IPCC predicts around 0.2 K warming. Dr Evans predicts not less than 0.1 K cooling, and perhaps as much as 0.5 K. I do not recall his central estimate, but even his least estimate is a startling variance of 0.3 K compared with official predictions – well outside IPCC’s prediction interval.
Wassup Willis!! You are behaving like Gollum ,screeching for your precious ….data .
It is coming , nobody asked you to comment on the Nova site , you chose to do so in ignorance ,whereas a wise man would have waited for the full release of data as was intended .
You are in fact behaving like a very spoiled child “I want it !!!” Back in the day “I want !” got a smack.
Monckton of Brenchley in his recent posts has added a lie and (if he were an academic or serious researcher) revealed misconduct. We have a saying in America, when you’ve dug yourself into a hole the first thing you should do is STOP DIGGING!
The lie – Monckton now says:”The graphs did not purport to be the IPCC’s graphs and were not labeled as such:…” In his reference materials the caption on page 6 says, “Upper graph: Temperature history from UN 1996 report, showing the mediaeval warm period.”
The misconduct – Monckton now admits that he did not have the 1990 report. As Dr. John Mashey has explained, “In academe, this is called false citation, misrepresentation of a source, or falsification/fabrication. Such things can be academic misconduct, not because the curve [on the graph] is wrong, but because the different image (not labeled “after” or “derived from”, etc) strongly implies that the original source was not consulted.” No inference needed. Monckton has admitted he didn’t refer to the source material. Perhaps that’s why he never mentions the caveats in the original text of the 1990 report that apply to Figure 7.1.c. Shoddy research.
The graph Monckton used is NOT (as stated in the reference materials) from the IPCC 1996 report.
Not only is it not in the 1996 report, it isn’t the authentic 1990 graph either. It’s a fake. Compare the 1990 Figure 7.1.c graph with the one in Monckton’s reference materials – they are NOT the same graph.
It’s easy to lay blame on others (someone sent it to me – I was sick). Monckton’s name is on the article and his name is on the reference materials, but some unnamed source is at fault. Own up to your mistakes, Monckton. And quit digging deeper!
David Archibald says:
July 2, 2014 at 2:16 am
Last year corn effectively came in the average week of first frost. An August without rain was required to make it so.
This year we’ve 20+ inches over the last 60 days where 30 inches is our ‘normal’ total for the year. Two days have been warm and humid whereas 90 F has not been threatened. IA is also flooded, with rivers still rising.
David Evans proposes that TSI and global temperatures are related, that TSI has diminished and global temperature will follow it down. The mechanics of this relationship have been the subject of robust debate but the proposition is simple.
Evans claims that TSI has fallen. That can be checked.
In the near future average global temperature will either fall, rise, or remain steady. If the first of these, and TSI has fallen, then Evan’s proposition may be correct. If the others his proposition is wrong.
Time will tell.
GregK says:
July 2, 2014 at 6:38 am
Evans claims that TSI has fallen. That can be checked.
If one does, one finds that TSI falls to the same level at every sunspot minimum and rises to a maximum in each cycle simply depending on the sunspot number. The curves Evans show are at great variance with this [based as it is on obsolete reconstructions and wrong ‘splicing’ of recent data to the old reconstructions], so no need for ‘time will tell’. Evans’ ‘prediction’ is already falsified simply because it does not hindcast the temperature back in time, so cannot be expected to forecast any future temperatures. As simple as that.
kadaka (KD Knoebel) says:
July 1, 2014 at 10:50 pm
Currently posted revision, changes bolded:
“Data sources: Lean 2000, SIDC sunspots, PMOD, ACRIM. Composite TSI for Sep 2013 to Dec 2015 assumed as average TSI value from Sep 2012 to Aug 2013, to extend smoothed curve (dotted line).
Temperature sources: Christiansen & Ljungqvist 2012, Moberg 2005, CET, HadCrut4, NCDC, GISTEMP, UAH, RSS.
Global average surface air temperature.”
So the data gap is filled in and the data extrapolated out to Dec 2015 using approximately the highest value over the last 11 years and yet the smoothed curve continues to fall.
One wonders how the ‘smoothing’ is being calculated since previous drops in TSI don’t show such large drops in the smoothed values, the previous two cycles show very small changes (both positive and negative). Most likely it is due to the end padding as described above, but just extrapolating out to the end of 2015 doesn’t seem sufficient.
Steve McI criticised Mann for padding the Gaspe proxy but that had far less effect than this.
Mr O’Neill officiously and dangerously intervenes to say I have told a “lie”. If he would be kind enough to let me have his name and address, my lawyers will write to him. In all relevant jurisdictions, there is seldom a defense against a direct allegation that the victim of the libel has lied. If Mr O’Neill does not supply his name and address, the relevant court orders requiring the information to be provided will be sought, and the costs he will eventually be obliged to pay will increase.
Mr O’Neill, in an unwise attempt to provide a basis for his accusation that I lied, very carefully quotes out of context a statement by me that “the graphs” did not purport to be the IPCC’s graphs and were not labeled as such. The graphs to which, in context, I was at that point referring were two schematics that appeared without my foreknowledge in the Sunday Telegraph. They did not purport to be the IPCC’s graphs and were not labeled as such, as anyone who looks at them can see.
In my reference materials that were separately available to interested readers, I reproduced the IPCC’s 1990 graph and identified it as being from the IPCC, though I dated it incorrectly in error. As far as my inexpert eye can tell, the graph in my reference materials is in all material respects identical to that which appears in the IPCC’s 1990 report. If there are any differences, I suspect they are inconsequential.
Phil. says:
July 2, 2014 at 6:47 am
So the data gap is filled in and the data extrapolated out to Dec 2015 …
Uh-oh. Beware! Mr Monckton will sue you for libel…
lsvalgaard says:
July 2, 2014 at 6:53 am
Phil. says:
July 2, 2014 at 6:47 am
So the data gap is filled in and the data extrapolated out to Dec 2015 …
Uh-oh. Beware! Mr Monckton will sue you for libel…
Thanks for the warning Leif but I think I’m OK because Monckton says that the truth is now a defense.
Phil. says:
July 2, 2014 at 7:24 am
So the data gap is filled in and the data extrapolated out to Dec 2015 …
“Uh-oh. Beware! Mr Monckton will sue you for libel…”
Thanks for the warning Leif but I think I’m OK because Monckton says that the truth is now a defense.
So, we could have him admit that Evans fabricated data in order to fill the gap and to extrapolate..
Someone please alert Anthony that Tamino or someone like him has taken over this blog and is allowing school boys to destroy its reputation.
From Monckton of Brenchley on July 2, 2014 at 6:52 am:
Since O’Neill’s verified email address and also ISP info will lead to his real name and address, and that info is available to the blog owner, it seems Monckton just threatened legal action against Anthony Watts to force him to hand over someone’s identifying information.
WUWT is Anthony’s home on the internet, and it certainly appears one guest has just ordered another guest to give him their personal info or they will force the host to cough it up!
For clarity, I should point out that the shadow of a hockey stick superimposed on one of the two graphs reproduced by the Sunday Telegraph, the ones I was alleged to have “faked”, was labeled with the words “IPCC hockey stick”. It was clear from the context, therefore, that the graph was not an original IPCC graph, but was a schematic representation of it.
“Phil.” has twisted what I said, as usual. I had not said that truth was “now” a defense against a libel claim. I had said that truth has always been a defense against a libel claim. However, I have put the facts in front of a lawyer experienced as an arbiter of international scientific disputes. He considers there is no truth in the allegations that Dr Evans had fabricated data or dishonestly used incorrect data, and he was visibly outraged when I showed him the allegation that Dr Evans had been “almost fraudulent”, or, in the words of some of the other defamers here, just plain “fraudulent”.
Certain commenters here have attempted to pin Dr Evans down to one dataset that they seek to find fault with, when in fact he uses many; to pin him down to one smoothing period, when in fact he uses many; and to the alleged fabrication of data when the context makes it entirely plain that fabrication, in the sense of making up data with intent to deceive, was not present. Those who continue along these lines would be well advised to desist. It is one thing to have a legitimate scientific disagreement: it is quite another to persist in alleging dishonesty where, in the expert opinion of the lawyer who has examined the matter on my behalf, it is entirely plain that no dishonesty was present. I have only conveyed this advice here for the purpose of ensuring that those who continue to allege dishonesty or fraud on Dr Evans’ part are doing so in the face of a careful examination of what both sides have written by an expert in the determination of scientific disputes of this kind.
Monckton of Brenchley says:
July 2, 2014 at 8:44 am
Those who continue along these lines would be well advised to desist.
Or else?
lsvalgaard says:
July 2, 2014 at 7:29 am
Phil. says:
July 2, 2014 at 7:24 am
So the data gap is filled in and the data extrapolated out to Dec 2015 …
“Uh-oh. Beware! Mr Monckton will sue you for libel…”
Thanks for the warning Leif but I think I’m OK because Monckton says that the truth is now a defense.
“So, we could have him admit that Evans fabricated data in order to fill the gap and to extrapolate..”
It’s not in his style to admit errors.
Friends:
Phil. says at July 2, 2014 at 8:51 am
The irony of that is so extreme it is beyond possibility of mockery.
Surely, you guys must be able to see you have ‘jumped the shark’ when the troll who posts as Phil. has joined in.
Please desist.
Richard
Monckton of Brenchley says:
July 2, 2014 at 8:44 am
I have only conveyed this advice here for the purpose of ensuring that those who continue to allege dishonesty or fraud on Dr Evans’ part are doing so in the face of a careful examination of what both sides have written by an expert in the determination of scientific disputes of this kind.
You are sounding increasingly desperate. Now relying on paid advice from an unnamed somebody who clearly has no idea what he is talking about.
dp says:
Someone please alert Anthony that Tamino or someone like him has taken over this blog and is allowing school boys to destroy its reputation.
True dat. But don’t be concerned, they have no credible facts to support their runaway global warming beliefs. They only believe they do.
========================
Cream Bourbon says:
Dragging in crticisms ofMichael Mann graphs?
Dragging in crticisms of
Michael Mann’sLord Monckton’s graph?There. FIFY.
+++++++++++++++++++++++++
Phil. says:
It’s not in his style to admit errors.
One of the most perfect examples of psychological projection EVAH. ☺☺☺
I am, my good Lord, thus kindly reminded:
SCENE V. A public road.
PETRUCHIO
Come on, i’ God’s name; once more toward our father’s.
Good Lord, how bright and goodly shines the moon!
KATHARINA
The moon! the sun: it is not moonlight now.
PETRUCHIO
I say it is the moon that shines so bright.
KATHARINA
I know it is the sun that shines so bright.
PETRUCHIO
Now, by my mother’s son, and that’s myself,
It shall be moon, or star, or what I list,
Or ere I journey to your father’s house.
Go on, and fetch our horses back again.
Evermore cross’d and cross’d; nothing but cross’d!
HORTENSIO
Say as he says, or we shall never go.
KATHARINA
Forward, I pray, since we have come so far,
And be it moon, or sun, or what you please:
An if you please to call it a rush-candle,
Henceforth I vow it shall be so for me.
PETRUCHIO
I say it is the moon.
KATHARINA
I know it is the moon.
PETRUCHIO
Nay, then you lie: it is the blessed sun.
KATHARINA
Then, God be bless’d, it is the blessed sun:
But sun it is not, when you say it is not;
And the moon changes even as your mind.
What you will have it named, even that it is;
And so it shall be so for Katharina.
The shorter version. Elizabeth’s subtlety is magnificent.
Just here I nearly lost my breakfast:
So sayeth the resident climate bully:
http://wattsupwiththat.com/2014/06/28/a-cool-question-answered/#comment-1674525
Projecting much?
This is getting rediculous/
there is no science? everything is off topic?
I think it is time for Anthony to just close this and tell everyone to go home.
Agnostic says:
July 2, 2014 at 1:14 am
Thanks, Agnostic. Read what I wrote. I didn’t ask you about “over-reacting”. Over-reacting is what you accuse me of. I asked about your opinion of his legal threats, a question I note that you haven’t answered.
I didn’t put a single word in your mouth, Agnostic, that’s nonsense. Read what I wrote. I simply asked you the question of whether Monckton’s legal threats were “reasonable”. A simple yes or no would suffice.
My apologies, my lack of clarity bites again. I meant that he has gathered less-than-inquisitive folks like your self, and that they have defended his model. Note that the “who” in my sentence refers to “less-inquisitive-folks”, although it is not as clear as I’d like.
Call me what you like, name-calling doesn’t affect me. I’ve been called much worse.
Agnostic, what David has done is ask for our opinion of his scientific work. He has asked people to give their scientific comments and objections to his work, for post after post, a total of ten posts to date. Then when we have commented he has told everyone who disagreed with him that they were wrong … and of course, because he hasn’t revealed his data or code, he holds all the cards. He just says oh, no, you’re wrong, and he remains, in Lord Moncktons lovely description, “sure in the knowledge that no one will be able to falsify what he refuses to make available.”
Now, actually that lovely description was of Michael Mann … and it is very depressing to me that it describes perfectly what David Evans has done for the last ten posts. He has invited all comers to criticize his work, and he has “defeated” them all. There are lots of folks at his site who have already seen him “defeating” everyone who has objected to his ideas, and who are already robustly defending Evan’s work, without having seen one single test of the model.
Now, I’m sorry, but gathering adherents to defend your work by hiding it, then inviting comments on it, and refusing to reveal it, that is not science in any form.
Back in Post II, I begged David, not asked him but begged him to reveal his work then and there.
He refused. I asked him again. He refused again.
What part of “he has refused to reveal his data and code” seems unclear to you. That is a description of reality.
If it is not all good to go, why ask for comments on it? And if you ask for comments on it, as he has done for no less than ten posts now … how the hell can we comment without seeing his work?
I reveal and post my data and code when I post my studies. Yes, my studies may require “further corrections, revisions, updates, bug fixes”. That’s happened to me more than once.
Steve McIntyre reveals and posts his data and code when he posts his studies. Yes, his studies may require “further corrections, revisions, updates, bug fixes”. That’s happened to him more than once.
Steven Mosher reveals and posts his data and code when he posts his studies. Yes, his studies may require “further corrections, revisions, updates, bug fixes”. That’s happened to him more than once.
We do that because science demands transparency. It is normal scientific practice.
So regarding all of your boo-hoo about the poor man is not able to reveal his work because it may contain errors? Let me remind you what Phil Jones famously said to Warwick Hughes when Warwick asked Phil for his data:
Your excuse is straight out of the Phil Jones playbook. I don’t give a rat’s aspidistra whether it requires “further corrections”. If he wants to invite comments on it for ten, count’em, ten posts now, he can’t use the excuse that there may be “something wrong with it”.
Perhaps you would do it that way, and therefore you assume I would. I don’t do things that way. There are a number of folks out there whose actions I speak out against, but whose science is good. Even if you can’t maintain the distinction, I have no problem keeping the two separate.
In fact, we have the opposite problem. I’ve made few comments about Evans’ work, BECAUSE HE REFUSED MY DIRECT REQUEST TO LET ME SEE IT. But his adherents have already declared that it’s the best model since Elle McPherson, that it is a work of great insight, go over to his website and you’ll find enough adulation of his unseen work to last you for weeks. So perhaps you might direct your objections to them … and to the continued hiding of the code and data that lets them continue to claim that it’s a wondrous model.
This is the kind of thing that happens when a man hides his work. You are already denigrating my unwritten future comments on a hidden model that David refuses to let me see … and you advise me to wait and see the model before I say anything at all about David’s actions???
Physician … heal thyself. How about YOU wait until you see my analysis before you decide it is not going to be “good and unbiased”?
Regards,
w.
Monckton of Brenchley says:
July 2, 2014 at 2:02 am
Since the remarks which you find defamatory were comments in response to a blog post, I would hope that the blog would not be in the same legal position as the National Review in the Mann-Steyn case, so not also subject to a law suit.
It’s ok for some but not for others:
Monckton of Brenchley says: July 2, 2014 at 2:02 am
The legal position is now clearer. A grave libel has been committed – not, as I had thought, by only one person here, but by several. It has been persisted in after warnings to desist. The libel is based on a failure to pay close attention to what has already been revealed of Dr Evans’ work, and on a failure to wait for the imminent full disclosure before making serious criminal allegations, which have already begun to be repeated by others.
—————
Then compare this to the attacks on Mann and the response to his defamation action in this blog.
This seems a bit off to me!
or
Is Anthony going to start blogging about Monkton’s actions?
Monckton of Brenchley says:
July 2, 2014 at 2:02 am
Oh, dear heavens, Christopher, you have lost the plot entirely. Now you are not only discussing legal action against Leif, you have expanded it to include “several people” who you say have made “serious criminal allegations?
I thought that you couldn’t sink any lower than to threaten Leif with a libel action. Now, you’ve expanded the claim, but you haven’t even had the balls to name names. Instead, you are making accusations of criminal libel against un-named people … do you not see the irony in that?
Of course, since I’m the one who has made the same claims as Leif, I have no choice but to assume that I’m very probably on your legal hit list … but taking a page from David Evans’ playbook, you’re keeping your hit list secret …
Christopher, I’m done with this subject. No matter what your lawyers tell you, neither Leif nor I nor anyone has made “serious criminal allegations” about David’s work, that’s a pathetic joke. Your lawyers must be laughing all the way to the bank. Surely you must know that asking your lawyers if you should sue someone is like asking your barber if you need a haircut … are you really in mystery about what your barber will say?
I give up. You do what you want, Christopher. Go ahead, advise David Evans to instigate legal action against me. See if you can get triple damages against me. I’m sick of your legal threats, and your claim that the courts are the best place to decide scientific questions.
If you want to advise David to use the courts to impoverish me, to garnish my pittance of retirement savings and take away my house and the little that I have in this world to pay David Evans triple damages, GO AHEAD. I’m sick of the threats.
I have asked you, as a friend, to cease your legal threats agains Leif.
Instead, you have expanded your threats to encompass others, presumably including me, although you haven’t had the balls to say who you are referring to.
Really?
Do you truly not understand what horrendous damage you are doing to your reputation? Do you truly not understand that you are damaging David and Jo’s reputations? Do you truly not understand the damage you are doing to the skeptic side of the argument?
The part I truly don’t understand is what you think you will gain by your threats. Suppose you do convince David to sue Leif and I … do you think that will advance the cause of science? Do you think that will make the alarmists unhappy? Do you think people will congratulate you for driving me into poverty? Really?
The only people who will cheer such an action will be you and your lawyers. Everyone else loses in such a fight. Suppose David Evans prevails in his suit, and I’m thrown out of my home to pay him the threatened “triple damages” and left impoverished … is that a “giant step for mankind”?
Look, Christopher, you are advising David that he should try to take my hard-earned money because you got your feelings bruised … I don’t see any good result coming out of that for anyone but the lawyers.
But heck, if that’s what you want to advise David to do, hele on … I suspect, however, from my limited encounters with David and Jo, that they will thank you for your concern and decline your invitation.
And why they haven’t told you to shut up about them possibly suing Leif and I is a mystery to me … Jo and David, he’s dragging you down with him. Up to you, but in your shoes I’d slip him a quiet word that you’re not interested in legal action. Otherwise, you are already getting tarred with the same brush … and I doubt greatly if you want that.
Anyhow, Christopher, I leave you to your course of action, do what you want. I’ve done my best as your friend to try to stop you from harming yourself and others … and for my thanks I’ve been indirectly threatened with legal action. Since the old saying has it that “A threat of legal action is as good as a wink to a blind horse”, I’ll take that as an indication that your friends’ concern for your well-being is of no interest to you.
Sadly,
w.
In response to “Milodonharlani”, the blog that carries libels is technically capable of being sued, just as a newspaper is. However, I have been free to put the other side of the case and, in those circumstances, no action against the blog would be likely to succeed: nor, in those circumstances (nor in any foreseeable circumstances, for our kind host has been remarkably kind and generous to me) would I dream of suing the blog.
One of the many features of this case that struck the lawyer was the persistence of the perpetrators of the libels when they had been warned off. The courts, he said, would start by taking particular umbrage at any allegation of criminality or dishonesty made against a scientist, whose reputation for honesty is part of his stock-in-trade. But they would be very angry indeed – and that anger would be reflected in the damages – on seeing the sullen determination of the perpetrators, even after it would have become blindingly obvious to the reasonable man that they had no basis for alleging dishonesty, to continue to allege it.
It may have come as something of a surprise to some here that the law applies just as much to widely-circulated blogs as it does to widely-circulated newspapers. But it does. If Dr Evans were minded to pursue this to court, and if he could spare the time from his research to do so, there is only one circumstance – a certain sensitivity in this affair which I came across on analyzing what the perpetrators had said about Dr Evans – in which a judge or jury might not award very substantial damages. And it is precisely to give the principal perpetrator the advantage of that circumstance, in the interest of justice, that I shall be writing to his university once the dust has settled.
From Monckton of Brenchley on July 2, 2014 at 4:33 am:
Oh please, the swings are so great it’s pretty easy to get a total in the target range over a decade.
HadCRUT4 global obtained from WFT, 1900 to 2014.33 (latest data), monthly values, subtracting the end of a 10-year span from the start (ex. 1909.92 anomaly from 1900 anomaly), I found 229 spans with a temperature drop <= -0.1°C, out of 1252 total spans.
Thus Dr. Evans' lower figure is already being hit 18.3% of time since 1900. The lower range end is within natural variability.
For the high end, when the drop is <= -0.5°C, that has occurred 9 out of 1252 spans, thus 0.7% of the time.
Thus the low end is within natural variability, with nearly a one in five chance of it just happening. Thus Dr. Evans' model hitting the low end won't prove anything.
For a 95% confidence interval, only a one in twenty chance the prediction will just happen, you’d need 62 or less occurrences for those 1252 spans. My spreadsheet says that’d be a lower bound of at least -0.293°C, to only three decimal places just like the temperature data. Using the precision you used, using monthly values without further smoothing, the lower bound would have to currently be at least -0.3°C to be taken seriously.
Lord Monckton
Surely it is not up to you or your legal advisors to decide if a libel has been committed but to the court. I happen to agree with Willis on this one. Your position is looking like a busted flush.
dp says:
July 2, 2014 at 9:45 am
Thanks, dp, but I fear that you trying to equate my words with Lord Monckton’s threats of legal action just makes it clear that you don’t know what “bully” means.
Read the comment of mine that you linked, and point out the “bullying” that I’m subjecting Lord Monckton to. If you think I can “bully” someone over the internet merely with my words, and with no threats of any kind, then I invite you to bully me into changing my actions using just your words and no threats of any kind.
Sorry, dp, but your accusation makes no sense. To “bully” someone means to force them to do or not do something based on a threat. Without a threat, there is no bullying. Try out “Give me your lunch money or I swear I’ll be nice to you” … doesn’t work, does it?
I have made no threats of any kind. Therefore, I’m not bullying anyone.
Lord Monckton has threatened legal action, of course in a deniable manner, and is already using his money and his lawyers to advance the threat.
That’s bullying, dp … study up on the difference.
w.
This entire episode is useful to remind us all of important considerations as we talk about or devise alternative models to CO2 AGW. There are other cases of scientific conduct that the British courts have seen fit to decide and in the end, did not look favorably on regarding the scientific methods used. The US does not view this lightly either. Even when non-scientists seek to improve learning, such as with special educators and programs, methods and curriculum used need to be research based. Parents have won compensatory education for their child when the court has discovered that the curriculum used had not been shown in the literature to be tied to the amelioration of the child’s specific learning disability.
It behooves one and all to follow standard research methods and practice, be it in clinical practice, developing models, or smearing substances onto the gellatinous surface of a petre dish. Develop your introduction, do your literature review on both sides of your problem statement. Choose only unimpeachable investigative methods. Choose only unimpeachable statistical analysis and visual representations in graphic or other forms. State your results whatever they are, described as measureably significant or not significant. Leave no stone unturned in your attempt to falsify your own work. And come to only supportable conclusions.
Again, as this case serves to remind us. The consumer (that’s us) MUST learn to critique scientific practice else we place ourselves at the mercy of all manner of primrose path.
For one I’m not terribly impressed with TSI variances of 0.1% over a solar cycle when the UV output can vary 100% between cycles.
Statistics can neither prove nor disprove a relation of cause and effect, and abusing the numbers is not science.
The topic is climatic cooling, thanks perseverators for making it, per usual, about you, again.
From Monckton of Brenchley on July 2, 2014 at 10:54 am:
Oh goody. His Lordship shall kindly extend his magnificent forbearance to Anthony Watts, for now, and shall refrain from crushing Anthony Watts with ruinous legal fees as an insignificant bug beneath his mighty heel of justice, for now.
But Dr. Evans may not feel so restrained, and for the crimes against him there is no defense!
Beware, Anthony Watts, thou vile harborer of free speech and open scientific discussion. The British are coming!
REPLY: Oh, please. If I write an essay, or Monckton writes an essay, that’s one thing. Comments about essays is something else. I’ve been in touch with the Evans, they know that I bear them no malice. Quit making up scenarios without knowing what is going on with the actual people involved. – Anthony
Monckton of Brenchley says:
July 2, 2014 at 2:02 am
The allegations that he did so are regarded as grave not only in the British-law sphere but also in the courts of the United States, and for the same reason. The allegations were circulated on the world’s most-read climate blog. Damages – on both sides of the Atlantic and in Australia – would be enormous.
As regards ‘both sides of the Atlantic’ I doubt that very much, in the USA libel suits are rare because of the difficulty of prevailing in such cases. Given the changes in the English law, in particular the attempt to reduce ‘libel tourism’, it seems likely that the English courts would refuse to hear the case.
“The court will have to be satisfied that, of all the places in which the statement complained of has been published, England and Wales is clearly the most appropriate place in which to bring an action in respect of the statement.”
In any case the US SPEECH Act makes foreign libel judgements unenforceable in US courts.
So to the scientific point at issue. The courts, contrary to what Mr Eschenbach says, are a very good place to sort out disputes of this kind, where one side is making allegations of dishonesty and deception about the other.
Yet again the British government disagrees with you, Lord McNally in a speech on the new defamation law said, inter alia:
“A core concern underlying our commitment to reform the law was to protect scientific and academic debate from the threat of unjustified libel proceedings. The Draft Bill contained a range of measures which will help to encourage open and robust scientific and academic debate. These include generally applicable measures such as the introduction of a harm threshold, simplification and clarification of defences, and a single publication rule, together with specific ones such as the extension of qualified privilege to reports of scientific and academic conferences. ”
2. Method. Dr Evans’ basis for saying a decline in solar activity began in 2003 or thereby is founded upon 11-year smoothing of the data. The court would have regard to the fact that Dr Evans had made that plain from the outset, but that those who had alleged that his conclusion was deliberately false had shown a graph of data with 27-day smoothing, which had been tampered with to extend the smoothing curve across a period of several months were there were no underlying datga.
Not ‘tampered with’, the missing data was replaced with data from another satellite with the appropriate offset made.
http://www.leif.org/research/TSI-SORCE-Cycle-24.png
The court would have regard to the fact that those who have accused Dr Evans of having added bogus data to his system had themselves explicitly stated that if there were no data the analysis should stop there, and yet one of them had himself done, and can be proven to have done, exactly what he had condemned in Dr Evans.
What Leif condemned in Evans analysis was adding additional data into the future (termed extrapolation as opposed to interpolation, the distinction is well known to scientists but apparently not to you). Evans states that he assumes that he can extrapolate the data from September 2013 to December 2015 with the average value from Sept 2012-Aug 2013.
The court would conclude that the attack on Dr Evans had been widely circulated, intemperate, unscientific, excessive, premature, unsoundly founded in logic, persisted in beyond reason and after repeated requests to desist and calculated to damage him in his calling as a scientist, and to do so at a moment when the libellers knew he was about to release the fruit of many years’ work, and that the principal libeller, having demonstrably tampered with a graph himself in a fashion not dissimilar to that of which he had wrongly accused Dr Evans, did not in any event come to the court with clean hands.
What Evans had already released was in Leif’s opinion flawed because of the invalid data:
“Apart from the use of the obsolete Lean TSI for the early years, the most blatant error is the statement that TSI has had a sharp unprecedented drop starting in 2003-2005 to now. This is complete nonsense. Here is TSI since 2003 http://www.leif.org/research/TSI-since-2003.png
There is no such drop. If anything TSI is now higher than it were in 2003. As far as I am concerned, the model is already falsified. Not by the observations but by the use of invalid input to begin with. This concludes my comments as the prediction is worthless on its face.”
Coming in late to this sorry old debate here. People disagree about politics, and often bitterly. Science gradually corrects itself via the weight of evidence.
Perhaps the bigger surprise is that the likes of Willis Eschenbach seem so surprised by this whole blowup. What else would one expect when someone – a lay person as he admits – CM – is trying to get their way in a debate of science, when their background is primarily one of journalism and politics – where such posturing is quite normal. He is NOT a scientist: he’s just some “gentleman of leisure” (bloke) who knows how to sound “clever”. That is what journos and politicians do. Anyone surprised by that?
It’s a good example of why the climate debate has gone the way that it has – most of the real noise comes from people operating in a political sphere, attempting to do politics with science. The problem with that is that science is over time a self-correcting process across the sub-disciplines. Politics, by contrast, is an endless circus of errors and bluster, operating on very short-term (5 years or less) cycles, making it utterly inadequate in terms of securing a sustainable long-term future for Mankind. Monckton knows this. Morano knows this. Heck, Palin might know this! This is the future of your kids, grandkids and great grandkids that they are prepared to gamble with, like the counters on a blackjack table. But they all play the same game. Any gue$$ why? Google the following song: “Motorhead – Get back in line!”
In the meantime, I continue to volunteer for Skeptical Science, and though some may hate that site through their own politics, I promise you one thing. I have never lied in any of my posts on there, and never will. I can confidently say the same for the rest of the crew – we reference everything. Climate change poses a huge problem for Mankind – of that I have no doubt. So let’s stop squabbling over the petty politics and bloody-well do something sensible about it!
Willis erred with :
You have taken my usage of the noun form of “bully” and translated it erroneously to the verb form, “to bully”. Because of your serial penchant to bully your readers, the noun “bully” is appropriate. Notice I did not say, and you cannot find where I said that you bullied Monckton of Brenchley. If you like I can certainly dig up all the examples of your bullying others (See your “Open letter to…” posts for starters) but this isn’t the place for it.
I note too that you did use this diversion to artfully avoid responding your words which I quoted per your instructions. I also note you have not commented on my post regarding your claim that David Evans is (I paraphrase your words here) repeating exactly the words of Mann and Jones.
richardscourtney says:
July 2, 2014 at 8:59 am
Friends:
Phil. says at July 2, 2014 at 8:51 am
“It’s not in his style to admit errors.”
The irony of that is so extreme it is beyond possibility of mockery.
Surely, you guys must be able to see you have ‘jumped the shark’ when the troll who posts as Phil. has joined in.
Please desist.
Why don’t you?
One of us replies to comments and makes substantive posts the other makes drive-by comments of no substance like the one quoted here, easy to see who’s the troll. No doubt you’ll get your friendly moderator to remove this post too?
Regards “Reply” in previous comment:
Ah I don’t know, it just all sounds so serious as people yelp about being wounded when they brush up against the sharp edge of a word. A little levity seemed in order.
Plus there’s a strange synchronicity as this seems determined to drag out to the Fourth of July. Does make me want to laugh.
[snip – yes other things are off topic, but that doesn’t give license. I’m not going to allow you to bring a religious discussion into this, we have enough volatility as it is – Anthony]
Gary. Listen carefully. Total Solar Irradiance (TSI) includes all infrared radiation frequencies emminating from the Sun, including UV. Visible light is a very good source of heat. In fact all the shorter-wave infrareds are a very good source of heat. UV is in the much shorter-wave range and is a much smaller portion of the entire solar irradiance. It is also not as energetic in terms of its ability to heat up a large body of water. It’s very good at killing stuff. It just isn’t that good at heating water. So if variations in the entire solar spectrum, including the powerful heat-warming portion of solar irradiance does not appreciabily show a connection with surface temperatures, how do you think the much smaller less heat-producing portion would be?
The equation standards:
http://rredc.nrel.gov/solar/spectra/am1.5/ASTMG173/ASTMG173.html
Why we have equation standards:
http://en.wikipedia.org/wiki/File:MODIS_ATM_solar_irradiance.png
The UV portion versus the light spectrum visual:
http://energy.lbl.gov/coolroof/intro.htm
The UV portion band in the literature:
http://www.agu.org/books/gm/v141/141GM10/141GM10.pdf
Anthony says
http://wattsupwiththat.com/2014/06/28/a-cool-question-answered/#comment-1674922
Henry says
You had ample opportunity to put all of this to bed,
in fact I asked you to,
http://wattsupwiththat.com/2014/06/28/a-cool-question-answered/#comment-1674802
yet now you censor me????
REPLY: I can’t read every comment. I never saw it until just now.
You wrote:
So its OK for YOU to tell everyone to stop and Go home, on a place that YOU don’t manage, but not OK for me to keep this from turning into a religious flame session on top of everything else?
Sheesh.
And I’ve warned you before about bringing your religious pursuits here. Feel free to be as upset as you wish, but let me say that I get dozens of emails/comments a day telling me what I should and should not do. I can’t be everywhere, 24/7 to handle every situation.
Your comment was clearly out of line with policy of WUWT. Let me be clear. Do not bring religious discussions here.
– Anthony
John Mason,
You say,
I find a certain irony to your making this statement given Dana’s post today, which looks like little more than a policy discussion to me.
Would you agree that Dana is merely making noise?
Clearly, there are some people here that have some trouble hearing,
and they will continue to sit with that problem,
until they realize that there is a God
Blessings to you all
Henry
Pamela Gray says:
July 2, 2014 at 12:41 pm
Very roughly, of TSI IR is 40%, Visible 40%, UV 20%. Do the math.
Mr Mason says there are no falsehoods at “Skeptical” “Science”. However, there are several references to a paper claiming 97.1% “consensus” for the proposition that global warming is mostly manmade, when my read-down of the authors’ own datafile of all 11,944 papers whose abstracts they reviewed shows that they themselves marked only 64 papers, or 0.5% of the sample, as explicitly endorsing the quantitative or majoritarian consensus. The discrepancy between the 0.5% the authors found (and hid by not publishing the results for each of their levels of consensus separately) and the 97.1% they reported seems to me to be more than serious.
Besides, no one talks of “consensus” that the square on the hypotenuse is equal to the sum of the squares on the other two sides. Science does not advance by “consensus” because, in formal logic, argument from consensus is fallacious. Rather, it advances by the testing and rejection of defective hypotheses, for it is very seldom possible to prove a hypothesis in the physical sciences.
If one were to apply the scientific method to the paper claiming “97.1% consensus”, one would have to conclude that the hypothesis of such a consensus had failed, in that the authors of the paper themselves, who very much wanted a large consensus, were unable to mark more than 64 papers as actually endorsing that “consensus”. A re-examination of those 64 papers (Legates et al., 2013) found that only 41 of the 64 abstracts actually endorsed the majoritarian definition of consensus. That’s 0.3%. Accordingly, the hypothesis that there is a 97% consensus must fail, on two grounds. First, it’s only 0.3%. And secondly, science is not consensus, and consensus is not science. And, in this not unimportant respect, “Skeptical” “Science” has neither been skeptical nor scientific. Nor, given the results hidden from readers of the “97.1% consensus” paper, has it been truthful or forthright.
Indeed, Bedford & Cook (2013) contains several explicit and serious misstatements of the findings of the “97.1% consensus” paper. There, too, truthfulness – for whatever reason – seems absent.
My point is we are continuing a practice of tossing about numbers and abstractions as tho certainties like the number of our fingers and toes while ignoring the patently obvious.
Our climate in MN has changed. Arguing whether it can be the Sun is idiocy.
Gary, your statement is overly broad. UV enetration depends on the type of surface (water versus land) and what is on/beneath that surface. Most, if not all of it is reduced to 10% by the time it reaches 20 meters below the ocean surface. But be careful, even that statement is highly variable. The variation in solar UV output is TINY compared to the noise that Earth’s atmosphere and surfaces do to UV.
Please refer to the linked visual with the following footnote:
“Ultraviolet B (UV-B) radiation reaches different depths in ocean water depending on water chemistry, the density of phytoplankton, and the presence of sediment and other particulates. The map above indicates the average depth UV-B penetrates into ocean water. At the depth indicated, only 10 percent of the UV-B radiation that was present at the water’s surface remains. The rest was absorbed or scattered back towards the ocean surface. (Image courtesy Vasilkov et al., JGR-Oceans, 2001)”
http://earthobservatory.nasa.gov/Features/UVB/uvb_radiation3.php
typo “penetration”, not enetration.
Whatever happened to common courtesy?
If a similar guest post from the warmist camp was posted I am sure robust debate would ensue but not the embarrassing mudslinging going on above. Disagree, point out errors, falsify, request data yes, but accusations and mudslinging reflects poorly on the accuser, whether your right or wrong. Some have gone too far.
I came here from Jo Nova’s blog to check what all the fuss was about. I saw this post when it was first raised (because I visit practically every day), but I hadn’t been following the comments.
I’m just a layman who’s been coming here ever since Climategate broke; no one of any significance. But I’ll tell you what: I never thought that one or two hitherto respected people were capable of behaving so stupidly and vindictively before now, nor so intransigently. Comparing David Evans with Michael Mann because he hasn’t yet released his data after only a few weeks? Accusing him of intentional malfeasance? What’s that all about?
This blog has gone way down in my estimation. I wouldn’t be surprised if that applied to many others who’ve been regular and loyal readers for quite some time now. Anthony, keep an eye on your visitor hits from this point on. I know I won’t be visiting as often, and it’ll be interesting to see whether others won’t be, either.
I’m no climate scientist. I don’t really understand Evans’ model, and await the Cliff Notes version. For all I know it could be right or wrong, but for crying out loud, whatever happened to civility and patience? Whatever happened to the capacity to introspect and see what a damn fool one might be making of oneself, not to mention how much damage one might be doing to WUWT’s reputation?
I despair, I really do. I don’t care how smart people are or how many letters they might have after their names. If they behave like a brats in a tantrum, then they lose my respect, and even more importantly, my inclination to trust them.
Micahel Larkin, well noted, I don’t like the situation either, and I have taken some steps to improve the level of discourse here, but remember I’m damned if I do, damned if I don’t.
1. If I delete too many rude comments, comments which may have a point in the middle of all that rudeness, I’m immediately branded as the censor from hell.
2. If I leave the comments in, I’m accused of letting people run wild.
There’s no perfect solution. I will say that if you want to blame me and my blog for one comment thread out of 11 thousand published here, then that’s your right, though I think it is rather a knee jerk reaction that punishes me for the catch-22 that I am in.
Monckton of Brenchley, of course “no one talks of “consensus” that the square on the hypotenuse is equal to the sum of the squares on the other two sides”. That’s because it is a mathematical truism, proven using mathematical techniques. There are a lot of areas of science where a consensus has grown and is a reality. That’s because there are a number of areas of science where there are a handful of people who refuse to accept the established scientific position that has been arrived at based on scientific evidence.
A short list of these would include HIV/AIDS, evolution, vaccination, Moon landings and so on. Amongst those is climate change. As a rhetorical technique, your conflation of the two ideas looks good on paper. It is, however, not a fair comparison, as I expect you must have known when choosing the example. Maths is lucky in that it can deal with pure entities. Science has to deal with the messier, multivariate real world. That it has managed to achieve so much says something about scientists, and perhaps less about dilettantes.
“Hot under the Collar” is right. Allegations of criminality and dishonesty should be avoided. If either were present, a blog would not be the best place to deal with them.
Gary, for our sub-thread discussion it is more important to consider percent of solar energy in TSI as a function of wave length. Overall, the UV band contains far less than 20% of the energy available from total solar irradiance. So again, why concern yourself with UV variation when the total bandwidth, and in particular the bandwidth with most of the solar energy, doesn’t demonstrably show a global temperature solar cyclic pattern?
For the main discussion, Dr. Evans should have done a proper literature review which would have surely included this, which constitutes Lean’s current work on TSI reconstructions and climate modeling.
http://onlinelibrary.wiley.com/doi/10.1029/2010GL045777/full
Margaret Hardman says:
July 2, 2014 at 2:12 pm
“There are a lot of areas of science where a consensus has grown and is a reality.”
I think you mean has become accepted as a reality. No one has the faintest idea what reality actually is.
“That’s because there are a number of areas of science where there are a handful of people who refuse to accept the established scientific position that has been arrived at based on scientific evidence.”
This statement is indistinguishable from religious rhetoric, and in any case upside down. Those who refuse to accept established paradigms merely because a consensus exists about the interpretation of available evidence are the ones who are being properly sceptical and therefore behaving in a scientific way. Moreover, the real breakthroughs in science quite often come from one or a handful of sceptics.
From Pamela Gray on July 2, 2014 at 2:31 pm:
I mentioned that yesterday!
Good news Pamela, you’re my Echo of the Day.
dp says:
July 1, 2014 at 7:48 pm
Thanks, dp, but I don’t understand your confusion. You do know who Michael Mann and Phil Jones are, and what that did, don’t you?
Both Michael Mann and Phil Jones made the repeated claim that they were under no obligation to reveal their code and data until they decided to. I quoted Phil Jones upthread, and Mann not only refused to reveal his data and code, he went so far as to say that asking him for his data was “intimidation”.
In my quote above, I didn’t say that they each repeated the same words. I said that all of them had asserted the same claim, that they weren’t obliged to share their code and data until they decided to do so.
This, of course, is the same stance of David Evans, who has said that he will not reveal his data and code until he decides to do so.
Of course, anyone can conceal their data and code, it’s not a crime or anything. The problem is, no code, no data, no science … without code and data, as Mosh pointed out, it’s just an advertisement. Hiding the code and data has allowed David to “defeat” all objections to his work during ten long discussions of his ten long posts … sorry, but that’s not science.
I’ll leave you to look up further quotes, because no matter what quotes I come up with you can and likely will say “but no, that doesn’t mean the same thing” … that’s a fool’s errand. You want quotes on this one, find them yourself. If you don’t see that all three men are taking the same stand, that they can conceal the data and code until they want to release it and at the same time still call themselves scientists, I fear you are far beyond my poor power to add or subtract from your knowledge.
All the best,
w.
Ms Hardman says there is a “consensus” about HIV/AIDS, evolution, vaccination, Moon landings and so on, and that amongst these consensus is climate change. Well, of course there has been climate change for 4.5 billion years (or 6000 years, depending on whether you follow the amiably dotty calculations of the late Bishop Ussher based on the generations since Abraham).
It is established by titration that a particular virus is present in all patients with HIV; by mitochondrial DNA paleogenetics that the world is older than 6000 years and that certain species evolve, while others can eventually acquire fixed characteristics; by epidemiological and laboratory research that vaccination is efficacious. In short, all of these things are established by evidence, using replicable experiments. They can be verified. They are almost as certain as the fact that the square on the hypotenuse is equal to the sum of the squares on the other two sides.
However, one must define what one means by “climate change”. Do we mean the fact that the climate changes? We have only to look out of the window to see that that is the case. There will be 100% “consensus”. Or that, all other things being equal, climate may change to some unspecified extent owing to Man’s activities? There, too, it has been demonstrated by experiment that enriching the atmosphere with CO2 will – all other things being equal – cause some warming. So, again, there is no need for any such proposition to be sanctified by the notion that it is supported by a “consensus”. For it is demonstrably so.
However, if you mean that most of the global warming since 1950 was manmade, or that future global warming on business as usual will be 3.7 [2.6, 4.8] K this century, or that catastrophe may ensue if we do not shut down the West and establish a global government, then both the scientific and the political agreement will fall away to very much smaller values – too small, in fact,, to lay claim credibly to the existence of any “consensus”.
Wilful imprecision in defining what is meant by “climate change” has been a hallmark of the Thermageddonites for a generation. For they know, as Ms Hardman and I know, that there is no consensus that most of the global warming since 1950 was caused by us: indeed, we know from the datafile in Cook et al. (2013), though not from the paper itself and not from the acres of me-too lefto-bilge that have been written about it since, that the supposed consensus that most recent warming is manmade is 0.5%, not 97%. So it is possible that most recent warming was not manmade, in which event as little as 0.3 K warming in the 20th century may have been anthropogenic. As I have said, the argument from consensus, as applied to the climate question, fails in two respects. First, there is no 97% consensus; and secondly, science is not consensus, and consensus is not science.
Science is observation, followed by measurement, followed by the application of pre-existing theory to the results. In that process, there is no place for “consensus” whatsoever, and all those who wave the white flag of “consensus” are in effect surrendering, by admitting that they have no better argument than a logical fallacy dismissed as feeble-minded by Aristotle 2350 years ago.
I will beg Anthony’s and the moderator’s forbearance to respond one last time to Monckton of Brenchley in this forum.
I generally try to be a charitable reader. In this case I have specifically chosen *not* to read charitably. I do so because I do not like bullies or people who try to use power to intimidate others. Monckton of Brenchley does not extend the courtesy to others and deserves no charitable readings in return.
Monckton of Brenchley claims that when he wrote, “The graphs did not purport to be the IPCC’s graphs and were not labeled as such…” this should be interpreted as *only* referring to the ‘Battle of the Graphs’ image. I interpret ‘the graphs’ as applying to all the graphs that accompanied the article – and I made it clear that I was speaking of the reference materials.
The clear facts of the matter are that the caption below the figure on page 6 of the reference materials is incorrect. As I have already stated, the year is wrong *and* even correcting for the year it is NOT the graph used in IPCC 1990.
Charitably we would say the author made a couple of mistakes. I choose *not* to be charitable. The caption claims the graph came from UN [IPCC] 1990. This is a lie. The graph is *not* the graph that is in IPCC 1990 – it’s not authentic, it is a fake. Monckton of Brenchley uses weasel words to sweep this away. “As far as my inexpert eye can tell ….” Apparently he needs glasses. Clearly the X-Axis labels are different. He also needs to get his story straight. In one comment he says the graph was “sent to me by an eminent professor” in another comment he says, “I reproduced the IPCC’s 1990 graph…” and in yet another comment he says, ” I received the graph from a reliable source …”
I stated that *if* he were an academic or serious researcher he might be guilty of misconduct because of his shoddy research practices. His answer? That he is not an academic nor was he doing serious research. With this I will agree.
I will retract my claim that Monckton of Brenchley lied, *if* he will explicitly state:
A) The caption on Page 6 of his reference materials is wrong.
B) That the figure on Page 6, purportedly from IPCC 1996, is not from either IPCC 1996 or IPCC 1990 and that the figure is not authentic, i.e., a fake.
C) His research methods were shoddy and only excused by the fact he is neither an academic nor a serious researcher.
Note that I am only asking Monckton of Brenchley to explicitly state the truth. I will consider failure to state these simple truths as proof that his discourse has been neither ‘Right’ nor ‘Honorable’ but merely an attempt to intimidate and bully.
If Monckton of Brenchley is unable or unwilling to state these simple truths – well, I am the only Kevin O’Neill living in Franklin, WI USA (to my knowledge). It should take about 45 seconds on the internet to get my mail address.
Kevin, as noted upstream, I’m preparing a response, even though I have no dog in this fight, I’m trying to be fair and to get the actual truth. At first I thought Monckton was wrong as well and that he produced a shoddy graph. Research suggests otherwise.
Willis for goodness sake this ridiculous: Thanks, Agnostic. Read what I wrote. I didn’t ask you about “over-reacting”. Over-reacting is what you accuse me of. I asked about your opinion of his legal threats, a question I note that you haven’t answered.
I DID read what you wrote and I note AGAIN that you did not read (or perhaps comprehend) what I wrote. I DID answer regarding my opinion of his legal threats which was that is an over-reaction. I did NOT accuse you of over-reacting. Where specifically does it say I think you are “over-reacting”?
Here is the quote again: I have to say, apart from over-reacting to the demonstrably ridiculous remark by Lief Svalgaard that Dr Evans was “almost fraudulent” Christopher Monkton’s remarks are pretty reaonsable.
I clearly say that I think Monckton has over-reacted to what I also think is an intemperate, rude, and ignorant remark made by Leif. That’s my opinion. Will you “note” it now?
This is what YOU said:
So in your view it is “reasonable” for Lord Monckton to threaten legal action over a scientific question, in a venue where the truth is not a defense against libel? And it’s “reasonable” for Lord Monckton to threaten to try to have Leif fired or demoted?
I specifically said apart from his tack on Leifs fraud insinuations, that his remarks regarding Dr Evans work was reasonable. But you somehow confused that into meaning he was being reasonable about the fraud remark. That’s what I mean about putting words into peoples mouths. You didn’t read what I wrote and you attributed to me an opinion I directly and specifically indicated I did not hold.
Agnostic, what David has done is ask for our opinion of his scientific work. He has asked people to give their scientific comments and objections to his work, for post after post, a total of ten posts to date. Then when we have commented he has told everyone who disagreed with him that they were wrong
No, just you, and gave really good reasons – and in fact it’s those discussions that help someone like me with just enough technical knowledge to follow the conversation. Even then, you couched those questions as if Dr Evans was some newbie with a bizarre theory (happy to furnish you with examples if necessary) rather than serious scientist who had probably already thought of those points along the way to where he is now.
Look I realize the approach is novel, but it seems clear he is publishing the theory ahead of the model in order to canvass responses and make the final result as robust as possible. Has it not occurred to you the reason the full thing is not published yet is precisely because he is making changes to what sounds to me like a really large and complex undertaking for a single scientist to take on, let alone an unfunded one? According to Jo, one of the reasons it can’t be released right away is because they are updating with more recent data, which is, according to them a really big job.
The drip feed method, you may very well argue, is wrong, dubious, a bad way to go. Make the argument if you must, but stop this absurd and self-damaging charade that he is behaving like Michael Mann or Phil Jones and hiding his data or being fearful of someone trying to see if it is wrong.
I reveal and post my data and code when I post my studies. Yes, my studies may require “further corrections, revisions, updates, bug fixes”. That’s happened to me more than once.
Great! Then you’ll have some idea what’s going on. What if that “study” is really big and complex? Won’t it take a bit longer to check through before making public? Wouldn’t you want it to be as transparent as possible? Lest you be accused of not doing something that you had, but your code and data was in such a mess it was easily over-looked?
Back in Post II, I begged David, not asked him but begged him to reveal his work then and there.
He refused. I asked him again. He refused again.
…because it was not ready to be released. What’s the point of handing over the car if you’ve dropped the sump to check on a potential oil leak? And incidentally, I trawled Part II to look for your demands for the data and couldn’t find them. I don’t doubt you asked for it because I am pretty sure I remember reading it….and the response. Now that would be a worthwhile thing to quote don’t you think?
I found a beautiful quote for those who think that we are immature.
“The pursuit of truth and beauty is a sphere of activity in which we are permitted to remain children all our lives” ~Albert Einstein
🙂
Sparks says:
July 2, 2014 at 4:59 pm
My friend, thank you for a lovely sentiment. It perfectly expresses the joy I take in my scientific research.
w.
And with that lovely sentiment above, I’m closing this thread, There will be a followup thread related to my findings on the charges that Monckton botched a graph. I have not decided if I will allow comments or not.