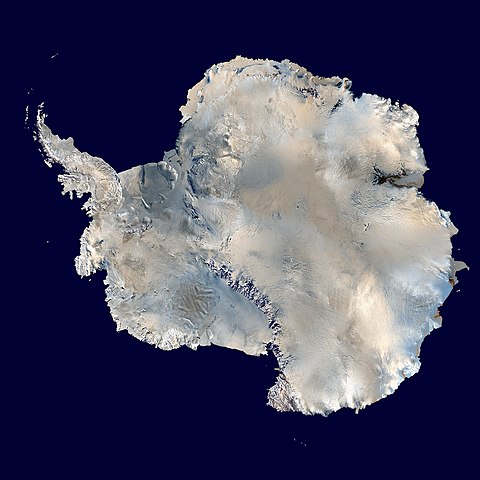
![480px-Antarctica_6400px_from_Blue_Marble[1]](http://wattsupwiththat.files.wordpress.com/2014/05/480px-antarctica_6400px_from_blue_marble1.jpg) From Geophysical Research Letters and the University of Leeds:
From Geophysical Research Letters and the University of Leeds:
Three years of observations show that the Antarctic ice sheet is now losing 159 billion tonnes of ice each year — twice as much as when it was last surveyed. See below for some sanity check calculations on why 159 billion tonnes really isn’t much more than a flyspeck in the scheme of things.
===========================================
Antarctica’s ice losses on the rise
Three years of observations show that the Antarctic ice sheet is now losing 159 billion tonnes of ice each year – twice as much as when it was last surveyed.
A team of scientists from the UK Centre for Polar Observation and Modelling, led by researchers at the University of Leeds, have produced the first complete assessment of Antarctic ice sheet elevation change.
They used measurements collected by the European Space Agency’s CryoSat-2 satellite mission, which carries an altimeter specially designed for this task.
In sharp contrast to past altimeter missions, CryoSat-2 surveys virtually all the Antarctic continent, reaching to within 215 kilometres of the South Pole and leading to a fivefold increase in the sampling of coastal regions where today’s ice losses are concentrated.
Overall, the pattern of imbalance continues to be dominated by glaciers thinning in the Amundsen Sea sector of West Antarctica.
However, thanks to the improved capabilities of CryoSat-2, problem areas such as the rugged terrain of the Antarctic Peninsula can now also be surveyed.
On average West Antarctica lost 134 gigatonnes of ice, East Antarctica three gigatonnes, and the Antarctic Peninsula 23 gigatonnes in each year between 2010 and 2013 – a total loss of 159 gigatonnes each year.
The polar ice sheets are a major contributor to global sea level rise and, when combined, the Antarctic losses detected by CryoSat-2 are enough to raise global sea levels by 0.45 millimetres each year alone.
In West Antarctica, ice thinning has been detected in areas that were poorly surveyed by past satellite altimeter missions.
These newly-mapped areas contribute additional losses that bring altimeter observations closer to estimates based on other approaches.
But the average rate of ice thinning in West Antarctica has also increased, and this sector is now losing almost one third (31%) as much ice each year than it did during the five year period (2005-2010) prior to CryoSat-2’s launch.
Lead author Dr Malcolm McMillan from the University of Leeds said: “We find that ice losses continue to be most pronounced along the fast-flowing ice streams of the Amundsen Sea sector, with thinning rates of between 4 and 8 metres per year near to the grounding lines of the Pine Island, Thwaites and Smith Glaciers.”
This sector of Antarctica has long been identified as the most vulnerable to changes in climate and, according to recent assessments, its glaciers may have passed a point of irreversible retreat.
Launched in 2010, CryoSat carries a radar altimeter that can ‘see’ through clouds and in the dark, providing continuous measurements over areas like Antarctica that are prone to bad weather and long periods of darkness.
The radar can measure the surface height variation of ice in fine detail, allowing scientists to record changes in its volume with unprecedented accuracy.
Professor Andrew Shepherd, also of the University of Leeds, who led the study, said: “Thanks to its novel instrument design and to its near-polar orbit, CryoSat allows us to survey coastal and high-latitude regions of Antarctica that were beyond the capability of past altimeter missions, and it seems that these regions are crucial for determining the overall imbalance.”
“Although we are fortunate to now have, in CryoSat-2, a routine capability to monitor the polar ice sheets, the increased thinning we have detected in West Antarctica is a worrying development. It adds concrete evidence that dramatic changes are underway in this part of our planet, which has enough ice to raise global sea levels by more than a metre. The challenge is to use this evidence to test and improve the predictive skill of climate models.”
Professor David Vaughan of the British Antarctic Survey said: “The increasing contribution of Antarctica to sea-level rise is a global issue, and we need to use every technique available to understand where and how much ice is being lost. Through some very clever technical improvements, McMillan and his colleagues have produced the best maps of Antarctic ice-loss we have ever had. Prediction of the rate of future global sea-level rise must be begin with a thorough understanding of current changes in the ice sheets – this study puts us exactly where we need to be.”
Dr Ian Joughin at the University of Washington, author of a recent study simulating future Antarctic ice sheet losses added: “This study does a nice job of revealing the strong thinning along the Amundsen Coast, which is consistent with theory and models indicating this region is in the early stages of collapse.”
The findings from a team of UK researchers at the NERC Centre for Polar Observation and Modelling, are published in the journal Geophysical Research Letters. Professor Vaughan and Dr Joughin were not involved in the study.
Sanity Check:
From Climatesanity: Conversion factors for ice and water mass and volume
If one cubic kilometer of water (i.e., one gigatonne of water) is spread evenly over the entire 361 million square kilomters, the thickness of the new layer of water will be given by:
1 km³ / 361 x 106 km² = 2.78 x 10⁻⁶ meters = 2.78 microns.
Or, in terms of gigatonnes:
1 Gt x (1 km³/Gt) / 361 x 106 km² = 2.78 x 10⁻⁶ meters = 2.78 microns / Gt
That is, one cubic kilometer of water (i.e., one gigatonne of water) will add less than 3 millionths of a meter to the oceans!
From the press release, we are seeing about 159 billion tons/year of ice converted to meltwater (unless it sublimates), so the effect on sea level would be 159/1000 or 0.159 159 x 3 millionths of a meter, or 477 millionths of meter of sea level rise per year from this. (or in other words 0.47 mm which works out to 47mm/century or ~1.85 inches/century)
For another perspective, a gigatonne of water is approximately one cubic kilometer. Frozen as ice, it would be expanded slightly, but for the purposes of perspective lets just say that is negligible. So, the ice loss per year would be 0.159 cubic kilometers.
According to the British Antarctic Survey BEDMAP2 project:
The derived statistics for Bedmap2 show that the volume of ice contained in the Antarctic ice sheet [is] 27 million km3…
Source: http://www.antarctica.ac.uk/bas_research/our_research/az/bedmap2/index.php
And thanks to those helpful kidz at “Skeptical Science”, we have this graphic depicting a cubic kilometer of ice. John Cook writes in 2010:
A visual depiction of how much ice Greenland is losing
One gigatonne is one billion tonnes. To get a picture of how large this is, imagine a block of ice one kilometre high by one kilometer wide by one kilometre deep (okay, the edges are actually 1055 metres long as ice is slightly less dense than water but you get the idea). Borrowing from alien invasion movies, the scale is well illustrated by comparing a gigatonne block of ice to a famous, historical landmark like the Empire State Building:
![empire_state1[1]](http://wattsupwiththat.files.wordpress.com/2014/05/empire_state11.jpg?resize=181%2C189)
OK there are 14 million square kilometers of ice surface in Antarctica, not counting sea-ice. See if you can spot the tops of the 159 of these square kilometer ice blocks from this satellite view
Now imagine just 0.159 159 of those 1 cubic kilometer ice blocks missing each year. Scary, huh? Damian Carrington at the Guardian thinks so:

And so, the loss of 0.159 159 cubic kilometers of ice per year is apparently headline worthy, because at that rate of loss, it would take 169,811 years to lose all the 27 million cubic kilometers of Antarctic ice.
I’m pretty sure we’ll have gone through a few ice ages by then.
(Update: I made an error in the initial post with units, where I conflated kiloton/gigaton in one step, fixed)
The BBC says:
The melt loss from the White Continent is sufficient to push up global sea levels by around 0.43mm per year.
You say:
The effect on sea level would be 159/1000 or 0.159 x 3 millionths of a meter, or 0.477 millionths of meter of sea level rise per year from this.
So there is a factor of 1000 difference between you and the report by the BBC. I don’t konw who is right but part of your formula cancels out to one:
1 Gt x (1 km³/Gt)
This is denial in its purest form. The Antarctic is getting colder and Antarctic sea ice is increasing.
How does ice melt in the interior of antartica? The temp never rises above freezing. Ice ‘lose’ in this context is probably due to ic sliding down to the sea not being replaced fast enough in the interior. The faster slide may be due to the past million years or so of grinding away an easier route to the sea.
You need a 159 of those cubes, not .159 ? But it’s been a long day. I could be wrong.
[snip waayy off topic -mod]
No need to worry, Antarctica’s loss is Greenland’s gain.
Greenland has gained about 500Gt since 1 September last year. On average it gains 400Gt/year.
Of course, in order to stop it catastrophically building up into an enormously high mountain it has to calve that accumulation every year into the sea via its outlet glaciers – that’s a lot of icebergs.
http://www.dmi.dk/en/groenland/maalinger/greenland-ice-sheet-surface-mass-budget/
One more thing conveniently omitted in the press release, but prominent in the abstract (http://onlinelibrary.wiley.com/doi/10.1002/2014GL060111/abstract): the error range for the east Antarctic ice loss of 3Gt/year is a whopping +/-36 Gt/year!
Anthony,
Unless I’m going mad (quite possible), if 1Gt of water is 1 cubic km then the loss per year would be 159 cubic km not 0.159 would it not?
Cheers,
Mark
I think we lost 1000 somewhere half way through.
Of course, you could say that a negative mass balance for Antarctica is indicative of the continent becoming drier – ice streams running at their old rate but reservoir of ice not being filled at the old rate.
How does that fit in with a warmer, wetter planet?
I think the mistake is here:
we are seeing about 159 billion tons/year of ice converted to meltwater (unless it sublimates), so the effect on sea level would be 159/1000 or 0.159 x 3 millionths of a meter
There’s no need to divide by 1000 as 1bn tons (tonnes?) is the same as 1GT, not 1000 times larger
Still, try spotting 159 of those cubes.
1. “Sanity Check:
From Climatesanity: Conversion factors for ice and water mass and volume
If one cubic kilometer of water (i.e., one gigatonne of water)”
2. “A visual depiction of how much ice Greenland is losing
One gigatonne is one billion tonnes.”
3. “From the press release, we are seeing about 159 billion tons/year of ice converted to meltwater (unless it sublimates), so the effect on sea level would be 159x
/1000…. “Re the error in maths: Perhaps you were thinking the US billion (1*10^12) rather than the standard billion (1*10^9)? As it is, in the piece you actually refer to a km^3 as being a Gigatonne. So it looks like the BBC may be right – for once. Whatever, the difference – as we used to say in engineering circles – is less than half a gnat’s c*ck when it comes to sea-level rise.
The Guardian are expert at presenting any cause in the most dramatic, scary terms.
‘Collapse’.
‘Doubling’.
‘Irreversible’.
‘Shedding’.
‘Catastrophic’.
‘Sea levels to rise 4 metres’
Shedding 160 billion tonnes annually sounds suitably ‘catastrophic’. Causing sea levels to rise by a fraction of a mm each year, taking ‘up to 1,000 years to rise by 4 metres’, not so much.
The numbers have soooo many zero’s though…
For the easily impressed…………………….?
Harry,
Nearly half a millimeter a year is certainly significant – though not enough to reach some of the extreme claims for sea level rise
Its not just me that got confused by the maths then.
Even then, trying to spot 159 blocks of ice missing in 14 million is like trying to find a gnat’s brain with a magnifying glass – impossible. In the grand scheme of things and in context the numbers are nothing. But the SOP of those with a campaign to push is to use large scary numbers.
If the “new” cryosat 2 is a much improved version of the old one, how do they “know” they weren’t under-measuring this paltry amount of ice melt in the first place, so how do they “know” it’s actually got worse? If this is raising sea-levels by c0.45mm/annum, to achieve the much ballyhooed 6m sea level rise would take well over 13,000 years to do it! To raise sea-levels by 1m would take over 2000 years to achieve!
Deja vu. At the risk of repeating myself. When in college in the 1980s, during our surveying sessions we were instructed about the all new Wilt T2 Total Station Theodolite with it’s “pretty sophisticated bit of electronic kit!” (Their words not mine). We were also advised that Wilt (pronounced Vilt) could measure angles to 1 second of arc accuracy & was the best in the World. However, being engineers, they advised us that the Japanese also claimed their top range theodolites could also read angles to 1 second of arc accuracy. The difference being, that the Japanese actually ground their optical lenses to 1 second of arc accuracy, whereas the Swiss instrument had its optical lenses ground to only 3 seconds of arc accuracy! Just saying, it’s all down to tolerances. I have seen claims for all sorts of climate related things over the last ten years, much based upon modelling, whereby temperature or sea-level or whatever could rise by ‘X’ or ‘Y’ amount per year + or – ‘2X’ or ‘2Y’ tolerance. In other words zero rise!
Since this concerns an English publication, I take ‘billion’ to stand for 10e9. So, 159e9 tonnes of water = 159 cu.km of water, not 0.159, or about 177 cu.km of ice, and the associated sea level rise is indeed around 0.44 mm as reported, not micrometer. Still, nothing to panic about on the scale of things.
In the US system.
1 Giga = 10^9
1 Billion = 10^9
1 Terra = 10^12
1 Trillion = 10^12
1 Peta = 10^15
1 Quadrillion = 10^15
1 Exa = 10^18
1 Qintillion = 10^18
But there are differences in the old British system.
1 billion = 10^12
1 trillion = 10^18.
Not sure which one they used, but I suspect it’s the US system where Giga=billion= 10^9.
The report says 0.45mm/year. That is very small, but 1000 times bigger than your number. And it is right. You have made a mistake in the arithmetic when you put 159/1000.
Yes, it’s 0.43mm pa, or 1.7 inches per century.
Your math is wrong. Its 159 cubic kms of ice melt per year, its still peanuts in the scheme of things. And Antarctica should take about 170,000 years to melt away. We’ll be well into the next glaciation by then.
Let me guess, it will likely be called the anthropocene glaciation I’m sure. Lol!
Is there an isostaic rebound calculation used with cryo sat2
Sea level rise.
http://climate4you.com/images/UnivColorado%20MeanSeaLevelSince1992%20With1yrRunningAverage.gif
http://sealevel.colorado.edu/files/2013_rel8/sl_ns_global.png
This is funny, declining sea level in the same area as the ice looses ? ( Or am i wrong ? )
http://sealevel.colorado.edu/files/current/sl.jpg
The report is right. There’s an error of 1000 in this post, probably because of considering billions to mean a multiplier of 10^12 instead of the american 10^9, or viceversa.
Anyway, 4mm per year is at odds with current sea level change MEASUREMENTS, which are lower than that. Something else must be making the sea level go down to get our current increase rate of only 3.2mm per year. Probably “it’s a travesty” that they cannot explain the missing water lol
Mike Jonas says: May 20, 2014 at 1:59 am
I agree, I’m afraid the post is out by 1000. There’s some confusion above and that doesn’t help but the OED is clear.
http://www.oxforddictionaries.com/words/how-many-is-a-billion
10^12 used to be a UK billion but we’ve mostly adopted the 10^9 US version.
“The radar can measure the surface height variation of ice in fine detail, allowing scientists to record changes in its volume with unprecedented accuracy.”
The so called loss of ice could be due to land subsidence. They should be measuring the surface level of the ice as well as the underlying level of bedrock to assure that there is a loss in the volume of ice. At the moment they are only measuring a gain in air space.
Harry, I think it is the other way around.
Europe, US, 1*10^x
million, million 1*10^6
milliard, billion, 1*10^9
billion, trillion, 1*10^12
And I think we need 159 cubes.
Joel O’Bryan says:
May 20, 2014 at 1:52 am
So, what would a gazillion measure? (Tongue planted firmly in cheek!) 😉 Probably any scary number that hasn’t yet been thought of that counteracts the facts?
So how does this equate to no global warming for 17 years and record sea ice area in Antarctica this year, as recently reported by WUWT?
Just to sum up the maths (because I had to check it anyway!)
1 Gigatonne = 1 km3
So a sea rise of 2.78 micron per 1 km3 melted is correct for the stated ocean area.
So melting 159 km3 would result in a sea rise of 441.7 microns, or 0.4417 mm……
So you are looking at 159 of those blocks …
But even that wonderfully accurate satellite does not really know what the melt rate is, because ice loss measure is complicated by isostatic rebound – as ice is lost, mantle rock moves inwards and upwards to take its place.
……and so computer models are employed. Many revisions of their outputs have occurred.
From Skeptical Science:
Previous predictions of present-day GIA have implied that this process adds 100-200 Gt/yr to the GRACE signal over Antarctica; this must be subtracted from the raw GRACE data to reveal the rate of present-day ice-mass loss. This GIA correction is about as large as, or larger than, expected present-day ice-mass change. If the GIA model were to predict smaller GIA mass change, the GRACE estimate of ice mass change would be smaller by the same amount, so it’s clearly very important to have an accurate GIA model.
To me, …. not so re-assuring that the figures are meaningful.
It takes 1.09 cubic inches to make 1.00 cubic inch of water, so we are saved by 9% less water rise depending exactly on how much lateral expansion is possible instead of just rise.
AndyL says:
May 20, 2014 at 1:43 am
How? Why? Compared to what?
And they can measure that rate of loss – with no margin for error from satellite?
Nylo says: “Probably “it’s a travesty” that they cannot explain the missing water lol”
The missing water is hiding in the deep ocean……
Remember how sea level suddenly rose when the satellite era began?
http://www.thegwpf.org/sea-level-shenanigans/
http://www.john-daly.com/altimetry/topex.htm
Harry
compared to the 2-3mm / year rise we currently have, it’s an increase of 15-25% (rounded up)
“ven then, trying to spot 159 blocks of ice missing in 14 million is like trying to find a gnat’s brain with a magnifying glass – impossible. In the grand scheme of things and in context the numbers are nothing. But the SOP of those with a campaign to push is to use large scary numbers.”
That will take about 88.000 years? And sea level rise of about 38 meters?
?
“Remember how sea level suddenly rose when the satellite era began?
http://www.thegwpf.org/sea-level-shenanigans/
http://www.john-daly.com/altimetry/topex.htm”
I remember UNEP keen on getting those that measure sea level into the UN system, like WMO?
Let’s hope it doesn’t continue to double every 3yrs.
Thier accuracy is approx 0,0008% of the total antarctic mass. NO WAY they can’t measure, calculate, estimate that with that kind of accuracy.
I always go for the so called supplementary information to the paper which is usually free and gives you the detail as to how they did their detailed calcs. Here’s the link to the supplementary pages for this paper (taken by navigating through links from the BBC article):
http://onlinelibrary.wiley.com/store/10.1002/2014GL060111/asset/supinfo/Aux_material01.doc?v=1&s=71ac88fc936c00a2f80a41a3d7570004457788e9
It’s all estimates ladeled on model outputs…ladeled on more estimates.
@Alan the Brit: you are right. They say that the increased resolution has added thinning data for the West Antarctica peninsula and other coastal regions, adding 31% of loss at a stroke and that is what brings the new measurements into line with ‘other methods. In other words, that 31% loss increase was always there and is being used as part of the “doubling”. They hurriedly go on to say but the whole sheet has thinned too but don’t say by how much (the 2cm/yr statement is a back calculation from the 160 Gt loss so isn’t the actual elevation reduction they are referring to). So we are left in the dark as to what the real world increase is over the 2005 to 2010 survey. The info in this paragraph isn’t in the supplementary pages but gleaned from various sources including the BBC article and the abstract.
Can someone here dig out the 2005-10 survey data just to check they are not spinning regarding the simple, raw data doubling as well? If they are, the resulting decrease from 2010-13 may be commensurate with the East Antarctica gains in previous years, in other words, equilibrium.
PS I realise the 31% loss on coastal regions can’t be directly compared with the 100% doubling because it is regarding a sub section of the whole sheet. However, we don’t know how big a sub section it is and the authors acknowledge that the coast is where most of the thinning is. By that logic, the phantom 31% portion of the increase in coastal yearly loss could actually translate to more than 31% of loss for the whole sheet if the elevation of the rest of the sheet is near-stable. That may be the reason they rush to say that the whole sheet is losing ice. I suspect that portion of the loss is minuscule and well inside the vast error bars cited in the abstract. If so, this would leave the phantom 31% as the prime contributor to the claimed doubling. I smell a rat.
AndyL says:
May 20, 2014 at 2:41 am
And??? So what? Where’s the beef?
I love how the WUWT commenters have so quickly done their own “due diligence” “peer review” on this post and pointed out a fundamental math error in the report’s critique by Anthony. Fully a third of them did their own calcs and immediately jumped on the math error. Other commenters focused on how the current Antarctic melt rate is, essentially, non-catastrophic in the overall scheme of things. And the warmists claim we WUWT readers are math-illiterate and uncritical acolytes of a denier cult? Sheesh!
They say that E Antarctica has lost 3Gt. Area of E Antarctica is about 12 million sq km. Over that area, 3Gt has an average depth of 3/12000000km = 3/12mm = 0.25mm. Colour me sceptical.
Can you please check the math?
Wiki gives Antarctic ice mass as 26.5 million cubic km.
Loss is given as 159 billion tonnes a year.
Therefore it would take 167,000 years to melt, assuming the simple division (which one cannot).
Ocean volume is 1.37e9 cubic kilometers
The volume of ice in Antarctica is approximately 25,000,000 km3. The volume of ice in Greenland is approximately 2,500,000 km3. The rest of the land ice is small compared to these two, so it is fair to round up and say the total is about 30,000,000 km3.
The world’s oceans have an area of about 335,000,000 km2. If half of the ice in Antarctica and Greenland were to melt, then the oceans would rise about 45 meters (about 150 feet). All of the ice melting would raise the oceans 90 meters (or 300 feet). This requires that all the 30,000,000 km2 of ice must melt.
How fast is ice actually melting? There are conflicting numbers resulting from various methods of measuring. Velicogna (Science, vol 311, 2006) used time varying gravity measurements from the GRACE satellites estimated that Antarctica was losing 152 km3 of ice per year. In the same journal, Davis (Science, vol 308, 2005) concluded that Antarctica was actually gaining ice.
There are studies that claim faster rates of ice loss in the Antarctic than claimed by Velicogna. For example, Eric Rignot, (Rignot, et. al., “Recent Antarctic ice mass loss from radar interferometry and regional climate modeling,” Nature Geoscience, 2008 [3]) of the California Institute of Technology used satellite interferometric synthetic-aperture radar observations to show that the ice losses in the East Antarctic were zero, while the West Antarctic and the Antarctic Peninsula had combined losses of about 190 gigatonnes per year. This results in a 0.5 mm ocean rise per year, or about 2 inches per century.
Similar conflicting (but small) results hold for Greenland.
At current rates of melting it will take about 200,000 years for all the ice to melt in the Antarctic. This scenario is unlikely because if the pattern of the last 2 million years continues, the next 200,000 years should contain two ice ages, each lasting about 10,000 years. If this conclusion surprises you, even Al Gore’s presentation shows the repeating glacial/interglacial pattern of 100,000/15,000 years during the Quaternary. [The Quaternary Research Association describes the Quaternary as “…characterized by long periods (c.100,000 years) of cold climates interspersed with shorter periods (c.10-15,000 years) of warmer conditions.”]
Ice in water has displaced its weight. Ice expands when it freezes which is why it floats. Therefore ice that melts will neither add nor subtract from the water level. The calculation is simple. Even at 300 Gt per year land ice melt, the oceans will rise a tiny 0.85 mm per year. Too bad for the climate hysterics that they’re never going to see any cities under water.
Note: Davis’s co-authors of the Rignot paper 2005 uses radar altimetry which has an upwards-trending bias in regions of high slopes and rugged terrain, thus resulting in lower than actual mass losses in the WAIS. The Velicogna measurements have been corrected since then with an adjustment for glacial isostatic rebound which is more appropriate, and the result is mass declines. See Allison et al. 2009 for the most comprehensive summary of the ice sheet contributions since some papers that are being cited are outdated. Velicogna’s 2009 paper is a good read and so is Pritchard et al. 2009.
[1] http://www.sciencemag.org/cgi/content/abstract/sci;311/5768/1754?maxtoshow=&HITS=10&hits=10&RESULTFORMAT=&author1=velicogna&andorexacttitleabs=and&andorexactfulltext=and&searchid=1&FIRSTINDEX=0&resourcetype=HWCIT
[2] http://www.sciencemag.org/cgi/content/abstract/sci;308/5730/1898?maxtoshow=&HITS=100&hits=100&RESULTFORMAT=&andorexacttitleabs=and&andorexactfulltext=and&searchid=1&FIRSTINDEX=0&volume=308&resourcetype=HWCIT
[3] http://www.nature.com/ngeo/journal/v1/n2/abs/ngeo102.html#a2
****
When faced with mathematical calculations and data, certain political groups and “green” Eco-zealots scoff at these facts. To those groups I would ask what is more probable; a government looking to generate funds from loosely-based quasi-religious ideas, or all the ice on the Earth melting and drowning everyone?
What is the dynamic ice balance for Antarctica? it collects up say .3 meter =( .3/1000 km) of ice each year via snow etc x 14 m sq km = 4200 cubic km annually so the article is saying that the continent is loosing 4360 cukm or 3.8% more annually over the period of observation, a small increase in precipitation of 3-4 % over a period ,or a minute amount of cooling will change the ice loss to and ice accumulation. The observed change probably falls within a range of natural variability.
The area of the oceans is about 3.6e8 square kilometre. An addition of 360 gigatonne of water raises sealevel by 1mm.
Mr Watts estimate looks about right.
The “US Billion” is not 10^12. That’s a Euro thing. And it clearly says gigatonne. It’s just a math error. 0.5mm/year. Not at all trivial. Still not scared.
If Antarctica really is losing that much ice, then someone is going to have to explain to me how that is posible when Antarctica is just flat out not warming at all. They just recorded the coldest temperature ever recorded on the surface of the planet in August of 2010 in Antarctica, which is when this survey started. So someone is going to have to tell me how during record cold, more ice can melt than ever before. Its not making sense. We’re constantly getting conflicting info.
160 Giga tonnes sounds like a lot, but not when you know that total accretion each year is around 1900 Gt (so total loss must have been around 2060 Gt). Since accretion and loss are totally different mechanisms i find it quite surprising that there is almost as much total gain as total loss.
http://www.waisworkshop.org/presentations/2011/Session4/Zwally.pdf
Its a standard trick of AGW propagandists to quote big scary numbers, and to fail to put them in a proper perspective.
“0.5mm/year. Not at all trivial.“. So what is trivial? Well, I reckon anything under, say, 1 foot per century is trivial. So how much is 0.5mm/year? It’s 2 inches per century.
Goldie says:
May 20, 2014 at 2:33 am
And they can measure that rate of loss – with no margin for error from satellite?
==================================================================
Good Question.
Answer: Maybe. The press release doesn’t really tell us what we’d need to know to answer that question — how much is the Antarctic ice surface level changing and how accurate, really, numerically, is the satellite? Cryosat-2 is purportedly able to measure changes to about 1.3cm. ( http://en.wikipedia.org/wiki/CryoSat-2 ) It’s not clear whether than includes errors due to uncertainty about satellite position which might be, based on the Topex/Poseiden satellites which also use DORIS for position determination most likely a couple of cm.
We’re told that 0.44mm of sea level rise are coming from Antarctic ice loss and that most of that is at the edges of the continent. According to wikipedia, the surface area of the seas is about 3.6×10^8 km^2 and of antarctica is 1.4×10^7 km^2. If we assume that the ice loss is from 10% of the continent’s area, the elevation change would be 0.44*3.6*10^8/(1.4*10^7)mm
= 0.44*2.6*10^2 mm = 114mm = 11.4cm/yr. So, yeah, given three years and if the force is with them, and assuming I haven’t lost a factor of 10 or 100 or made some other grevous error, it’s possible that they can measure the ice loss well enough to estimate ice loss with an error of 10-20% …. give or take.
“Sasha says:
May 20, 2014 at 3:52 am
Ocean volume is 1.37e9 cubic kilometers”
Can we use terms that (I do understand what you say) others might understand more readily? So ocean volume is (approx) ~1.37 BILLION CUBIC KILIOMETERS. 1.37e9 cubic kilometers means nothing to most people.
given most the population spend their school days taking selfies its easy to impress people with big sounding numbers and so make it scary.
MattN – I’m not saying they are right, but it is conceptually possible for an ultra-cold Antarctica to lose ice by transpiration with low precipitation not replacing it. Mt Kilimanjero has done this in the past.
“1.37 BILLION CUBIC KILIOMETERS. 1.37e9 cubic kilometers means nothing to most people.”
Neither does a “billion” apparently.
Patrick , perhaps you’d like that in Hiroshima bombs and Empire state buildings. Pop over to see Sturmbandfuehrer Cook.
Don K – you are out by a factor of 10 (10^8/10^7 is 10 not 10^2). So your final figure becomes 1.14cm/yr. But there is still the problem that 90% of the continent has been ignored in that calc, and a gain of just 1.2mm (less than measurable) over the rest of the continent wipes out the loss. So the final figure is statistically indistinguishable from zero.
“Greg Goodman says:
May 20, 2014 at 4:26 am”
No, not really. 1.37e9, of anything, means nothing to most people. That was my point.
Greg Goodman says:
May 20, 2014 at 4:26 am
…Empire state buildings.”
That was a B17 in fog…
[B25, not B17. Mod]
I don’t understand how ice loss can be increasing / “worse than we thought” while sea level rise fails to accelerate. Even before doing math, logic tells me that the increase must be false or negligible.
Fascinating that as summer fails to take hold in the Northern Hemisphere that the Warmist Alarmist machine turns to the vast, frozen and very remote continent of Antarctica as it’s major source of scare stories.
I’m beginning to think that we skeptics are the only people who take these pricks seriously any more.
Patrick says:
May 20, 2014 at 4:17 am
OK, Patrick. Sometimes I get a little carried away with myself and just assume everyone will know what these expressions mean. Anyway…let’s add some relevant facts…
Ocean volume is 1.37e9 – 1.37 billion – 1,370,000,000 – cubic kilometers
****
How many gigatonnes of land ice must melt to raise the oceans one millimeter (10-3 meters)?
1 mm / (2.78 microns / Gt) = 10-3 m / (2.78 x 10⁻⁶ m / Gt) = 360 Gt
[Similarly, 360 km³ of water will raise the oceans 1 mm.]
****
How many gigatonnes of land ice must melt to raise the oceans one inch?
1 inch = 25.4 mm = 2.54 x 10⁻² meters
1 inch x (2.54 x 10⁻² m / inch) / (2.78 x 10⁻⁶ m / Gt) = 9137 Gt
[Similarly, 9137 km³ of water will raise the oceans 1 inch.]
Mike Jonas says:
May 20, 2014 at 4:33 am
Don K – you are out by a factor of 10 (10^8/10^7 is 10 not 10^2). So your final figure becomes 1.14cm/yr. But there is still the problem that 90% of the continent has been ignored in that calc, and a gain of just 1.2mm (less than measurable) over the rest of the continent wipes out the loss. So the final figure is statistically indistinguishable from zero.
========
Mike, you’re correct that what I wrote is wrong, but that second 10^7 should be 10^6 (10% of 10^7), so I think the conclusion that the ice elevation change at the continent margins is really measurable is probably correct.
There are a whole bunch of factors not addressed. e.g. much of the ice around the edges of the continent is floating and thus doesn’t increase sea volume when it melts, and “recent” snow presumably compacts over a period of years (decades?) suggesting that elevation changes may not all be from ice melt. I’m not remotely qualified to address those issues. I was just curious whether the satellite could actually measure what it is claimed to have measured with any useful accuracy. Tentatively, I think it probably could.
yeah right………..
This is like claiming you can measure the worlds temperature in 1/100th of a degree…….
http://www.leeds.ac.uk/news/article/3531/antarcticas_ice_losses_on_the_rise
It would also be good have a link to the press release at the top , not just leeds.ac.uk , saves having to go digging.
This is more spin my press release. The caption on the headline photo reads :
“Three years of observations show that the Antarctic ice sheet is now losing 159 billion tonnes of ice each year – twice as much as when it was last surveyed. ”
Which gets reported by the Guardian as “Doubling of Antarctic ice loss revealed by European satellite”
NO , the GRL article actually reports: However, the average rate of ice thinning in West Antarctica has also continued to rise, and mass losses from this sector are now31% greater than over the period 2005–2011.
The also screw up the increased ice loss and report “losing almost one third (31%) as much ice “:
But the average rate of ice thinning in West Antarctica has also increased, and this sector is now losing almost one third (31%) as much ice each year than it did during the five year period (2005-2010) prior to CryoSat-2’s launch.
DUH.
Can I just be clear?
It is stated that twice as much ice is being lost than the last time it was surveyed.
But, the new survey is more detailed and therefore finding areas of loss not previously identified.
Therefore, is the doubling merely a result of better surveying techniques, or real?
Yes mods, could we just fix the top article? The line where he divides 159/1000 just needs to have the 159/1000 removed and that and all subsequent references to 0.159 converted to 159. It won’t do to publish egregious arithmetic errors on WUWT, especially when the error favors the skeptical argument. Especially where one doesn’t need the error to make the point.
Now, what is NOT known is how long this melt rate has been occurring — quite possibly it extends all the way back to the Dalton minimum, more likely it started somewhere in the 1930’s or 1940’s when temperatures peaked from the early 20th century (non-CO_2-linked) warming from 1910 to 1940, with some fluctuation over time. That is, we really do not know how much of the baseline SLR over the last 145 years of the tidal gauge record (useful or useless as it might be) is due to ice melt over that entire period vs the amount due to expansion. It is quite plausible that of the current 3 to 3.5 mm/year rise, 0.5 mm/year comes from melting ice — that’s the scale that would knock the rate back down much closer to the 145 year average. OTOH, some fraction of that 145 year average might have come from ice melt too. In ten or twenty years of observations, perhaps we’ll know.
In the meantime, antarctic sea ice is at record levels of coverage, which actively increases the albedo of the southern pole and provides a form of negative feedback. I have no idea what (if any) effect it has on southern hemisphere cloudiness and hence further feedback both positive and negative.
Finally, I do not think that this word “irreversible” means what you think it means…
rgb
If the readings are more accurate now by giving better resolution over area’s that were not previously accounted for, then are the previous records going to be adjusted much in the same way that happens to temperature records?….. Just sayin!
” Espen says: @ May 20, 2014 at 1:20 am
One more thing conveniently omitted in the press release, but prominent in the abstract (http://onlinelibrary.wiley.com/doi/10.1002/2014GL060111/abstract): the error range for the east Antarctic ice loss of 3Gt/year is a whopping +/-36 Gt/year!”
Indeed, the errors are 50% of the estimated loss: ” Between 2010 and 2013, West Antarctica, East Antarctica, and the Antarctic Peninsula changed in mass by −134 ± 27, −3 ± 36, and −23 ± 18 Gt yr−1 “.
In any event, half of a very small number is still a very small number. Be it 159 KM**3 or .159.
Good to see the WUWT readers are on their toes from the very first response. Hopefully we will see a correction soon.
Robert Brown says:
May 20, 2014 at 5:00 am
“…In the meantime, antarctic sea ice is at record levels of coverage…”
__________________
Overnight May 14/15, reported global sea ice dropped (precipitously) somewhere between 3-4 KM2 and has exhibited a downward trend, since. NSIDC announced that beginning May 15, they had changed secondary access server for daily NISE.v4 data. No change to the actual data set was announced. Global sea ice extent before May15 had been running ~.9M Km2 daily, but is currently reported as less than .2M Km2. There have been no reported events, such as major ice- shelf break/calving events which might explain the sudden drop..
The article focuses on loss. Can anyone post the historic annual gains in new snow and ice?
In other words, is the thickness of the total ice in this area dropping, remaining the same or getting thicker? Should the continent be viewed as a “black box” problem where the input , output and the size of the box need to be evaluated to determine the impact of climate on the model? Or is the melt vs. gain the natural behavior of the system?
Thank you,
Stephen Richards said:
How does ice melt in the interior of antartica? The temp never rises above freezing. Ice ‘lose’ in this context is probably due to ic sliding down to the sea not being replaced fast enough in the interior. The faster slide may be due to the past million years or so of grinding away an easier route to the sea.
Probably due to sublimation. The ice slowly sublimates by changing directly from solid form to vapor form. This can occur even at temperatures below freezing.
Regrettably, I neglected to include the word <anomaly in my post immediately prior. The lines should read: “…reported global sea ice anomaly…” and “…Global sea ice anomaly before May 15…”
All apologies- this is my 2nd cup of coffee this morning, so that excuse won’t work.
” Billy Liar says: May 20, 2014 at 1:18 am
No need to worry, Antarctica’s loss is Greenland’s gain.
Greenland has gained about 500Gt since 1 September last year. On average it gains 400Gt/year.
Of course, in order to stop it catastrophically building up into an enormously high mountain it has to calve that accumulation every year into the sea via its outlet glaciers – that’s a lot of icebergs.
http://www.dmi.dk/en/groenland/maalinger/greenland-ice-sheet-surface-mass-budget/”
And so the net balance with calving is a loss of 200GT per year. Again, another very small number.
“The calving loss is greater than the gain from surface mass balance, and Greenland is losing mass at about 200 Gt/yr.”
“This study does a nice job of revealing the strong thinning along the Amundsen Coast, which is consistent with theory and models indicating this region is in the early stages of collapse.”
Well, that at least explains all those useless models, maybe they should take up the catwalk instead !
‘Professor David Vaughan of the British Antarctic Survey said: “The increasing contribution of Antarctica … – this study puts us exactly where we need to be.”’
My god (and not your’s) does that sound like a credit card commercial from days past: ‘It’s everywhere you wanna’ be.’ I’d say it’s time to let the copyright infringement lawsuits fly.
Aw, what the heck, might as well join ’em: Climate scientists, politicians, and lawyers; they’re everywhere you’re gonna’ be.
Need error bars and longer string of data. There is absolutely no way to classify this study as anything but a single snapshot in time. To compare it with “the last 5 years” is totally inappropriate science. This kind of garbage science-by-media is meant to sway political opinion and move public emotions, not advance scientific knowledge.
Joel O’Bryan says:
May 20, 2014 at 1:52 am
> In the US system.
…
> 1 Terra = 10^12
> 1 Trillion = 10^12
Tera, not Terra!
Sanity check required at WUWT!
– you divided by 1000 when you shouldn’t have!
It’s 0.43mm / year
Mike Jonas says:
May 20, 2014 at 4:10 am
“0.5mm/year. Not at all trivial.“. So what is trivial? Well, I reckon anything under, say, 1 foot per century is trivial. So how much is 0.5mm/year? It’s 2 inches per century.
This is only dangerous to the few Rip Van Winkles who fall asleep on the beach for 50+ years, I guess. The water will inexorably rise 0.5mm a year and they will inevitably drown before they wake.
If we put up an 8″ concrete curb around any susceptible building would we not be safe for 4 centuries?
As Geoff notes above:
159 gigatonnes = 159 km3.
According to Wikipedia, the Antarctic ice sheet = 26,500,000 km3
Therefore, the loss is equal to 0.0006% per year. If your satellite is accurate enough to measure that, well, that’s pretty impressive.
Time to melt at a constant pace: 170,000 years.
I am further hard-pressed to understand the mechanism of loss. Temperatures are ordinarily well below zero, with the coldest ever temperature of -135 deg C recorded in Antarctica just this past December. Surface temperatures should have minimal effect on temperatures at the base of the glaciers.
I would add that annual precipitation is reported as 166 mm per year, representing a volume of 23 Gt over the continent as a whole.
I’m not a big fan of the Cryosat’s. I waded through their raw data once and the numbers change by so much from orbit to orbit for the same area that it just looks random to me. High orbits can do this for single satellites.
For the Arctic sea ice thickness (which was Cryosat2’s primary mission), it has only been able to make estimates for a few months out of the year (and that is after months and months of data analysis). The mission controllers were looking to expand the mission into other areas given how poor the data was.
I would also be interested to see if they used the new glacial isostatic rebound models produced by GPS stations which showed that the vertical uplift from ice age rebound is only about half of what the previous models used.
On the ESA website, there is a very good image of what Cryosat2 found for elevation changes which could probably be added to the headpost.
Basically, not much happening except for a few areas gaining about 1 metre per year with west Antarctica coastal areas losing +1 metres/year.
http://www.esa.int/var/esa/storage/images/esa_multimedia/images/antarctica_s_ice_loss/14529671-1-eng-GB/Antarctica_s_ice_loss_node_full_image.jpg
The West Antarctic Ice Sheet has been in existence for over 30 million years, so I doubt if it is going to disappear soon:
http://wattsupwiththat.com/2013/09/04/more-settled-science-the-west-antarctic-ice-sheet-is-20-million-years-older-than-thought/
And there was a paper published in 2008 (although I have not read it), that said the snow accumulation in Western Antarctica has more than doubled since 1850.
Thomas, E.R., Marshall, G.J. and McConnell, J.R. 2008. A doubling in snow accumulation in
the western Antarctic Peninsula since 1850. Geophysical Research Letters, 35, LO1 706,
doi:10.1029/2007GL032529
I think my house is safe for a while.
“Or, in terms of gigatonnes:
1 Gt x (1 km³/Gt) / 361 x 106 km² = 2.78 x 10⁻⁶ meters = 2.78 microns / Gt
That is, one cubic kilometer of water (i.e., one gigatonne of water) will add less than 3 millionths of a meter to the oceans!
From the press release, we are seeing about 159 billion tons/year of ice converted to meltwater (unless it sublimates), so the effect on sea level would be 159/1000 or 0.159 x 3 millionths of a meter, or 0.477 millionths of meter of sea level rise per year from this.”
As I see it the conclusion is wrong as 159 billion tons of ice melting would add 159 x 3 millionths of a meter or 477 millionths of a meter to sea levels. To me 477 millionths of a meter is 0.000477 metres or 0.477 mm per year.
“or 0.477 millionths of meter of sea level rise per year from this” This conclusion must be wrong to the tune of a factor of 1000 as been pointed out. I don’t understand why this issue is not being addressed in the original text above or prove me wrong.
Glad to hear one of my clan has found employment.
The warmist arithmetic is correct at around positive 0.45 mm/year. That is slightly larger than the estimated ±0.4 mm/yr uncertainty in the GMSL estimate, but the applied glacial isostatic adjustment is a negative 0.3 mm/yr, so we’re back within the uncertainty range.
So, relocate the penguins to Barrow?
Something completely ignored in any articles on the Antarctic glacial balance is that the area of the continent prone to the biggest fluctuation in calving is also the area of highest precipitation. Also there is an equation that is impossible to calculate fully and that is what % of yearly precipitation in that area actually contributed to glacial mass and according to what model (weather/climate etc etc ). Its entirely possible ( and in my view likely ) that an increase in glacial speed would cause an eventually increase in the rate of increase of annual glacial mass contribution. This is because glacial fractures increase as speed increases and in some locations this helps also to increase the rate of mass increase because of several features. So , in a nutshell , I suspect that this short term observation window used for conclusions on glacial “loss” may be of little real use in determining the overall impact and picture as to what is going on…..
I like how on one of these models which calculate 900 years for total west side glacier melt/collapse/catastrophe the climate scientist makes the remark: think likely the collapse could happen within 200 years. Like why not model that? seriously what good is spending all that time crunching data things that make 900 years if 200 years is better…You could just say THAT…Like…yeAh
So, out of the measured rise in sea levels of 2-3mm per year, this study purports to have found 0.4mm. That leaves rather less for the ocean ate my
homeworkheat through expansion.The 159 (American) billion tons of ice per year does worry me because the overall temperature isn’t increasing much, this tells me the ice loss is probably caused by ice falling off the edges. This could accelerate and if we are unlucky it could lead to a much faster sea level rise, say 1 mm per year. This turns out to be 1cm per 10 years, or almost 9 cm by the end of the century. If I were to add the sea level rise caused by water expansion I get as much as 60 cm. This tells me we need to focus on geoengineering to cool the planet because I don’t see much action to stop growing rice, raising cattle, making cement and burning fossil fuels.
Antarctic Sea-Ice Coverage Continues Breaking Records
http://iceagenow.info/2014/05/antarctic-sea-ice-coverage-continues-breaking-records/
As long as this happens i am not going to worry,
Halley VI[edit]
It is a structure which, like Halley V, is jacked up on legs to keep it above the accumulation of snow. Unlike Halley V, there are skis on the bottom of these legs which allows the building to be relocated periodically.
The maths in the article do not add up.
If a gton of water is 13km^3, then 159 gtons = 159Km^3.
It is still trivial, but if the conversions are done poorly, we will lose the argument in distractions.
Steven Kopits says:
May 20, 2014 at 6:16 am
I am further hard-pressed to understand the mechanism of loss.
=========
Steven
I’m not remotely an expert on this, but I think the answer is in the press release where they talk about ice losses being concentrated in the coastal areas. The coastal areas are at relatively high latitudes (for Antarctica) and can warm up to almost sane temperatures in the Antarctic Summer. I checked the temp at McMurdo Station one day this January and found it to be 39F. (Warmer than much of the Eastern US on that particular day). Also if the sun is relativey high in the sky, ice and snow can melt at somewhat subfreezing air temperatures if exposed to direct sunlight.
This post is in serious need of a re-write to correct some basic but critical math errors, which result in a “sanity check” being out 3 orders of magnitude.
This is also a very good example of why we should permanently do away with the long-scale definition of “billions”.
[try doing a refresh -mod]
Drat. make that relatively LOW latitudes (for Antarctica) ….
These numbers relate to GROSS ice loss, which take no account of accumulating snowfall, rendering them almost entirely meaningless.
The NET figures, which are the ones which are actually important, show a somewhat different story :
http://wattsupwiththat.com/2012/09/10/icesat-data-shows-mass-gains-of-the-antarctic-ice-sheet-exceed-losses/
Not accounting for sublimation effects makes any conclusions about sea level rise a bit pointless. A dryer antarctic climate in recent years would produce the same effect without any effect on sea level rise. Without some method of tracking precipitation changes along with the altitude data and combined with sublimation rates, this paper is leaving a lot of independent variables out.
Of course the double check on all this is the rate of sea level rise, which the raw data seems to show is slowing down, not accelerating.
“Three years of observations show that the Antarctic ice sheet is now losing 159 billion tonnes of ice each year – twice as much as when it was last surveyed” Is it possible to draw any strong conclusions about future trends based on 3 years of data? Also, the article says the satellite was launched in 2010. If there were no good measurements before then, do we know if the 159 billions tons per year represents a slowdown or speedup of ice loss?
Once the math is sorted to everyone’s satisfaction, might I ask that somebody take note of what Greg said earlier – these numbers are too big to have any meaning for the average man in the street (me). So for example, it might make more sense if the simplified math was along the lines of . . man worth £2.7 million is losing (say) £1.59 or £159 per year. Or perhaps, imagine a block of ice the size of a standard 6ft tall fridge freezer – then say it’s lost the equivalent of a couple of ice cubes. Would do it myself but as you can tell, I’d likely get it wrong!
Is this wrong? http://sealevel.info/conversion_factors.html
Thanks to satellites and computers we can now accurately measure the number of tress in the forest, in the past we had to use our fingers and observation. Has there less tress in the former than the latter this proves we are running out of trees.
Anyone spot the problem with that idea , while you cannot take a very accurate measurement from now and compare it with very inaccurate measurement form the past and claim it shows a trend . For you no idea at all what the numbers in the past would have been if you had the accurate measurement has opposed to the inaccurate one.
and that is before you get to if the reducation is actual meaningful.
Antarctica is a large body of water, albeit frozen. I would expect it to behave as any body of water does, which is to go through times when levels rise and times when levels fall. Is there a lake or pond in the world that is always at the same level?
Considering Antarctica is seemingly colder, it would likely be experiencing a period of drought. Ice continues to drain off via glaciers, just as a lake may continue to lose water through an outlet during a drought. Just as the level of the lake falls, the level of the ice falls.
The punchline of the report, however, is that the “rate of loss” is increasing. Please note the report does not say the glaciers are flowing faster. The glaciers may in fact be flowing slower, just as the outlet of a lake may flow slower in a drought, even as the level of the lake falls dramatically.
“Rate of loss” is a valuable tool to have, when you are measuring a city’s water supply during a drought, and need to know when to start being concerned about the water running short. However even while using the tool, one knows that a rainstorm could turn a “rate of loss” into a “rate of gain” in a matter of hours.
In terms of Antarctica, our weather records are scant and our history of what constitutes a “drought” and what constitutes a “wet period” are minimal. We do know the land is basically a desert, and the flow is strongly zonal, with very little of the loopy, meridianal flow seen up at the North Pole. I personally can recollect only one time that the Antarctic “polar vortex” split, however the simple fact it did split once suggests there could be times when snows increase. It would seem only logical that during such times the “rate of loss” would become a “rate of gain.”
The problem with some Alarmist thinking is that it takes the ups and downs of a cycle, and makes straight lines out of pieces of it.
However I do think it is very cool that we can now measure the amount of ice and the “rate of loss.”
It is a trivial rate of rise because it is a trivial increase in volume. http://apod.nasa.gov/apod/ap120515.html
The article is completely wrong. Antarctic ice is at record levels and there has been no global warming for 17 years, thus the antarctic can not be melting as the arctic is melting thus the antarctic ice must increase to balance it and account for the zero warming sum. Antarctic ice is not subject to the same oceanic oscillatory warm water intrusions that the arctic is exposed to. The system is complex and my simple ‘sum’ analysis is vastly insufficient but observation shows the Antarctic ice is at record levels.
Ice loss in one area of the Antarctic is counterbalanced by gain in another area, the warmists constantly cherry pick.
Not to nitpick, but two edits still need to be made:
1) Now that the figure for total Antarctic land-ice loss is 169,811 years instead of ~169 million years, the statement “I’m pretty sure we’ll have gone through a few ice ages by then.” should be changed. Perhaps to something like “I’m pretty sure we’ll have gone through an ice age by then.” ?
2) The strike-through in the statement “So, the ice loss per year would be 0.159 cubic kilometers.” includes all the digits. Strike only the zero & decimal point instead, leaving ‘159’.
Bill Illis says:
May 20, 2014 at 6:38 am
With reference to your link; funny how all that ice loss occurs along that chain of volcanos. I wonder if anyone has measured the heat flux through the crust in that area?
“If a chunk of ice the size of Manhattan breaks off of a glacier, the worldwide media wrings its collective hands. But if sea-ice coverage grows by the size of seven states plus 184 Manhattans, you hear nary a word”
Robert Felix.
Neither the press release nor the authors would like to discuss the +/- 2.6 cm radial error and the -58.6 cm bias.
http://www.dgfi.badw.de/index.php?id=379
In addition to other errors from surface roughness and slopes and those pesky discontinuities called crevasse and doppler positioning system DORIS and pointing errors and the Ku-band radar itself.
https://directory.eoportal.org/web/eoportal/satellite-missions/c-missions/cryosat
Oh well.
The US version of billions, trillions, etc replaced th old UK eqivalents decades ago, and they are now the same wherever they are referred to wordwide.
So when Pfizer bids £63 billion for Astrazeneca, the AZ board is not under the mistaken impression that they have been offered £63 trillion.
And everyone BLITHELY assumes the calibrations on the satellite are correct? No flaws, no errors? quality assurance anyone????
159 billion tons of ice. Is this not the amount that surrounded Chris Turney’s expedition last year. How ironic.
Oh, SIGINT EX…just noticed what you said, probably RIGHT ON THE MONEY here! Thanks for some important contribution.
Does anyone know what’s happening with the earth’s tilt at the moment.
For God’s Sake you Americans and English. It is high time you adopted SI measurements. They are based on universal constants, you know. Ill wait for the author to check what kind of unit is used.
An additional sanity check. A 1mm rise in sea level will create approximately a 4mm inland shift of the ocean, producing an increase in oceanic surface area of an order of magnitude when it comes to evaporation and redeposition of that moisture as snow.
The 159 Gt loss figure is the NET loss, the difference between the annual gain and the annual loss, both of which are around 2000 Gt/year. As gain and loss are totally different processes (snowfall vs melting) its hardly surprising that the relatively small difference fluctuates a lot.
It is typical of alarmists to take any trend, assume the underlying process is linear, extrapolate over a time, and then be shocked, shocked by their extreme predictions.
In fact climate changes (yes I am part of the 97% that thinks climate changes), and is most certainly not only non-linear, but at least partly chaotic, and also rife with complex feedbacks, both positive and negative.
As mentioned above, a drought over the continent could as easily explain the short term findings this study has made as could increased melt/sublimation related to warming (and what warming did they document, btw?).
Unless i have misunderstood things this paper’s first important conclusion is this:
‘WE HAVE ONLY BEEN ABLE TO MEASURE ICE MELT IN ANTARCTICA ACCURATELY FOR THE PAST 5 YEARS. BEFORE THAT, OUR SATELLITES WERE LIMITED IN WHAT THEY COULD DO IN THIS REGARD’.
So the first fundamental conculsion is simple: scientists do not yet have a baseline of continuous measurement to define what normal melt rates are over a significant period of time. They do not know whether current melt rates are average, normal, unprecedented, or rather less than at several times in the past.
To conclude from this that dangerous melting is taking place is rather analagous to saying that your toddler has doubled the rate at which they are learning new words, therefore they will get into Harvard aged 18.
I’m sure the Professors of Climate Science in Boston would agree that such logic is somewhat defective.
Perhaps they would also agree that collection of this satellite data until at least 2035 and quite possibly until 2100 may be necessary before useful understanding of long-term oscillations in antarctic ice melt/generation is possible?
SIGINT EX says:
May 20, 2014 at 10:01 am
Neither the press release nor the authors would like to discuss the +/- 2.6 cm radial error and the -58.6 cm bias.
http://www.dgfi.badw.de/index.php?id=379
“The Cryosat-2 data for the three different measurement modes (LRM, SAR, and SARin) are combined within one GDR product which is globally available. Nevertheless, up to now, there are still some known problems with the SAR and the SARin data part in the Level 2 product and actually, only L2 LRM data should be used. The global mean range bias of this data set has been computed to -0.586 m. A timing error of about 11 ms is still present in the data. With 2.6 cm RMS of the radial errors the data quality of Cryosat-2 is very promising but not yet comparable to Jason and Envisat missions.”
The Antarctic Ice Sheet is roughly 14,000,000 km2 in area. In order to detect 159km3 of ice loss, by my reckoning, you would need to be able to distinguish 159km3/14Mkm2 = .000011m or 11microns.
Once again we have a bunch of clever dicks given lovely pieces of high priced government sponsored technology to play with and descending into metrological delusions of grandeur.
It doesn’t take any high degree of technical knowledge to demonstrate to impossibility of these accuracy claims. We are dealing here with measurements of height. To measure a height, once or over time, you need a fixed reference frame, but over any time span of the last 40 yrs there is nothing in the entire system of the Earth, including especially all those lovely orbiting devices, whose positional (x,y,z) has been fixed and known for any time segment of that era.
For all of these number crunchers this stuff is their live’s work. They go in every day and diligently try to make chicken soup out of chicken shit. I think they should be forgiven for pretending to themselves that what they have accomplished is in fact meaningful, but the rest of us are under no obligation to support them in their delusions.
Here is link to original article.
http://onlinelibrary.wiley.com/doi/10.1002/2014GL060111/abstract
It can be clearly seen that unit used is Gt yr−1 and in SI system that is obligated to use in scientific literature 1 G or Giga means 1 000 000 000.
List of SI prefixes
http://en.wikipedia.org/wiki/Metric_prefix#List_of_SI_prefixes
Robert Brown says:
May 20, 2014 at 5:00 am
…
In the meantime, antarctic sea ice is at record levels of coverage, which actively increases the albedo of the southern pole and provides a form of negative feedback. I have no idea what (if any) effect it has on southern hemisphere cloudiness and hence further feedback both positive and negative.
I would have thought that increasing Antarctic sea ice leading to increased albedo would be a positive, not negative feedback, since increased albedo causes cooling, which would be expected to lead to more sea ice, etc. Note RACooke’s frequent posts on the subject of Antarctic albedo (more significant than Arctic due to lower latitude of sea ice thus more reflection).
I do realise that over the Antarctic land mass albedo from surface snow is anomalously higher than that from cloud, since the snow presents such a pure white surface. However this is probably not the case for sea ice whose surface is more irregular and cracked with patches of dark sea in between.
1 Gt = one giga tonne = 1 000 000 000 t
1 km3 = 1000m * 1000m * 1000m = 1 000 000 000 m3
1 Gt = 1 km3 of ice
Author units in this WUWT article are OK.
PS
He even calculated difference in densities of water and ice. GOOD JOB
It is not “melting” it is moving!
Ice in large volumes is incapable of holding up its own weight and so “slumps” or spreads out under its own weight (at least at temperatures found on Planet Earth). This manifests itself in Greenland and Antarctica as glaciers moving downhill from the high interior to sea level at the fringes. This happens at sub-zero temperatures and does not require any “melting” of the interior ice.
Where the melting occurs is at the end of the “ice tongue” which extends from where the glacier hits the sea. Usually this results in “calving” of icebergs off the end of the glacier but sometimes whole sections of an ice tongue or larger area of land-fast floating ice to break off and drift away.
What matters is the balance of ice loss at the coasts vs ice gain from snow precipitation in the interior. This paper suggests they are out of balance, but I – like most here – am sceptical. With error bars like those shown in this paper and the lack of any clear comparison between the earlier data and this, it is next to impossible to judge. The only way we will find out is when they get the next 3 – 5 years of data of Cryosat-2.
What is the betting that we will see a “sudden and surprising reversal” of the ice losses from the glaciers in Antarctica just like we recently did for many of the glaciers in Greenland recently. As others here have said, if we really are suddenly getting 0.5mm more of sea level rise from Antarctica than we did in 2005 -2010 why is it not showing up in the figures already?
OK. Really dumb question. Ice loss here , ice loss there, … All very scary oooooo ahh… BUT. What is going on with Ice Gains? I figure glaciers recede with a good melting , and, glaciers advance (then calve) with a good freeze and abundant upstream snowfalls. Land ice. THEN there is what happens with sea ice. With sea ice reaching norms at the Arctic and sea ice extending into the ocean at record extents currently….SO what is going on, net ice loss? Ice Gain….?? Or , heaven forbid… stubborn equilibrium?
Record extents Antarctic…forgot a word
I like the assumption in that scaremongering that the loss is permanent.
That is, the ice which has fallen into the sea is not at all replaced. No,
never. Once in the ocean, that’s where it stays. It leaves the reader with
the image of an ever more naked, bare-rock, ice-free Antarctic. Oh woe!
Oh tragedy! The poor penguins! No more ice ramps to slide down! No
more ice shelves to provide escape from predators.
And the Antarctic peninsular, we are told, is losing ice even faster. Was
there any mention of those active volcanoes, discovered under the ice
cap earlier this year? Could they be contributing to this increased loss?
No mention is made of the year on year increasing sea-ice coverage, so I
won’t mention it either.
“The polar ice sheets are a major contributor to global sea level rise and, when combined, the Antarctic losses detected by CryoSat-2 are enough to raise global sea levels by 0.45 millimetres each year alone.”
This reminds me of a battle between the G’Gugvuntts and Vl’hurgs from the book “The Hitchhiker’s Guide to the Galaxy”
Two species which existed in the distant past, a very great distance from the Milky Way galaxy. The G’Gugvuntt were enemies of the Vl’hurgs, and these strange and warlike beings are on the brink of an interstellar war, because of an insult uttered by the G’Gugvuntt leader to the mother of the Vl’hurg leader. Resplendent in their black-jeweled battle shorts, they were meeting for the last time, and a dreadful silence filled the air as the Vl’hurg leader was challenging the G’Gugvuntt leader to retract the insult. At the precise moment, the phrase “I seem to be having tremendous difficulty with my lifestyle” (muttered by Arthur Dent to himself, which for some strange reason was carried by a freak wormhole in space back in time to the farthest regions of the universe where the G’Gugvuntts and the Vl’hurgs lived) filled the air over the conference table, which in the Vl’hurg tongue was the most dreadful insult imaginable. It left them no choice but to declare war on the G’Gugvuntts, which went on for a few thousand years and decimated their entire galaxy.
After millennia of battle the surviving G’Gugvuntt and Vl’hurg realised what had actually happened, and joined forces to attack the Milky Way in retaliation. They crossed vast reaches of space in a journey lasting thousands of years before reaching their target where they attacked the first planet they encountered, Earth. Due to a terrible miscalculation of scale the entire battle fleet was swallowed by a small dog.
Oh, good. i was just about to panic, but now I don’t need to bother. Win!
Good summary! (Though repetition is not always useful, you comments deserve the “recycling” of the added letters…)
A few corrections though:
1. The ice mass that it at the “end ” of the glacier tongue is what is left over AFTER many hundred years of movement FROM the very top of the glacier. That ice that WAS deposited many hundred years ago (time WILL vary based on each INDIVIDUAL glacier’s width, flowing ice length, flowing ice average and net speed over the ENTIRE time it has been moving, source region area.
Thus, what is melting now – assuming that what is now melting at the tip is not equal to what is being deposited at the head! – reflects a difference in precipitation between 2110 and ???? whenever it fell as snow and ice in the mountains (1650, 1700, 1800, 1810, 1820, 1830, … 1910, 1950, or 1970 ?)
2. Each “flowing” glacier will be moving, BUT not all of the “drainage basin” that the glacier is coming from is moving. Much of the drainage basin is bypassed by the flowing stream. and has only static ice. That ice will only start moving AFTER all of the flowing ice has gone past and is no longer able to “hold back” the solid ice on both sides of the entire ice mass.
Area and volume calculations of “how much is melting (tonnes per day or anything else)” vs “how much is being deposited” MUST ONLY be compared to the “area” and “precipitation per year per area” of what is falling on moving ice. What falls on static ice is NOT affecting sea level rise because that ice does not move to the sea. (It does sublimate into the air, but that value only affects total relative humidity and total ice thickness.
3. Much, much propaganda is made of the “grounding line” that is the location underwater of the flowing glacier into shallower water away from the coast itself. Conventional theory holds that this grounding line is the point where the glacier runs into dirt and rock far offshore underwater, which slows the otherwise-fast-flowing water-borne glacier coming from deeper water closer to shore, which builds up the glacier ice deeper in shallow water, and so allows deeper ice to build up on the sloping bedrock on-shore, which then allows deeper larger glaciers to be formed onshore.
If the ice at the bottom of the grounding line melts, this theory holds that the key “stuck ice” is unlocked, the flowing ice immediately moves to a new grounding line further offshore, or to the old grounding line, and which then cause all of the glacier ice on the land part of the bedrock to slide downhill and subsequently move to the ocean and subsequently melt.
4. Very little of the WAIS is on the Alpine glacier model of mountain source, downhill glacier, ice shelf above water, ice shelf held back at grounding line by offshore shallow water, and deep water between grounding line and mountainous source. (Only the Twaites Glacier and Pine Island Glacier actually fit the “generic description” everyone is assuming is correct for the entire icecap! )
steve mcdonald says:
May 20, 2014 at 10:29 am
“Does anyone know what’s happening with the earth’s tilt at the moment.”
Current obliquity is approx 23.5 degrees and reducing. The range is 21.5 degrees to 24.5 degrees with a periodicity of 41,000 years. It takes approx 6833 years to change 1 degree so in 4819 BCE Earth was at max obliquity. In 15680 CE Earth will be at min obliquity.
Keep in mind that current precession has Southern Hemisphere summer solstice at perihelion
————————————————————————————————————————-
From the text:
“this sector is now losing almost one third (31%) as much ice each year than it did during the five year period (2005-2010) prior to CryoSat-2′s launch.”
Now how do they know that?
Are they sure that the ice loss was about the same but they just couldn’t measure it accurately enough?
Because they say this:
“The radar can measure the surface height variation of ice in fine detail, allowing scientists to record changes in its volume with unprecedented accuracy.”
and this:
“Professor Andrew Shepherd, also of the University of Leeds, who led the study, said: “Thanks to its novel instrument design and to its near-polar orbit, CryoSat allows us to survey coastal and high-latitude regions of Antarctica that were beyond the capability of past altimeter missions.”
In spite of the average ‘ice loss’ in both poles the autumn and winter refreeze in both involves vast areas turning to ice. The Antarctica gains 13 million km2 each year which in recent years has increased on occasions to 14 million km2. Meanwhile the Arctic refreeze has increased from 8 million km2 to about 11 million km2 with 2013 showing a massive refreeze of nearly 12 million km2. As we are dealing with precision that is 14,000,000,000,000,000,000 mm2
Stephen Skinner says:
May 20, 2014 at 1:22 pm
….. nearly 12 million km2. As we are dealing with precision that is 14,000,000,000,000,000,000 mm2
And I’m not! I meant 12,000,000,000,000,000,000mm2,
@ Robert H. says:
May 20, 2014 at 3:55 am
You ask the most important question: Is the 159GT’s a net loss or a dynamic loss?
It is not clear how much ice accumulating per annum while the 159Gt is allegeldy melting.
” …its glaciers may have passed a point of irreversible retreat.”
Really ? So how did it build up high enough to get higher than the point of no return in the first place then ?
Even the most optimistic pundits reckon the next glaciation will be with us in about 15,000 years, most pundits think it will be with us much sooner than that or that indeed, we have been slowly sliding into it for the last 2,000 years with a just a few short thousand years before we have to abandon parts of the Northern hemisphere.
So unfortunately for the warmists the Antarctic is melting about a hundred times too slowly.
The climate alarmists are quite happy to induce panicky headlines in the Guardian and other gullible media because then they can keep those multi million dollar research grants coming in.
The ice is melting! The ice is melting! Saunter for your lives, the ice is melting!
What is the problem?
GRL is sounding like this very minor fluctuation has meaning. It doesn’t.
This is just more wild eyed arm waving by people with an agenda to sell. Chicken Little [Chicken Licken – UK] ran around in circles, clucking that the sky was falling. But it was only an acorn.
Same-same.
Is this net loss?
meanwhile, sea levels have not risen since mid 2012
Some other observations.
Plus this
Plus near record Antarctic sea ice. More to follow.
Here is the IPCC.
Yet today we have some sort of confidence in “attributing the causes of the observed loss of mass from the Antarctic ice sheet over the past two decades. {4.3, 10.5}” GIGO. They don’t know what the hell is causing their observations. Or they do but will not tell the IPCC in time for AR5. This is BS.
Is there any CREDIBLE EVIDENCE for an acceleration in the rate of global mean sea level rise. I have seen many abstracts. Some say yes, some say no, some say a deceleration!!! What is going on? If the Climastrologists are right then there should be clear evidence of an acceleration. [Melting glaciers, thermal expansion, Antarctic terminal meltdown, Greenland grasslands now.]’
After all the hot and recent global warming the results are in. We are doomed to accelerdeceleration.
Where is the credible evidence for an acceleration of the rate of sea level rise? You can’t scream ‘MELT’ for 2 decades and cannot show me the evidence.
You have to slice each of the 159 blocks into 88,000 slices, in order for them to cover all 14000000 square kilometers of Antarctica. Thus each slice would be 11cm thick. They have detected an annual shrinkage of 11cm I guess.
Does Antarctic sea Ice increase when it gets colder? Surely not. When it get cold it’s actually warm and when it gets warm it’s warm. Get it?
Don K – Understood.
“In West Antarctica, ice thinning has been detected in areas that were poorly surveyed by past satellite altimeter missions”.
Hmm! So they find ice is thinning in the very parts of Antarctica that they don’t know much about anyhow as it was poorly surveyed by past satellite missions.
Conclusion; We haven’t any real idea whether the ice is thinning or not because we haven’t much of an idea on what was there or what was happening to the ice there previously but it makes for a nice alarmist paper and keeps our funding going..
Urgent! Send more money!
Bullshit. The next ice age will put an end to that idea.
Are they furnishing the temperature data that is making this meltdown happen?
Is anyone asking for the temperature records at the melting sites for this period of time? Is this melting ice or ice breaking off from the expanding ice shelf? Some basic info would be appreciated.
Tom in Florida says:
May 20, 2014 at 1:21 pm
” Keep in mind that current precession has Southern Hemisphere summer solstice at perihelion”
Perihelion is approximately January 3rd/4th. This is 14 days after the solstice. Around the year 1250 the solstice and perihelion occurred at the same time.
http://www.observingstars.com/perihelion_aphelion.htm
chuck says:
May 20, 2014 at 4:01 pm
“Perihelion is approximately January 3rd/4th. This is 14 days after the solstice. Around the year 1250 the solstice and perihelion occurred at the same time. ”
Yes, I should have said “near” not “at”. Was just making the point that Earth is closest to the Sun during SH summer.
Half a mm per year and what is the error bar when measuring global sea level rise (I suspect that it is a lot higher than that?)
SIGINT EX says:
May 20, 2014 at 10:01 am
I see from your first link that DGFI likes to ‘further improve’ the ‘data’ with models!
To further improve the data, the use of external orbits (e.g. from ESOC) as well as the utilization of a hybrid sea state bias model (e.g. provided by Altimetrics) is recommended.
Sounds like climate science.
Relax alarmists, both East Antarctica and Greenland have accumulation rates that have increased over the past two decades….
http://hockeyschtick.blogspot.com/2014/05/new-paper-finds-e-antarctic-snow.html
http://hockeyschtick.blogspot.com/2014/05/new-paper-finds-greenland-ice.html
This guy says this:
Who’s right?
Forgot to add the 1Gt before “= the mass of 1 cubic kilometer of fresh water”
Jonathan Amos Science correspondent, BBC News article on this 19/5/2014 says “It has an area, called the Amundsen Sea Embayment, where six huge glaciers are currently undergoing a rapid retreat – all of them being eroded by the influx of warm ocean waters that scientists say are being drawn towards the continent by stronger winds whipped up by a changing climate.About 90% of the mass loss from the West Antarctic Ice Sheet is going from just these few ice streams.
At one of them – Smith Glacier – Crysosat sees the surface lowering by 9m per year.”
It says the Smith Glacier is having surface lowering of 9 meters a year!
not in the above article that I can see
now thats a lot of lowering or a might big blooper by the Cyrosat people. Or bad reporting.
any further comment on this weird claim , Anthony
It would seem to be quite different to “thinning rates of between 4 and 8 metres per year near to the grounding lines of the Pine Island, Thwaites and Smith Glaciers.””
“Overall, the pattern of imbalance continues to be dominated by glaciers thinning in the Amundsen Sea sector of West Antarctica.”
Is there any chance of Antarctica tipping over as Guam nearly did?
robroy says:
May 20, 2014 at 4:50 pm
“Relax alarmists, both East Antarctica and Greenland have accumulation rates that have increased over the past two decades”
…
However, “accumulation” without melt and calving rates does not give you net gain or loss numbers.
“””””…..Reef fish lose brain power as oceans acidify
Researchers at the Georgia Institute of Technology say reef fish are likely to suffer from cognitive decline as they adapt to higher levels of CO2 in the water over the next century……”””””
Just found this piece of climate science. It’s time to redesign all my flies, to target stupid fish, instead of the smart ones.
Maybe its tongue is retreating 9 meters a year.
I think the real reason why they hype up Global Warming is because there really is a threat but it’s exaggerated in order for peons like us to notice. If they just stated the facts of what the climate is doing it wouldn’t make headlines and nobody would even glance at it.
We have never had this many people on the planet before except before Noah. There are scientists that believe there was an *ice field* around our planet during Noah’s time that acted as a lens making a lot of the earth have the same average temps of 74F.
What happened was that eventually that ice field began to melt but since there was a lot of liquid it came as heavy rain all over.
Silver Falls State Park in Oregon has minerals and rocks that can only be found under the ocean despite being at an elevation of 1500 feet in the foothills of the Cascades surrounded by tall Evergreens which I believe was when the world wide flood happened.
In fact I believe Atlantis was destroyed by the very same flood as they grew too full of themselves with their advance mind technology and the government likely viewed themselves as Gods to rule over people using technology to control the population just like what is happening now with weather modification from the Star Wars weapons program Clinton signed.
There has been tropical plants found deep under Artic ice which shows at one time tropical flora grew at that latitude.
If we continue to fight for resources instead of sharing and exploring for more we will wipe ourselves from existence by destroying the atmosphere. In fact I believe that is what happened to the Mars ancient civilization which is why there appears to be hidden structures but NASA refuses to talk about it when questioned.
They likely had their own weather modification programs that sucked away the atmosphere allowing the solar winds to come tearing up the place thus destroying the N and S magnetic poles.
Could that be our future too?
47 mm/century sea rise may be an overestimate. Most of the melting land ice is submerged in Amundsen sea. Like sea ice, it will not contribute to sea level rise. It may even lower sea level because water has higher density (lower volume per mass) than ice. Imagine a glass made of ice with water in it. If the ice submerged in water melts, will the water level rise or fall?
@policycritic says:
May 20, 2014 at 5:57 pm
Hi,
There was a discussion (see comments at the top) how billion is defined. Sometimes the situation is quite messy. Old definition, new definition, EU, USA, England. American billion is equal to European milliard ad so on. So I added a link to original scientific article with international SI units, just to be convinced if author calculation is OK. It is.
Regarding your second question.
1 cube of water 1 m3 = 1000 kg = 1 t (tonne)
This is only approximative definition just to make quick calculations. Density of the water changes if it is warmed cooled or transformed into ice.
= the mass of 1 cubic kilometer of fresh water
= the mass of 1.091 cubic km of ice
This is right. This is why I wrote the second comment. I forgot that ice was changed to water. This is why ice floats.
Nevertheless,
in the original article units are clear.
Ice loss is:
−134 ± 27, −3 ± 36, and −23 ± 18 Gt yr−1
It is logical that in scientific article tone is used because mass of the water is constant and volume of it changes with temperature.
Uhhhh, AlGoreEffect, my friend — what the hell did you just say?
Oh, well, vive la difference, I guess. (In case the joke has simply gone over my head, let me just express my embarrassment in advance.)
“the Antarctic losses detected by CryoSat-2 are enough to raise global sea levels by 0.45 millimetres each year alone.”
We’re all going to drown! In… some tens of thousands of years!
I do realise that over the Antarctic land mass albedo from surface snow is anomalously higher than that from cloud, since the snow presents such a pure white surface. However this is probably not the case for sea ice whose surface is more irregular and cracked with patches of dark sea in between.
The trouble is that water vapor is literally a two-edged sword. As vapor, it is the strongest greenhouse gas in the atmosphere by (IIRC) around an order of magnitude, so increasing water vapor can and does measurably increase the GHE — a lot, when considering dry air versus saturated air. In arid deserts, temperatures skyrocket during the day and plummet at night because of the absence of a water vapor driven GHE — CO_2 alone isn’t nearly enough to keep upward facing surfaces from rapidly losing their heat due to radiation. In very humid tropical climates, the nights are consistently warm because of the GHE.
However, water vapor is also the mediating agent for two major cooling mechanisms. One is the bulk transport of latent heat — sunlight and LWIR hit the sea surface and cause rapid evaporation of surface molecules of water. Wind blows over the ocean surface, stripping off water molecules as it goes. This evaporated water has a huge heat content relative to liquid water — the latent heat of vaporization. As the warm water vapor is carried aloft by convection, it carries the heat along with it. It also cools as it rides the adiabatic lapse rate upward, and further cools by radiating its heat content away (some of which returns to the Earth as GHE back radiation). Eventually the partial pressure of water vapor in the moist air becomes saturated relative to the temperature and the dew point is reached, making it comparatively probable that the water vapor will recondense into water. In order to do so, though, several things have to be “just right”. The water vapor has to be able to lose the latent heat of vaporization that it picked up at the water surface when it evaporated. The future water droplets have to be able to nucleate — which is a lot more likely to occur when there are ionic aerosols in the atmosphere as water (a polar molecule) is attracted to bare charge of either sign.
Once a water droplet is nucleated and grows past a critical size (that depends weakly on humidity and temperature) its surface becomes large enough that growth due to increased surface deposition outweighs loss due to surface evaporation, and the droplet stabilizes as a single droplet of condensation in a cloud or continues to grow to fall as rain. Either way the water, now high in the troposphere and hence through most of the optically opaque greenhouse layer, releases heat that is “short circuited” through the greenhouse mechanism and lost to space via radiation.
The cloud, as you note, has a very high albedo. High albedo means that it strongly reflects short-wave (e.g. visible) radiation without ever absorbing it and being heated by it. During the day, clouds outside of the polar regions act as a cooling agent, reflecting sunlight before it has a chance to reach the ground and lower troposphere to warm either one. During the day and the night, however, the cloud also acts as a powerful greenhouse blanket, directly reflecting LWIR as well as visible back down towards the Earth’s surface. In the tropics, daytime reflection wins by a landslide — reducing the incident sunlight by a huge fraction for a large fraction of the day beats the comparatively small modulation of surface radiative losses both day and night. In the temperate zone (again, IIRC) albedo still wins, but by a smaller and smaller margin as one creeps north (and in ways that are increasingly dependent on seasonal weather patterns — in the winter clouds can easily be net warming where in the summer they can be net cooling).
However — and this is key and the reason I’m replying to you — in the polar regions clouds are generally net warming, at least most of the year. You’ve already indicated some of the reasons — the polar regions are already often or permanently ice covered, and the gain in daytime albedo from clouds vs ice is not so great. The real problem, however, is that nighttime warming from the enhanced GHE from clouds scales with the fraction of the day that it is nighttime, and of course inside the arctic circles that can be as long as 100% of it. High albedo doesn’t cool when there is no incident sunlight to reflect, and even in the arctic summer, the sun comes in at a substantial angle so that direct solar warming is weak (so that clouds can reflect only a proportionally smaller amount of heat). A lot of polar temperature is determined by heat transport, not direct heating, explaining the substantial difference in mean temperatures of the North and South poles. In the north, there is substantial heat transport and heat exchange via the ocean; in central Antarctica there is only the atmosphere to carry heat in from the warmer latitudes and it just can’t do the job half as well.
That’s why I hesitated to assign a sign to the net feedback from any sort of local modulation of e.g. ocean-air humidity or sea ice coverage. The processes are COMPLEX and can have either sign, and they are NON-LOCAL as adding humidity in one place can increase albedo someplace else thousands of miles away is it finally concentrates enough to form clouds. A large part of the rain that falls over North Carolina comes up from the Gulf of Mexico maybe 1000 miles away. Some of it comes all the way over from the Pacific, where some of that might have originated in e.g. the growing El Nino. Heat from the tropical Pacific can be transported all the way to NC before it finally releases its heat and falls as rain, before it finally creates clouds that cause NC to cool after helping to greenhouse warm much of the surface area it crossed in between.
This is the kind of thing that the models are supposedly trying to model, but they perforce replace all of the small-length scale detail of this description with presumptive averages over cells 100-300 km square (where weather phenomena such as thunderstorms are order of 1 to 10 km square, where the details of front structure and development are much finer than this). They are excruciatingly tuned to aerosol levels and albedo — they have to be to stabilize anywhere near the correct/observed temperatures and preserve the central tenet that CO_2 causes X amount of baseline warming that is on average augmented by additional water vapor.
This last assumption is finally dying a quiet and well deserved death. AFAIK, it is due to Hansen, who in his original papers predicting disaster assumed universally positive water vapor feedback (and for no particularly scientifically motivated reason that I can see, hypothesized truly absurd levels of water vapor feedback that doubled or tripled the CO_2-only warming of his then very simple models). Naturally, some of the GCMs out there have built into them parametric assumptions that preserve this much “climate sensitivity” — total ACO_2 warming plus feedback, usually at the expense of an overdriven response to e.g. volcanic aerosols necessary to explain periods of global cooling and to keep the model from having a runaway exponential instability (because one has to have a mechanism that keeps positive feedback water vapor from causing increase of water vapor without bound just from FLUCTUATIONS in water vapor content or global temperature — the climate cannot be a biased random walk where every time the temperature goes up a bit, average water vapor increases and hence resets the Earth’s average temperature a bit higher unless a competing process can completely erase the gain when the temperature fluctuates down a bit).
At the moment, estimates of climate sensitivity are struggling to retain any net positive feedback from water vapor in the face of data that already solidly excludes the kind of absurd feedback levels Hansen originally hypothesized. Even the question of net negative feedback from water vapor, long considered to be anathema in climate science (except for a few mavericks who managed to publish papers suggesting that clouds could easily lead to net negative feedback through the dual mechanism of latent heat transport and modulation of albedo) is no longer completely off of the table. I don’t know that people will start to take it too seriously unless/until the Earth actually cools (several tenths of a degree, sustained, not just vary up or down or weakly downward trend) but obviously if this happened it would truly be the only likely catastrophe associated with global warming to all of those that have invested their professional careers, hundreds of billions of dollars of global wealth, and their political and/or scientific reputation on shaky claims in poor agreement (so far) with observational data.
IF there is a super-ENSO, perhaps it will help their arguments survive a bit longer, or perhaps it will truly kick up the temperature to where the models become believable again. Perhaps not. ENSO is not the only factor in climate evolution, and while it has been dominant for the last half century or so in mediating positive jumps as documented by Bob Tisdale, its ability to do so could easily be predicated by the phases and states of the other decadal oscillations, the state of the Sun, the state of baseline vulcanism, the immediate past climate history, and the price of tea in China. A chaotic nonlinear system can be quasiperiodic and apparently causal for a while and then for no computable reason change to an entirely different mode of behavior where a significant quasiparticle/process becomes insignificant and some other process becomes the critical driver. We could still watch as the developing ENSO discharges all that heat in such a way that it never manages to raise global average temperatures by much because of some confounding wave that causes the heat to be efficiently transported up and quickly lost rather than persisting to spread out over the globe at high altitude, or by a mere modulation of the winds that causes albedo over the warm(ing) patch to be higher than expected so that the delivery of solar energy to the ocean is effectively interrupted. It’s not like we can properly predict ENSO (although we can do pretty well with forward projective hindsight once an ENSO process has started).
No matter what, I expect the next year to be highly informative. If we have a super El Nino that heats the planet by 0.3C very rapidly, that certainly makes GCMs more, not less, plausible on average as it kicks global average temperatures at least in the right direction for them not to be as egregiously wrong as they currently appear to be. If it only kicks the temperature up by 0 to 0.1 C, and that only transiently so that temperature in a year are again pretty much flat relative to 1998-2000, it is very bad news for the models. If it fizzles altogether — short-circuited, perhaps, by the downhill side of solar cycle 24 that maybe be beginning and which will proceed with poorly predictable speed and which may or may not have a competitive local effect on the climate and produces no gain at all and cycles immediately into a cooling La Nina that augments any solar cycle cooling to actually drop global average temperatures, that too will be very informative.
Personally, I won’t even place a bet. I don’t think the climate is computable, which means that I think one is basically betting on the output of a (possibly biased) random number generator. I’d rather play Mumbledy-peg for money.
rgb
Thanks rgbatduke, that is a great summation. Haven’t come across a ‘Mumbledy-peg reference in years. learned that and many other useful pastimes in that great reference volume ‘How to Do Nothing with Nobody All Alone by Yourself’. A fount of early ‘engineering’ projects.
TheAlGoreEffect says:
May 20, 2014 at 8:02 pm
So much so wrong, but so little time & space.
“We have never had this many people on the planet before except before Noah. There are scientists that believe there was an *ice field* around our planet during Noah’s time that acted as a lens making a lot of the earth have the same average temps of 74F.”
At the time of the mythical Noah, some 4500 years ago, there might have been 20 million people on earth. Please name these imaginary “scientists” who believe there was an ice field around our planet then. Thanks.
“Silver Falls State Park in Oregon has minerals and rocks that can only be found under the ocean despite being at an elevation of 1500 feet in the foothills of the Cascades surrounded by tall Evergreens which I believe was when the world wide flood happened.”
The base sandstone of Silver Creek Falls canyon was indeed formed under an Oligocene ocean, ie c. 26 million years ago, when western Oregon was covered by seawater. But the land was lifted up by tectonics & sea level fell further during the Miocene, followed about 15 million years ago, by the Columbia flood basalt flows. This volcanic rock covered the former seabed sandstone, which being softer eroded over time.
“There has been tropical plants found deep under Artic ice which shows at one time tropical flora grew at that latitude.”
Temperate & even tropical species have indeed lived at high latitudes in the past. This has nothing to do with biblical myths. Earth’s climate is constantly changing & for most of the past 600 million years has been practically free of large glaciers or ice sheets. During Hothouse intervals, the planet is not icy even at the poles. But during Icehouse phases, as now & for the past 35 million years, especially the last three million, it has featured not just glaciers but ice sheets. We are in an interglacial, so the ice sheets are less extensive now than during the longer-lasting glacial cycles, when not just Antarctica & Greenland feature ice sheets, but much of continental North America, Europe & Asia, plus more extensive glaciers on South America, Africa & Australia, with even lower sea level.
“If we continue to fight for resources instead of sharing and exploring for more we will wipe ourselves from existence by destroying the atmosphere. In fact I believe that is what happened to the Mars ancient civilization which is why there appears to be hidden structures but NASA refuses to talk about it when questioned.”
There is no evidence whatsoever for an ancient Martian civilization. Evidence of even the simplest life forms there at any time is currently tenuous at best.
TheAlGoreEffect says:
May 20, 2014 at 8:02 pm
I want some of what he smokes!
An alternate view: while we hear considerably about isostatic rebound, there is also isotatic adjustment to loading. The Antarctic has been seeing steady increases in sea-ice for several years. If those were matched by increasing accumulations on the in the interior ice sheets, how rapidly would isostatic adjustment to increasing ice load result in lowering altitudes? Also, even without considering isostatic changes in the underlying rock, what effects would increasing load have on the crystalline structure of ice itself. I do know that increasing ice flow is likely to be due to loading because ice melting is correlated to retreats. Since the ice around Antarctica is advancing, if we accept increasing sea ice, then alternate hypotheses might be in order, to explain the altimeter data.
The massive East Antarctic Ice Sheet stopped retreating about 3000 years ago. Whether it has gained mass since then or not, it may well have quit rebounding from its losses after the end of the Last Glacial Maximum, c. 18,000 years ago.
West Antarctica might still be rebounding, however:
http://phys.org/news/2013-09-antarctic-ice-sheet.html
An alternate view: while we hear considerably about isostatic rebound, there is also isotatic adjustment to loading. The Antarctic has been seeing steady increases in sea-ice for several years. If those were matched by increasing accumulations on the in the interior ice sheets, how rapidly would isostatic adjustment to increasing ice load result in lowering altitudes? Also, even without considering isostatic changes in the underlying rock, what effects would increasing load have on the crystalline structure of ice itself. I do know that increasing ice flow is likely to be due to loading because ice melting is correlated to retreats. Since the ice around Antarctica is advancing, if we accept increasing sea ice, then alternate hypotheses might be in order, to explain the altimeter data square kilometers, or (since 1 square kilometer has
  square meters)
  square meters. A loss of
  cubic meters — the assertion of the top article — is thus roughly 1 cm/year if removed from the entire continental ice sheet.
It really needs to be a mix of altimeter and gravitational data, because ice/snow mixes can compactify, shrink in height, and not lose a whit of mass. Note that the surface area of Antarctica is
Of course, it is very unlikely that the satellite is going to be accurate to 1 cm. Very, very unlikely. Simply locating the satellite in 3 dimensions relative to the center of mass of the Earth is very likely not this accurate, and the effects of tidal forces and orbital paths over gravitational anomalies is very likely sufficient to make its absolute location in its orbit uncertain to order of meters. Bouncing radio signals through an atmosphere of variable and unknown index of refraction can introduce a further error of order meters. Even if they use extraordinary means to control these errors — both present in the usual estimates of uncertainty in position for/from e.g. GPS satellites — doesn’t seem likely to reduce the errors to less than order of tens of centimeters. And unless the measurements are correlated with same-location same-time GRACE measurements, reflection measurements of surface height (averaged over an enormous range, with rather large sources of measurement error as in hitting a hilltop on one pass and a valley on another) won’t tell you if you are measuring actual melt or sublimation or compactification. And even that won’t tell you if the actual ice is melting or sublimating (or where the water is going if it is melting) or if the subsidence is due to subsidence of the underlying land, which is surely proceeding at some rate given the enormous loading of Antarctica with kilometer-thick ice.
That is, I mostly agree with you. SLR and isostatic changes in the Earth’s rather plastic “surface” relative to some imaginary surface of perfect rotational-gravitational equilibrium is one of the most difficult chores we attempt, requiring a truly precise knowledge of gravitation, local coriolis force, and a fair bit of the dynamics of the underlying crust and mantel. It is also slow, constantly responding to stresses laid down thousands of years ago. Much of the planetary surface is still reacting to the ice melt at the start of the Holocene and the resulting substantial rearrangment of the “isostatic” mass distribution that had prevailed over the previous 90,000 years. Other parts are responding to more local changes in internal magma flow, movement of the tectonic plates. It isn’t all that implausible that part of Antarctica is melting/compressing/subsiding at some rate (with a largely unknown split). It isn’t implausible that it is mass is growing at other places, even if the surface is not changing by enough to be detectable. To put it another way, even if a comparatively small part of the continent is losing mass at 160 Gt/year and all of that mass is going into the ocean, the rest of the continent could be gaining mass at that rate and it would probably not be detectable, the rate of growth of order a centimeter a year that could be entirely eaten by compactification and subsidence of the continent to keep the surface itself nearly unchanging in some sort of “imaginary” height above the imaginary isostatic surface.
rgb
rgbatduke says:
May 21, 2014 at 10:55 am
Excellent summary of problems with altimetry, but consider also what the admittedly not highly accurate satellite did find:
“On average West Antarctica lost 134 gigatonnes of ice, East Antarctica three gigatonnes, and the Antarctic Peninsula 23 gigatonnes in each year between 2010 and 2013 – a total loss of 159 gigatonnes each year.”
That is, of the alleged 159 GT per year, West Antarctica & the Peninsula lost 157 (rounding errors presumably account for the total of 160 rather than 159 GT). So even in the worst case, catastrophic sea level rise is ruled out, ie hundreds or tens of meters rather than meters over the next thousands of years.
Sorry but you f[****]d it up with not being able to handle magnitudes.
[Watch your language. .mod]
Has anyone answered how this claim squares with satellite reports of increasing sea ice extent?
There was a study in 2012 based on 67 ice cores. The study found an increase in Surface Mass Balance (SMB) over the last 50 years or so. This is accumulated snow and ice. Given the glaciers appear to have been grounded up until the last decade, that would indicate Antarctica should have an overall positive surplus of water sequestered. Hence, the current loss may simply return the situation to average.
Also, the recently discovered Hudson volcano is almost assuredly one of the reasons for the melting of the underwater portions of these glaciers. Based on its location the water melted near the volcano would flow right past the area with the most ice loss. Coincidence? I think not.
There is a difference in the measurement techniques of GRACE and CryoSat-2 that might be significant. GRACE tries to measure changes in the mass, CryoSat-2 actual changes in thickness, down to half an inch or 13mm. Where there are fast movements, like glaciers, these will easily be detected. Where there are small movements, like the small deposits new snow formation annually that form the ice-core samples, this would not be noticed. A single millimetre of ice spread of East Antarctica would be 10 gigatonnes. Where there is slow gain in the middle with lumps calving off at the edges this measurement bias can be significant.
A previous Sheppard paper published in Dec 2012 – A Reconciled Estimate of Ice-Sheet Mass Balance with about 50 others – corroborates this potential bias. Using the GRACE satellite data, estimated the ice melt estimated for the period 2005-2010 rates of change in gigatonnes of -36, +58, -102 respectively for the Peninsula, East and West Antarctica. Total ice loss of -81 was insignificantly different from the -71 for the period 1992-2011.
Also remember that 159 gigatonnes is tiny compared to the total ice cap. At that rate the entire ice cap will be gone in 150,000 to 200,000 years.
For these reasons, I would expect the next estimate in two or three years time to show a smaller ice loss, or even a net gain, assuming the actual reality does not change.
To gofigure560:
Two different things. The sea ice is floating ice around the Antarctic, which started
life on land. The tremendous weight of the ice sheet pushes it outward from the
continent and into the sea. What’s being talked about in this paper is the land-bound
ice. That’s supposedly decreasing, according to this paper, by a tiny percentage
per year. The two trends are broadly consistent–a slight warming might cause the
ice to move downward from the continental interior to the sea, and out to sea, a little
faster, thus causing the growth of the are that the sea ice covers.
My real problem is the size of the various effects that they have to subtract out
to get their final, relatively tiny, number.
@rgbatduke
May 21, 2014 at 5:49 am
The near surface warm bursts through the Arctic polar night are typically Humidity Events.
http://ocean.dmi.dk/arctic/plots/meanTarchive/meanT_2012.png
RE: rgbatduke says:
May 21, 2014 at 5:49 am
Splendid insights. Thanks.
A previous Sheppard paper published in Dec 2012 – A Reconciled Estimate of Ice-Sheet Mass Balance with about 50 others – corroborates this potential bias. Using the GRACE satellite data, estimated the ice melt estimated for the period 2005-2010 rates of change in gigatonnes of -36, +58, -102 respectively for the Peninsula, East and West Antarctica. Total ice loss of -81 was insignificantly different from the -71 for the period 1992-2011.
Thanks, that’s the reason I addressed GRACE, but I couldn’t remember the reference. The information on the satellite resolution is also useful, although I’m rather skeptical about any claimed ability to be able measure snow/ice height (and by inference, thickness) over a broad area to within 13 mm. Given the published resolution of absolute positioning systems — e.g. GPS — this small an error estimate seems as though it would have to rely on an assumption of systematic/consistent errors per orbital pass (the absolute error of the measuring satellite’s position is order of meters IIRC) and while the assumption might be true for short times, I don’t see how they could possibly rule out systematic drift over multiple orbits. Obviously they cannot make the measuring satellite geostationary in a polar position, and orbits pass over multiple gravitational gradients and are highly subject to all sorts of cumulative errors from “random” forces like solar wind and orbital/tidal resonances. This is the same sort of problem that I have with assertions of precision of hundredths of a degree or less in measurements of “deep ocean warming” from the merest handful of highly sparse samples given the enormous volume being measure, with instrumentation that itself tends to drift and experience electronic and thermal errors that may or may not be independently biased.
My guess is that the satellite altimetry data is not, in fact anywhere close to “accurate to a centimeter”. GRACE however, I’m a bit more willing to believe although God knows that’s an amazingly difficult measurement too. At least there they can calibrate over known/expected mass variations, though, and they are trying to measure an absolute quantity, not a delta, across the same range.
I might be convinced otherwise, but in the meantime I remain skeptical.
rgb
The water will lubricate the collapse of the East Antarctica Ice Cap into the ocean, which will exacerbate the excess reflection of solar heat into space, which will result in Snowball Earth. Sometime between 2020 and 5020 is a best guess.
edit: exacerbate the current sea ice’s excess reflection …