Late last week, Judith Curry published a post written by Donald Rapp titled El Ninos and La Ninas and Global Warming. Donald referred to my work a number of times in that post. That, of course, created the expected responses from warmists who can’t grasp or refuse to understand the subtleties of ENSO. I made a quick appearance there and promised to answer a question by one of the bloggers. The following is that detailed answer. It appears on that Climate Etc. thread here. (At the time this post was published, my comment there was awaiting moderation.)
# # #
My apologies for not replying earlier. I was doing things that help pay my bills.
I see that the clueless usual suspects are misrepresenting my work and expressing their total misunderstanding of ENSO. But that’s their choice, and it’s a waste of my time responding to their nonsense.
I did promise GaryM that I would answer his question, if he were to rephrase it. And his rephrased question was “By what mechanism does an El Nino ‘contribute to global warming?’”
Through numerous mechanisms, as I stated in my earlier reply to GaryM.
First, in the tropical Pacific, ENSO serves as a chaotic, sunlight-fueled, naturally occurring, recharge-discharge oscillator. That’s one of the fundamental discussions about ENSO contained in Trenberth et al. (2002). They write (my boldface):
“The negative feedback between SST and surface fluxes can be interpreted as showing the importance of the discharge of heat during El Niño events and of the recharge of heat during La Niña events. Relatively clear skies in the central and eastern tropical Pacific allow solar radiation to enter the ocean, apparently offsetting the below normal SSTs, but the heat is carried away by Ekman drift, ocean currents, and adjustments through ocean Rossby and Kelvin waves, and the heat is stored in the western Pacific tropics. This is not simply a rearrangement of the ocean heat, but also a restoration of heat in the ocean.”
The NODC Ocean Heat Content data for the tropical Pacific clearly shows the recharge phase during specific La Niña events. They include the 1973-76 La Niña, the 1995/96 La Niña and the 1998-01 La Niña. See the graph here. The impacts of those La Niña events are hard to miss. In fact, the vast majority of the warming of ocean heat content in the tropical Pacific was during La Niña events. I discussed the processes through which the ocean heat content for the tropical Pacific warms in that fashion in the post here, with support from a number of papers and datasets.
ENSO also causes ocean heat from the tropical Pacific to be distributed poleward and into the Indian Ocean. This can be plainly seen in the animation of JPL sea level residual maps here after the end of the 1997/98 El Niño. The impact of the slow-moving downwelling Rossby wave traveling from east to west is blatantly obvious. It’s carrying ENSO residuals back to the western tropical Pacific as the 1998-01 La Niña is forming. So while the trailing (recharging) La Niña is taking place, the left-over warm water from the El Niño is being distributed to the adjoining ocean basins. And where’d all that warm water come from? The 1995/96 La Niña, of course, as confirmed by the data in the graph linked earlier (here).
And that brings us to the discharge phase. An El Niño discharges heat stored in the form of warm water from below the surface of the West Pacific Warm Pool, or as Trenberth et al. (2002) noted “the heat is stored in the western Pacific tropics.” That discharged warm water rises to the surface through upwelling and releases heat to the atmosphere during the El Niño (primarily through evaporation), and then all of the remaining warm water that was discharged by the El Niño is subsequently redistributed around the global oceans at the conclusion of the El Niño, some on the surface and some below the surface of the oceans. Let’s rephrase that because it’s important. The discharge phase is the release of “the heat [that] is stored in the western Pacific tropics”, which is taking subsurface warm water from the West Pacific Warm Pool and initially relocating it into the eastern tropical Pacific where it is upwelled to the surface and then subsequently redistributed at the conclusion of the El Niño. One of the byproducts of that discharge of warm water from “western Pacific tropics” is the release of heat to the atmosphere, and that’s what many persons focus on, but it’s only a portion of the discharge phase.
Which brings us to the Trenberth “big jumps” in response to the strong El Niño events of 1986/87/88, 1997/98 and 2009/10. (I initially discussed Trenberth’s “big jumps” article here.) Those “big jumps” are plainly evident in the sea surface temperature anomalies of the South Atlantic, Indian and West Pacific Ocean. See the graph here. Two things are stand out in that graph: (1) the warming of the sea surface temperatures for the South Atlantic-Indian-West Pacific occurs during the El Niño events and (2) the sea surface temperatures there do not respond proportionally during the trailing La Niñas. Those upward shifts are the long-term responses to the discharge phases of ENSO that occurs during strong El Niños. As part of the discharge phase of ENSO, the El Niño takes warm water from below the surface of the western tropical Pacific and places it on the surface (warm water that was created by the increased sunlight during the prior recharging La Niña). The discharged warm water floods into the East Pacific, where it temporarily raises sea surface temperatures during the El Niño, but causes little long-term trend there. And at the end of the El Niño, the warm water is redistributed by the renewed trade winds, ocean currents and the downwelling Rossby wave into the West Pacific, Indian Ocean and eventually the South Atlantic. The East Pacific represents about 33% of the surface of the global oceans, and the South Atlantic-Indian-West Pacific covers another 52%. That leaves the North Atlantic, which has another mode of natural variability called the Atlantic Multidecadal Oscillation. The Atlantic Multidecadal Oscillation, according to NOAA, can contribute to or suppress global warming. And so far, the only global surface warming we’ve seen was in the South Atlantic-Indian-West Pacific subset and that warming was caused by discharge of sunlight-created warm water released from below the surface of the West Pacific Warm Pool during El Niño events.
Speaking of the North Atlantic, and back to GaryM’s basic question, an El Niño causes surface temperatures in many regions outside of the tropical Pacific to warm not as a result of the direct transfer of heat, but as a response to changes in atmospheric circulation. The processes through which those changes occur were discussed in minute detail in Trenberth et al. (2002), which was why I linked that paper for GaryM earlier.
There are a few less-technical discussions in Trenberth and Fasullo (2011). Here’s a portion where they confirm that ENSO acts as a sunlight-fueled recharge-discharge oscillator:
“Typically prior to an El Niño, in La Niña conditions, the cold sea waters in the central and eastern tropical Pacific create high atmospheric pressure and clear skies, with plentiful sunshine heating the ocean waters. The ocean currents redistribute the ocean heat which builds up in the tropical western Pacific Warm Pool until an El Niño provides relief (Trenberth et al. 2002).”
Then Trenberth and Fasullo (2011) explain why some portions of the oceans warm in response to an El Niño (my boldface):
“But a major challenge is to be able to track the energy associated with such variations more thoroughly: Where did the heat for the 2009–2010 El Niño actually come from? Where did the heat suddenly disappear to during the La Niña? Past experience (Trenberth et al. 2002) suggests that global surface temperature rises at the end of and lagging El Niño, as heat comes out of the Pacific Ocean mainly in the form of moisture that is evaporated and which subsequently rains out, releasing the latent energy. Meanwhile, maximum warming of the Indian and Atlantic Oceans occurs about 5 months after the El Niño owing to sunny skies and lighter winds (less evaporative cooling), while the convective action is in the Pacific.”
Isn’t that curious? That’s two papers by Trenberth which state that temporary blasts of sunlight associated with ENSO warm the oceans of the tropical Pacific, the Atlantic Ocean and the Indian Ocean. And what processes can’t climate models simulate properly? ENSO and teleconnections. No wonder they come up with the wrong answer.
Looking at the ocean heat content data for the tropical Pacific (here), provides the answer to Trenberth and Fasullo’s question “Where did the heat for the 2009–2010 El Niño actually come from?” The supply of warm water for the 2009/10 El Niño was initially created during the 1998-01 La Niña, and it replenished the warm water released by the 1997/98 El Niño—warm water that was created during the 1995/96 La Niña. And according to two Trenberth papers, that warm water is created by temporary blasts of sunlight.
One of the key questions in that quote that Trenberth and Fasullo failed to answer was, “Where did the heat suddenly disappear to during the La Niña?” It didn’t disappear. The JPL sea level animation of sea level residual maps linked earlier (here), and the graph of sea surface temperatures of the South Atlantic-Indian-West Pacific subset (here) show quite plainly that the left-over warm water from the 1986/87/88, 1997/98 and 2009/10 El Niño events was redistributed within the oceans to form the Trenberth “big jumps”.
And as Trenberth and Fasullo (2011) note, while the tropical Pacific is releasing heat to the atmosphere, the Atlantic and Indian Oceans are gaining heat due (1) weaker surface winds, which results in less evaporative cooling, and (2) the resulting reduction in cloud cover which allows sunlight to penetrate the oceans to depth. The effect of ENSO on the sea surface temperatures of the tropical North Atlantic is discussed in Wang (2005), and it helps confirm the statement by Trenberth and Fasullo.
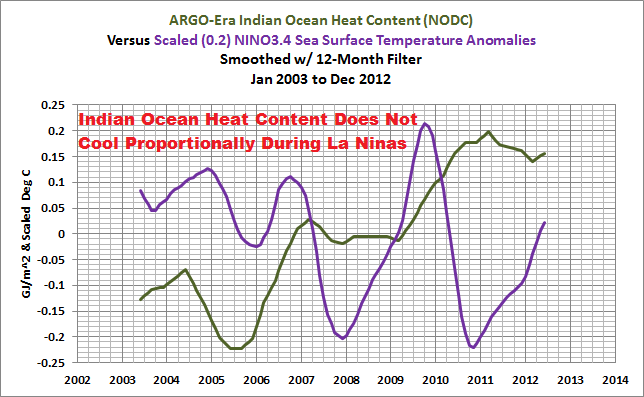
I provided graphs in a recent post (here) and in my book Who Turned on the Heat? that confirm Trenberth and Fasullo’s claim that ENSO does in fact cause variations in the ocean heat content of those ocean basins. Those graphs compared an ENSO index to ARGO-era ocean heat content for the Indian Ocean and the tropical Atlantic. The Indian Ocean to depths of 700 meters (here) warms in response to the El Niños but does not cool proportionally during La Niñas. The failure to cool proportionally is likely a result of the warm water released by the El Niño being distributed into the Indian Ocean by the Rossby waves and the Indonesian Throughflow during those strong La Niñas.
For the tropical North Atlantic (here), we can see that the ocean heat content there warmed in response to the 2009/10 El Niño and cooled during the La Niñas before and after it.
Let’s look again at the tropical Pacific. In the animation here, we can watch ENSO distribute heat from the tropical Pacific to the adjoining ocean basins. It doesn’t take much of a brain trust to figure out what will happen during a period when El Niño events dominate ENSO. Global surface temperatures and ocean heat content (even remotely in the North Atlantic) will warm. They have to.
I’ve only glanced at the some of the arguments on this thread, those that argue against what I have presented over the past 4 to 5 years. They’re repeats of arguments I have replied to over the years. Examples are here and here. And some of the comments on this thread were from persons with limited grasps of the truth.
To close this comment, this is not a theory I created. In fact, I haven’t presented a theory. I present data…data which illustrates, supports and expands on known processes presented in peer-reviewed papers.
Thanks again to Donald Rapp and Judith Curry for raising this important topic. And thanks to GaryM for asking a simple question that required a detailed answer. And I will again apologize for taking so long to reply to GaryM’s question, but I had other obligations.
It’s unlikely that I’ll be back to this thread, so if you have questions that were not answered by this reply or questions that were not answered in any of the blog posts linked to it, please feel free to ask it at my blog Climate Observations.
[End of comment on Climate Etc.]
The closing paragraph was of course about returning to the thread at Climate Etc. And this is the post at Climate Observations linked for those with questions.
Excellent analysis.
Great analysis. It’s amazing to me that some people seem to reduce what is an immense, complex, chaotic system (the earth’s climate) into very simple concepts such as “ENSO doesn’t contribute to global warming it just moves heat around” to paraphrase many comments I’ve read.
To me, what we (really) know is but the needle in the haystack of the beast that is climate (to totally botch metaphors).
If it were that easy, the models would be great forecasters by now…
The “big jumps” are a function of the main ocean current that runs through South Atlantic, west pacific and Indian Oceans and which drives the AMO as well. You’ll see when the AMO falls, those “big jumps” will disappear. I personally believe this is a function of the “wobble” in the Earth’s axis which also creates the ice ages and much of the observable climate changes on earth. Thus, the “big jumps” are really optical illusions. El ninos create temporary discharges of heat, but I don’t think they cause long term heating.
I think you trust Kevin’s analysis too much, Bob. I think the past several years Kevin’s analysis has been tainted by his belief that heat is hiding in the ocean. It’s an “epicycle” type of explanation to explain how the pause, when CO2 continues to rise at record levels, and global warming are still compatible.
A lot of his early work is good though and the stuff about la ninas charging the oceans, etc., is pretty solid.
http://climategrog.wordpress.com/?attachment_id=940
Kiribati tide gauge gives an interesting insight into this process. A circa 50cm drop in just 2 months around el Nino that takes several years to recover.
I should add that the 50cm drop I referred to is in the monthly average , not the low-pass filtered graph I linked to.
Here’s a link to the monthly data:
http://www.psmsl.org/data/obtaining/stations/1371.php
The spike in high sea level that occurs in the mid Pacific when El Nino occurs is quite short lived and mostly disappears in the filtered graph. This reveals that the post El Nino drop is more sustained.
Bob knows more about the regional details of El Nino than I do. But what we have observational evidence of regarding the *global oceanic* signature of El Nino is this, as published last year (Spencer & Braswell, Asia-Pacific Journal of Atmos Sci.):
1) El Nino involves a decrease in the overturning in the 0-200 m layer, which leads to warming of the upper 100 m and cooling of the 100-200m layer. We calculate this is 2/3 of the source of surface warming.
2) El Nino surface warmth is partly driven by a decrease in cloud cover letting more sunlight in…this is 1/3 of the surface warming, and it also appears to contribute to longer-term deep ocean warming if there are stronger El Ninos and weaker La Ninas than average..
Bob – You have documented how bad the existing climate models are at handling ENSO, clouds and oceans. Given the chaotic nature of the climate system and the lack of precision in measuring conditions is it even possible to create an accurate climate model? My guess is that the measurement error on initial conditions prevents climate models from being successful even if the equations are correct. Do you agree?
Jeff says: “The “big jumps” are a function of the main ocean current that runs through South Atlantic, west pacific and Indian Oceans and which drives the AMO as well.”
That’s as far as I read. Please identify by name this mysterious “main ocean current that runs through South Atlantic, west pacific and Indian Oceans and which drives the AMO as well.”
Roy Spencer, please identify which parts of the oceans you’re discussing in your items 1 and 2.
Thanks.
leon0112, I don’t believe I’ve presented model-data comparisons of clouds, but I have presented precipitation.
It’s tough to say if the references for initial conditions are one of the primary problems with the models since there are so many other flaws.
Bob…global area-average ocean signatures.
It appears that the oceans are more responsible for the warming and cooling trends than CO2. CO2 may play a part in warming the oceans (and probably does), but until the link with the oceans is determined mathematically, no model will work.
So… Cloud cover regulating available sunlight for heating the oceans — humm? Where have I read this before?
[guitar strum]
The Ocean bone is connected to the ENSO bone.
The ENSO bone is connected to the CLOUD bone.
The CLOUD bone is connected to the GCR bone.
The GCR bone is connected to the Galactic position bone.
Of course that’s too simplistic – but it was fun to write…
I’m sure we can expect Trenberth to jump down the rabbit hole and see where this all leads.
La Niña is more effective at ventilating heat around equator towards the poles.
El Niño is less effective?
Santa baby, that’s what I thought too. Another quick thought, South America. I was told once years ago, South America had similar weather patterns to Australia. We were joined millions of years ago of course. But we were cut off and other than the Apossam, we had only marsupials and monotremes until European occupation. Other than the dingo that somehow came here from S.E.Asia.
Bob, I wished I had gotten your autograph a couple year ago. I am betting the line is going to be quite long and is likely building as I type.
Santa baby and bushbunny, when the trades blow (and for Bill Nye’s education, from East to West), it sends gobs and gobs of warmed water up against a rather large continent but one that has a very uneven, messy coast line. As a result, the gobs of warm water get split up into a number of different currents, which then becomes their ride to extratropical hinter parts.
Where did my post go? It was to Bush and Santa.
I don’t see a human component to ENSO. What I see is a natural phenomenon that we should take no measures to fiddle. I also don’t see how ENSO impacts the balance of energy received and radiated to space by the Earth system. ENSO is a player in the climate politics game if I understand it correctly.
This might be of interest:
http://www.agu.org/wps/ChineseJGeo/47/47.04/articles/yxx.pdf
Is El Niño triggered first by weakened trade winds?
“The easterly trade winds are driven by a surface pressure pattern of higher pressure in the eastern Pacific and lower pressure in the west. When this pressure gradient weakens, so do the trade winds. The weakened trade winds allow warmer water from the western Pacific to surge eastward, so the sea level flattens out.”
http://ww2010.atmos.uiuc.edu/(Gh)/guides/mtr/eln/elyr.rxml
And La Niña
“During La Niña years, the trade winds are unusually strong due to an enhanced pressure gradient between the eastern and western Pacific. As a result, upwelling is enhanced along the coast of South America, contributing to colder than normal surface waters over the eastern tropical Pacific and warmer than normal surface waters in the western tropical Pacific.”
http://earthobservatory.nasa.gov/Features/LaNina/
What triggers the change in pressure and the strength in the trade winds?
Santa Baby says: “What triggers the change in pressure and the strength in the trade winds?”
First, more background info: the strength of the trade winds is further dependent on the difference in surface temperatures (absolute) between the eastern and western tropical Pacific. The sea surface temperatures are normally cooler in the eastern tropical Pacific than in the west. With the warmer water (in the west) there is more evaporation and convection, so that’s why the pressure is lower in the western tropical Pacific. But the temperature difference between the eastern and western tropical Pacific is also dependent on the strength of the trade winds. The trade wind strength and the temperature difference between the eastern and western tropical Pacific are dependent on one another. It is said they are coupled…with positive feedback. This is further discussed and illustrated in the post here:
http://bobtisdale.wordpress.com/2014/01/10/an-illustrated-introduction-to-the-basic-processes-that-drive-el-nino-and-la-nina-events/
And here:
http://bobtisdale.wordpress.com/2014/02/22/el-nino-and-la-nina-basics-introduction-to-the-pacific-trade-winds/
So to answer your question, to initiate an El Nino, weather events called westerly wind bursts (blowing west to east) upset the “normal” balance between the trade winds (blowing east to west) and the sea surface temperatures. That’s discussed in the post here:
http://bobtisdale.wordpress.com/2013/10/22/enso-basics-westerly-wind-bursts-initiate-an-el-nino/
Those westerly wind bursts create a phenomenon called a downwelling (warm) Kelvin wave which shifts warm surface and subsurface water toward the east along the equator in the Pacific. This was discussed in a couple of blog posts in the recent series. Example here:
http://bobtisdale.wordpress.com/2014/04/07/the-201415-el-nino-part-1-the-initial-processes-of-the-el-nino/
That Kelvin wave generates slower-moving waves that travel in the opposite direction (east to west) called Rossby waves (as part of the delayed oscillator theory). After those Rossby waves reflect off of the coasts of Australia and Indonesia, they refocus along the equator, carrying cool surface and subsurface water toward the east, which kills the El Niño and starts the La Niña.
I haven’t written a post about the delayed oscillator theory yet, but I will as we approach the end of this El Niño, taking a chapter of my book “Who Turned on the Heat?”. IRI used to have a relatively simple description of the delayed oscillator theory, but they’ve recently updated their website and that webpage has disappeared. UCAR has a more complex discussion here:
http://www.goes-r.gov/users/comet/tropical/textbook_2nd_edition/navmenu.php_tab_5_page_2.1.3.htm
dp says: “I also don’t see how ENSO impacts the balance of energy received and radiated to space by the Earth system…”
Then you missed one of the important aspects of this post. ENSO impacts when and where sunlight reaches the surface of the oceans and penetrates into the oceans. Maybe I should have been more explicit. ENSO also impacts how energy is released from the oceans to the atmosphere which further impacts the energy balance.
Santa Baby says: “La Niña is more effective at ventilating heat around equator towards the poles.
El Niño is less effective?”
The opposite. Keep in mind that the majority (about 90%) of the heat released from the ocean is through evaporation. During an El Nino, more of the surface of the tropical Pacific is covered with warm water, which yields more evaporation. And the opposite holds true during a La Nina. This is discussed in the post here:
http://bobtisdale.wordpress.com/2013/11/25/la-ninas-do-not-suck-heat-from-the-atmosphere/
Roy Spencer says: “Bob…global area-average ocean signatures.”
Thank you.
bushbunny, see my above reply to Santa Baby.
Cheers.
Getting yourself ‘moderated’ at Climate Etc takes quite a bit of work Bob (judging by what often doesn’t get moderated). There may have been other technical reasons.
trenberth is wrong when he claims that the latent heat of evapouration is released when it rains. It is released at height when the clouds form, condensation. When it rains, if it does, the heat has already escaped to space.
I have been reading Bob’s blog and his posts here for some time. He shows an awesome depth of knowledge on this subject. The overall impression I get is that the huge swings in temperature caused by ENSO are basically massive random noise in the system and are neither proof nor disproof of any AGW effect.
What it demonstrates to me is how tiny any potential CO2 warming effect could be and how natural, internal, forcing and feedback processes totally swamp it such that finding an AGW signal in all the noise is not possible with the data we have.
I have in the past hypothesised that maybe increased CO2 in the atmosphere might be slowing down the rate at which the excess surface heat liberated by an El Nino is lost to space. However, such an effect would be tiny and almost impossible to disentangle from the natural swings in temperature.
If it is truly a “random” process then the recent run of strong El Ninos is just what you would expect from time to time in any random sequence of numbers, in which case it will inevitably come to an end at some point.
I suspect though that there is some kind of “trigger” or underlying cause. Maybe it is part of some much bigger cycle in natural processes. I cannot help thinking of the interference pattern that occurs when waves (cycles) of different frequencies interact causing reinforcement or suppression of amplitude at regular intervals. The different cycle lengths of the AMO and PDO perhaps? All from my fevered imagination…
If there is a net gain in temperature after a recharge/discharge cycle then the only way to avoid relentless warming is for a prolonged absence of Enso cycles. The question perhaps should be what would cause such an absence. The other question that springs to mind relates to the solar cycle. While total radiation is remarkably stable over the solar cycle, there is a more significant variation in the wavelength of the sunlight from times of high sunspots to times of low. As light towards the uv end penetrates deeper into the oceans than does light at the Infra red end, has any study been done of the timing of La Niñas and the solar cycle. Presumably a La Niña occurring at solar max would have different effects to one at solar minimum?
A later blog on WUWT claims a colder climate from 2050-2200 due to reducing TSI. this could mean a reduction of strong El Nino’s. Perhaps this year’s suspected strong one will fizzle out. I wait with interest.
Randomly Placed Rant:
We’re still talking about a temperature variation so tiny that no previous society in human history could have detected or even noticed it. We’re still talking about CO2 levels that are well below the geological mean. We’re still talking about a non-closed system which is poorly understood from nearly every aspect… After spending nearly a decade reading lay person materials, articles, books, and doing little experiments myself, I truly do not understand those people who claim there is some sort of dire emergency regarding global temperature, weather, etc… At this point, I personally have ascribed the movements of CAGW, AGW, weather catastrophe, extreme weather, and friends to the trash heap of failed end-of-time pseudo-religious cargo cults. I don’t debate it anymore, because it’s like debating a creationist, or a democrat, or any other closed minded unscientific individual who is really only interested in pushing political ideas… I actually had one person yell at me that “Facts don’t matter!” when I pulled up the data regarding Arctic temperature, Global Sea Ice, and other commonly and wildly distorted available figures — this is the core of the problem, and it’s never going to fixed by proving anything in the traditional scientific manner — So, ENSO and AMO shift the heat balance from the lower oceans to the upper oceans and so from the insulated depths to the lossy atmosphere… big deal! It doesn’t matter to 99% of believers, and it certainly won’t matter to 99% of the energy lobbyists pushing legislation that favors whatever they are currently selling.
The basic problem is that science is hard. And those who don’t understand science are being taught that hard means unfair…
Bob, to check my own understanding of scattering warm pools of water, that pile of trade wind blown warm water up against the western Pacific doesn’t all stay there. Do these piles of warm water than split up a bit and begin their route to extratropical oceanic areas? I would think that not all of it take these rides to other parts of the globe but some of it must or else the pile of warm water would get bigger and bigger.
As to the heat evaporating off with water vapor during El Nino events, does this heat take atmosphereic rides to other extratropical places or is it lost to space right there?
michael hart says: “Getting yourself ‘moderated’ at Climate Etc takes quite a bit of work Bob (judging by what often doesn’t get moderated). There may have been other technical reasons.”
I suspect it was all of the hyperlinks.
Bob Tisdale,
I very much appreciate your detailed response. Part of the confusion my have been that you were answering my question with respect to ENSO, where I meant it with respect to El Nino. My questions to others were on how the El Nino phenomenon could cause an increase in global heat content. That is what I understood them to be saying, and that is what their answers confirmed. But you had written about ENSO as a single, though multifaceted, mechanism, and assumed my question was as to that.
Quoting you – “As long as the climate science community continues to treat ENSO as noise, they will make little progress in understanding the natural contribution to global warming, and it’s a sizeable contribution.”
My question – “I have several times asked a question, and gotten answers from both Judith Curry and commenters at Real Climate, that suggest that they do not see ENSO as merely noise, but that El Ninos do increase global average temperature, aka “contribute to global warming.” (The switch in terms was intentional, but made the question unclear.)
http://wattsupwiththat.com/2014/01/10/an-illustrated-introduction-to-the-basic-processes-that-drive-el-nino-and-la-nina-events/
This is why your initial response to me did not help. My question was how El Nino, alone could contribute to “global warming.”
I looked at the Trenberth papers, and have read a number of your posts here at WUWT. What I see in both is an explanation of how ENSO increases global heat content during La Nina and neutral phases ,and reduces global heat content (to some degree) during El Ninos. Which was my understanding before my inquiry began.
It was the contention by CAGW advocates that El Ninos, not just ENSO in toto, increased “global warming.” I read your answer from that perspective and I think that was in error.
So I appreciate your taking my poorly phrased question seriously, and taking the time to provide such a detailed response.
I think I understand the mechanism of ENSO to a certain extent, as a layman. And I do understand what you have posted above, about how energy enters the global system more during a La Nina than otherwise, while some undetermined amount is discharged during an El Nino, and transferred among the various climate constituents.
But I am still left with the question of how ENSO, as a whole, causes a net increase in global heat content.
“And what processes can’t climate models simulate properly? ENSO and teleconnections.”
What you and Trenberth describe is a mechanism by which ENCO COULD be a natural contribution to global warming. I think I took your earlier comment as an indication that they DO NECESSARILY contribute to “global warming.”
I think climate scientists are not only incapable of modelling ENSO, I think they are also incapable of measuring with sufficient accuracy the heat added to the system, and the heat radiated from the system during a full ENSO episode, or rotation, such that no one can say with accuracy whether any given ENSO episode caused a net increase or decrease in global heat content.
But I again appreciate your taking the time to answer so fully.
Hi Pamela Gray. You are correct. There is nothing holding the West Pacific Warm Pool in place other than the trade winds and the land masses of Indonesia and Australia. Warm water is constantly being pumped in and out through surface and subsurface currents.
Some of the heat from the El Nino, after the moisture condenses, appears to head toward the poles at TLT levels. See the following animation. The top cell is sea surface temperature and the bottom cell is TLT.
http://bobtisdale.files.wordpress.com/2012/02/with-tlt2.gif
There are number of other animations here for the book “Who Turned on the Heat?”:
http://bobtisdale.wordpress.com/2012/09/03/animations-discussed-in-who-turned-on-the-heat/
Thanks Bob. I have learned so much from you.
LOL, it’s that dreadful weather again, plays up now and again, but quite predictable. What has happened before will happen again. Gee it is cold here in NSW but we did have unusually cold weather a week or two ago, and snow in parts. But it warmed up again for normal Autumn weather. When the tropics get snow, they were are in trouble.
For thousands of years the ENSO quasi-cycle continued with no apparent effect on temperature trends.
In the last few decades ENSO has been been the apparent source of the step-change trend in global temperatures.
Two questions arise,
why has the ENSO process become a part of the warming trend? and when will it stop?
Perhaps the increase in the atmospheric insulation has reduced the rate of energy loss during the warmer El Nino part of the cycle?
Bottom line: neither La Nina nor El Nino can create heat. It’s all a matter of moving it here and there, but net-net, no change.
Brian H says: “Bottom line: neither La Nina nor El Nino can create heat. It’s all a matter of moving it here and there, but net-net, no change.”
Apparently you did not read or understand the post.
izen says: “For thousands of years the ENSO quasi-cycle continued with no apparent effect on temperature trends.”
That’s your assumption. Do you have any data, other than paleoclimatological proxies, to support it? If not, you’re simply speculating.
Ciao
Conceptual and terminological nonsense. “Heat content” cannot warm Temperature cannot warm. They can rise, or fall. But Heat is not created or destroyed by EN or LN events. SST or atmospheric temperatures are affected by their shifts. But total heat is affected only by planet-level inputs and outputs.
The mechanism by which this happens is called nonlinear dynamic heating:
http://onlinelibrary.wiley.com/doi/10.1029/2002GL016356/pdf
http://lumahai.soest.hawaii.edu/MET/Faculty/jff/2004_02%20Nonlinearity%20and%20Asymmetry%20of%20ENSO.pdf
http://web.yonsei.ac.kr/climate/board/4/20090612072138217_2009-2_TAC_An.pdf
izen says:
May 14, 2014 at 11:26 pm
For thousands of years the ENSO quasi-cycle continued with no apparent effect on temperature trends…
How do you know that?
Bob Tisdale:
You say: “As part of the discharge phase of ENSO, the El Niño takes warm water from below the surface of the western tropical Pacific and places it on the surface (warm water that was created by the increased sunlight during the prior recharging La Niña). The discharged warm water floods into the East Pacific…”
At the risk of harping once again on ocean physics, water below the near-surface layer is always cooler, because of temperature-dependent density stratification. There is no persistent temperature inversion in the oceans. That cooler water does not rise to the surface during El Nino, nor is the water in the Warm Pool simply left over from the previous La Nina. Omnipresent ocean currents carry water masses away. What is described in the Eulerian (spatially fixed) perspective by oceanographers are not water masses, but the changes in the vertical distribution of the temperature AS THE WATER MASS FLOWS BY. It is the depth of the thermocline that “sloshes” back and forth during the ENSO cycle. And it’s changing currents, not waves, that transport water masses across the ocean.
1sky1:
Apparently NASA agrees with you:
http://earthobservatory.nasa.gov/Features/WarmPool/
***
The team now believes that the warm pool’s growth may stem from a fluctuation in subsurface currents. These currents, which are located several hundred meters below the ocean’s surface, travel from an area east of Japan to the warm pool. What Mehta’s data reveal is that the currents may be periodically gathering warm surface water from the subtropical Pacific and slowly channeling it beneath the ocean’s waves to the warm pool.
***
1sky1, nothing in your comment contradicts the portion of my post that you quoted, and you’re unnecessarily increasing the complexity of a topic that many persons find too complex already.
You wrote: “That cooler water does not rise to the surface during El Nino, nor is the water in the Warm Pool simply left over from the previous La Nina. Omnipresent ocean currents carry water masses away.”
Upwelling continues in the eastern equatorial Pacific during the El Nino…and because the equatorial undercurrent has carried more warm water that normal to the east during the El Nino, suppressing the thermocline, the upwelling draws warmer-than-normal warm water to the surface.
The supply of warm water for the El Nino was initially created by the preceding La Nina. Is that phrasing more to your liking?
You wrote, “And it’s changing currents, not waves, that transport water masses across the ocean.”
Agreed. And the “pulses” or “surges” in those currents are commonly called waves.
wendel1010, thanks for the link. I haven’t seen that webpage in years. I’ll try to make sure I include it in one of the upcoming updates about El Nino.
phlogiston, thanks for the links to the papers.
Bob Tisdale:
A complex subject is hardly made clearer by confusion, both kinematic and dynamic. Everything I said contradicts your description of the ENSO cycle. It’s dismaying to see you, whose efforts I’ve always encouraged, present a muddled view, wherein denser, cooler water ostensibly rises mysteriously to the surface in the WESTERN Pacific, upwelling in the EASTERN Pacific continues during El Nino, and no distinction is made between categorically distinct dynamics of currents and waves.
Тhanks foг finally writing about >Answer to the Quesion Posed аt Climate Etc.: By What Mechanism Does
an El Niño Contribute to Globaal Warming? | Watts Uƿ With That?
<Loved it!