In the preceding post, we looked at the evolution of the weekly sea surface temperature anomalies in two regions of the equatorial Pacific (NINO3.4 and NINO1+2), comparing the data so far in 2014 to those of the strong 1982/83 and 1997/98 El Niño events. (See 2014/15 El Niño – Part 3 – Early Evolution – Comparison with 1982/83 & 1997/98 El Niño Events.) We presented them because there are a lot of comparisons of this El Niño to those strong El Niños.
In this post, using the same two regions, we’ll compare the evolution of the sea surface temperature anomalies this year to the rest of the satellite-era El Niño events. And we’ll also compare this year to the average, because someone was bound to ask.
This post serves solely as a reference. What it illustrates very well is that there is a tremendous amount of diversity in the evolutions of sea surface temperatures during El Niño events. A tremendous amount of diversity.
Are you ready for some spaghetti?
BEFORE WE START
The processes that initiate each El Niño are basically the same: a downwelling (warm) Kelvin wave heads east along the equator in the Pacific. We illustrated this year’s downwelling Kelvin wave in the first post in this series. The waters at the surface and below the surface of the equatorial Pacific are normally warmer in the west than in the east. So the downwelling Kelvin wave, which is carrying (basically shifting) warm water from west to east below the surface, causes the subsurface temperatures to be warmer than normal along the central and eastern portions of the equator. That warmer-than-normal subsurface water is drawn to the surface in a process called upwelling, and when it reaches the surface, the sea surface temperature anomalies begin to increase along the central and eastern portions of the equatorial Pacific. That’s where we are. The warmer-than-normal subsurface water is being drawn to the surface.
Now consider that the Kelvin waves don’t start at exactly the same time each year…and the Kelvin waves don’t have the same amount of warm water available, so they don’t all create the same subsurface temperature anomalies…and the sea surface temperatures at the start of each El Niño are somewhat different…and the strengths of the trade winds can also be different…and a multitude of other background states are all in different states. That’s why we’re going to see a lot of spaghetti when we compare the evolution of this year’s sea surface temperature anomalies with all the other satellite-era El Niños.
COMPARISONS WITH OTHER SATELLITE-ERA EL NIÑOS (NOT 1982/83 & 1997/98 EL NIÑOS)
Figures 1 and 2 illustrate the evolutions of the weekly sea surface temperature anomalies from the first week in a given year through the 60th week, so the data stretch into the first few months of the second year of each El Niño. (El Niños normally peak in boreal winter, because they are tied to the seasonal cycle.) The NOAA Oceanic NINO Index (ONI) was used as a reference for “official” El Niño events. We’re using the weekly Reynolds OI.v2 data, which starts in late 1981. In addition to where we stand so far for the 2014/15 El Niño (highlighted in red), Figures 1 and 2 also include the evolutions of the sea surface temperature anomalies for the 1986/87 El Niño, 1991/92 El Niño, 1994/95 El Niño, 2002/03 El Niño, 2004/05 El Niño, 2006/07 El Niño and the 2009/10 El Niño. Figure 1 is for the NINO3.4 region, which is located on the east-central portion of the equatorial Pacific (5S-5N, 170W-120W). Figure 2 is for the NINO1+2 region, and it is located in the eastern equatorial Pacific (10S-0, 90W-80W), just south and west of the Galapagos Islands.
You’ll note also that I’ve highlighted the 2006/07 El Niño. Of the group shown, it is the only east Pacific El Niño. The others are El Niño Modoki (central Pacific El Niños). See the posts There Is Nothing New About The El Nino Modoki and Comparison of El Nino Modoki Index and NINO3.4 SST Anomalies, and also see the JAMSTEC ENSO Modoki webpage (El Niño Modoki are a new category. Historically, they are not a new type of event.)
There’s so much spaghetti in the following two graphs, there’s no reason for me to describe them, other than to say there’s lots of diversity during the evolutions of El Niño events.

Figure 1
# # # #

Figure 2
Obviously, each El Niño starts from a different background, in terms of sea surface temperature anomalies. (We’ve already discussed the ocean heat content and subsurface temperature anomalies, noting that both are lower now than they were at the start of the 1997/98 El Niño. See the post here.)
COMPARISONS WITH AVERAGES OF SATELLITE-ERA EL NIÑOS (INCLUDING THE 1982/83 & 1997/98 EL NIÑOS)
Figures 3 and 4 follow the same formats. But with them, we’re comparing the evolutions of the 2014/15 El Niño (so far) to the averages of all of the satellite-era El Niño events, including the 1982/83 and 1997/98 El Niños. Now in 2014, NINO3.4 sea surface temperature anomalies are warmer than average, and NINO1+2 anomalies are cooler than average.

Figure 3
# # # #
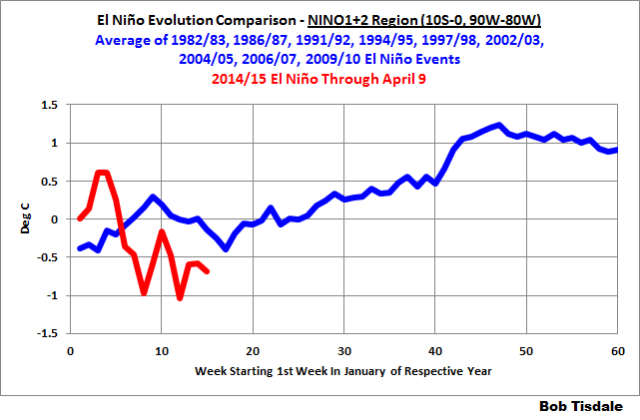
Figure 4
Do the below-average readings in the NINO1+2 region mean that the 2014/15 El Niño will be a central Pacific El Niño and not the stronger east Pacific variety? Not necessarily. As you’ll recall from Part 3 of the series, the 2014 NINO1+2 values are similar to those at the start of the 1982/83 El Niño. See the graph here. And the 1982/83 El Niño was a strong El Niño—no doubt about that.
SOURCES
The weekly sea surface temperature anomaly data presented in this post is available through the NOAA NOMADS website:
http://nomad1.ncep.noaa.gov/cgi-bin/pdisp_sst.sh
or:
http://nomad3.ncep.noaa.gov/cgi-bin/pdisp_sst.sh?lite=
EARLIER POSTS IN THIS SERIES
- The 2014/15 El Niño – Part 1 – The Initial Processes of the El Niño.
- The 2014/15 El Niño – Part 2 – The Alarmist Misinformation (BS) Begins
- The 2014/15 El Niño – Part 3 – Early Evolution – Comparison with 1982/83 & 1997/98 El Niño Events
FURTHER READING
My ebook Who Turned on the Heat? goes into much more detail to explain El Niño and La Niña processes and the long-term aftereffects of strong El Niño events. I’ve lowered the price of Who Turned on the Heat? from U.S.$8.00 to U.S.$5.00. A free preview in pdf format is here. The preview includes the Table of Contents, the Introduction, the first half of section 1 (which was provided complete in the post here), a discussion of the cover, and the Closing. Take a run through the Table of Contents. It is a very-detailed and well-illustrated book—using data from the real world, not models of a virtual world. Who Turned on the Heat? is only available in pdf format…and will only be available in that format. Click here to purchase a copy. Thanks.
NEXT POST
The next post in the series will be about the Pacific Decadal Oscillation (PDO) and its relationship to ENSO…unless, of course, the weekly NINO3.4 sea surface temperature anomalies reach the 0.5 deg C threshold of an El Niño. I started writing the PDO post about a month ago. It’s an appropriate time to raise the topic again since the PDO is often referred to in blog posts about the upcoming El Niño.
I am now suffering from spaghetti overdose and need to retire and consider the matter. yet again.
As for any answer, like the weather, we will wait and see.
Interesting. It seems the definition of “El Nino” evolves.
What it shows is that there is no pattern. At least not in recent El Ninos. But that is what the slow process of data gathering is all about.
Based on some earlier studies I believe it will turn to La- Nina from June July.
Bob, after studying figure 3 I am convinced this years ENSO is related to the Loch Ness Monster. I am not sure what this indicates but I am enjoying your series as always.
El Nino is not a cause, it is a hindsight description. This coming winter should see plenty of rain for most Australian states except NT, parts of WA and TAS. For that and other reasons, particularly the still high solar count, El Nino is not set to start until July 2015, and continue at least until the end of 2015. After that, the next EL Nino is due around 2020. Also a major Australian drought is due 2019-21.
El Ninos are a function of lunar declination. The 1987 EL Nino occurred concurrent with maximum declination, 1997 EL Nino with minimum declination, 2006 EL Nino with maximum declination, and a 2015 EL Nino with the next minimum declination. For EL Nino to occur in 2014 would betray the pattern. Claiming it is imminent is just alarmist propaganda that sells newspapers and qualifies yet again as a funding grab.
Thanks for advancing the knowledge base, Bob. Real world data is much messier than simple theories. Your grip on ENSO realities grows ever stronger and is of great assistance to the science-reading community. In particular the physical explanations following the heat through the oceans have generated some of the most useful graphics available. Thanks.
kenmoonman, can you post the reason for El Ninos are a function of lunar declination
A correction Bob:
“So the downwelling Kelvin wave, which is carrying (basically shifting) warm water from west to east below the surface, causes the subsurface temperatures to be warmer than normal along the central and eastern portions of the equator”
The Kelvin wave is not carrying warm water from west to east. Kelvin waves transmit energy, not mass, within the ocean. The downwelling Kelvin wave is pushing the thermocline deeper, creating warm subsurface temperature anomalies. When the downwelling Kelvin wave and subsurface temperature anomalies reach the eastern Pacific, the subsurface temperature anomalies are carried by equatorial upwelling into the mixed layer, generating warm SST anomalies. Additionally, zonal current anomalies created by the downwelling Kelvin wave displace the western Pacific warm pool to the east.
You may find the review by Wang et al. [2012] useful. http://www.cgd.ucar.edu/cas/cdeser/Docs/submitted.wang.enso_review.pdf
kenmoonman says:
April 18, 2014 at 4:44 am
“El Ninos are a function of lunar declination. The 1987 EL Nino occurred concurrent with maximum declination, 1997 EL Nino with minimum declination, 2006 EL Nino with maximum declination, and a 2015 EL Nino with the next minimum declination. For EL Nino to occur in 2014 would betray the pattern. Claiming it is imminent is just alarmist propaganda that sells newspapers and qualifies yet again as a funding grab.”
———————
AH SO, ….. I see what you mean, to wit:
“The Moon’s maximum and minimum declination also varies because the plane of the Moon’s orbit around the Earth is inclined by about 5.14° to the ecliptic (the plane of the Earth’s orbit around the Sun), and the direction of lunar orbit inclination gradually changes over an 18.6-year cycle, ………..
Then, 9.3 years later, during the major lunar standstill, the Moon will change its declination during the nodal period from +28.5° to −28.5°, which is a total movement of 57°, which is enough to take its culmination from high in the sky to low on the horizon in just two weeks (half an orbit).”
The following table shows some occasions of a lunar standstill. The times given are for when the moon’s node passed the equinox—the moon’s greatest declination occurs within a few months of these times, depending on its detailed orbit.[3][4] However, the phenomenon is observable for a year or so on either side of these dates.[1]
Times of lunar standstill
major standstill minor standstill
May 1988 February 1997
June 2006 October 2015
April 2025 March 2034[5]
September 2043[5] March 2053[5]
Source: http://en.wikipedia.org/wiki/Lunar_standstill
=====================
It’s always a good day ….. when one learns something new.
The best short-term predictor of the ENSO is the upper 300M ocean temperature anomaly from 180W to 100W. It provides 1 to 2 month lead-time and also indicates the potential strength of the ENSO.
Back to 1979 here.
http://s29.postimg.org/e755lh7ef/ENSO_vs_EUOTA_Mar14.png
The current weekly values appear to have peaked at 1.7C for now which signals a short-lived summer El Nino in the 1.7C range.
http://www.cpc.ncep.noaa.gov/products/analysis_monitoring/enso_update/heat-last-year.gif
The 1972-73 El Nino is probably a good model since it occurred in the middle of a cool PDO period.
It was fairly large getting to +2.12C making it the 8th biggest El Nino (+2.5C being super category).
Global Temperatures responded to the 1972-73 El Nino as expected (lagging behind by 3 months) and we saw a temporary upswing and then a downswing as the El Nino ended and was then followed by an equally strong La Nina which got to -2.25C exactly one year later.
Zoom-in of 1970 to 1976 with Nino 3.4 (not lagged) and scaled to its usual impact on global temperatures of 0.08.
http://s4.postimg.org/kcb9jx6a5/1972_El_Nino.png
kenmoonman says: “El Ninos are a function of lunar declination. The 1987 EL Nino occurred concurrent with maximum declination, 1997 EL Nino with minimum declination, 2006 EL Nino with maximum declination, and a 2015 EL Nino with the next minimum declination. For EL Nino to occur in 2014 would betray the pattern.”
Your hypothesis overlooks all of the other El Nino events.
Joseph Murphy says: “Bob, after studying figure 3 I am convinced this years ENSO is related to the Loch Ness Monster.”
I thought that red wiggle looked familiar. Thanks, you made me laugh.
Bill Illis says: “The current weekly values appear to have peaked at 1.7C for now which signals a short-lived summer El Nino in the 1.7C range.”
The other possibility is that that is just a temporary peak. The monthly data in your longer-term illustration show some temporary setbacks in the evolutions of some El Ninos…but not others. Time will tell…as we keep saying.
In some respects, a short-lived El Nino would be nice. In other respects, I’d welcome a super El Nino…just to study it.
Many thanks Bob, excellent study as per usual.
I have been following but only comparing with 97/98 (major) and 09/10 (latest). It would appear (will stand correction) that the present, if it plays out, is starting from a higher global SST base. Approx +0.3c (Reynolds Wk 15) versus approx 0.15C for 97/98 and 09/10. Any thoughts on how this event may eventually effect global SST?
The E Nino wishers are getting a little dose of TSI from the sun as activity increases again in last week or so after calming down for a last month. I do believe Spikes in TSI increase the chance of El Nino’s if weather patterns are right. If timing is right with all weather patterns extreme events are Always the out come. Timing Timing Timing.
http://www.solen.info/solar/
“In some respects, a short-lived El Nino would be nice. In other respects, I’d welcome a super El Nino…just to study it”
Looking at real events and data doesn’t work as they do not match the hypothesis. You do not need one to take place as there are a thousand computer simulations to show the nex super el-nino will fry us all. If that doesn’t get us farting cows will.
Bob Tisdale, it is difficult to tabulate all EN events, especially when EN’s only got to be named after 1982. The SOI is the true thing to watch, and therefore the switch to EN rather than the EN itself. In the 13 years between 1965-97 there have been 7 significant change-to-ENs of SOIs greater than values of -10
1965 (-15)
1972 (-11)
1976(-13)
1982(-22)
1987(-11)
1991(becomes -14)
1997(-16)
http://www.longpaddock.qld.gov.au/products/australiasvariableclimate/ensoyearclassification.html
That is an average of one every 4.5 years, roughly a quarter of the lunar cycle. These years are ALL either at or within a year of averagely more distant lunar perigees, those years being 1965, 1973, 1977, 1983, 1987, 1991, 1996. It is as if the switch to stabilise west/east sea-level differentials via the SOI current reversal happens when the moon’s ‘hold’ on currents is relatively weaker..
The next relatively distant period of average perigee is late 2015 through 2016. I would suggest it is a convincing case for the next EN to begin during the second half of 2015 and not before.
kenmoonman says: “…It is as if the switch to stabilise west/east sea-level differentials via the SOI current reversal happens when the moon’s ‘hold’ on currents is relatively weaker.”
You may be onto something. I’d like to see some diagrams. I’ve never found any overwhelmingly convincing argument re why the bulge “sloshes” east when it does. Lunar forces may be part of this, though my feeling is that, given enough bulge, it won’t take much to trigger it, so it could be other things, possibly minor equatorial cyclonic storms, as Bob has mentioned previously, or other asymmetric forces acting on the trade winds. And once the bulge starts to move, the momentum is huge; nothing will stop it.
We don’t need no stinkin’ science. It’s all Bush’s fault. Debate over.
love,
Barack
What about all the other years that started off like the El Niño years and never developed.
Some of them looked just like this.
Each time it goes a bit positive El Niño is called. Eventually one time it will be right .
There is no diagnosis here or else we would all know when every El Niño will occur..
More ice in the Antarctic for last 2 years.
Should be an avalanche of cold water heading equator wards for next 5 years so odds favour Kla Nina but so many factors to consider.
I recommend Trader Joe’s marinara sauce with spaghetti. The big can.
Good work, Bob. Thanks.
Thanks, Bob. A good article helping understand more about ENSO.
Thanks to your good work there is now a lot more understanding of this critical climate feature of Earth’s ocean circulations.
I have just published an article on the AMO, but it was not complete without quoting your work.
With all this hot water….are the oceans rising? Are we seeing a spike in the sea levels as a result of this?
Whilst I respect the time and energy that went into Bob’s article, I would suggest that El Ninos have all been capable of being labelled fizzers, warm, cool, wet and dry because El Niino has always been used as a vague hindsight term, whereas the SOI is visible as it is unfolding. Everything in science has a source, and the SOI is not an exception. The trick, as ever, is to find what it correlates well with. The correlation to lunar perigee distance and declination is rather easy to see. Is it the ongoing politic of paganism that makes scientists cast the moon aside as ‘astrology’? Surely that debate is well over by now.
The current Nino trends (3+4, 1+2) are not a million miles away from the 2006-2007 event. If this similarity (albeit very tenuous) were to continue, then a weak el Nino will unfold followed immediately by a much stronger reactive La Nina. Further, were this to take place, it might suggest a developing inversion of the ENSO asymmetry, i.e. for the last few decades el Ninos have ben bigger than the La Ninas, but this could change to the opposite with a change to the ENSO “ground state”.
Re KenMoonMan and associated comments; we here in the southern hemisphere are very familiar with Ken. Controversy yes, but often right. This does add to the incredible number of variables that influence ENSO. Bob, the surges of surface temperature your graphs show early on in the southern fall may be the result of an MJO pulse. I notice you don’t explore the MJO as much as I would like and wish you would. This event is not some vague energy pulse; it’s quantitatively obvious when it’s strong and will certainly be a factor in moving water eastward for a short while. As it moves east at 10 kts or so it brings westerlies (up to 850) and convection. A tropical forecaster down here monitors this pulse without fail. Again, please check it out and add it to your growing arsenal. BoM probably has archive data.
This track and the previous track that you posted earlier for the bigger El Ninos tells me that there is nothing yet to indicate that the 2013/2014 potential El Nino will be very strong ( like 2082/2083 or 1997/1998 El Ninos) despite all the projections claiming a strong El Nino in the works
kenmoonman says: “Bob Tisdale, it is difficult to tabulate all EN events, especially when EN’s only got to be named after 1982.”
Named? What name have they come up with for the developing El Niño this year. Are you aware of the Oceanic NINO Index? It extends back to 1950.
http://www.cpc.ncep.noaa.gov/products/analysis_monitoring/ensostuff/ensoyears.shtml
A couple of years ago, using the same formula and HADISST-based NINO3.4 sea surface temperature anomalies, I created an ONI-like table that extends back to 1900:
http://bobtisdale.wordpress.com/2010/11/30/long-term-oni-like-table-of-el-nino-and-la-nina-events/
kenmoonman says: “The SOI is the true thing to watch…”
The SOI is troubled by weather noise, like the influence of the QBO. That’s why ENSO researchers in the late 1990s searched for an appropriate sea surface temperature-based ENSO index. They agreed on the NINO3.4 region data.
kenmoonman says: “In the 13 years between 1965-97…”
I will assume that’s a typo, otherwise it’s not telling a good story about your math skills.
kenmoonman says: “In the 13 years between 1965-97 there have been 7 significant change-to-ENs of SOIs greater than values of -10”
According to your BOM SOI reference, your classification scheme accepts 7 convenient El Niño events but overlooks 8 inconvenient El Niños. Too much convenience, kenmoonman.
angech says: “What about all the other years that started off like the El Niño years and never developed. Some of them looked just like this.”
Please list them. Thanks.
I only trust Holdren. What does he prophesize?
sarc off
kenmoonman says: “Whilst I respect the time and energy that went into Bob’s article, I would suggest that El Ninos have all been capable of being labelled fizzers, warm, cool, wet and dry because El Niino has always been used as a vague hindsight term, whereas the SOI is visible as it is unfolding.
Your labeling (“fizzers, warm, cool, wet and dry”) appears to reflect your understanding of an El Nino as simply a lagged effect on Australian weather. In this series, we’re obviously looking at the processes taking place along the equatorial Pacific because that’s where El Ninos take place, below the surface and above the surface. An El Nino is part of coupled ocean-atmosphere processes that take place in the tropical Pacific. The SOI is one of many metrics used to forecast an El Nino and indicate that one has taken place. And as noted earlier, because the SOI is strongly impacted by local weather in Darwin and Tahiti, it is a poor ENSO index.
Bob Tisdale says” An El Nino is part of coupled ocean-atmosphere processes that take place in the tropical Pacific.”
Therein lies what I would call a historical misunderstanding. El Nino is not a process at all. but simply the description of a process, called the following year in hindsight, and like any other inquest into an accident it cannot be held to have caused any accident. These days we get told what El Nino causes. Nope, sorry, nothing doing. A process is distinct from a description. When Bob calls for listings of El Ninos that were fizzers he fails to distinguish the El Nino “condition” from the El Nino “episode”. Both attract research funding, which keep the confusion rolling and the dollars flowing into the pockets of those promoting the confusion. It is probably science, but part of a politicised breed and not the type that could better advance truth. Ignoring the moon is always going to come back to bite the biased. Rule out lunar declination if you can, but do rigorous science first. I would suggest that disproving lunar forcing in anything involving oceanic currents is always going to be in a too-hard basket beyond today’s earth science capability. In lieu I commonly find scorn and slander substituting for serious discourse. The SOI, ENSO and PDO are one and the same in source. It does not matter what they are called, the ocean heaves back and forth due to massive volumes of water changing hemispheres due to lunar drag across the equator twice per month and undergoing stalling and hastening around the standstill clock. The sooner scientists show some serious interest the better, as they could build better models than they have at present. But a bias has grown that renders many operators incapable of such objective analysis. I am not saying Bob is not serious, nor does his article lack rigour. I am simply suggesting that the definition of El Nino is something that suits a funding agenda rather than a truly scientific one.
I always believed that El Nino was a colloquial term for a phenomenon observed by Chilean fishermen in which the ocean temperature was anomalously warm round Christmas time. (Very scientific term).
We now have ‘scientists’ measuring ocean temperatures in grids 8 thousand miles away on the opposite side of the Pacific, (or in the middle of the Pacific ocean) in April and casually assigning their cause to El Nino.
This whole business amuses me almost as much as the claim I read here the other day that ‘scientists’ had discovered that the temperature of ‘the North Atlantic’ varies by some .4 degrees C over a 15 year period…wow!!!!
You know, sometimes I think the Warmists are winning, not because their theory is correct, but their method and approach to ‘science’ is beginning to permeate our approach.
We have become pattern searchers, link makers, cause and effect junkies, desperately trying to impose some kind of order on the chaotic behaviour of our planet. It’s futile and immature and bound to fail.
Warmists predicted climate armageddon on the basis of a dozen years of rising temperature in the 80s and 90s and can be easily humiliated by reminding them of Gore’s Hurricanes or ‘snow a thing of the past’.
In ’97 we observed an El Nino and a possibly related atmospheric temperature spike…now all eyes are on Pacific. Everyone desperately trying to extrapolate and predict on the basis of the pitifully small amount of data we possess. Everyone wishing for their outcome to come true.
Well maybe it’s time to remind ourselves that we have no data on ocean temperatures going back more than a few years, then let ourselves off the Warmist hook.
Let us instead observe and gather data with the amazing tools we now have and enjoy some real science and leave the floundering and the wild claims to the alarmists.
kenmoonman says: “Therein lies what I would call a historical misunderstanding. El Nino is not a process at all. but simply the description of a process, called the following year in hindsight, and like any other inquest into an accident it cannot be held to have caused any accident…”
Once again, kenmoonman, you express your misunderstandings or willingness to mislead or misrepresent ENSO. Your comments expose your failure to comprehend basic coupled ocean-atmosphere processes and feedbacks, like Walker Circulation and Bjerknes feedback. Ever heard of them? They are processes and feedback associated with the coupled ocean-atmosphere processes known as El Nino and La Nina events.
Please feel free to present your findings using time-series graphs as others have asked, kenmoonman. All you’ve presented so far is unfounded speculation that is not supported by data, and if you’re not aware of it, that doesn’t fly here at WUWT.
Have a good day, kenmoonman. Adios.
Charles Nelson, I absolutely agree. El Nino is only a loose description, like “climate”. One was taught in school in a subject very loosely called “social studies”, (being a joining of geography and history) that e.g. the ‘climate’ of Jamaica was warmer than the ‘climate’ of Alaska. The emphasis was not on any quanitatiing of weather patterns themselves, but merely on how weather impacted on comparative cultures.
Our little Christmas baby boy El Nino started off life in the same way, being the cultural and vocational consequence of unusually warmer waters on Peru fishermen in 1982. Then in 1999, Don Rodbell of New York’s Union College discovered Peruvian records in the Andes dating back 15,000 years which demonstrated planning for El Nino-type rains.
But then suddenly El Nino funding appeared. Complexity will always arise from a careless comma or an off-the-cuff remark if well enough financed. Eventually the funding may get so large that the original concept gets lost in the murky mire of its own making, leaving it searching for meaningful identity.
Finding none, but not wishing to stop a gravy train, the concept renews in as many ways as there are funding sources. It is why some El Ninos are vague, some strong, powerful, super, light, or whatever adjective will look respectable next to them. Like Elvis impersonators they are all dressed up to look the same but there was only one original. The rest are wannabees.
Bob Tisdale, I have supplied data in the form of perigee year averages and declination correlations to support my case. Are you saying acceptable data here must show a graph or two, otherwise is dismissed as invalid?
My interpretations of El Nino may not concur with yours, but I have the next El Nino starting after July 2015 and not before. Forget fancy graphs, links and backups just for a moment and please indulge me, because although I searched several times I could not find a ballpark date anywhere embedded in your article.
I did find a lot talk about spaghetti though, which I enjoyed reading because I had not yet eaten. That aside, kindly match my prediction in the same spirit of educated guess – when do you estimate the next El Nino to start?
kenmoonman says:
April 18, 2014 at 9:26 am
“Everything in science has a source, and the SOI is not an exception. The trick, as ever, is to find what it [El Nino] correlates well with. The correlation to lunar perigee distance and declination is rather easy to see. ”
—————–
Now, in reference to the following statement of, to wit:
kenmoonman previously said: “El Ninos are a function of lunar declination.”
Thus, I extracted the following from, to wit: http://en.wikipedia.org/wiki/Lunar_standstill
—————
The Sun’s declination changes from +23.5° N to −23.5° S to the plane of the earth’s equator.
At major lunar standstill (maximum declination) the moon is farthest (28.5°) from the plane of the earth’s equator.
At minor lunar standstill (minimum declination) the moon is nearest (18.5°) to the plane of the earth’s equator.
The two points at which Moon’s path crosses the Sun’s Ecliptic are known as the nodes. Due to precession of the lunar orbit the nodes take 18.6 years to complete one cycle
When the nodes align with the Earth’s equator is when a standstill occurs, or every 9.3 years.
———-
Now given the above it appears to me there are per se Mini-Milankovitch cycles occurring therein.
And if so, my question is, ….. is there any correlation between the “start” and/or ”intensity” of past El Nino events ….. and the alignment of the earth and moon to the Sun’s Ecliptic?
If the above parameters (or more exact parameters) were input to a computer program it should easily plot a “sine wave” graph that would show said “correlation” if one existed. And/or would predict when the next El Nino event(s) would occur.
You can not discredit the potential affect the Moon has on the origin of El Ninos unless you have legitimate scientific reason(s) for doing so.
Now I have personally witnessed a dozen or so times when the temperature of an extended “winter cold spell” of 8 to 10+ days of below freezing temperatures would suddenly terminate and the temperatures would rise within say 12+- hours of when the Moon reached “Full Moon” status ….. but I don’t have a clue as to why it occurred. And my learned background in/of the Physical Sciences offered no clues either.
I think the problem, Samuel, is in deciding what an El Nino is, before one commits to when the next is due to start. This dilemma is common. Bob is also saying he is not sure that the SOI is as relevant as ENSO, but that seems tautological seeing ENSO means El Nino anyway.
Oceanic oscillation rules and that there are roughly 4x El Nino-type events each declination cycle, making them average 4.5 years. The longer the sample the closer the average, but we lack oceanic archival temperatures and we have to get to the next level. The declination cycle is 18.613 years. The perigee cycle is 8.85 years and two are 17.6 years. Averaging these yields a little over 18 years which takes us from 1997 into 2015. Other factors such as the SSB, Jupiter-Saturn Synod and sunspot cycle decline from peak to minimum, would also suggest El Nno starts late in 2015 and extends into 2016.
An El Nino-type year, like the proverbial duck, should walk and talk like one.
2014 so far does not.
kenmoonman says:
April 19, 2014 at 5:36 pm
“I think the problem, Samuel, is in deciding what an El Nino is, before one commits to when the next is due to start.”
———————-
kenmoonman, you have put the cart before the horse. We know what an El Nino is. The problem is that we don’t know what causes it, …… when the next one will happen ….. or how severe it will be when it does happen.
El Ninos are like tornadoes. Everyone knows what a tornado is ….. but not everyone knows what causes a tornado, …. when the next one will happen ….. or how severe it will be when it does happen.
=============
“Oceanic oscillation rules and that there are roughly 4x El Nino-type events each declination cycle, making them average 4.5 years. The longer the sample the closer the average, but we lack oceanic archival temperatures and we have to get to the next level. The declination cycle is 18.613 years. The perigee cycle is 8.85 years and two are 17.6 years. Averaging these yields a little over 18 years which takes us from 1997 into 2015. Other factors such as the SSB, Jupiter-Saturn Synod and sunspot cycle decline from peak to minimum, would also suggest El Nno starts late in 2015 and extends into 2016.”
——————–
Now the above is all fine and dandy but me thinks you are mixing apples n’ oranges together and then trying to “reverse engineer” the cause of an El Nino event and it aint gonna work.
kenmoonman, forget about “averages”, …. average events, average temperatures, average years, average cycles, etc., …… because they reflect “past events” and thus they serve no purpose whatsoever other than “reference data” … and the fact that “averages” change every time one does a re-calculation of the data.
Now if oceanic oscillation rules the “birth” of an El Nino-type event in the western Pacific then the primary factors for causing said are: 1) the location of the earth’s Equator; 2) the amount of solar energy being received at the equator; and 3) the gravitational pull of the Sun and Moon on the ocean waters at the Equator. All said factors are asynchronous to one another. And except for the Equator, said factors have different “cycle-time” periods and thus their combined (maximum) effect on oceanic oscillation at the Equator is determined by their alignment to each other.
The Sun’s cycle is 365.25 days which means the Sun crosses the Equator 2 times per year or once every 182.625 days which is when the maximum solar energy is being received at the Equator …. and it has the maximum gravitational pull on the ocean waters at the Equator.
The Moon’s cycle is 27.212 days which means the Moon crosses the Equator 2 times per year or once every 13.606 days which is when it has the maximum gravitational pull on the ocean waters at the Equator. Also, the moon’s declination changes from a max of +-28.5° N/S to a min of +-18.5° N/S to the plane of the earth’s equator which also affects it gravitational pull.
The Moon’s maximum and minimum declination also varies because the plane of the Moon’s orbit around the Earth is inclined by about 5.14° to the ecliptic (the plane of the Earth’s orbit around the Sun), and the direction of lunar orbit inclination gradually changes over an 18.6-year period.
kenmoonman, there are two (2) graphics on this web site that explains what I attempted to say above, to wit: http://en.wikipedia.org/wiki/Lunar_standstill
Now one needs to create a “sine wave” graph via the above factors with the Equator being the base line of 0° (zero degrees) …. and with the +-° (degree) positions of the Sun and Moon plotted according their respective cycle positions.
Like this Biorhythm graph, to wit: http://en.wikipedia.org/wiki/Biorhythm
One has to start with the current “date-time” positions of the earth, moon and Sun and plot the graph in reverse to see if anything correlates to past El Nino events.
Ya gotta see iffen that “duck” is gonna do any quacking for you.
Waiting for El Ninot, episode 2:
Estragon:
Its nice to think that all our problems – such as the Mann-o-pause in global warming, will be behind us once el Ninot comes to the rescue. Any day now I guess…
Vladimir:
Actually – not wanting to damp your hopes – but what just happened to the Kelvin wave subsurface warm water in the Pacific? A week or so ago it was nice and strong but suddenly its gone AWOL.
Estragon:
Oh – you’re right – and that East Pacific south tropical cold water seems oddly persistent, especially along the South American west coast. The ENSO page Hovmoller diagram (anomaly plotted against time and Pacific latitude band) also shows the warm pulse bottoming out. That’s what comes of raising one’s hopes I guess.
Vladimir:
You jinxed it you old fool! Keep your mouth shut next time!
Estragon:
Nothing to be done.