El Niño and La Niña events are the dominant modes of natural climate variability on Earth, which is why the state of the tropical Pacific is continuously monitored. El Niños and La Niñas impact weather patterns globally. As a number of recent papers have argued, the dominance of La Niña events in recent years is responsible for part of the cessation in global surface warming outside of the Arctic, so by inference, those papers are also stating that a string of strong El Niño events were responsible for part of the long-term warming from the mid-1970s to the turn of the century. There’s nothing new about that; for years we’ve been discussing the naturally occurring, sunlight-fueled processes that drive El Niño events and cause long-term warming of global surface temperatures. If this subject is new to you, see the link at the end of this post for an overview.
The World Meteorological Organization (WMO) provides the following summary of their ENSO forecasts in their January 30, 2014 El Niño/La Niña Update:
- ENSO conditions are currently neutral (neither El Niño nor La Niña);
- As of mid-January 2014, except for a small possibility for weak and brief La Niña development during the next couple of months, outlooks indicate likely continuation of neutral conditions into the second quarter of 2014;
- Current forecasts indicate approximately equal chances for neutral conditions or the development of a weak El Niño during the third quarter of 2014, reflecting increased chances for development of a weak El Niño.
It appears no one is suggesting that a full-fledged La Niña will form for the 2014/15 season. As of the week centered on February 5th, the sea surface temperature anomalies of the NINO3.4 region of the equatorial Pacific indicated that the tropical Pacific was experiencing La Niña conditions, though not an “official” La Niña. See the monthly sea surface temperature update for January 2014.
What’s your prediction? Please provide links to the variables you monitor. Here’s what I predict.
I predict, if we see El Niño conditions, global warming enthusiasts will cheer, because they have forecast, in turn, that record high global temperatures will accompany the next El Niño. And I predict, if we see La Niña or ENSO-neutral conditions, skeptics will cheer, because global surface temperatures should continue to remain flat. (Other than that, I don’t make predictions.)
The ENSO wrap-up from Australia’s Bureau of Meteorology (BOM) for February 14, 2014 provides a similar loose forecast. (For those who live north of the equator, keep in mind the BOM is discussing austral seasons.)
And NOAA’s CPC has a similar mix of possible scenarios in their Weekly ENSO Update dated February 10, 2014—though the NCEP’s models are forecasting El Niño conditions starting in April-June 2014. See page 27.
The WMO briefly mentions the problems with ENSO predictions during this part of the year. They write:
It must be noted that model outlooks that span March-May period tend to have particularly lower skill than those made at other times of year. Hence some caution should be exercised when using long range outlooks made at this time for the middle of the year and beyond.
ENSO predictions at this time of year are hampered by a problem called the Spring Prediction Barrier. See the discussion at the IRI website here. But a series of new papers claim to have overcome that hurdle.
The recently published Ludescher et al (2014) Very Early Warning of Next El Niño (paywalled) are predicting El Niño conditions by late 2014. The abstract reads:
The most important driver of climate variability is the El Niño Southern Oscillation, which can trigger disasters in various parts of the globe. Despite its importance, conventional forecasting is still limited to 6 mo ahead. Recently, we developed an approach based on network analysis, which allows projection of an El Niño event about 1 y ahead. Here we show that our method correctly predicted the absence of El Niño events in 2012 and 2013 and now announce that our approach indicated (in September 2013 already) the return of El Niño in late 2014 with a 3-in-4 likelihood. We also discuss the relevance of the next El Niño to the question of global warming and the present hiatus in the global mean surface temperature.
Global warming enthusiasts have already started cheering for an El Niño. See the Michael Slezak article in NewScientist titled El Niño may make 2014 the hottest year on record. And Andrew Freedman of ClimateCentral begins his post Study Sounds ‘El Niño Alarm’ For Late This Year:
A new study shows that there is at least a 76 percent likelihood that an El Niño event will occur later this year, potentially reshaping global weather patterns for a year or more and raising the odds that 2015 will set a record for the warmest year since instrument records began in the late 19th century.
Ludescher et al (2014) appears to be based on Ludescher et al (2013) Improved El Niño forecasting by cooperativity detection (paywalled). We discussed the earlier Ludescher et al paper in the July 2013 post El Niño in the News. I closed that post with:
DID GLOBAL WARMING CAUSE THE EL NIÑOS OR DID EL NIÑOS CAUSE GLOBAL WARMING?
Numerous datasets indicate that El Niño events are fueled naturally. Additionally, satellite-era sea surface temperature records indicate that El Niño events are responsible for the warming of sea surface temperatures over the past 31 years, not vice versa as Li et al (2013) have suggested. If this topic is new to you, refer to my illustrated essay “The Manmade Global Warming Challenge” [42MB].
Thanks for the update Bob. However, I’m not sure the following is correct:
” El Niños and La Niñas impact weather patterns globally. ”
I know it’s not your own idea, there is a lot of discussion of El Nino being some kind of driver. I’ve said serveral times in the past that I think it’s common cause not , direct causation.
RichardLH provided some interesting plots on tides recently.
http://i29.photobucket.com/albums/c274/richardlinsleyhood/M2Tides_zps758f7faa.png
Here we can see a clear linkage of nino3.4 in the middle of the pacific with the other areas it’s is supposed to “impact”.
There is strong suggestion that there is some tidal “forcing” causing similar changes in several parts of the globe.
Oops. I also should have included a link to the following post for those new to El Niño and La Niña processes:
An Illustrated Introduction to the Basic Processes that Drive El Niño and La Niña Events
It’s odds on La Nada, with El Nino at 4:1 against and La Nina at 3:1 against. Warmists are putting their pensions on El Nino, Australian farmers are putting the farms on La Nina but the general population is firmly behind La Nada.
I predict that the climate will continue to change as it always has, and that we won’t be able to do very much about it, for two reasons: not only because we’re just one puny species on the face of a big planet, but mostly because we really don’t have a comprehensive understanding of what makes global climate systems tick in the first place.
That’s as far as I’ll go. 🙂
Greg says: “RichardLH provided some interesting plots on tides recently.
http://i29.photobucket.com/albums/c274/richardlinsleyhood/M2Tides_zps758f7faa.png
Here we can see a clear linkage of nino3.4 in the middle of the pacific with the other areas it’s is supposed to “impact”.”
Sorry, I don’t see the “clear linkage of nino3.4 in the middle of the pacific”. All I see is a map that’s undefined.
Also, the weather-related impacts of ENSO have been studied for decades. For an introduction, see the NOAA webpage here:
http://www.pmel.noaa.gov/tao/elnino/impacts.html
Hoping for a La Nina this year-Australia is a bit dry, although we are having some nice, juicy rain at the moment. It is possible that by the end of next week, dam levels in all capital cities will be higher than a year ago, making Tim Flannery, once again, looking like a goose. Has he actually had a single prediction come true? Looking at the sinusoidal temperature curve, we are just entering a cooling phase. Looking forward to the poppycock excuse to explain away this. Wake up, the tactics of the warmists are EXACTLY those of habitual liars-lies to support lies. Poppycock excuses to support the lie that are difficult or near impossible to verify. Given the so-called “experts ” say 75% chance of El Nino, my bet is for a La Nina. Should be able to get good odds.
Hmmm. La Nina seems to be good for Australia… but also appears to be Bad, for California. Or am I mistaking La Nada for La Nina in California? All I know is, oh!bummer! wants to tax it.
” … I predict, if we see El Niño conditions, global warming enthusiasts will cheer, because they have forecast, in turn, that record high global temperatures will accompany the next El Niño. … “
Since the temperature data sets are massively fraudulent, I expect to see massive “adjustments” to the measured temperatures regardless of El Niño or La Niña conditions. The blatant fraud that is “climate science” proves that science is totally unworthy of the confidence that many moderns place in it.
http://stevengoddard.wordpress.com/2014/02/15/a-good-visualization-of-us-temperature-fraud/
I’ve isolated a 9.3 year variation in Indian Ocean that corresponds to cyclic changes in the lunar declination angle.
http://climategrog.wordpress.com/?attachment_id=777
This shows warm water being transported in and out of the tropical portion of the Indian Ocean in a 9.3 year cycle. It seems that Willis’ tropical governor warms up the cooler surface when the warm water moves south, leading to a net warming rather than a neutral displacement of heat.
A more complex pattern seems to exist in Pacific and Atlantic that span both hemispheres. There is an interplay of 9.3 and 8.85
http://climategrog.wordpress.com/?attachment_id=754
Now that may come some way to your hypothesis that oceanic variations are behind the warming trend.
Surely, the longer the gap between El Niños , the higher the likelihood that one will come along?
I predict La Nina conditions for 2014
There will be sharp decline in SST temperature, confirming the general global cooling trend noted from 2002.
Why?
According to the a-c curve for the amount of energy coming in, 2014 is similar to 1925, looking at energy in…
http://blogs.24.com/henryp/2012/10/02/best-sine-wave-fit-for-the-drop-in-global-maximum-temperatures/
In 1925 there was a sharp decline in SST
http://www.woodfortrees.org/plot/hadsst2gl/from:1900/to:1940
Count on it. Tell everybody to get off their CO2 high horse and to start getting prepared for 2-3 decades of global cooling.
” All I see is a map that’s undefined. ”
It’s the M2 and K1 tides, if you know what they are.
This is URL at the top of the plot but difficult to read. I’ve asked Richard to provide a link.
The linkage is the NW pacific that is used to derived the PDO ‘index’ is in phase with the tides in the Nino3.4 region and with a whole string of zones around the whole of the equator.
A common tidal cause seems a lot more credible that some mysterious teleconnection that allows this tiny part of the Pacific to dictate global climate.
Amusing that the AGW proponents are at all interested in ENSO because, by predicting that El Nino raises global temperatures, they are implicity admiting that CO2 isn’t the ‘driver’ of temperatures they seem to think it is. If CO2 were the overriding ‘driver’ (and if the increase in CO2 drives temperatures higher) wouldn’t it have overcome the effects of both El Nino & La Nina? Still more interesting is the idea that natural processes like ENSO, PDO, AMO have somehow ‘conspired’ to exactly balance the CO2 driven temperature increases for over 17 years. I’m not a betting man, but, I’d be very hesitant to put money on that proposition being true.
Bob: “Also, the weather-related impacts of ENSO have been studied for decades. For an introduction, see the NOAA webpage here:”
That does not avoid the question : what is causing ENSO?
“It causes itself” has always seemed unsatisfactory to me, even if there maybe some postitive feedback in play.
A tidal cause would seem more likely.
http://s29.photobucket.com/user/richardlinsleyhood/media/M2Tides_zps758f7faa.png.html
The M2 pattern links N.Pac, N.Atl, Nino3.4 and the Indian Ocean is in anti-phase with the others.
The teleconnection is the moon !
Greg says: “The teleconnection is the moon !”
Please show me the data (time-series preferred compared to an ENSO index), not inconclusive maps that show very little relationship with ENSO.
I’ve zoomed in and got the original URLS.
http://www.altimetry.info/tools/popup_image.php3?/images/alti/dataflow/processing/geophys_corr/K1_fes2004_amp.gif
http://www.altimetry.info/tools/popup_image.php3?/images/alti/dataflow/processing/geophys_corr/M2_fes2004_amp.gif
Some link to description required.
the top level URL should explain where it all comes from.
http://www.altimetry.info/
“Please show me the data (time-series preferred compared to an ENSO index), ”
I’ve shown you physical data from 2004 that links the regions that ENSO is supposed to “impact”. I’m not saying I’ve got a wrapped up explanation of climate change of the last 200 years.
However, it shows a linkage of tidal variation between the regions that correlate with ENSO.
Further I have shown in the Indian Ocean I direct link between decadal SST variations and lunar declination that drives the tides.
If similar things happen in other oceans (and I’ve shown 9.3+8.85 in other basins) then we get a correlated decadal variation. Since ENSO and trade winds are driven by regional differences in SST, it seems that it’s all pointing to the same natural variation, of which ENSO is a part.
I’ve said for a long time that you are right about ENSO but that it is the mechanism and we need to seek the cause. I think this is starting to show what that cause may be.
mods
I am confused. I left a comment earlier, looked to be comment number 9 or so, and it was posted. It is now gone. No trace.
I think it was about 30 min. ago. Just long enough for me to install this brand new wireless router here at my house.
Was it something I said?
~ Mark
Mods
Heck. Now I can see it again after posting last comment. My comment is in moderation. Please delete these last two comments as they are an impediment to the thread.
~ Mark
Greg says: “I’ve shown you physical data from 2004 that links the regions that ENSO is supposed to ‘impact’.”

Actually, you haven’t. You’ve presented maps, not data.
Greg says: “However, it shows a linkage of tidal variation between the regions that correlate with ENSO.”
Here’s a map the shows correlation of an ENSO index with satellite-era sea surface temperatures, with a 2-month lag:
I see no similarities between the maps you’ve provided and the one above.
Additionally, for example, the coupled ocean-atmosphere processes that cause the tropical North Atlantic to warm in response to an El Niño are well documented. See Wang (2005) ENSO, Atlantic Climate Variability, And The Walker And Hadley Circulation. And Trenberth et al. (2002) Evolution of El Nino–Southern Oscillation and global atmospheric surface temperatures provides very detailed discussions of how and why surface temperatures and precipitation throughout the globe respond to El Niños.
You’ve got a lot of work to do to before you can even attempt to make the claim that it’s the moon and not changes in atmospheric circulation that causes weather to vary in response to an El Niño.
Regards.
There are forecasts of a developing El Nino this year primarily because of the build-up of warm water in the equatorial undercurrent. Jan 2014 here. The big red spot.
http://www.cpc.ncep.noaa.gov/products/GODAS/mnth_gif/xz/mnth.anom.xz.temp.0n.2014.01.gif
This fairly large red spot normally flows under the Pacific surface to the east and surfaces at the Galapagos Islands where it can lead to an El Nino if it is warm or a La Nina if it is cold.
But this currently warm water has to fight its way through the rest of the equatorial Pacific’s cold water in the eastern half in order to still be warmer than average when it makes its way to the Galapagos.
http://www.cpc.ncep.noaa.gov/products/GODAS/mnth_gif/xy/mnth.anom.xy.h300.2014.01.gif
This is “exactly” the same set-up for the previous two years. In those two years, an El Nino looked very likely, started to develop, but came to a sputtering end. Because all the cool water in the east, returned the undercurrent to normal temperatures.
http://www.cpc.ncep.noaa.gov/products/GODAS/mnth_gif/xz/mnth.anom.xz.temp.0n.2012.01.gif
http://www.cpc.ncep.noaa.gov/products/GODAS/mnth_gif/xy/mnth.anom.xy.h300.2012.01.gif
http://www.cpc.ncep.noaa.gov/products/GODAS/mnth_gif/xz/mnth.anom.xz.temp.0n.2013.01.gif
http://www.cpc.ncep.noaa.gov/products/GODAS/mnth_gif/xy/mnth.anom.xy.h300.2013.01.gif
Same set-up, likely to be the same result. In essence, it is why a cold PDO leads to more La Ninas and fewer El Ninos.
Lots of other factors to consider. Trade Winds, SOI, OLR/cloud patterns at the International Dateline, the Peru-Humbolt current SSTs, Atmospheric Angular Momentum, equatorial surface currents – all of which are not pointing to an El Nino.
German scientists believe that there is a 75% chance of an El Nino. They state that 2014 could be the hottest on record.
I’ve read the PDO effects or drives the AMO. I’ve also read in some blogs that the AMO may be going negative….and at an earlier time than predicted. Does this help drive Nino or Nina?
It appears to me that El Niño and La Niña are only weather related events. As Bob says, ther were more El Niño events durning the warming. I don’t think these are climatic variables, but rather are riding the wave of another pattern..perhaps the PDO.
El Nino or La Nina over the long term in the area of concern give us droughts and floods, temps up and temps down. These are also emergent stuff like Willis talks about, only longer term.
The sun also has it’s emergent stuff, and it is not looking pretty for global warming in the northern hemisphere. Regardless of what the pundits tell us the sun had a big slumber during the L.I.A. and seems to be heading for a holiday now.
This would tend to indicate that the sun has a profound effect on our climate, that we do not know why our how is our problem to deal with. ENSO , PDO, AMO all emergent stuff only longer term than Willis’s thunderstorms in the tropics.
Thanks for that map Bob. Always better to have something clear to look at.
“I see no similarities between the maps you’ve provided and the one above.”
Firstly a one year snap shot of M2 or K1 is not the whole story. However, let me point out some similarities since say you see none.
http://www.altimetry.info/tools/popup_image.php3?/images/alti/dataflow/processing/geophys_corr/M2_fes2004_amp.gif
Red spot in Nino3.4 spreads up between HA and CA to major red spot around Canada and Alaska.
Red in tropical Atlantic spreads to Africa.
Red zones south of equator in Indian O. spreading up along coast of Africa.
Red around China/Korea to Japan.
Minimum blue colours in W. Australia.
However, N.Atl /Europe is more neutral in like the strong red in M2 tides, is this because of you the lag you chose. ??
One major difference I see in the southern part of the South Pacific. That one large zone is nearly opposite.
So , no it’s not a 1:1 match with what you show. But “I see no similarities” is someone not looking.
“You’ve got a lot of work to do to before you can even attempt to make the claim that it’s the moon and not changes in atmospheric circulation that causes weather to vary in response to an El Niño.”
Well that’s not actually what I said.
The moon will affect both atmospheric and oceanic circulation. Though the two are quite different media. You have posted many times on the effect of SST on trade winds and ENSO There’s no reason why that is contrary to tidal effects (with the decadal effects on SST I have shown) being part of the cause of changes in El Ninjo 😉
I showed cross-correlation between N.Pac and N.Alt , so did recent Best/Curry paper.
That technique looks at ALL lags and analyses the frequency spectra. It may just be that your 2 month lag is not the right lag for those two oceans.
I see more similarities than differences in those plots but agree this needs a lot more work to understand the timing and mechanisms involved.
Thanks for a useful comparison.
While, it likely won’t happen very soon, I’m hoping to see El Nino to come by the fall. It tends to be very beneficial for southwest USA for rainfall through fall,winter and spring.
Kenny says:
“German scientists believe that there is a 75% chance of an El Nino. They state that 2014 could be the hottest on record.”
Sounds like Rahmsdorf, though he’s not alone. They say that sort of thing every year and who can disagree with a statement like that?
It be the the hottest on record. I agree. On the other hand …….
Hansen was forever predicting massive El Niños but they never came .
A couple of thoughts.
1. Joe Bastardi I believe, is on record stating that an El Niño will occur beginning fall of 2014. He is about the only reliable source that is predicting an El Niño. I don’t know what Joe bases this on, I read it in a tweet, I do not subscribe to Weatherbell. I think Joe follows WUWT, maybe he’ll stop by. 😉
2. Ludescher states that his model has predicted the last two years of La Nada, but I don’t recall seeing those predictions ahead of time. The abstract of his paper does not inspire confidence. Time will tell.
3. I’ll take a stab at it and predict La Nada continues, trending slightly cooler as the year moves on. The Pacific warm pool appears to be bleeding heat to the South, and there does not appear to be all that much heat down there to begin with. I don’t know why the trade winds fail at that onset of an El Niño, but I doubt we will see one this year. Which is about the first Time I have ever disagreed with Joe…
It is almost comical to see the alarmists desperately wishcasting an El Nino; they know that something like that is the only thing that has a chance of salvaging their PR campaigns, and without it, their ride on the government-funded gravy train might just about be over.
It’s like watching a gambler who’s lost most of his stake going all-in at the roulette table, in a last gasp bid to save himself. That rarely turns out well for the gambler.
Now I don’t know whether we will have an El Nino or not; but I do know that desperate gamblers make for very poor forecasters.
Oops , WP chopping stuff out again. Let’s retry.
It couldbe the the hottest on record. I agree. On the other hand …….
Let’s just hope La Nada doesn’t turn into La Ninja !!
I predict a strong La Nina. My prediction is based on the guess that solar activity drives La Ninas and El Ninos – that La Ninas are more likely during global cooling. Given that solar activity seems to be dropping rapidly, my theory would predict an enhanced likelihood of a strong La Nina.
Well, Bob,
I predict, if we see El Niño conditions, global warming enthusiasts will say they are right, global-warming is continuing, and we must do as they say.
And I predict, if we see La Niña or ENSO-neutral conditions,global warming enthusiasts will say they are right, global-warming is continuing, and we must do as they say.
Other than that, I don’t make predictions. But it will be ‘worse than we thought’.
Other than that, I don’t make predictions.
Unless sun spot activity picks up, I’d say it will be La Nada. When there’s a major sun spot group facing the Earth, like there was in the first week of February, the skies tend to be clearer and temps higher—at least in the Philippines. A day after that sun spot group disappeared over the horizon, the skies turned cloudy and temps started to decline. If sun spot activity drops below current levels, then I’d say La Niña.
Last year I thought an El Nino event would have begun in late December. And if we look at the weather analogs for 1975-1978, we would have seen a rather strong El Nino in beginning in late 1975, which accompanied the so-called Great Pacific Climate Shift of 1976-77. Remember, during that period the NH suffered a string of rather nasty winters (1976-1978). With the onset of nasty winter weather for North America (and a West Coast drought), I was surprised not see an El Nino ginning up in the Pacific.
In that case, I will stay with persistence and ENSO neutral conditions. We are overdue for an El Nino. But, when it comes, it will not lift global temps the way Trenbeth et als hope for. La Nina conditions will dominate the Pacific for the next 20-25 years (a repeat for the 1947-1977 cyclic conditions).
Last year, using “observations & models”, climastrologist scientivists from the University of New South Wales Climate Change Research Centre and ARC Centre of Excellence for Climate System Science wishcast a doubling in super El Niño frequency under even modest global warming scenarios. Yet it has now been 17 years since the last super El Niño of 1997, which occurred just 15 years after the previous one in 1982.
But that was then, during a 20-year global warming phase long since ended. This is now, during a global cooling phase.
I don´t know whether even a normal El Niño will happen this year, let alone a super one, but the swing does seem overdue, even given presently cooler tendencies. The charge/discharge switch from cool to warm eastern equatorial Pacific hasn’t disappeared.
During the Pliocene, before the closure of the Isthmus of Panama, the El Niño pattern was more or less constant. Spruce & pine trees ringed the Arctic Ocean.
The Earth does not need an El Niño event to create the hottest weather any more than it needed a La Niña event to create the coldest weather. There is a disruption in the air flow patterns around the planet likely created by a weakening of the solar wind and solar magnetic fields.
The displacements will likely continue through the summer; and in places where there were extreme cold events, there are likely to be extreme heat events as seasonal wind pattern adjustments progress. This seasonal wind adjustment will coincide with the northern migration of the total electron content (TEC).
The TEC not only has a annual cycle, but also a diurnal cycle as it follows the Sun. This is likely a significant driver of daily and seasonal wind patterns, in addition to total solar irradiance and stored heat in the Earth’s waters.
As others do, I also suspect El Niño and La Niña are effects of solar system weather.
A very mild La Nina due to slightly upscale Solar output. I monitor the following variables:
1) Solar Flux
2) Existing Ocean Surface temperatures.
The Solar Flux jumped to +190 sfu due to the Southern Hemisphere of the Sun (down hemisphere) coming slightly alive. This raised the Ozone “temperature” and size causing an upper atmospheric insulating effect. The minor warming is most noticeable in the Arctic, reduction in growth of Sea Ice Extent. The Flux increase will also cause a “reduced La Nina”. Since the integral (over time) of the overall Solar output is about 1/4 of the giant peak in Solar Cycle 19 [1954], the amount of Solar energy reaching the Earth is down.
My view is that the El Niños are a direct result of Solar energy warming the Oceans fueling the Hadley Cycle creating increased Trade Winds that drive Ocean currents. When the Solar input is down, the Trade Winds and Oceans currents are reduced, thereby producing a La Nina.
The present Jet Stream oscillations (Polar Vortex fluctuations) are due to the Pacific Oscillation warm spot 1000 miles west of Washington State. That Pacific Ocean warm spot was one-half the size of the US. The rising warmth drove the Jet Stream North. As the Ocean warmth declines, the Jet Stream will stay further South with Ocean cooling.
Bottom line: direct relationship between Solar Flux and El Niño/La Nina with existing Ocean warmth as a moderator.
I say La Nada or a very weak El Nino because I feel only a slight disruption in The Force. On a more serious note, it is reprehensible that warmists want a strong El Nino, Strong El Nino’s cause destruction and damage across much of the globe but I guess that is a “small” price to pay to advance their (dying) narrative.
Anyone know what BAstardi is predicting?
Despite my skeptical disposition, I must root for an El Niño as I live in Southern California and it is associated with our rains.
I predict La Nina.
Why?
Because the Daily Mail</a? predicts El Nino.
And that's as good an indicator as anyone else been proven to have.
Sorry Mods. Failed to close link.
@Eric Worral
you are my man
@katherine
you get it a bit
@myself
2014 could be nina (strong)
2014 might be nada; if it is, then 2015 will be nina, the lady
there is no El Nino my man, anywhere near, soon
La Nina or El Ninjo ? Where is the driver for both? It’s the SUN Stupid!
Why is my comment from 6:42 still awaiting moderation?
How about neither La Nina or El Nino and continued cooling.
That would do a lot of harm to their theories…
Looks like Yogi Berra could help these folks a bit:
“It’s tough to make predictions, especially about the future.” but
“You can observe a lot just by watching.”
and when their predictions are wrong (as the warmistas usually are):
“I never said most of the things I said.” and
“The future ain’t what it used to be.”
Probably they or their parents agreed with:
“I’m not going to buy my kids an encyclopedia. Let them walk to school like I did.”
The first predictions quote has also been attributed to Niels Bohr, who is probably
rolling in his grave over what has happened to the scientific method….
It looks to me like we will see weak La Niña conditions for a few more months which then transition to weak El Niño. However, just like 2012 it will fizzle out late in the year. This will fuel a multi-year La Nina starting mid 2015 into 2017. Finally, we will see a moderate El Niño in 2018. By that time AGW should be history.
What do I base this prediction on? A repeat of the early 1950s.
Unless there is a sudden unexpected decline in global cloud levels there will be no strong El Nino. The solar energy reaching the ocean surface recently is at lower levels than during the late 1990s. Therefore an El Nino on this type of scale in the near future are currently impossible.
Recent SSTs support La Nina conditions developing.
http://weather.unisys.com/archive/sst/sst_anom-140209.gif
Annual SSTs so far this year even at depth show rather cool conditions.
http://www.cpc.ncep.noaa.gov/products/GODAS/mnth_gif/xz/mnth.anom.xz.temp.0n.2014.13.gif
There is a main obvious warm area between 120E and 180, but unless this moves to between 150W and 90W it wont resurface. Without this there will be no El Nino and La Nada or even La Nina conditions would be favored. In recent years this warm area has been reluctant to move where current anomalies on the other side are below normal.
Compared to December 2013 conditions this year have generally become cooler, especially between 150W and 90W.
http://www.cpc.ncep.noaa.gov/products/GODAS/mnth_gif/xz/mnth.anom.xz.temp.0n.2013.12.gif
For this reason I would favor La Nada continuing or La NIna than El Nino this year.
Re: “The World Meteorological Organization (WMO) provides the following summary of their ENSO forecasts in their January 30, 2014 El Niño/La Niña Update:
“◾ENSO conditions are currently neutral (neither El Niño nor La Niña);”
…..Why does this site show its ENSO meter at about -0.7 into the Nina zone?
Ian M
In my opinion, a weak El Nino is likely during late 2014 and early 2015 which will not raise global temperatures in any significant way and the pause and subsequent decline in global temperature anomalies will resume there after
Bob, the gyre on the WUWT salt graph at http://www7320.nrlssc.navy.mil/GLBhycom1-12/navo/globalsss_nowcast_anim30d.gif is disappearing. At it’s peak it stretched from the 85W degree latitude all the way to the coast of Columbia, a distance of over 600 miles, and had a strong rotation. Look at the video and you will be amazed at the movement of the water. The Humboldt Current that goes up the coast of South America turns West before it reaches the equator; however, it appears that it may have moved slightly North due to the action of the gyre. The power of the gyre is greater than what you would expect from wind alone and it is in a neutral position with respect to strong ocean currents. If you look at the long term picture of the salt in this area, you will see that the gyre developed over an area of strong upwelling. See http://www7320.nrlssc.navy.mil/GLBhycom1-12/navo/globalsss_nowcast_anim365d.gif. The upwelling is in a critical area of ocean where several fast moving currents are in close proximity. Slight changes in these currents could be expected to be important.
The upwelling was so strong that the possibility that it was caused by ice streams coming to the surface is real. An interesting test for ice would be sampling the water for formic acid. Formic acid forms when carbon dioxide and ice are present in water. There have been at least two researchers including Hansen that have reported very corrosive waters in the upwelling waters.
Can you have a cold La Nino caused by the introduction of cold water from the Humboldt Current or by cold water upwelling?
I predict the wind will blow like heck in Kansas, and it will be dry.
There hasn’t been enough recharge for a strong El Niño to occur. These La Nada/El Nado stretches are foreboding for future extreme weather events and a break down in the normal pattern of charge/recharge oceanic heating and cooling. We will continue with neutral and it’s concomitant unpredictable unsettled weather patterns that catch us with our pants down.
an L. McQueen says:
February 15, 2014 at 8:13 am
…..Why does this site show its ENSO meter at about -0.7 into the Nina zone?
That is due to ENSO conditions are confirmed when there are consecutive months above 0.5 or below -0.5.
>> German scientists believe that there is a 75% chance of an El Nino.
>> They state that 2014 could be the hottest on record.
And by their choice of language they give themselves away. Hottest??
One would have thought that to be ‘hottest’ a temperature would have
to be ‘hot’ to start with. 14-15C isn’t ‘hot’.
@box of rocks
is that possible?
@ RichardM
why chose 1950 and not 1925?
http://www.woodfortrees.org/plot/hadsst2gl/from:1900/to:1960
I couldn’t care any less about whether or not its nina , nino or even nada; so long as mother nature is in control and not some group of corporations who want to manipulate the oceans and atmosphere. And believe me, they do want to manipulate- that’s why records are kept, so they have something to compare it to. If you want to control something, first you need to understand how it works.
Lets face it… we are such a strange species; look at the crap we waste our time with. Common its weird man; littering the ocean with buoys, cables and watching it closely with satellites…. really for what. Yeah its interesting, I get it, i’m guilty of that too; but! its really all for not. If anything it will be used against us and the earth.
In my next life I want to come back as an elephant. walking the savannas of Africa with my friends and family just being.
I meant to write come on not common…..duh
If an El NIno were to form late this year by the warm conditions below possibly moving to between 150W and 90W.
http://www.cpc.ncep.noaa.gov/products/GODAS/mnth_gif/xz/mnth.anom.xz.temp.0n.2014.13.gif
The warm under water pool is much cooler than the one that developed during 1997 around the same time of year.
http://www.cpc.ncep.noaa.gov/products/GODAS/mnth_gif/xz/mnth.anom.xz.temp.0n.1997.02.gif
http://www.cpc.ncep.noaa.gov/products/GODAS/mnth_gif/xz/mnth.anom.xz.temp.0n.1997.03.gif
Also cooler around the same time of year than during the last El Nino back in 2009/10.
http://www.cpc.ncep.noaa.gov/products/GODAS/mnth_gif/xz/mnth.anom.xz.temp.0n.2009.02.gif
http://www.cpc.ncep.noaa.gov/products/GODAS/mnth_gif/xz/mnth.anom.xz.temp.0n.2009.03.gif
I forgot to make my prediction. Here it is: I believe that by this time next year I will care even less.
Predicting an El Nino is easy. We know that on the average they come every four-five years. The last one was in 2010. If it is a normal El Nino we should expect it in 2014 or 2015.
I predict a big fat La Nina, similar to ~1955, but maybe in a year or so. Before that we will see a weak El Nino (this year).
New theory linking it all together! Sun, Clouds, Currents, Heat Distribution, etc.
First, a base line for the Earth not warming or cooling:
1) Solar energy, easily measured via the Flux, enters the Atlantic and the Pacific around the Equator.
2) The Solar energy causes extensive evaporation that neither warms or cools the Ocean waters.
3) The evaporation fuels the Hadley cells [Arctic, Antarctic Cell] creating clouds, trade winds, tropical rain forest regions, and deserts.
4) The Hadley Cell falling air current drive the Trade Winds.
5) The Trade Winds drive Oceans currents distributing Ocean water and heat/cold.
6) Eventually, the Oceans currents return the water back to the equator.
Second, the Solar Flux above 170sfu:
1) More Ocean warming and more evaporation cooling. Stronger Hadley Cell creating more clouds.
2) The Solar energy warms the Ocean Surface exceeding the amount evaporation cooling from the Ocean Surface.
3) This causes Ocean Surface warming or a El Niño.
4) The stronger Trade Winds move the Ocean Surface currents to the Northern/Southern extents of the Oceans.
5) Excess heat is then transferred to the Arctic/Antarctic.
Third, the Solar Flux under 120sfu:
1) Less Ocean warming and less evaporation cooling. Weaker Hadley Cell creating fewer clouds.
2) The evaporation cooling from the Ocean Surface exceeds the Ocean Surface heating.
3) This causes Ocean Surface cooling or a La Nina.
4) The weaker Trade Winds move the Ocean Surface currents to the Northern/Southern extents of the Oceans, but not as far north/south.
5) Heat is then transferred to the Arctic/Antarctic cooling the Planet.
Summary:
1) More Solar Flux, more Clouds, more heat input, warmer Ocean temperatures, El Niño .
2) Less Solar Flux, less Clouds, less heat input, cooler Ocean temperatures, La Nina.
The El Niño/ La Nina events are controlled by the heat input and the amount of evaporation cooling. In addition, some of the cold upwelling in the Pacific is controlled by the amount of evaporation into the Hadley Cells.
I predict (total guess) a strong La Nina beginning mid-March.
jlurtz says:
February 15, 2014 at 9:12 am
Don’t neglect the Indian Ocean, which has a longer stretch of equatorial water than the Atlantic.
Anthony,
Any chance of a guest post by one of the two Joe’s from WB? This is an important issue, and one of great interest to your readers.
@timothy
you must motivate your prediction
@Bob T. I was under the impression that a number of data collection points were not functioning anymore or intermittent. If so is data then averaged between points? and how large are these gaps in the first place where can I go to find that information?Thanks.
Most claims of x bad weather in random place happened during an El Niño, therefore they were caused by El Niño is just cum hoc ergo propter hoc. Total nonsense. ENSO is ony associated with a few phenomena on a somewhat consistent basis. But the scope of claims is much broader, including literally every weather event that happens-especially if it is bad-even if the opposite usually happens.
What’s your prediction? Please provide links to the variables you monitor. National Oceanic & Atmospheric Administration (NOAA) – Climate Prediction Center – Click the pic to view at source[/caption]
 National Oceanic & Atmospheric Administration (NOAA) – Climate Prediction Center – Click the pic to view at source[/caption]
 National Oceanic & Atmospheric Administration (NOAA) – Climate Prediction Center – Click the pic to view at source[/caption]
 National Oceanic & Atmospheric Administration (NOAA) – Climate Prediction Center – Click the pic to view at source[/caption]
 National Oceanic & Atmospheric Administration (NOAA) – Climate Prediction Center – Click the pic to view at source[/caption]
 National Oceanic & Atmospheric Administration (NOAA) – Climate Prediction Center – Click the pic to view at source[/caption]
 National Oceanic & Atmospheric Administration (NOAA) – Climate Prediction Center – Click the pic to view at source[/caption]
 National Oceanic & Atmospheric Administration (NOAA) – Climate Prediction Center – Click the pic to view at source[/caption]
 National Oceanic & Atmospheric Administration (NOAA) – Climate Prediction Center – Click the pic to view at source[/caption]
 National Oceanic & Atmospheric Administration (NOAA) – Climate Prediction Center – Click the pic to view at source[/caption]
 National Oceanic & Atmospheric Administration (NOAA) – Climate Prediction Center – Click the pic to view at source[/caption]
Hello Bob, I began compiling some references for a WUWT ENSO Forecast Reference Page, i.e.:
NOAA CPC offers Consolidated Nino 3.4 Forecasts, i.e.:
Anomaly:
[caption id="" align="alignnone" width="632"]
Standardized Anomaly:
[caption id="" align="alignnone" width="632"]
Temperature:
[caption id="" align="alignnone" width="632"]
Also, the NCEP coupled forecast system model version 2 (CFS2) offer an array of forecasts, also available on their ftp page.
Here are there most recent seasonal forecasts for Nino 1 + 2 SST Anomalies (E3);
[caption id="" align="alignnone" width="632"]
Nino 3 SST Anomalies (E3);
[caption id="" align="alignnone" width="632"]
Nino 3.4 SST Anomalies (E3);
[caption id="" align="alignnone" width="632"]
Nino 4 SST Anomalies (E3);
[caption id="" align="alignnone" width="632"]
It is also interesting to see the progression of the forecasts, i.e. “Forecasts are from initial conditions of the last 30 days, with 4 runs from each day. Forecast ensembles consist of 40 members from initial a period of 10 days. The 1st ensebmle (E1) is from the earliest 10 days, the 2nd ensemble (E2) from the second earliest 10 days, and 3rd ensemble (E3) from the latest 10 days.”
For Nino 3.4 SST Anomalies – E1
[caption id="" align="alignnone" width="632"]
For Nino 3.4 SST Anomalies – E2
[caption id="" align="alignnone" width="632"]
For Nino 3.4 SST Anomalies – E3
[caption id="" align="alignnone" width="632"]
It is interesting that one La Nina forecast appeared in the “3rd ensemble (E3) from the latest 10 days”.
Lastly, when you look at the last 40 Nino 3.4 SST Anomalies Forecast members;
[caption id="" align="alignnone" width="632"]
it all looks decidedly arbitrary. Based on your research, do you think we currently have any skill in forecasting ENSO? Is it even worth posting a WUWT ENSO Forecast Reference Page? If so, can you provide a warming label I can put at the top highlighting the limitations in our current forecasting capabilities?
Bob,
Do you have any insight as to why BOM and NOAA show such different values for the NINO3.4? For the last few weeks, the NOAA NINO3.4 has been hovering down around -0.7. It hasn’t gone any higher than -0.4. This is reflected here on WUWT on the ENSO meter widget.
Meanwhile, the Australian BOM NINO3.4 has not gone below -0.4. This is recorded on their graph on the WUWT ENSO page.
How is it that these two organizations are coming up with such different measures for the same parameter. One in firmly in La Nina territory, and the other is solidly (if on the lower side of) La Nada.
And given that they are so different on the inputs, how are they then coming up with a “similar mix of possible scenarios?
Also for reference, the Hansen et al., 2014 prediction:
“So what are the near-term prospects? El Niño depends on fickle wind anomalies for initiation, so predictions are inherently difficult, but conditions are ripe for El Niño initiation in 2014. About half of the climate models catalogued by the International Research Institute predict that the next El Ni ño will begin by summer 2014, with the other half predicting ENSO neutral conditions 21. The mean NCEP forecast 21 issued 13 January has an El Niño beginning in the summer of 2014, although a significant minority of the ensemble members predicts ENSO neutral conditions for 2014.
The strength of an El Niño, too, depends on the fickle wind anomalies at the time of initiation. We speculated 22 that the likelihood of “super El Niños, such as those in 1982 – 3 and 1997 – 8, has increased. Our rationale was that global warming increased SSTs in the Western Pacific, without yet having much 13 effect on the temperature of upwelling deep water in the Eastern Pacific (Fig. 2 above), thus allowing the possibility of a larger swing of Eastern Pacific temperature. Recent paleoclimate 23 and modeling 24 studies find evidence for an increased frequency of extreme El Niños with global warming.
Assuming that an El Niño begins in summer 2014, 2014 is likely to be warmer than 2013 and perhaps the warmest year in the instrumental record. However, given the lag between El Niño initiation and global temperature, 2015 is likely to have a temperature even higher than in 2014.”
DontGetOutMuch says:
February 15, 2014 at 5:53 am
A couple of thoughts.
1. Joe Bastardi I believe, is on record stating that an El Niño will occur beginning fall of 2014. He is about the only reliable source that is predicting an El Niño. I don’t know what Joe bases this on, I read it in a tweet, I do not subscribe to Weatherbell. I think Joe follows WUWT, maybe he’ll stop by. 😉
See http://www.weatherbell.com/saturday-summary-february-15-2014
This is a free video by WeatherBell’s Joe Bastardi.
I download it every Saturday from http://www.weatherbell.com
It all depends on ducks.
however
Better than a supercomputer.
“2014 maybe the hottest on record.” These record periods are ridiculousy short.What? About 120 years or so, nowhere near long enough to include the Medeival or Roman warm periods.
Bill Illis, thanks for the links to the GODAS profiles for Januaries 2012, 2013, and 2014. The subsurface anomalies in the western equatorial Pacific looked warmer in January 2012…
http://www.cpc.ncep.noaa.gov/products/GODAS/mnth_gif/xz/mnth.anom.xz.temp.0n.2012.01.gif
…than they do in January 2014:
http://www.cpc.ncep.noaa.gov/products/GODAS/mnth_gif/xz/mnth.anom.xz.temp.0n.2014.01.gif
We’ll just have to watch and see if history repeats itself.
Hansen et al., 2014 prediction:
“We speculated 22 that the likelihood of “super El Niños, such as those in 1982 – 3 and 1997 – 8, has increased. Our rationale was that global warming increased SSTs in the Western Pacific, without yet having much 13 effect on the temperature of upwelling deep water in the Eastern Pacific (Fig. 2 above), thus allowing the possibility of a larger swing of Eastern Pacific temperature. Recent paleoclimate 23 and modeling 24 studies find evidence for an increased frequency of extreme El Niños with global warming.”
No wonder Hansen was wrong about global warming having it backwards. The western Pacific SSTs increase due to trade winds moving the solar warmed water in that direction. An increased period of stronger El Ninos fueled by solar energy reaching the ocean surface cause global warming not the other way round.
Scientific evidence that backs this up is the long period with no warming and weaker El Ninos from after the peak up to late 1990s. Also the step up in global temperatures only after a strong El Nino. If global warming was causing stronger El Ninos then they would have continued since the last strong one back in 1997/98 and we wouldn’t have a step up after the ENSO event.. The ENSO is just behaving with the natural cycle of the PDO and has nothing to do with humans.
“cum hoc ergo propter hoc”
Close, Post hoc ergo propter hoc. Of course, a prime fallacy committed by the warmists all the time.
Here is the International Research Institute (IRI)/CPC Plume-Based Probabilistic ENSO Forecast; Columbia University – NOAA – IRI/CPC – Click the pic to view at source[/caption]
 Columbia University – NOAA – IRI/CPC – Click the pic to view at source[/caption]
[caption id="" align="alignnone" width="632"]
and here is a Plume of Model ENSO Predictions
[caption id="" align="alignnone" width="632"]
Here is the IRI Products Page and IRI Forecast Archive back to 2007.
Their latest, December 19th, ITechnical ENSO Update was:
“What is the outlook for the ENSO status going forward? The most recent official diagnosis and outlook was issued earlier this month in the NOAA/Climate Prediction Center ENSO Diagnostic Discussion, produced jointly by CPC and IRI; it called for a high likelihood of neutral ENSO conditions enduring through winter 2013-14 and into spring 2014, with probabilities of El Niño or La Niña each less than 30% until Apr-Jun 2014 when El Niño probabilities rise above that level but stay less than 50% through summer 2014. The latest set of model ENSO predictions, from mid-December, now available in the IRI/CPC ENSO prediction plume, is discussed below.”
“For the Mar-May 2014 season, among models that do use subsurface temperature information, 76% predicts ENSO-neutral SSTs, 24% predicts El Niño conditions and none predicts La Niña conditions. For all model types, the probability for neutral ENSO conditions is above 90% for Dec-Feb 2013-14 and Jan-Mar 2014, above 80% through Apr-Jun 2014, and 67%-73% for May-Jul through Aug-Oct 2014 at the end of the forecast period. Probabilities for El Niño are below 20% through Apr-Jun 2014, and rise to approxiately 30% from May-Jul through Aug-Oct. (Note 1). Caution is advised in interpreting the distribution of model predictions as the actual probabilities. At longer leads, the skill of the models degrades, and skill uncertainty must be convolved with the uncertainties from initial conditions and differing model physics, leading to more climatological probabilities in the long-lead ENSO Outlook than might be suggested by the suite of models. Furthermore, the expected skill of one model versus another has not been established using uniform validation procedures, which may cause a difference in the true probability distribution from that taken verbatim from the raw model predictions.
An alternative way to assess the probabilities of the three possible ENSO conditions is more quantitatively precise and less vulnerable to sampling errors than the categorical tallying method used above. This alternative method uses the mean of the predictions of all models on the plume, equally weighted, and constructs a standard error function centered on that mean. The standard error is Gaussian in shape, and has its width determined by an estimate of overall expected model skill for the season of the year and the lead time. Higher skill results in a relatively narrower error distribution, while low skill results in an error distribution with width approaching that of the historical observed distribution. This method shows probabilities for La Niña at 1% for Dec-Feb 2013-14, remaining at 10% or less through the end of the forecast period in Aug-Oct 2014. Model probabilities for ENSO-neutral conditions are more than 90% from Dec-Feb 2013-14 to Jan-Mar 2014, dropping steadily during northern spring 2014 to become slightly less than 50% from Jun-Aug through the end of the forecast period in Aug-Oct 2014. Probabilities for El Niño are below 10% from Dec-Feb 2013-14 to Feb-Apr 2014, thereafter steadily increasing to exceed 30% by May-Jul 2014 and to between 40% and 50% from Jun-Aug to Aug-Oct 2014 (maximizing at 45% for both Jul-Sep). It is clear that the models collectively favor neutral ENSO conditions into northern spring 2014; then by Jun-Aug El Niño probabilities become more competitive with ENSO-neutral probabilities, until they are approximately equally likely for Jul-Sep and Aug-Oct 2014. A plot of the probabilities generated from this most recent IRI/CPC ENSO prediction plume using the multi-model mean and the Gaussian standard error method summarizes the model consensus out to about 10 months into the future. The same cautions mentioned above for the distributional count of model predictions apply to this Gaussian standard error method of inferring probabilities, due to differing model biases and skills. In particular, this approach considers only the mean of the predictions, and not the total range across the models, nor the ensemble range within individual models.
The probabilities derived from the models on the IRI/CPC plume describe, on average, maintenance of neutral ENSO conditions into northern spring 2014. The possibility of El Niño development is seen starting Jun-Aug 2014, but the objective model-based probabilities for El Niño still remain below 50% for Jun-Aug through Aug-Oct 2014. A caution regarding this latest set of model-based ENSO plume predictions, is that factors such as known specific model biases and recent changes that the models may have missed will be taken into account in the next official outlook to be generated and issued in early October by CPC and IRI, which will include some human judgement in combination with the model guidance. “
Kenny says: “I’ve read the PDO effects or drives the AMO.”
The PDO is anti-correlated with the sea surface temperatures of the North Atlantic, so it would be difficult for the PDO to drive the AMO.
http://bobtisdale.files.wordpress.com/2014/02/pdo-anticorrelated-with-north-atlantic-sst.png
Also, the PDO doesn’t represent the sea surface temperature of the North Pacific. Maybe they were discussing the sea surface temperatures of the extratropical North Pacific, which do correlate with the sea surface temperatures of the North Atlantic:
http://bobtisdale.files.wordpress.com/2014/02/extratropical-no-pacific-correlation-with-norhern-hemisphere-sst.png
Kenny says: “I’ve also read in some blogs that the AMO may be going negative….and at an earlier time than predicted.”
The North Atlantic sea surface temperature anomalies have been flat for about a decade, so the AMO may have peaked.
http://bobtisdale.files.wordpress.com/2014/01/07-amo-may-have-peaked1.png
That graph is from the following post:
http://bobtisdale.wordpress.com/2014/01/17/comments-on-the-nature-article-climate-change-the-case-of-the-missing-heat/
But it’s difficult to say for sure if the sea surface temperatures of the North Atlantic have, in fact, peaked, since the AMO is such a long-term oscillation.
Kenny says: “Does this help drive Nino or Nina?”
There are some papers that try to link the variations in the sea surface temperatures of the North Atlantic to ENSO, but I haven’t found anything definite.
“In recent years this warm area has been reluctant to move where current anomalies on the other side are below normal.
Compared to December 2013 conditions this year have generally become cooler, especially between 150W and 90W.
http://www.cpc.ncep.noaa.gov/products/GODAS/mnth_gif/xz/mnth.anom.xz.temp.0n.2013.12.gif
For this reason I would favor La Nada continuing or La NIna than El Nino this year.”
———————————————————————————————————————-
Sorry, Just realized my mistake above.
http://www.cpc.ncep.noaa.gov/products/GODAS/mnth_gif/xz/mnth.anom.xz.temp.0n.2014.13.gif
The warm pool between 120E and 180 has been reluctant to transfer most/all of the energy into between 150W and 90W for resurfacing over very recent years. The warm pool is still expected to move towards here, so will be very unlikely an La NIna will occur later this year. The uncertainty is how much of the warm pools energy will surface by between summer and late Autumn. For the reason favoring La Nada instead of El Nino is down to conditions between 150W and 90W have become cooler this year and the warm pool is weak compared with many El Ninos developed in the past.
Greg says:
February 15, 2014 at 3:45 am
“A common tidal cause seems a lot more credible that some mysterious teleconnection that allows this tiny part of the Pacific to dictate global climate.
You seem to dismiss with “this tiny part of the Pacific ” and “mysterious teleconnection” everything known about ENSO. First, the tropical Pacific Ocean is the component of interest and it is a large percentage of Earth. The use of the word “tiny” is an attempt at misdirection. Second, what is “mysterious” about teleconnection? Search and read. As an analogy, think of a long garden hose – with pressure, water flows through and gushes out the far end. Shut the valve and that gushing at the end stops. This is not a difficult or mysterious concept.
When your material reachs the rigor of ENSO, your tidal explanation will be of great interest.
Just The Facts says:
February 15, 2014 at 10:59 am
The ENSO forecast from ECMWF and UKMO were very good for the last El NIno back in 2009/2010.
This year they are both forecasting La Nada.
Speaking of weather patterns. As most know we got plastered with snow on the east coast this week. I have mentioned several times at WUWT that the weather station near me 24 hours later reports temperatures 2 -4 °F higher than I actually saw during the day.
Well that B@$T@rd Jeff McMasters (Wunderground) is reporting the snow we got this week as Precipitation (P)!!! And yes there is a separate category for snow.
Please note I can WALK to the %$#@ weather station, it is THAT close to me:
“The official story” is
Tues; 11th -0.01 (P) 0.0 SNOW – Max 35 °F = Min= 29 °F
Wed; 12th -0.37 (P) 0.0 SNOW – Max = 31 °F Min= 24 °F
Thrus 13th -0.36 (P) 0.0 SNOW – Max = 34 °F Min= 30 °F
We had at least 6 inches and it certainly was not above freezing or even close to 32 °F on Wednesday. Heck we STILL have snow on the ground. I had to chop the ice, 2 inches thick out of my stock tanks on Wednesday and carried warm water to my animals to make sure they got at least one warm drink for the day.
So now we know how the US weather service deals with the temperature “adjustments”
They sweep the Snow under the rug!
Steve M. From TN says: “It appears to me that El Niño and La Niña are only weather related events.”
El Nino and La Nina events are the dominant mode of natural variability on Earth. They are monstrous in comparison to all other weather events. Sometimes it takes two tropical cyclones just to kick start an El Niño.
Steve M. From TN says: “As Bob says, ther were more El Niño events durning the warming.”
Actually, the document I linked showed that the warming of sea surface temperatures over the past 32 years was a response to a few strong El Nino events:
http://bobtisdale.files.wordpress.com/2013/01/the-manmade-global-warming-challenge.pdf
Steve M. From TN says: “I don’t think these are climatic variables, but rather are riding the wave of another pattern..perhaps the PDO.”
The PDO is an aftereffect of ENSO. For discussions of what the PDO is, and more important what it isn’t, see the posts here:
http://bobtisdale.wordpress.com/2011/06/30/yet-even-more-discussions-about-the-pacific-decadal-oscillation-pdo/
And here:
http://bobtisdale.wordpress.com/2010/09/14/an-inverse-relationship-between-the-pdo-and-north-pacific-sst-anomaly-residuals/
And here:
http://bobtisdale.wordpress.com/2010/09/03/an-introduction-to-enso-amo-and-pdo-part-3/
Also, I linked a correlation map above that showed the PDO was anti-correlated with the sea surface temperatures of the North Atlantic:
http://bobtisdale.files.wordpress.com/2014/02/pdo-anticorrelated-with-north-atlantic-sst.png
The PDO is also anti-correlated with Northern Hemisphere land surface air temperature anomalies:
http://bobtisdale.files.wordpress.com/2013/07/figure-92.png
So it would be difficult for a positive PDO to cause global warming when surface temperatures throughout the Northern Hemisphere cool when the PDO is positive.
MATT G said
Hansen et al., 2014 prediction:
“We speculated 22 that the likelihood of “super El Niños, such as those in 1982 – 3 and 1997 – 8, has increased.
I agree with you Matt. Another false warmist prediction by the Hansen et al . There is little credibilty left there anymore . Stong EL Ninos typically happen only once per decade during cool phase of the ocean cycles . It takes time and an active sun to build up sufficient heat for strong EL Ninos and with the Pacific SST flat and a declining sun , I don’t see a strong El Nino until 2017/2018 at the earliest.
Bob Tisdale says:
February 15, 2014 at 3:15 am
Oops. I also should have included a link to the following post for those new to El Niño and La Niña processes:
http://bobtisdale.wordpress.com/2014/01/10/an-illustrated-introduction-to-the-basic-processes-that-drive-el-nino-and-la-nina-events/
Thanks Bob!
I’m not a ‘newbie’ but I find a review of the basics are essential to help me understand the nuances of discussions that are outside my ‘wheelhouse’ of education and experience. I am not blessed with an eidetic memory. As a result, I appreciate these ‘backgrounder’ links very much!
I encourage others posting articles to include similar ‘backgrounder’ links. They help everyone understand and advance the discussion.
Mac
“DID GLOBAL WARMING CAUSE THE EL NIÑOS OR DID EL NIÑOS CAUSE GLOBAL WARMING?”
I select the third possibility.
Greg says: “That technique looks at ALL lags and analyses the frequency spectra. It may just be that your 2 month lag is not the right lag for those two oceans.”
Trenberth et al (2002) includes the correlations at a number of lags:
http://www.cgd.ucar.edu/cas/papers/2000JD000298.pdf
See their Figure 8 on page 18 of 22.
Or if you feel I’ve not provided the time lag you’re looking for, you should become familiar with the KNMI Climate Explorer:
http://climexp.knmi.nl/selectfield_obs.cgi?someone@somewhere
Regards
Gail Combs says:
February 15, 2014 at 11:18 am
This outrage is going on everywhere in the US, at least, but the media are not reporting it. Real science will never be able to un-mess-up temperature “data” (not readings). The baleful influence of CACA will haunt meteorology & climatology for all time.
Bob
I watch the data that Anthony provides from the ENSO/SST page almost daily. I also watch weather data and the Arctic/Antarctic ice levels. I also read your work. One thing that I have noticed is that the NOAA El-Nino/La-Nina predictions are useless. Any accurate prediction they make seems to be entirely random occurrences. These predictions are updated based on new data every few months and they erase the old predictions. For example, the prediction for this year’s El-Nino has been pushed forward by several months. Originally the temperatures were supposed to have started pushing positive at the first of January. The opposite occurred. Now they are pushing the prediction forward with the same slopes by a few months.
I have watched variations of this for years.
What I have been noticing from the satellite record is a cooling of the entire southern hemisphere brought on by the dramatically increased ice in the Antarctic. You can’t add millions of square kilometers of ice to the oceans and melt it every year without having some cooling effects of the southern ocean. This propagates toward the equator and you can see this in cool water upwelling in the Nino 3.4 region. This fantasy that the deep ocean is heating is just that, a fantasy.
Thus my prediction is for continuing cool conditions in the Nino 3.4 region until the Antarctic ice levels in the oceans abate…
Ian L. McQueen says: “…..Why does this site show its ENSO meter at about -0.7 into the Nina zone?”
The ENSO meter is based on weekly sea surface temperature anomalies for the NINO3.4 region. The WMO is likely basing their statement on monthly data which is still in ENSO neutral territory (though getting close to La Nina conditions):
http://bobtisdale.files.wordpress.com/2014/02/02-nino3-4-ssta.png
Bob:
Is it my imagination or does http://www.cpc.ncep.noaa.gov/products/CFSv2/imagesInd3/nino34Mon.gif
always seem to hunt upwards (and occasionally downwards) rather than settle on ‘La Nada’ for any given future?
Has anyone ever done a predictions/history for the NINO 3.4 SST Anomalies Forecast analysis?
Greg says:
February 15, 2014 at 3:45 am
“This is URL at the top of the plot but difficult to read. I’ve asked Richard to provide a link. ”
Sorry, I was mobile. (I have a life other than the Internet and trying to look at the world on a post it note attached to a drinking straw is something I do badly).
Feed “tides m2 k1 map picture” into Google and get as many as you wish.
http://lmgtfy.com/?q=tides+m2+k1+map+picture
Retired Engineer John says: “Can you have a cold La Nino caused by the introduction of cold water from the Humboldt Current or by cold water upwelling?”
Increased upwelling along the equatorial Pacific is a part of La Niña conditions so the answer to that portion of your question is yes, but….
Cold water from the Humboldt Current would impact the NINO1+2 region (10S-0, 90W-80W). Last year, NINO1+2 region sea surface temperature anomalies were very low for part of the year, reaching -2 deg C…
http://bobtisdale.files.wordpress.com/2014/01/17-weekly-nino12-ssta.png
…but a La Niña did not form.
asybot says: “I was under the impression that a number of data collection points were not functioning anymore or intermittent. If so is data then averaged between points? and how large are these gaps in the first place where can I go to find that information?Thanks.”
You are correct that a number of the TAO project buoys are off line. I’m not sure how NOAA would infill the missing data, but for some of the variables there are secondary sources.
The TAO project website is here:
http://www.pmel.noaa.gov/tao/index.shtml
But I believe it would be difficult to extract the info you’re looking for.
Bob:
As far as I am aware no-one has made any attempt to try and get a correlation between the Internal Tide (the most important vertical ocean mixing force we have) in the Pacific, ENSO and long term Lunar cycles.
http://www.whoi.edu/science/PO/turbulence/Research/images/internal_tides-LG.jpg
Of course there may well be no correlation at all. But if you can’t find a study that’s looked then how can you say it doesn’t exist?
Pippen, I think that it was previous strong La Nina’s that cause subsequent global warming when the trade winds shove all that previously deeply sun-warmed water around and cloudless days allows the sun to deeply warm the equatorial waters some more. If you then have a series of La Nina’s after an especially strong one, you would have a series of increasing steps up in temperature measured on land. When things return to El Nado/ La Nada territory, land temps will flatten and eventually fall, possibly faster than they rose.
El Niño and especially long ones, simply allows water to layer itself. Good thing because that warm water can be released, plus disallow the Sun to warm the tropical ocean much at all. Too many clouds.
@ Bob T., Thanks Just learning and I will start there.
Bob Tisdale: Numerous datasets indicate that El Niño events are fueled naturally. Additionally, satellite-era sea surface temperature records indicate that El Niño events are responsible for the warming of sea surface temperatures over the past 31 years, not vice versa
If it be true that “El Niño events are fueled naturally”, what is the “fuel”? If the fuel is the heat in the climate system, and if it is true that extra CO2 in the atmosphere results in extra heat in the climate system (“extra” meaning more than would be there without the CO2), then the extra CO2 is providing more fuel for the El Niño events. that makes the ENSO a cog or part of the mechanism by which CO2 warms the climate. What causes what can’t yet be determined, and a full causal analysis isn’t available.
Greg says: I know it’s not your own idea, there is a lot of discussion of El Nino being some kind of driver. I’ve said serveral times in the past that I think it’s common cause not , direct causation.
jlurtz: The El Niño/ La Nina events are controlled by the heat input and the amount of evaporation cooling. In addition, some of the cold upwelling in the Pacific is controlled by the amount of evaporation into the Hadley Cells.
Bob Tisdale: Also, the weather-related impacts of ENSO have been studied for decades. For an introduction, see the NOAA webpage here:
http://www.pmel.noaa.gov/tao/elnino/impacts.html
Sure, but what events “impact” ENSO?
The climate system is a high dimensional, non-linear dissipative system with non-constant input. Even simple non-linear dissipative systems with homogeneous 2-D surfaces and constant input have extremely complicated and non-intuitive behaviors, with traveling waves, fluctuating nearly standing waves, stationary and cyclonic waves, and more. A brief introduction stimulated by considerations of heat transfer is presented in the last chapters of “Modern Thermodynamics: From Heat Engines to Dissipative Structures” by Dilip Kondepudi and Ilya Prigogine. The coupling of the ENSO with the climate, and the appearance of identifiable “events” (El Niño/ La Nina) are incompletely known, with large gaps not small unknown details. With as many gaps in understanding as there are, and with many possibilities hardly explored at all, it is not possible to rule out the possibility that accumulated heat resulting from accumulated CO2 has been driving ENSO. All you can say with confidence is that some increases in measured heat come after El Niño. As everyone who ever quoted “post hoc, ergo propter hoc” ironically as a warning knows, simple time ordering is not sufficient to establish causation.
A very good overview of what is known about ENSO, with a theoretical analysis and integration, is provided by Henk Dijkstra in his book “Nonlinear Climate Dynamics”, Cambridge University Press, 2013, . On p. 168 one can read: “There is no clear-cut distinction between El Niños, La Ninas, and normal periods; rather, the system exhibits continuous fluctuations of varying strengths and durations with an average period of about 4 years (blue curve in Fib 8.2b.)” I think this book is a good companion to Bob Tisdale’s admirable “Who Turned on the Heat”.
Last El Nino of any note was fall 2009 into winter 2010.
At present watching the how this year’s BOM subsea is developing:-
http://www.bom.gov.au/cgi-bin/oceanography/wrap_ocean_analysis.pl?id=IDYOC007&year=2014&month=02
against how 2009 moved:-
http://www.bom.gov.au/cgi-bin/oceanography/wrap_ocean_analysis.pl?id=IDYOC007&year=2009&month=02
Lots of mixed signals at present, OLR, SOI, etc, time will tell.
Just The Facts says: “Based on your research, do you think we currently have any skill in forecasting ENSO? Is it even worth posting a WUWT ENSO Forecast Reference Page? If so, can you provide a warming label I can put at the top highlighting the limitations in our current forecasting capabilities?”
The problem with the models is that they really only become useful after the El Niño or La Niña event has started. Then, the models do a reasonably good job of predicting how they will develop.
A rewording of the WMO’s statement from the post might be useful for a warning. They wrote: “It must be noted that model outlooks that span March-May period tend to have particularly lower skill than those made at other times of year. Hence some caution should be exercised when using long range outlooks made at this time for the middle of the year and beyond.”
So, for the warning:
Model predictions of ENSO made before March-May have been shown to have very low skill. The low skill is caused by the Spring Prediction Barrier, which is discussed in the IRI webpage here:
http://iri.columbia.edu/climate/ENSO/background/prediction.html#barrier
PS: Thanks for putting together all of those predictions.
RichardLH says: “Has anyone ever done a predictions/history for the NINO 3.4 SST Anomalies Forecast analysis?”
I recall seeing one, but I have no idea when or where I saw it.
Matthew R Marler says: “If it be true that “El Niño events are fueled naturally”, what is the “fuel”?”
ENSO basics:
http://bobtisdale.wordpress.com/2014/01/10/an-illustrated-introduction-to-the-basic-processes-that-drive-el-nino-and-la-nina-events/
El Nino events are fueled by warm water created during La Nina events. The warm water is created during La Nina events by an increase in downward shortwave radiation, which is associated with a reduction of cloud cover, which, in turn, is associated with the stronger trade winds and less convection due to the cooler sea surface temperatures.
RichardLH says: February 15, 2014 at 12:02 pm National Oceanic & Atmospheric Administration (NOAA) – Climate Prediction Center – Click the pic to view at source – Click the pic to view at source[/caption]
 National Oceanic & Atmospheric Administration (NOAA) – Climate Prediction Center – Click the pic to view at source – Click the pic to view at source[/caption]
 National Oceanic & Atmospheric Administration (NOAA) – Climate Prediction Center – Click the pic to view at source – Click the pic to view at source[/caption]
 National Oceanic & Atmospheric Administration (NOAA) – Climate Prediction Center – Click the pic to view at source – Click the pic to view at source[/caption]
Has anyone ever done a predictions/history for the NINO 3.4 SST Anomalies Forecast analysis?
Here is NOAA’s Climate Prediction Center ICFS SST Hindcast Skill for Nino 3.4. This January Monthly;
[caption id="" align="alignnone" width="632"]
January Seasonal;
[caption id="" align="alignnone" width="632"]
February Monthly;
[caption id="" align="alignnone" width="632"]
February Seasonal:
[caption id="" align="alignnone" width="632"]
They are poor out past few months.
Bob Tisdale says:
February 15, 2014 at 12:55 pm
“RichardLH says: “Has anyone ever done a predictions/history for the NINO 3.4 SST Anomalies Forecast analysis?”
I recall seeing one, but I have no idea when or where I saw it.”
Do you know where (or if) it is possible to pick up previous forecasts?
My prediction, for what its worth, is that if it is a 2014 El Nino, ‘settled consensus science’ will claim carbon(sic) is to blame.
If it is a 2014 La Nina, ‘settled consensus science’ will claim it is the ‘warmest’ La Nina ever, there-by proving carbon(sic) is to blame.
https://skepticalscience.com/was-2012-hottest-la-nina-on-record.html
There is nothing carbon(sic) can’t do.
Mark McGuire says:
February 15, 2014 at 1:09 pm
“There is nothing carbon(sic) can’t do.”
Including drain my bank account. (But for some it has the opposite effect).
Just The Facts says:
February 15, 2014 at 1:04 pm
“Here is NOAA’s Climate Prediction Center ICFS SST Hindcast Skill for Nino 3.4. This January Monthly;”
Thanks.
“They are poor out past few months.”
I am not surprised. I find that when I look at them they seem to predict a leap to either high or low, sometimes as short as ‘tomorrow’!
Matthew think about it. The sun would be the fuel, and the clouds would be the gate. If clouds are present the gate is partially closed to varying degrees (El Niño). That means less sun available to be kicked back out of the oceans to be re-radiated as long wave. On the other hand, when clouds are gone and the gate wide open (La Nina) the air is dry. Any amount kicked back out would be low and in the presence of low water vapor content there would be less reradiated. CO 2 effects just cannot warm the oceans to a higher measurable amount.
Bob Tisdale: El Nino events are fueled by warm water created during La Nina events. The warm water is created during La Nina events by an increase in downward shortwave radiation, which is associated with a reduction of cloud cover, which, in turn, is associated with the stronger trade winds and less convection due to the cooler sea surface temperatures.
So if an increase in atmospheric CO2 concentration produces an increase in downward shortwave radiation, does that not create more fuel, e.g. warmer water?
I have conjectured on other occasions that increased downwelling IR mostly causes an increase in vaporization, hence perhaps an increase in cloud cover on cloudy days, especially earlier in the day. I don’t think the evidence exists to form an opinion one way or another, but the possibility that increased El Nino events have been caused by increased CO2 can be ruled out.
Thank you again for another good post.
I don’t have a prediction of my own. If an El Nino develops in late 2014, I sure hope that it brings rain. I live in California, and we have the driest conditions that have occurred for a long, long time.
Just The Facts says:
February 15, 2014 at 1:04 pm
That set of graphs does kinda beg the question though.
My memory of the occasional look I have taken at this graph
http://wattsupwiththat.com/reference-pages/climatic-phenomena-pages/enso/
is that the next days figures almost never seem to follow the dotted line. I have not been methodical enough to track it though. I suppose that collecting a image a day and turning it into a animated gif might prove interesting. 🙂
Just The Facts says:
February 15, 2014 at 1:04 pm
Sorry – this graph
http://www.cpc.ncep.noaa.gov/products/CFSv2/imagesInd3/nino34Mon.gif
Pamela Gray: Matthew think about it. The sun would be the fuel, and the clouds would be the gate. If clouds are present the gate is partially closed to varying degrees (El Niño). That means less sun available to be kicked back out of the oceans to be re-radiated as long wave. On the other hand, when clouds are gone and the gate wide open (La Nina) the air is dry. Any amount kicked back out would be low and in the presence of low water vapor content there would be less reradiated. CO 2 effects just cannot warm the oceans to a higher measurable amount.
see mine at February 15, 2014 at 1:29 pm
You take one side in a debate that I have been having. I think present evidence is inconclusive.
Also, my question is not: What does CO2 do? My question is: What are the effects of more CO2, starting with what we had in 1950; slight variation, put the start date at 1970; or for another variation, starting now? I don’t think the three variations have the same answer.
What is the difference between statistical models (use of analogue years) and climate models (use of dynamical calculations) in terms of prediction ability?
Matthew co2 can only produce long wave re-radiation which has very little power to penetrate beyond mm depth into the ocean skin and is likely evaporated off almost immediately, therefor cannot warm the surface to a depth that can increase El Niño SST measures.
Pamela Gray says:
February 15, 2014 at 1:40 pm
“What is the difference between statistical models (use of analogue years) and climate models (use of dynamical calculations) in terms of prediction ability?”
One works from the large down, the other the small up? (Actually a fairly course graduation of the small – a worst possible option IMHO).
Richard I know how they work. I was wondering what the data showed in terms of ability.
Bob Tisdale says: February 15, 2014 at 12:51 pm
So, for the warning:
Model predictions of ENSO made before March-May have been shown to have very low skill. The low skill is caused by the Spring Prediction Barrier, which is discussed in the IRI webpage here:
http://iri.columbia.edu/climate/ENSO/background/prediction.html#barrier
Thank you. Here’s the new WUWT ENSO Forecast reference page:
http://wattsupwiththat.com/reference-pages/climatic-phenomena-pages/enso/enso-forecast-page/
Please let me know if you have any suggested additions or improvements. Additionally, do you think we should have any forecasts on the main ENSO reference page (Currently we only have Nino 3.4 from CFS2);
http://wattsupwiththat.com/reference-pages/climatic-phenomena-pages/enso/
if so, which ones? I can add the Warning there as well.
The other issue is that all El Ninos are accompanied by a drop in temperatures in the western Pacific depths like in December 1997 and December 2009 here.
http://www.cpc.ncep.noaa.gov/products/GODAS/mnth_gif/xz/mnth.anom.xz.temp.0n.1997.12.gif
http://www.cpc.ncep.noaa.gov/products/GODAS/mnth_gif/xz/mnth.anom.xz.temp.0n.2009.12.gif
The data is very consistent with this over time (with the coolest part of this cycle lagging a month or so behind the ENSO).
http://s24.postimg.org/47l0b8xp1/ENSO_WPac_Temps.png
I think we are going to need to see cold water infiltrating downward at 120E-135E before any type of El Nino will develop. There is only warm water there right now so it hard to see where the source would come from.
Pamela Gray says:
February 15, 2014 at 2:05 pm
“Richard I know how they work. I was wondering what the data showed in terms of ability.”
For PDO
http://i29.photobucket.com/albums/c274/richardlinsleyhood/PDOLowpass_zpsa9b3df25.png
you tell me.
The ENSO models have been proven to have little to no skill. They have been predicting an El Nino for a while now but the Pacific waters fail to deliver. I have a feeling that the latest predictions will fail to verify also. Instead of getting warmer the Nino 3.4 area continues to be cool.
My prediction: continued ENSO Neutral conditions with the potential for a weak La Nina. I’ll be VERY surprised if an El Nino forms in 2014.
I think we’re due for an extended period of La Nada, like in the early 60s and late 70s, with the overall trend tending toward La Niña. I base this on AO, NAO and Antarctic Oscillation tending negative.
I find it touching…and rather hilarious this welter of predictions, prognoses, causes and effects. We are becoming more and more like the Warmists every day, we see one pattern (or in this case non-pattern) emerging over twenty or thirty years, and suddenly we are attributing to it all kinds of irrelevant significance.
Firstly, important as they are…the La Nina – El Nino phenomena are not ‘the drivers of global temperature’, they are and can only be one part of a global circulation pattern (because over some timescale, hot and cold water has to ‘come’ from somewhere and go somewhere else yea?)
So perhaps we should try to identify and refine our knowledge of other large circulation patterns, North Atlantic, Indian, Southern Oceans spring immediately to mind…and then we should bear in mind that the not only do the oceans shunt energy round the planet, the atmosphere picks up and transfers energy from the oceans carrying it for thousands of miles in a matter of hours thanks to the Jet stream, tropical thunderstorms etc.
And as for ‘predictions’ the ‘wankers’ at the Australian BOM leapt onto the El Nino bandwagon a year or so ago when it looked like it might swing that way…then went strangely silent when it swung back again.
On a slightly more serious note there may well be a rhythm to these events but for us to even try and guess at it with so little data over such a short timescale is nigh on pointless.
surface temperatures, with a 2-month lag:
ENSO Correlation
Thought I might get away with pasting the picture as I do text. Nope.
What is really interesting to me is that is just a classic picture of what I call the Nino phase of the PDO.
http://geosciencebigpicture.com/2014/01/24/a-new-feature-of-the-pacific-decadal-oscillation/pdo_warm_cool3/
Here is another picture from Wikipedia where they “detrended” the anomaly by dividing it by the global anomaly, yet it produces the same pattern even though in 2012 the “trend” was strongly to a nina phase of PDO.
http://wp.me/a1uHC3-fN
Why these two statistical machinations converge to this pattern is a puzzle.
I predict that for the next two decades ninos will be shorter and weaker because they will be aborted and miscarried by cold water from the Humboldt and California currents. I predict for three decades after that they will progressively gain in strength and duration as the lobe of water in the north Pacific changes from most often warm, as it currently is, to cold, as the two pictures show.
For the same reason arctic outbreaks tend to follow continents, they follow the tongue of cold water from Eurasia during the nino phase, causing the Aleutian low.
Bob, minor typo. You got the title of Ludescher et al. wrong, it should be “Very Early Warning of Next El Niño” not “Very Early Warming of Next El Niño”
charles nelson says:
February 15, 2014 at 2:43 pm
“On a slightly more serious note there may well be a rhythm to these events but for us to even try and guess at it with so little data over such a short timescale is nigh on pointless.”
I’ll give you good odds that this sort of quasi pendulum like behaviour will continue, at least into the near future.
http://i29.photobucket.com/albums/c274/richardlinsleyhood/PDOLowpass_zpsa9b3df25.png
Pamela Gray: Matthew co2 can only produce long wave re-radiation which has very little power to penetrate beyond mm depth into the ocean skin and is likely evaporated off almost immediately, therefor cannot warm the surface to a depth that can increase El Niño SST measures.
As I wrote, you state one side in a debate I am having. If you have evidence that the extra energy in a slight increase in downwelling LWIR is “likely evaporated off almost immediately”, I would like to see it. Also in dispute is whether the increased water vapor in the atmosphere is a net positive feedback or net negative feedback mechanism to CO2-induced atmospheric warming. If the net effect is an increase in the duration of daytime cloud cover in the summertime, then it is a net negative feedback.
Your phrase “very little power” is insufficiently precise. The effect of doubling of CO2 is predicted to be about a 0.7% – 1% increase in the baseline mean temperature of 288K. What you call “little power” might be enough to produce some of that warming.
@pokerguy-I did not misspeak. Post hoc ergo propter hoc is “after this, therefore because of this” whereas “cum hoc ergo propter hoc” means “with this, therefore because of this”
The claim of bogus ENSO effects is not even post hoc, it’s cum hoc..
Bob, excellent post. I like to add that in spanish, it is gramatically incorrect to say “La Niñas” or “El Niños”. In this case the correct form “Las Niñas” or “Los Niños” should not be used; it is better to stick to “El Niño events” or “La Niña events”.
@Henry, My motivation is that I believe between, some fundamental cloud/rain/water vapor mechanism, ENSO, aresols, and Solar variation the majority of climate variation is found. Not knowing how the clouds and water vapor work, nor where the aresols will end up at; I am looking at decreasing solar activity, in conjunction with a bunch of strong trade winds: a cooling atmosphere will kick those winds up more and cause a profound La Nina.
RE: Retired Engineer John says:
February 15, 2014 at 8:20 am
Thanks for pointing out that interesting gyre made of slightly less salty water. Salinity seems an important component to the mysterious dynamics that govern the ebb and flow of currents, though mostly you see it discussed in terms of arctic sea ice. At times I fear people may be over-focused on temperature.
I have always wondered if the up-welling might have a power most don’t see, coming from down deep. Most assume the cold water is dragged up by trade-winds blowing away from shore, (or the earth’s rotation.) Their focus is on the winds, the amount of cloud cover, and the warming and piling up of the surface waters, and the eventual back-wash when a counter-current exists.
I have never been able to find the slightest evidence of the cold depths being able to turn on and turn off a sort of nozzle of cold water, but for some reason I can’t keep from searching for signs. To imagine the thermohaline circulation is a semi-stagnant flow, without waves and swirls of its own, just goes against my intuition somehow.
http://www.climategeology.ethz.ch/publications/2013_Cobb_et_al.pdf
Taken together, the Line Islands fossil coral
data suggest that much of the observed differences
in ENSO variance over the past 7 ky reflect strong
internal variability. The fact that we detect no dis-
cernible influence of orbitally induced insola-
tion forcing on ENSO is noteworthy, given that
the effect of insolation forcing on global mon-
soon circulations is well documented (27,28).
Relatively robust 20th-century ENSO variability
may reflect a sensitivity to anthropogenic green-
house forcing, but definitive proof of such an
effect requires much longer data sets than are
currently available, given the large range of nat-
ural ENSO variability implied by the available
fossil coral data.
http://www.global-warming-and-the-climate.com/enso-and-tidal-forcing.htm
ENSO forecast based on tidal forcing with an Artificial Neural Network
Caleb says:
February 15, 2014 at 3:43 pm
“I have always wondered if the up-welling might have a power most don’t see, coming from down deep. Most assume the cold water is dragged up by trade-winds blowing away from shore, (or the earth’s rotation.) Their focus is on the winds, the amount of cloud cover, and the warming and piling up of the surface waters, and the eventual back-wash when a counter-current exists”
The tides move a lot more energy than people give them credit for. Internal Tides, not that trivial bouncing up and down you see at the surface.
http://s29.photobucket.com/user/richardlinsleyhood/media/TheInternalTideatHawaii_zps7c7d5dbf.png.html
And all completely out of sight as well.
Caleb says:
February 15, 2014 at 3:43 pm
I have always wondered if the up-welling might have a power most don’t see, coming from down deep.
==================
http://en.wikipedia.org/wiki/Internal_tide
It is now known that most of the internal tide energy generated at tall, steep midocean topography radiates away as large-scale internal waves. This radiated internal tide energy is one of the main sources of energy into the deep ocean, roughly half of the wind energy input . Wunsch and Ferrari (2004) “A number of lines of evidence, none complete, suggest that the oceanic general circulation, far from being a heat engine, is almost wholly governed by the forcing of the wind field and secondarily by deep water tides.”
Analysis shows tidal forcing is a major factor in ENSO forcing
http://wattsupwiththat.com/2013/01/20/analysis-shows-tidal-forcing-is-as-a-major-factor-in-enso-forcing/
This radiated internal tide energy is one of the main sources of energy into the deep ocean, roughly half of the wind energy input . Wunsch and Ferrari (2004)
==============
but, but, but, didn’t Trenberth say it was all due to the missing heat?
I would like to see what the albedo is doing now. It decreased until ~1997/1998 around the time of the Super El Niño and then started increasing again. The question of course is has it continued to increase and where has it increased.
WUWT had this graph HERE
Climate 4 You has a page on clouds and graphs up to 2009 for cloud cover showing a slight increase in cloud cover since ~2000. High level and middle level clouds have increased while low level clouds decreased. They also have a graph of tropical cloud cover and global air temperature and again it is the high level cloud cover that is increasing during this century.
(wwwDOT)climate4you.com/ClimateAndClouds.htm
Data from: isccp(DOT)giss.nasa.gov/products/onlineData.html
(GISS has not up dated since 2009.)
The other more recent graph I found is HERE which looks like a reanalysis of the first graph with perhaps another year of data. They really changed the shape.
From a draft of the paper: Inter-annual variations in Earth’s reflectance 1999-2007.
Also of interest: (wwwDOT)spacearchive.info/news-2004-05-27-cit.htm
If the same pattern has continued, increasing or level cloud cover especially in the tropics, I doubt we will get much of an El Niño if we get one at all but think we are looking at La Nada. There is just not enough energy going into the oceans.
Tisdale says, “As a number of recent papers have argued, the dominance of La Niña events in recent years is responsible for part of the cessation in global surface warming outside of the Arctic, so by inference, those papers are also stating that a string of strong El Niño events were responsible for part of the long-term warming from the mid-1970s to the turn of the century.”
But, of course they are not saying that, that is your inference not theirs.
A more plausible way to look at it is that during La Niña the delta T from air to water is high, and more energy than normal ends up going into the water, warming the water in the Pacific and then that warmer water wanders into the Indian Ocean and elsewhere. During El Niño conditions, the delta is small and less energy ends up going into the water and ends up remaining in the air. In either case, the warming is the same; the only thing that is different is where the energy ends up going. In the end, the amount of energy in the system increases.
As the tide comes in, waves make the water surface momentarily higher and momentarily lower. So it is with ENSO.
Matthew R Marler says: @ February 15, 2014 at 12:49 pm
…If it be true that “El Niño events are fueled naturally”, what is the “fuel”? If the fuel is the heat in the climate system, and if it is true that extra CO2 in the atmosphere results in extra heat in the climate system…
>>>>>>>>>>>>>>>>>>>
The energy for the climate system comes from the sun. Clouds modify how much energy enters the surface, especially the oceans.
CO2 has nothing to do with it. GRAPH: Solar radiation at various Ocean Depths note on graph:
“What’s your prediction?”
We’re doomed.
ferdberple says:
February 15, 2014 at 4:13 pm
“but, but, but, didn’t Trenberth say it was all due to the missing heat?”
Nah. It’s bouncing up and down on the trampoline around Hawaii.
http://s29.photobucket.com/user/richardlinsleyhood/media/TheInternalTideatHawaii_zps7c7d5dbf.png.html
On holiday.
I think there will be an El Nino, by the way. One reason is that I believe the kind of winter we’ve just had (in the US) is a “precursor” to El Ninos, generally.
Another potential precursor: precipitation in the part of Florida I happen to live in!
I’ve noticed that we get the wetter or drier conditions typically associated with El Nino or La Nina here, sometimes before the event is declared. Well, so far we’ve had what seems like a lot of rain for the dry season.
Up here in Northern California, in Anthony and my neighborhood, La Niña conditions should persist through the winter of 2015. I have seen over the last 25 years that our drought/precipitation levels follow the drought/precipitation levels of southern California by one year, and the southern part of our state is currently receiving below normal levels of precipitation.
It should be noted that the 1998 ElNino caused a step of about 0.3C after it settled down. Start of 2000)
It should then be noted that the smaller 2010 ElNino did not cause any step up in the global temperature at all.
Bloke down the pub says:
February 15, 2014 at 3:42 am
Surely, the longer the gap between El Niños , the higher the likelihood that one will come along?
>>>
Careful, pretty sure this is not working for Messiahs so may not hold for a “Christ child” either. ;-D
Matthew R Marler says:
February 15, 2014 at 2:54 pm
….Your phrase “very little power” is insufficiently precise. The effect of doubling of CO2 is predicted to be about a 0.7% – 1% increase in the baseline mean temperature of 288K. What you call “little power” might be enough to produce some of that warming.
>>>>>>>>>>>>>>>>>>>>>
No it WAS PROJECTED and that PROJECTION has failed for the last 17 years.
Heck the IPCC even knew their ‘predictions’ were utter crap a decade ago, which is why they changed from ‘predictions’ to using PROJECTIONs and from Global Warming to Climate Change.
The IPCC actually said in the Science Report in TAR:
Well whichever way it goes the numbers are showing warming:
Arctic sea ice area now record low for date and ice extent outside 2 SDs.
NASA GISS January 2014 +0.72 cf 1951-1980 and thats after a warm December and a record warm November.
So no sign of the much wished for global cooling there – and solar activity has picked up so no hoped for solar induced Little Ice Age either on the horizon.
The only significance I see in these odd terms is that boys are hot and girls throw cold water on them.
Caleb says:February 15, 2014 at 3:43 pm
When ice forms deep in the Ocean, it forms frazil ice flows. These flows rise to the surface and bring other water with them. I went looking for an article that I had read on these flows, I didn’t find that one , but here is another article.
Frazil ice formation in an ice shelf water plume Smedsrud, Lars H.; Jenkins, Adrian. 2004 Frazil ice formation in an ice shelf water plume. Journal of Geophysical Research, 109 (C3), C03025. 15, pp. 10.1029/2003JC001851 Full text not available from this repository.Official URL: http://www.agu.org/journals/jc/jc0403/2003JC001851…[1] We present a model for the growth of frazil ice crystals and their accumulation as marine ice at the base of Antarctic ice shelves. The model describes the flow of buoyant water upward along the ice shelf base and includes the differential growth of a range of crystal sizes. Frazil ice formation starts when the rising plume becomes supercooled.
The Ocean, even in the tropics is near freezing, 3-4 C, and it doesn’t take much additional heat removal to get it to freeze. There are several possible ways this heat could be removed including chemical reactions such the hydration of calcium carbonate, super cooled water flows in the deep ocean, etc. As I noted, a test would be an analysis of the upwelling water for formic acid, a strong string acid that is formed by carbon dioxide and water in the presence of ice.
Caleb says: @ February 15, 2014 at 3:43 pm
….I have never been able to find the slightest evidence of the cold depths being able to turn on and turn off a sort of nozzle of cold water, but for some reason I can’t keep from searching for signs. To imagine the thermohaline circulation is a semi-stagnant flow, without waves and swirls of its own, just goes against my intuition somehow.
>>>>>>>>>>>>>>>>>
That is why I have been looking at Drake Passage and the strength of the wind driving the Antarctic Circumpolar Current. If you follow the cold water south along the coast of South America you end up at Drake Passage.
If you look at this Sea Surface Temperature map it has a good image of the tongue of cold water from the Antarctic Circumpolar Current just before Drake Passage, headed up the coast of South America to Galapagos.
The Antarctic Circumpolar Current is also called the West Wind Drift because it is wind driven.
A possible reason reason for changes in the wind.
And since someone was asking about differences in salt content:
A salinity map: http://www7320.nrlssc.navy.mil/GLBhycom1-12/navo/globalsssnowcast.gif
New Source Found For Cold, Deep Antarctic Currents
http://www.livescience.com/27390-antarctic-bottom-water-current-found.html
Pippen Kool and James Abbot remind me of that Japanese Soldier Hiroo Onada who spent twenty five years hiding on an island still convinced that WW2 was still ongoing.
Guys…the war’s nearly over…and you’ve lost.
Nature, the UK Met Office and many many other reputable scientific sources are openly discussing the ‘Pause’ in Global Temperatures…do you think you know better than the experts?
If so could you please provide links or sources so that we can check your assertion that we are in fact doomed?
…fine, I’ll be the one to address the troll…
James Abbott says:
February 15, 2014 at 4:47 pm
“Arctic sea ice area now record low for date and ice extent outside 2 SDs.”
What the IPCC says: “Arctic temperature anomalies in the 1930s were apparently as large as those in the 1990s and 2000s. There is still considerable discussion of the ultimate causes of the warm temperature anomalies that occurred in the Arctic in the 1920s and 1930s.” (AR5 Chapter 10)
You seem to be using a naturally recurring cycle as evidence of your supposed man-caused catastrophe.
Beyond that, we pretty much have no idea what the Ice Levels were doing at the time, we did not have the ability to monitor them. (and all your “lowest levels recorded” stuff dates back to the late 70s, at their “highest recorded levels”) We do have this though
“It is very likely that the mean rate of global averaged sea level rise was 1.7 [1.5 to 1.9] mm yr between 1901 and 2010, 2.0 [1.7 to 2.3] mm yr between 1971 and 2010 and 3.2 [2.8 to 3.6] mm yr between 1993 and 2010. It is likely that similarly high rates occurred between 1920 and 1950.” (AR5 SPM)
the IPCC seems to feel comfortable in saying the same exact events seen today were seen at the same levels circa 1930, when Nature was 100% in control. Now they claim Man is 100% in control though, and clearly the same exact results being repeated are proof positive Nature has no control this time around…
“NASA GISS January 2014 +0.72 cf 1951-1980 and thats after a warm December and a record warm November.”
And we are still not back to MWP temperatures basically anywhere on the globe
http://www.co2science.org/data/mwp/mwpp.php
So much for “Catastrophic” Warming – this warming hasn’t even gotten us back to a more normal level for the past 10,000 years.
So no sign of the much wished for global cooling there – and solar activity has picked up so no hoped for solar induced Little Ice Age either on the horizon.”
No one is wishing for Global Cooling, In fact, Global Cooling is much, much, much more of a threat to mankind then Warming ever is, was or will be. Warming (and Co2) is good for everything involved!!! Look at the chaos caused by a slight cooling in the 1970s – Governments everywhere were panicking at the failed crop productions and seemingly endless deaths at the hands of cold air and weather events.
To your first line though, remember the same can be said in reverse – absolutely no sign of the Alarmists much wished for (and hilariously mis-predicted) Global Warming anywhere to be found. And that is a much bigger issue. See, your side was already off on their predictions by about 0.4-0.5 Degrees to date; meaning roughly 40% of all of their Man Made Global Warming is missing at this point in time, most of that taking place prior to the PDO flip. Now they are looking at roughly 30 years of La Nina conditions on top of that pitiful failure, and little chance their credibility survives. (hence, it is no longer about “warming” at all anymore; now it is absolutely any and every weather event that takes place that is somehow the cause of CO2. And that is regardless if they predicted the exact opposite merely a few years prior.)
Gail Combs: No it WAS PROJECTED and that PROJECTION has failed for the last 17 years.
I did note that the expected result of adding CO2 would not necessarily be independent of the climate at the time the CO2 was added. I grant you that all of the GCMs have been inaccurate to this point. So the GCMs are wrong. But I wasn’t writing about GCMs. I addressed the general point that dynamical systems theory is full of examples (computational and experimental) where a steady input does not produce anything resembling a steady output, but rather all sorts of waves of diverse types and periodicities and quasi-periodicities. I don’t “believe” that increased CO2 up to 1998 is what produced the large el Nino of 1998, but I also don’t believe that we have sufficient knowledge (e.g. a really accurate well-tested model) to rule it out.
Pippen Kool says: @ February 15, 2014 at 4:29 pm
…A more plausible way to look at it is that during La Niña the delta T from air to water is high, and more energy than normal ends up going into the water, warming the water in the Pacific and then that warmer water wanders into the Indian Ocean and elsewhere. During El Niño conditions, the delta is small and less energy ends up going into the water and ends up remaining in the air.
>>>>>>>>>>>>>>>>>>>>
No it is not at all plausible. You have it backwards. The ocean warm the air.
For dry air the Specific Heat capacity
@ 20°C it is 1.005 kJ/kg.K
Thermal conductivity is 0.0257 W/m.K (Air is an insulator)
……
Specific heat water = 4.187 kJ/kgK
@ 20°C Thermal Conductivity is 0.598 W/m.K (Water is a good conductor)
Anyone who has been outside in cold weather and gotten sopping wet will tell you this through chattering teeth. First lesson in outdoorsmanship: Wool retains 80% of its insulating value while down turns into a wet, cold soggy mess.
This is what warms the oceans
RE: RichardLH says:
February 15, 2014 at 3:52 pm
RE: ferdberple says:
February 15, 2014 at 4:02 pm
Thanks, fellows. Light bulbs are going off in my head.
Caleb says:
February 15, 2014 at 5:56 pm
“Thanks, fellows. Light bulbs are going off in my head.”
This is one of the ‘out of sight – out of mind’ areas of the planet that moves vast amounts of energy from hot to cold, is subject to long and short term variations, and is almost never discussed except to say that the surface tides are small and therefore tides cannot possibly drive the climate.
Remember that Thermohaline Current stuff? Where does all that warm water flow North though? A tiny gap between the Faros and Scotland over a ridge right in some of the largest tidal ranges on the planet!
http://i29.photobucket.com/albums/c274/richardlinsleyhood/M2_tidal_constituent_zps8ce22394.png
Now that is not ENSO but it is climate.
James Abbott says:
February 15, 2014 at 4:47 pm
Well whichever way it goes the numbers are showing warming…
>>>>>>>>>>>>>>>>>>
The numbers are showing LYING see my COMMENT!
If they can’t even see 6 inches of snow and report it correctly I am not about to believe a darn thing that comes out of GISS. Their lying just caught up with them!
Gail Combs says:
February 15, 2014 at 6:10 pm
“If they can’t even see 6 inches of snow and report it correctly I am not about to believe a darn thing that comes out of GISS”
Well if they are this far apart from HadCrut from 1890 to 1970 but then agree pretty well from then on there is indeed something strange going on.
http://i29.photobucket.com/albums/c274/richardlinsleyhood/Fig8HadCrutGISSRSSandUAHGlobalAnnualAnomalies-Aligned1979-2013withGaussianlowpassandSavitzky-Golay15yearfilters_zps670ad950.png
(Other than that, I don’t make predictions.) j- Bob T
You are wise Bob, very wise and quite the wise-ass! I was reading the opening and thinking “wow, Bob’s going to make a prediction! This will be good.”. You got me hook, line and sinker 🙁
I personally am predicting neutral conditions throughout 2014 because I’m not as wise as you.
Cheers
RichardLH says:
February 15, 2014 at 6:04 pm
….This is one of the ‘out of sight – out of mind’ areas of the planet that moves vast amounts of energy from hot to cold, is subject to long and short term variations, and is almost never discussed except to say that the surface tides are small and therefore tides cannot possibly drive the climate….
>>>>>>>>>>>>>>>>
Only by people who have never been caught in an under tow.
You might be interested in this article, speaking of ‘out of sight – out of mind’ ‘Lunar lunacy’ areas
Interesting that a couple Universities did validation studies.
Here is one of the studies: Lunar correlated variations in water uptake and germination in 3 species of seeds
More on various studies here
Matthew Marler:
We do not have DATA to rule it out, but that just puts us back in the normal human condition where all the important decisions in our lives are made with insufficient data. We are left with a few disjointed smatterings of equivocal data, logic, and thought experiments.
So we look at the Shen index for the PDO based on rainfall in China. We don’t know if those guys measured it right, but it is all we have. We look at the MacDonald-Case index based on tree rings. We don’t know what tree rings are measuring. We compare. The two indices spend a lot of the time antiphase, but the tree rings in particular are pretty clear that there were lots of Niño’s during the Medieval Warm Period.
Thought experiment: we have several lines of evidence that it was a bit warmer than now during the MWP. What reason have we to suspect the 1997 Nino was caused by CO2?
It’s interesting that the people who are attempting to scare everyone about the dire consequences of a warmer earth are the very same ones who want it to happen. That makes me wonder … maybe they’re all on some other planet?
DS says: “What the IPCC says: “Arctic temperature anomalies in the 1930s were apparently as large as those in the 1990s and 2000s. There is still considerable discussion of the ultimate causes of the warm temperature anomalies that occurred in the Arctic in the 1920s and 1930s.” (AR5 Chapter 10)”
But was Abbot talking about temps? No. He was talking about ice. And in the 30s, ice in the arctic was huge. Look at the pict here:
http://neven1.typepad.com/blog/2012/08/similar-melts-from-1938-43.html
It looks like something more from the seventies than nowadays.
Of course you know that the allies and axis powers were secretly using the NW passage for secret attacks….? Oh, no, that never happened, did it?
I think a few years of warm temps are not enuf to affect the ice that much. You need a few decades…and we have had them now.
RichardLH says: @ February 15, 2014 at 6:20 pm
We know they have cooled the past and warmed the present to get rid of the high temperatures in the 1930-1940s.
NOAA’s adjustments to USA January temperatures are about 2-3 (degrees F) This is why my high temperature just below freezing became a temperature above freezing and therefore the snow had to be ‘Dissappeared’
GRAPH of adjustments from Steve Goddard which agree with my observation that local temperatures (rural) are adjusted up 2-4F 24 hours later.
Darn my link did not work GRAPH of adjustments
My prediction is continued ENSO neutral with a weal La Nina or weak El Nino possible. Any El Nino condition would be very weak because if you look at the western Pacific warm pool, it is cool. The entire pool has a cool surface anomaly. There is no pool of warm water to slosh back across the equatorial region. I see nothing so far to indicate anything but a continued La Nada.
“German scientists believe that there is a 75% chance of an El Nino. They state that 2014 could be the hottest on record.”
You have to watch the pea. That could happen in the next couple of years, and the models still deviate further from observed values.
An El Nino doesn’t necessarily bring warming. Warming isn’t necessarily rapid.
@ Caleb
“Thanks, fellows. Light bulbs are going off in my head.”
Your brain is shutting down?
Gail Combs says:
February 15, 2014 at 6:47 pm
You might be interested in this article, speaking of ‘out of sight – out of mind’ ‘Lunar lunacy’ areas
=============
truth is indeed stranger than fiction.
RoHa says:
February 15, 2014 at 8:37 pm
Your brain is shutting down?
=========
wrong location. go to Real Climate for that.
Pippen Kool says:
February 15, 2014 at 6:56 pm
“But was Abbot talking about temps? No. He was talking about ice. And in the 30s, ice in the arctic was huge. Look at the pict here:”
Like I said, we didn’t have satellite images from the time. You have an old drawn map and just act as though there wasn’t extreme melting. We know there was,
http://mclean.ch/climate/Arctic_1920_40.htm
We just don’t know how extreme. Of course, if you base it off the Sea Level rise I provided…
Plus, you oddly use a link to a 2012 photo against that map as your proof. Why not use the most recent August? You know, August 2013…
http://en.es-static.us/upl/2013/12/arctic-sea-ice-2012-vs-2013.jpg
That is your Aug12 & Aug13, with Aug13 looking a whole heck of a lot more like your Map.
But that is all besides the point; the same amount of ice melt shouldn’t be expected for one huge reason…
“I think a few years of warm temps are not enuf to affect the ice that much. You need a few decades…and we have had them now.”
The Arctic didn’t really start coming out of the LIA until the late1800s/early1900s. The 1920s-1940s marked by far the quickest and highest temperature rises out of said LIA. And we’re talking +2 degrees, over only a very low and slow rise prior. When that temperature spike hit, they were sitting at Ice Levels which had been building up for the past roughly 800 years of extreme colds. Of course that is going to melt at a different rate than the melting of that periods leftovers and whatever built up in the cold of the 60s-70s. That is a given! And wouldn’t you consider that a bigger influence on the amount of melt than your (incorrect) “need a few decades” line?
As I initially stated, attempting to measure Ice is impossible and would be meaningless anyway because of the drastic difference in the situations. In the end, all that really matters with regards to the Arctic and “Global Warming” is this:
“The Arctic 1920–40 warming is one of the most puzzling climate anomalies of the twentieth century. Over some 15 yr the Arctic warmed by 1.78C and remained warm for more than a decade. This is a warming in the region comparable in magnitude to what is to be expected as a consequence of anthropogenic climate change in the next several decades. A gradual cooling commenced in the late 1940s bringing the temperature back to much lower values, although not as cold as before the warming started.”
http://www.nerc-essc.ac.uk/~olb/PAPERS/len19.pdf
You have multiple decades of completely Natural Warming comparable to what has been experienced/is expected of “Man Made Global Warming”. One of those two periods, we are somehow told, could absolutely only be caused by man… A preschooler could tell you that is a nonsensical stance.
For all absolutely anyone knows, recent Arctic Warming (which didn’t really start until the 1990s) is 100% Natural following the same pattern of the 1930s.
By the way, here are the actual temperatures where you can see the periods in question for yourself
http://earthobservatory.nasa.gov/Features/ArcticIce/Images/arctic_temp_trends_rt.gif
Entering my two cents.
The phase will be la~nada to la~ninia.
My reasoning is Antarctic albedo, deep water cold returns which are cooling some of the input to the warm pool and solar blocking of equatorial waters (equatorial cloud cover). I simply do not see the warm pool recharging enough to cause a deep El~Nino.
As the winds and flows shift I do not think it will be enough to cause any major uptick in anything at this point. Even the Arctic Deep Water Cold Return is showing its cold side in Europe right now. There simply isn’t enough warm water to create a deep El~Nino
Thanks Bob for the post.
I would like to see an El Nino, but doubt it can happen to any reasonable degree for reasons Bill Illis has covered. Reason being that I would like to see El Nino is it will precede another very strong 2 year La Nina.
As it stands I think it will happen anyway, in 2015 – 2017. The degree of how strong the La Nina will be will depend on this years El Nino development IMO. Again, as others have said, this warm pool will peter out as it surfaces unless we see a big westerly wind burst. SOI has now gone negative which usually precedes a WWB. So we will get the warm water moving East, but very unlikely it can amount to an El Nino of any significance.
Also, this year is almost a repeat of 2009 here. In 2009 in Australia, we have record heat in Jan/Feb, which bought on the Black Saturday bushfire tragedy, then a scorching early Spring. Then, humidity increased in November and we were deluged, rain was consistent for the summer months with big storms all summer, despite the El Nino peaking in Jan 2010. Was very odd summer, this summer here has been much more El Nino like for most of the Eastern half of the country. Then in autumn 2010 we were greeted with ridiculous humidity, the worst I have experience in my 40 years.
And we all know what happened next, we were torn a new one for the next 30 months.
So far at this early stage I see a carbon copy, but as the months go on im looking for an increase in humidity to see if it turns out the same.
A weak La Nina . It’s the sun, even thou climate scientists don’t see the full mechanism yet, and the very active typhoon season of this past took a huge chunk of energy out of the tropical W. Pacific.
Ive been saying for 6 months that there will be a La Nina early this year, which is now happening.
There will be no el Nino.
–Is the Equatorial Pacific Ocean Entering a Cooldown Phase? —
I am a pure weather amateur, an agricultural commodities analyst wading into deep meteorlogy, but here in Southeast Asia, I can’t help but notice one anomalous piece of weather behavior, and a possible answer.
For the last six weeks, we have had a fairly serious drought over Singapore and Malaysia, which usually occurs during El Nino events…BUT at this time, unlike the last few occasions, there is no El Nino event to explain the drought. Instead, the Nino 3.4 SST anomaly is negative, around -0.35. That is near the -0.5 borderline between normal and La Nina conditions, which usually make Southeast Asia cloudy and rainy, not dry as it is at this time.
But I also noticed that from December to January, the SST anomaly both in the Nino 4 region (nearest Southeast Asia) and Nino 3.4 region each fell in temperature by 0.3C degrees each.
Is it possible that on one hand
– we are seeing no El Nino because the east equatorial Pacific is staying cool as one would expect in neutral or La Nina phases
– at the same time, the west equatorial Pacific is also cooling off, resulting in less Southeast Asian rainfall
Conclusion – the El Nino forms when Southeast Asia’s water’s cool off and east Pacific equatorial waters warm up.
This time, could both Southeast Asia and equatorial east Pacific waters be cooling off at the same time, which would
1) Explain Southeast Asia’s nasty drought happening without the usual accompanying El Nino event
2) Imply that rather than one end of the Pacific warming up/cooling off relative to the other, the entire equatorial Pacific is cooling off, which would make simultaneous arid conditions in Southeast Asia and Latin America possible?
This is not my usual field of expertise, so I hope I am not too vague in what I’m trying to express.
With my Artificial Neural Network (ANN) where I have applied feedback on ENSO forcing and on ENSO forecast I expect that ENSO is going to be in La Niña conditions at the end of this year.
My result show that ENSO is mainly driven by a combination of tidal and magnetic forcing.
http://www.global-warming-and-the-climate.com/enso-and-tidal-forcing.htm
Because there hasn’t been an El Niño since 2010 many forecasters expect ENSO to be in El Niño position at the end of this year.
Well, I expect them to be wrong on this specific forecast, as my result indicate that ENSO is going to be in La Niña or possible in neutral positions at the end of this year.
But, I think it is going most likely to be a La Niña.
@eric j brooks
well put your prediction and mine
http://wattsupwiththat.com/2014/02/15/el-nino-or-la-nada-for-the-201415-enso-season/#comment-1568484
together
and what do we see?
it is lalala….
going to get cooler
yes sir
global cooling is here to stay
which means the jets stay further south (hence the flooding of England)
and it is going to get drier at the higher latitudes…..
http://blogs.24.com/henryp/2013/04/29/the-climate-is-changing/
sorry
I made a mistake there
I meant to address my comment to
Per Strandberg
but it does not matter
Eric is also my man if he with me on La Nina by the end of 2014?
gymnosperm: Matthew Marler:
We do not have DATA to rule it out, but that just puts us back in the normal human condition where all the important decisions in our lives are made with insufficient data. We are left with a few disjointed smatterings of equivocal data, logic, and thought experiments.
One of the things we don’t know is whether the Earth is warmer now than it would have been without the CO2 that has accumulated since about 1850. We do not have detailed information on the natural variability absent that increased CO2; we have a perfectly reasonable, yet incomplete and inaccurate, prima facie case that increased CO2 should lead to increased heat accumulation somewhere in the system.
Was the increase in global mean temp from about 1975 to about 1995 greater than it would have been without CO2? I doubt it, but why would anyone claim certainty one way or another? did the Warming from ’75 to ’95 contribute to the unusually large el Nino of 1997-1998? I don’t know the answer to that either, but if global heat is the fuel of el Nino, then maybe it did. Is there a causal chain between increased CO2 of the post WWII era, the warming of ’75-’95, and the unusually large el Nino that followed? I think that the bulk of the evidence and dynamical modeling theory and experience that I have referred to above gives the answer “maybe”.
I have argued elsewhere that increased CO2 in the atmosphere might produce increased evaporation of water from the non-dry parts of the Earth surface with little or no increase in surface temperature in those areas, analogous to the reasoning of Gail Combs above. that might produce increased cloud cover and decreased net surface insolation.
Pippen Kool says:
February 15, 2014 at 6:56 pm
“But was Abbot talking about temps? No.
All instrumental data available around the Arctic show very little difference in temperature between 1930s/1940s and recently.
“The period from 1928–1935 also had a dipole structure in SLP, which contributed to the interdecadal arctic-wide warm temperature anomalies in the first half of the 20th century.”
http://onlinelibrary.wiley.com/doi/10.1029/2005GL024254/abstract;jsessionid=01914DC09BB59D049E9750B4AC0849DC.f04t01?deniedAccessCustomisedMessage=&userIsAuthenticated=false
“The European Arctic experienced a pronounced warming around 1920 and a sustained warm period in the 1920s and 1930s. The causes of this climatic event are not fully known. However, understanding this event is considered important for assessing current and future climate change in the Arctic. ”
“The strongest warming at the ground from the 1910s to the 1920s and 1930s was found in wintertime.”
http://www.ingentaconnect.com/content/schweiz/mz/2009/00000018/00000004/art00006
DMI in the Arctic above 80N+ also shows the strongest warming to be in wintertime.
“The annual temperature has increased in Svalbard and Jan Mayen during the latest decades, but the present level is still lower than in the 1930s.”
http://onlinelibrary.wiley.com/doi/10.1111/j.1751-8369.2003.tb00102.x/abstract
“During the 1920s and 1930s, there was a dramatic warming of the northern North Atlantic Ocean. Warmer-than-normal sea temperatures, reduced sea ice conditions and enhanced Atlantic inflow in northern regions continued through to the 1950s and 1960s, with the timing of the decline to colder temperatures varying with location.”
“The warming in the 1920s and 1930s is considered to constitute the most significant regime shift experienced in the North Atlantic in the 20th century.”
http://www.sciencedirect.com/science/article/pii/S0079661106000036
The North Atlantic ocean flows up towards the Arctic ocean where it sinks and therefore any sudden change here will have pronounced knock on effects there.
Therefore you need to explain how that map could be possibly correct with very limited Arctic ice data available then, when there is evidence to the contrary.
RichardLH says: “Do you know where (or if) it is possible to pick up previous forecasts?”
Have you tried the IRI website?
http://iri.columbia.edu/climate/ENSO/currentinfo/SST_table.html
In fact, that’s where I may have seen the discussions of model performance.
NOAA recently obsoleted their older ENSO-prediction models (within the last year, I believe), so they won’t have a history of the newer models (NCEP CFSv2) that’s more than a couple of years old.
Matthew R Marler says: “So if an increase in atmospheric CO2 concentration produces an increase in downward shortwave radiation, does that not create more fuel, e.g. warmer water?”
Show me the warmer water, Matthew. Ocean Heat Content for the tropical Pacific has cooled since 1999:
http://bobtisdale.files.wordpress.com/2014/01/figure-4.png
And subsurface temperatures for the entire Pacific (0-2000 meters) have warmed very little during the ARGO era:
http://bobtisdale.files.wordpress.com/2014/01/nodc-argo-era-vertical-mean-temp-per-basin-to-2013.png
The only ocean basins that are warming are the South Atlantic and Indian Oceans.
The two graphs are from the following post:
http://bobtisdale.wordpress.com/2014/01/31/open-letter-to-kevin-trenberth-ncar/
Taphonomic says: “Bob, minor typo. You got the title of Ludescher et al. wrong, it should be ‘Very Early Warning of Next El Niño’ not ‘Very Early Warming of Next El Niño’”
Thanks for finding that. Corrected.
The coming La Nina will be neither weak nor brief.
Those waiting for el Ninot will go on waiting.
“Therefore you need to explain how that map could be possibly correct with very limited Arctic ice data available then, when there is evidence to the contrary.”
DS also explains that well, when clearly we talking about large yearly changes in Arctic sea ice. What you have shown on that map despite being likely unreliable was also very likely caused by the weather pattern that year.
http://en.es-static.us/upl/2013/12/arctic-sea-ice-2012-vs-2013.jpg
With low pressure remaining persistently over the Arctic during that month in 1933 it would have only favored more ice than usual.
http://www.wetterzentrale.de/pics/archive/ra/1933/Rrea00119330806.gif
http://www.wetterzentrale.de/pics/archive/ra/1933/Rrea00119330813.gif
http://www.wetterzentrale.de/pics/archive/ra/1933/Rrea00119330824.gif
Pressure over the Arctic was higher during 2012, explaining lower ice levels compared with 2013 and 1933.
http://www.wetterzentrale.de/pics/archive/ra/2012/Rrea00120120805.gif
http://www.wetterzentrale.de/pics/archive/ra/2012/Rrea00120120813.gif
http://www.wetterzentrale.de/pics/archive/ra/2012/Rrea00120120825.gif
Gail Combs says:
February 15, 2014 at 7:16 pm
“Darn my link did not work GRAPH of adjustments ”
http://i29.photobucket.com/albums/c274/richardlinsleyhood/Fig8HadCrutGISSRSSandUAHGlobalAnnualAnomalies-Aligned1979-2013withGaussianlowpassandSavitzky-Golay15yearfilters_zps670ad950.png
And if you look at the graph I supplied you can see how the GISS adjustments that Steve notes go even further back to keep GISS below HadCrut almost to the start of the record when they mysteriously come back together again.
Now I don’t know how that ‘trick’ is pulled off but it is there for all to see.
What has Arctic temperatures got to do with ENSO?
While the PDO is positive the Arctic has warmer ocean currents flowing into it from the transfer of energy via surface ocean currents from stronger/more frequent El Nino events.
While the PDO is negative the Arctic has cooler ocean currents flowing into it from the transfer of energy via surface ocean currents from weaker/less frequent El Nino events.
Pippen Kool says: “A more plausible way to look at it is that during La Niña the delta T from air to water is high, and more energy than normal ends up going into the water, warming the water in the Pacific…”
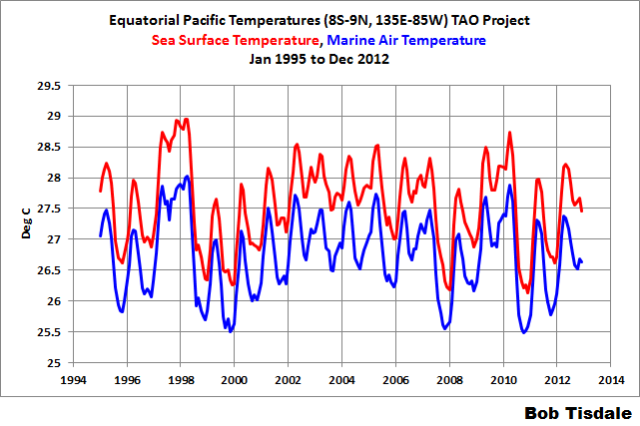


Data disagrees with your speculation, Pippen Kool. The following graph compares the sea surface temperatures and marine air temperatures from the TAO project buoys, for the period of January 1995 to December 2012. As you’ll note, monthly marine air temperature for the equatorial Pacific is always cooler than sea surface temperatures:
And the temperature difference between the marine air and sea surface temperatures (SST MINUS MAT) DECREASES (not increases) during La Niñas, Pippen Kool:
Just in case you’re having trouble see the relationship to ENSO, here’s the difference smoothed with a 12-month filter:
Obviously, your speculations are contradicted by data. You couldn’t be more wrong if you tried.
Come on back when you’re done speculating. That is, bring some data with you when you want to try to explain how ENSO works. Otherwise, you’re wasting your time and mine.
Have a good day.
The Weekly GODAS data was updated to Feb 12 overnight.
Now we are seeing movement towards an El Nino with the warm undercurrent moving farther east, cold water is infiltrating down at 120E to 130E, surface currents have slowed considerably or started moving east in the central Pacific and there is large weakening of the Trade Winds in the central Pacific. I change my mind everytime a new set of data comes out. Predicting a self-reinforcing oscillation is tricky business.
http://www.cpc.ncep.noaa.gov/products/GODAS/pent_gif/xz/movie.temp.0n.gif
http://www.cpc.ncep.noaa.gov/products/GODAS/pent_gif/xy/movie.uv15m.gif
http://www.cpc.ncep.noaa.gov/products/GODAS/pent_gif/xy/movie.h300.gif
http://www.cpc.ncep.noaa.gov/products/analysis_monitoring/enso_update/ua850_c.gif
Pippen Kool says: “A more plausible way to look at it is that during La Niña the delta T from air to water is high, and more energy than normal ends up going into the water, warming the water in the Pacific…”
No, that is not observed.
In the tropics oceans are the warmest source and with little height decrease in temperature all way up to the stratosphere. Hence, the warming source is the ocean and with it always losing energy warms to atmosphere less efficiently the higher above it.
There is a simple scientific explanation for this and that is the atmosphere only traps some of the energy from the sun directly. The heat capacity of the water is much greater than the atmosphere, so itself is able to trap far more energy from solar energy than the atmosphere can. Hence, why the ocean is the warmest source and itself warms the atmosphere much greater than if only the atmosphere existed.
Bob, the charts that you just posted: ” The following graph compares the sea surface temperatures and marine air temperatures from the TAO project buoys, for the period of January 1995 to December 2012. As you’ll note, monthly marine air temperature for the equatorial Pacific is always cooler than sea surface temperatures.”
I had not seen this data before- It says that the thinking that the tropics are cooled by clouds, thunderstorms, etc. is probably wrong. The source of cooling is the ocean, not the atmosphere. We need to look at this very closely.
I looked at the data wrong, the atmosphere does cool the ocean.
Thanks Bob. Your response at 4:46 am to PK and the accompanying chart with air vs water temps is interesting. It made me realize if air is warmer than water, the WV from the air will condense onto the water surface cooling the air. If the air is cooler than the water, then the water surface will evaporate and condense into the air, warming it. With a difference over three orders of magnitude in mass. any heat going into the water is negligible, but vice versa, the air is heated significantly. With the SST above the air temperature consistently the ocean is heating the atmosphere, not the other way around. Never really put it together that way in total. Thanks again.
Matthew R Marler says: @ February 16, 2014 at 3:15 am
I suggest you read: THIS.
“Other than that, I don’t make predictions.”
All I’ve been watching is WUWT’s ENSO Meter, therefore I see no reason whatever to expect El Nino.
Matthew R Marler says:
February 16, 2014 at 3:15 am
“We do not have detailed information on the natural variability absent that increased CO2; we have a perfectly reasonable, yet incomplete and inaccurate, prima facie case that increased CO2 should lead to increased heat accumulation somewhere in the system.”
We also have millions and millions of years of data that show CO2 rises after, not before, temperatures Warm. It has always been late to the party, getting there as the Heat starts to recede. If CO2 caused temperatures to rise once it was released, then temperatures would have never gone down; they would be forever rising throughout history. (that is, temp rise would release CO2 would produce temp rise would release more CO2… and on and on. And remember too, CO2 levels on the planet have been as high as 7,500ppm before.)
“Was the increase in global mean temp from about 1975 to about 1995 greater than it would have been without CO2? I doubt it, but why would anyone claim certainty one way or another?”
We could just compare two periods that are well documented
http://oi57.tinypic.com/av1rev.jpg
One of those two warming periods happened when CO2 levels were at what the IPCC calls the ideal baseline (280-300ppm) and one of them was done with CO2 levels over 340PPM (their danger zone). Can you tell the difference between the two?
“did the Warming from ’75 to ’95 contribute to the unusually large el Nino of 1997-1998? … I think that the bulk of the evidence and dynamical modeling theory and experience that I have referred to above gives the answer “maybe”.”
http://en.wikipedia.org/wiki/File:Soi.svg
So the two large El Ninos of 82/83 & 87/98 were caused by CO2, but the other equal to even larger El Nino events were just natural?
Plus (like with CO2) temperatures rise after El Ninos, not the other way around. You can even see this
http://www.woodfortrees.org/plot/hadcrut4gl/from:1934/to:1982/plot/hadcrut4gl/from:1982/to:1998/plot/hadcrut4gl/from:1934/to:1982/trend/plot/hadcrut4gl/from:1982/to:1998/trend/plot/hadcrut4gl/from:1998
…so when the strong El Nino period started, temperatures we no larger then they had been back in the pre-‘dangerous levels of CO2’ age. Temperatures only rose during the large El Nino period, then flattened out again.
Besides, I’ll pay you money if you can show that correlation here
http://upload.wikimedia.org/wikipedia/commons/thumb/1/11/PDO1000yr.svg/800px-PDO1000yr.svg.png
The pre-starting point for that graph is the WMP, the middle section is the period we call the LIA, and the end point is the modern warming period where temperatures have yet to get back to where they were during that MWP.
The problem I have with the warmer water and air=more clouds=more reflectance negative feedback is scale. While this negative feedback must work at some level, cloud reflectance is only about 25% of the energy budget.
Clouds are water. People don’t seem to have their arms around the scale of the energy flux between the ocean and water in the atmosphere. It equals 100% of the budget. So we have 100% coming in as TSI, 100% going out (assuming equilibrium), and 100% cycling in the photon food fight between the surface and the atmosphere.
If you increase clouds 10%, you will increase reflectance by 2.5%, but you will amplify the food fight 10%. Increasing clouds should have the net effect of warming the lower atmosphere.
Gymnosperm, reduce the area of concern to the equatorial belt and then recalculate.
I am so happy that there has not recently been an el Nino or an impending el Nino in the next few months. My wife and I are scheduled on a Galapagos cruise in May. El Nino events are very hard on the ocean dependent life in the Galapagos. El Nino events in the Galapagos spell famine for fish, seals, birds, and sea iguanas. That would be a depressing sight.
I expect our trip will be a beautiful adventure with la Nina or neutral conditions.
An El Niño following a lesser amount of recharge simply means that oceans will continue to lose heat over time. We may be seeing the beginning of a series of descending steps in land temps.
gymnosperm: Increasing clouds should have the net effect of warming the lower atmosphere.
It depends on the timing and location of the increased cloud cover. Increased daytime cloudiness in the summer tropics probably produces net cooling; increased night time cloudiness in the winter temperate zones probably produces net warming. What the effects of increased atmospheric CO2 would be can’t be calculated on present knowledge.
Regular readers will know of Willis Eschenbach’s “thermostat hypothesis” according to which the Earth probably can not warm overall much more (e.g. probably less than 1 K in the mean, and perhaps within +/- 0.1 of 0) no matter how much extra C02 there is (I don’t think he has committed himself to a numeric estimate, but I think these figures are fair interpretations of his hypothesis.) I think that there is a good chance he is correct, though I prefer “self organizing system” or “intrinsic dynamics” to “thermostat”. What mystifies me is the certainty of some people. .
Pamela Gray says:
February 16, 2014 at 12:41 pm
“An El Niño following a lesser amount of recharge simply means that oceans will continue to lose heat over time. We may be seeing the beginning of a series of descending steps in land temps.”
Walking down the steps we walked up previously. Now where did I see a post claiming that before?
If we are entering a cooling phase even an El Nino might not cause a change in the pause.
The odds on an event fall into 2 patterns.
Go with the trend in which case a La Nina is odds on.
Or reversion to mean meaning its pulled away on the underside so now it will have to go back to neutral so odds on to be heading in an El Nino direction.
On the stock market number 1 is the fancy [La Nina].
On the sock market number 2
Matthew and Pamela,
Yes, but reflectance starts the game with a 1/4 disadvantage. Most of the food fight is in the tropics because that is where most of the insolation falls. Nearly half of TSI is IR. The energy curve of this is skewed heavily to the near IR which is the spectral province of H2O.
Clouds reflect in the visible range (we perceive them as white). UV gets scattered a bit but essentially passes through.
Well aware of Willis’ thermoregulatory theory. Paleoclimatologists have known this since the seventies. There seems an upper limit AND a lower limit in the tropics.
Certainty only exists in religion. Scientists can only plug along, minds wide open.
I don’t care what short or longwave IR does to air temps or food fights or land temps on its way to equatorial oceans. What I think is important is the amount of SWIR that recharges equatorial oceans at depth. Under La Nada and Neutral conditions, as well as El Nado and El Nino conditions, we are not getting the full amount of equatorial ocean heating we would normally get because more clouds are present than under full blown La Nina conditions. Meanwhile the oceans are spreading previous SWIR heating all over the globe which then layers up to the surface where it gets belched up onto land surfaces where it dissipates and gets lost to space. If recharge is getting less and less, we will experience those global temperature steps but in a downward fashion. If recharge gets going at full strength again (and soon) with strong La Nina’s, we could indeed find ourselves in another step up.
I just don’t see that happening. The conditions necessary for another strong La Nina just isn’t there. And it is only that condition that could result in continued increasing steps of warming of global land temperatures.
Bill Illis on February 16, 2014 at 5:19 am
The Weekly GODAS data was updated to Feb 12 overnight.Now we are seeing movement towards an El Nino with the warm undercurrent moving farther east, cold water is infiltrating down at 120E to 130E, surface currents have slowed considerably or started moving east in the central Pacific and there is large weakening of the Trade Winds in the central Pacific.
The normal time for an el Nino peak is Dec-Jan due to the annual phase-locking of ENSO. Thus it may now be too late for an al Nino to take hold. However the el-Nino like east Pacific surface warming and weakening of the trades might serve, conversely, to “prime the pump” for an upwelling driven La Nina.
Tisdale says: “And the temperature difference between the marine air and sea surface temperatures (SST MINUS MAT) DECREASES (not increases) during La Niñas, Pippen Kool”
Sorry not to get back to you BT, life and work intervenes. So yes yes, the AVE temps are below sea surface temp. But your nice graph makes my point: during La Niña conditions the average temp relative to the SST is higher than during El Niño conditions. Yes in both cases it is lower, but that is an average and an average has a S.D. So that means that during La Niña conditions the air temp is higher than the SST for more time than in El Niño conditions. Hence, more energy is sucked from the surface in El Niño conditions than in La Niña conditions. Or the the converse, which means that during La Niña conditions the ocean is gaining more energy. Simple logic.
BTW, why did you stop your graph at 2012? When I checked your graphs (using only the eastern pacific) there was this one weird spike in the temperature difference data (between SST and airT) that continues from 2012 to this day, that is outside the range of the entire dataset….except for the spike during the volcanic eruptions of the early 90s.
Sort of weird.
A la nina and it’s already started. First it was all the pacific typhoons, caused by the winds. Then we got the la nina ocean conditions. Now the temperatures for February have dropped 0.5 degrees from January. Yes, I say we get a few more months of la nina conditions. I think there will, finally, be an el nino, but not until next year or so.
I did not mean to comment on this post, but …
Firstly: IRI predictions (http://iri.columbia.edu/climate/ENSO/currentinfo/technical.html) forecasting to October 2014, the highest probability of normal conditions. By the end of 2014 predicted is similar probability of La Nina and El Nino.
Secondly: solar activity – ENSO. For me the best is here this paper: Influences of the 11-year solar cycle on the tropical atmosphere and oceans, Misios (2012, http://www.mpimet.mpg.de/fileadmin/publikationen/Reports/WEB_BzE_113.pdf). Let me quote a few conclusions from this work: “Many studies indicated an El Niño – like warming, whereas other studies isolated a La Niña – like cooling during solar maxima.” “If solar maxima favor, statistically, La Niña episodes, then El Niño – like warming should be detected in solar minima. Yet, observations do not support this transition.”
Certainly therefore for half of this year, maybe mid-July, we will have conditions similar to La Nina.
We see it well in this figure (http://static.wixstatic.com/media/857cde_d98bf69778e24c65a7a20ff74b77b617.png_srz_p_600_460_75_22_0.50_1.20_0.00_png_srz).
Subsequently we will have a strong El Nino? Probably not.
“I identify a clear relationship between solar signals in temperature and the correlation between the solar cycle and ENSO predictors. Negative correlation is associated with higher temperature solar responses and vice versa. Although the bias induced by the solar cycle – ENSO collinearity is found weak in the coupled simulations, it could adversely affect any single short realization of the model and so it could in the observed record. In other words, the observed record is too short for unambiguous identification of solar signals in the tropical lower stratosphere with multiple linear regression models.”(ibidem)
… unfortunately …
If an El Nino does occur and global average temperatures do not shoot up to match climate model projections then it will be real fun to watch the spin needed to explain that one away.
Robert, I don’t think there has been enough SWIR recharge to then layer up in the calm seas of an El Nino to do much in terms of raising land temperatures. We need solar re-charging of the oceans in order to stay out of cold decades. So in reality, what we need is a strong and long La Nina in order to raise temperatures. The warmers should be cheering that event, not an El Nino event.
I have been searching for cloud data for such a long time. A frustrating venture into access to and limits of data files if there ever was one. Inter-tropical Convergence Zone cloud data is extremely difficult to get. Why?
1. Downloadable cloud fraction Excel files don’t have their columns labeled so I don’t know which set of columns to use to study just the inter-tropical areas.
2. The data sets are SHORT (for example, cloud fraction only goes back to 2002 at the most)! To make them longer there are current efforts afoot to correlate current ship observations (they have used the same format for eons) with current satellite data and have found bias (like DUH!). Meaning that eyeballing clouds is like Mann eyeballing tree rings.
3. Satellites still cannot differentiate very well between cloud depth versus cloud height. Meaning that cirrus clouds may be given equal weighting to thunder heads simply because they are at the same height. But these two cloud types make a HUGE difference in SWIR energy calculations at sea level.
4. When I tried to download the cloud data sets used by research groups putting together cloud data for models, the data file page has “disappeared”.
How in the heck do they hope to model cloud data into climate models when the raw data is so fraught with limits and inconsistencies???? And more important, how can armchair researchers like me hope to make the ivory tower folks toe the line?
Pippen Kool says:
February 16, 2014 at 10:16 pm
“…during La Niña conditions the average temp relative to the SST is higher than during El Niño conditions. Yes in both cases it is lower, but that is an average and an average has a S.D. So that means that during La Niña conditions the air temp is higher than the SST for more time than in El Niño conditions.”
Not true, the observed scientific evidence is shown using buoys in the tropical ocean.
“Results indicate that all terms in the temperature balance contributed to SST variations during different stages of the 1997–98 El Niño and the 1998–99 La Niña.”
http://web.b.ebscohost.com/abstract?direct=true&profile=ehost&scope=site&authtype=crawler&jrnl=08948755&AN=5856192&h=RJPbvV5xgkULfk2WD4aTbycb5JkaKyfT3puhpQuqcY52jcRbo4XPtsXZfkgu5aBtt0wrCBuy3V8ah0Bykn4xrQ%3d%3d&crl=c
The near surface air temperatures immediately cools down soon as during La NIna conditions form. The near surface air temperatures also immediately warm soon as during El NIno conditions form. Scientific evidence using observed measurements show in the tropics the atmosphere responds to SSTs, not the other way round.
Pamela Gray says:
February 17, 2014 at 9:51 am
“So in reality, what we need is a strong and long La Nina in order to raise temperatures. The warmers should be cheering that event, not an El Nino event.”
While it is true this favors solar energy build up in the tropics due to increased convection. If during this moment less solar energy reaches the ocean surface, then the same length La Nina will raise temperatures less with a future El Nino. This is how ENSO causes a step down in global temperatures. So far we have only seen a step up in global temperatures due to ENSO over the satellite era. That was caused by further declining cloud levels during La NIna events and a reverse will appear to cool global temperatures. Even during El Nino events less cloud cover will slow the loss of cumulative energy to the atmosphere.
I’m praying for El Nino (but not predicting an outcome). Let there be a 1978 redux!
Matt, I am only referring to absorbed energy at depth and then allowed to circulate through the global oceanic current system to later belch up this stored heat onto land. A nice long La Nina that is both long and strong will allow quite a bit more heat to be stored than under sputtering short weak La Nina’s/La Nada’s.
Matt I believe you and I are in agreement. I may have stated mine less clearly.
Gail Combs, you directed me here: http://theinconvenientskeptic.com/2012/05/the-science-of-why-the-theory-of-global-warming-is-incorrect/
I read that blog from time to time. I am not saying that particular argument is wrong, I am saying that it is incomplete, as with most of the other arguments that aim to derive predictions from the known science.
Pamela,
Have you been sunburned on a cloudy day yet? Only then will you truly understand that your SW penetrates clouds as efficiently as it penetrates the ocean.
Gymnosperm please read up on such matters. You are quite wrong.
Pippen Kool: You are predictable. The tropical Pacific is ALWAYS releasing heat from ocean to atmosphere: during El Niños and La Niñas. It is never sucking heat from the atmosphere. You’ve overlooked the primary way the tropical Pacific releases heat: through evaporation. Here’s a graph that compares latent and sensible heat fluxes from the tropical Pacific.
http://bobtisdale.files.wordpress.com/2013/11/figure-35.png
The latent heat released from the tropical Pacific dwarfs the sensible flux.
The graph is from the following post titled “La Niñas Do NOT Suck Heat from the Atmosphere”:
http://bobtisdale.wordpress.com/2013/11/25/la-ninas-do-not-suck-heat-from-the-atmosphere/
Regards
PS for Pippen Kool: BTW, your analysis is backwards. The Pacific releases less heat during La Ninas, which is why the delta T decreases.
Bob Tisdale says: “The tropical Pacific is ALWAYS releasing heat from ocean to atmosphere: during El Niños and La Niñas. It is never sucking heat from the atmosphere. You’ve overlooked the primary way the tropical Pacific releases heat: through evaporation.”
That is irrelevant to my initial comment of energy balance in the ENSO positive vs negative years. So if I put in your terms, during El Niño more energy comes out of the Pacific than during La Niña: your delta T between SST and airT says as much, that is, the bigger the delta the bigger the transfer of energy, physics 101. So whether I say that during La Niña the ocean is gaining more energy than El Niño (I admit that that was not the best way to say it), or if you say that during La Niña the ocean is releasing less energy than El Niño, at the end of the year, the balance sheet says the ocean gains in La Niña years … and the atmosphere gains in El Niño years.
And I was wondering did you ever check out that weird temperature spike that I was commenting on in my last post? The one from 2012 to now?
Bob Tisdale says: “BTW, your analysis is backwards. The Pacific releases less heat during La Ninas, which is why the delta T decreases.”
Pippen Kool said: ” Hence, more energy is sucked from the surface in El Niño conditions than in La Niña conditions.”
I think I got that part correct at least! And I think we agree.
Now you have time to look into that weird temp spike! How do I post a picture here, I should learn how to do that…
gymnosperm says:
February 17, 2014 at 6:50 pm
No,
http://oceanexplorer.noaa.gov/explorations/04deepscope/background/deeplight/media/diagram3_600.jpg
http://las.physik.uni-oldenburg.de/images/uwlight.gif
It penetrates over 100m depending on the wavelength.
“Values of the same order were found for the depths of the maximal concentration of chlorophyll a, which varied between 45 and 100 m during midnight and between 70 and 110 m during noon.”
http://www.sciencedirect.com/science/article/pii/S0967064502000930
Chlorophyll needs sunlight to survive, so wouldn’t be growing at those depths without it.
Matt G,
Huh? I totally agree it penetrates the water. I’m saying it also penetrates the clouds. Clouds are water. Talking UV. High energy photons, not so many of them. Total energy falls off sharply above the visible range. Fatter tail in the IR side.
Still argue clouds net increase surface temperature. Nino=clouds, thus amplifying the atmospheric warming effect of Ninos.
gymnosperm says:
February 18, 2014 at 11:57 am
Matt G,
Huh? I totally agree it penetrates the water. I’m saying it also penetrates the clouds. Clouds are water. Talking UV. High energy photons, not so many of them. Total energy falls off sharply above the visible range. Fatter tail in the IR side.
Still argue clouds net increase surface temperature. Nino=clouds, thus amplifying the atmospheric warming effect of Ninos.
—————————————————————————————————————–
Thanks for the explanation, just thought you would have known that some forms of clouds can prevent majority, if not all solar radiation reaching the surface.
Solar radiation sensors detect the levels well at ground level and it is true they penetrate especially high clouds, medium level clouds poorly and low clouds very poorly. It is possible to get sun burn on a cloudy day especially if exposed in it all the time to high/medium level clouds or high up on a mountain. Stratus, Stratocumulus and especially Cumulonimbus clouds are typical low level clouds that can prevent nearly all solar radiation reaching the surface if not all.
Scientific evidence shows that while global clouds have declined during satellite era, global temperatures have increased. While global cloud levels have increased global temperatures have declined especially with medium and low level clouds.
http://climate4you.com/images/TotalCloudCoverVersusGlobalSurfaceAirTemperature.gif
Matt,
Thank you. I had not seen that. I suspect what it means is that visible light is very important in warming the surface. If you dive all, you know it goes down in water pretty far. I think it penetrates your skin as far as UV.
My suspicion was that a lot of visible light was reflected from the ocean surface. Whitecaps are essentially clouds. None of the major greenhouse gasses absorb visible light
.
I guess I stand corrected, although I still insist that when Ninos evaporate a lot of water, they are lobbing a lot of the granddaddy of greenhouse gasses right in the strike zone of incoming IR bands that are not saturated.
Matt,
P.S., if clouds absorbed all solar radiation it would be completely dark.
gymnosperm, you might be interested in the following tutorial:
http://oceansjsu.com/105d/exped_briny/1.html
gymnosperm says:
February 18, 2014 at 10:20 pm
When day becomes night has often been observed and this refers when there is no solar radiation reaching the surface. Total darkness only occurs with a huge area with no solar radiation and only thing that comes close is a supercell or huge hurricane. At dusk with sun below the horizon still takes a while for total darkness. Scattering of light from many miles away prevents total darkness, but on the regions affected directly no solar radiation is measured.
“My suspicion was that a lot of visible light was reflected from the ocean surface.”
Not enough to prevent visible light reaching below 100 m in the deep ocean. (390nm-750nm)
“I guess I stand corrected, although I still insist that when Ninos evaporate a lot of water, they are lobbing a lot of the granddaddy of greenhouse gasses right in the strike zone of incoming IR bands that are not saturated.”
I don’t think you will find any infrared bands closely above the deep ocean that are not saturated.
“The observations indicate a great variability in the humidity gradient between heights of 6 m and 30 m and a relatively small variability in the difference between the vapor pressures at the sea surface and at 6 m.”
http://journals.ametsoc.org/doi/abs/10.1175/1520-0469(1946)003%3C0001:THGOTS%3E2.0.CO%3B2
Forgot to mention that clouds don’t absorb all the solar radiation because a lot of it is reflected.
http://earthobservatory.nasa.gov/Features/Clouds/
“Real-time model predictions of ENSO conditions during the 2002–11 period are evaluated and compared to skill levels documented in studies of the 1990s. ENSO conditions are represented by the Niño- 3.4 SST index in the east-central tropical Pacific. The skills of 20 prediction models (12 dynamical, 8 statistical) are examined. Results indicate skills somewhat lower than those found for the less advanced models of the 1980s and 1990s. Using hindcasts spanning 1981–2011, this finding is explained by the relatively greater predictive challenge posed by the 2002–11 period and suggests that decadal variations in the character of ENSO variability are a greater skill-determining factor than the steady but gradual trend toward improved ENSO prediction science and models. After adjusting for the varying difficulty level, the skills of 2002–11 are slightly higher than those of earlier decades. Unlike earlier results, the average skill of dynamical models slightly, but statistically significantly, exceeds that of statistical models for start times just before the middle of the year when prediction has proven most difficult. The greater skill of dynamical models is largely attributable to the subset of dynamical models with the most advanced, highresolution, fully coupled ocean–atmosphere prediction systems using sophisticated data assimilation systems and large ensembles. This finding suggests that additional advances in skill remain likely, with the expected implementation of better physics, numeric and assimilation schemes, finer resolution, and larger ensemble sizes.”
http://journals.ametsoc.org/doi/abs/10.1175/BAMS-D-11-00111.1
ENSO forecasts, awful and apparently getting worse…