Guest essay by Don J. Easterbrook, Dept. of Geology, Western Washington University
Last week in my post ‘‘The cause of pause in global warming,” I presented data showing that the lack of global warming was not the ‘biggest mystery in climate science,’ “but, in fact, it really isn’t a mystery at all, it was predicted in 1999 on the basis of consistent, recurring patterns of the Pacific Decadal Oscillation (PDO) and Atlantic Multidecadal Oscillation (AMO) and global climate.” This precipitated an avalanche of caustic comments by Bob Tisdale, almost all of which were totally irrelevant to what I said. This post is to set the record straight so there is no misunderstanding of the situation.
I like Willis Eschenback’s caveat: “if you disagree with something that I or someone else said, please QUOTE THEIR EXACT WORDS and state your objection. That way we can all understand just what you are objecting to, and the nature of your objection.” With that in mind, here is the crux of what I said.
“Each time the PDO was warm, global climate warmed; each time the PDO was cool, global climate cooled.” “Each of the two PDO warm periods (1915-1945 and 1978-1998) and the three cool periods (1880-1915, 1945-1977, 1999-2014) lasted 25-30 years. If the flip of the PDO into its cool mode in 1999 persists, the global climate should cool for the next several decades. “

Figure 4. (Top) PDO fluctuations and projections to 2040 based on past PDO history.

Figure 4. (Bottom) Projected global cooling in coming decades based on extrapolation of past PDO recurring patterns.
I plotted the oxygen isotope measurements made by Stuiver and Grootes (1997) for the past 450 years, which,
”showed about 40, regularly-spaced, warm/cool periods with average cycles of 27 years, very similar to the PDO cycle. There was no way to determine what the PDO looked like that far back, but the GISP2 warm/cool cycles were so consistent that correlation with PDO 25-30 year cycles seemed like a good possibility. Historically known warm/cool periods showed up in the GISP2 curve, i.e., the 1945-1977 cool period, the 1915-1945 warm period, the 1880-1915 cool period, the Little Ice Age, Dalton Minimum cooling, the Maunder Minimum cooling, and many others, lending credence to the validity of the GISP2 measurements.”

Figure 5. Warm and cool periods to 1480 AD from oxygen isotope measurements from the GISP2 Greenland ice core. The average length of a warm or cool cycle is 27 years.
Conclusions
“The ‘mysterious pause’ in global warming is really not mysterious at all. It is simply the continuation of climatic cycles that have been going on for hundreds of years. It was predicted in 1999, based on repeated patterns of cyclical warm and cool PDO phases so it is neither mysterious nor surprising. The lack of global warming for the past 17 years is just as predicted. Continued cooling for the next few decades will totally vindicate this prediction. Time and nature will be the final judge of these predictions.
What drives these oceanic/climatic cycles remains equivocal. Correlations with various solar parameters appear to be quite good, but the causal mechanism remains unclear.”
Bob Tisdale immediately launched an insulting verbal attack in which he said:
“Easterbrook’s post is misleading, it misinforms, it is contrived, it is far from good science”
“Easterbrook continues to present his misunderstandings of the PDO”
“Easterbrook does more to mislead and misinform than to teach and inform”
“It’s bogus!”
“He insists on misinforming readers”
“Easterbrook’s bogus-looking global temperature anomaly data”
“I suspect it’s a fantasy dataset”
Now I enjoy a spirited discussion of issues as much as anyone and am always willing to discuss any scientific issue, but these unprofessional, insulting remarks are not what I call science and do nothing to advance the understanding of issues. Tisdale completely missed the point of what I said and the basis for saying it. Virtually everything he said was irrelevant to the data that I presented and nothing he said disproves any of my data or my predictions (which so far seem to be right on track). Tisdale missed the boat when he ignored my statement at the outset, “it was clear that PDO drove global climate (Figs. 2,3), but what drove the PDO was not apparent,” and again at the end, “what drives these oceanic/climatic cycles remains equivocal. Correlations with various solar parameters appear to be quite good, but the causal mechanism remains unclear.”
In other words, I was correlating the chronology of the PDO with global climate and glacier fluctuations without worrying about the cause of the PDO. I don’t know what causes the PDO nor does anyone else, including Tisdale. I then used GISP2 Greenland ice core oxygen isotope data to show that 40 warm/cool cycles back to at least 1480 had 27 years cycle patterns very similar to those of the PDO and global warming cycles that we have observed in the past century. Tisdale vented his criticisms of my work on the basis of his interpretation of what causes the PDO, which is totally irrelevant to the data that I presented. The point here is I start with recognition of the existence of the PDO and it really doesn’t matter what the cause is—that’s a separate issue. Tisdale’s interpretations of the relationship of ENSO to the PDO may well be correct, but that does nothing to invalidate the data that I presented. As one of the commenters pointed out, “In addressing Don Easterbrook you assert repeatedly that the PDO is an “aftereffect” of the ENSO. This in no way contradicts anything that Don said, he left the cause of the PDO as unknown.” Tisdale failed to understand that none of his discussions about the cause of the PDO in any way invalidated the data presented.
Tisdale was very critical of figure 4, repeatedly calling it “bogus” (= false, fake, phony, counterfeit, sham) and “a fantasy dataset” (= made up, invented, fictional, imaginary, unreal) because the source of part of the curve from 1900-2000 wasn’t indicated. The logic of such a conclusion is not valid—just because you don’t know the source of data on a graph doesn’t render it ‘bogus’ or a ‘fantasy.’ Yes, it is perfectly reasonable to ask for source data and can reserve judgment until you get it, but Tisdale’s statements were way off base–not logical and unnecessarily insulting. Here is the original graph used for part of figure 4—it is neither ‘bogus’ nor a ‘fantasy.’

This curve is now 14 years old, but because this is the first part of the curve that I originally used in 2000, I left it as is for figure 4. Using any one of several more recent curves from other sources wouldn’t really make any significant difference in the extrapolation used for projection into the future because the cooling from 1945 to 1977 is well documented. The rest of the curve to 2010 was grafted on from later ground measurement data—again, which one really doesn’t make any difference because they all show essentially the same thing. The extrapolated parts of the curve show three possible projections: (1) cooling similar to 1945-1977, (2) somewhat deeper cooling, perhaps similar to 1880-1915, (3) somewhat deeper cooling, perhaps similar to that of the Dalton Minimum. The last two are diagrammatic only– really guesses, but are shown to illustrate possible options. Nothing that Tisdale says in his comments in any way invalids this figure.
The last three graphs in my post are intended merely as illustrations of the global cooling that has occurred since 1998, confirming (so far) the predictions that I made 14 years ago. If you don’t like figure 6, throw it out–Figures 7 and 8 make the same point. Tisdale’s conclusion that “cooling is not occurring from the peak around 2001 through 2010” is easily proven false by the Christopher Monckton graph below.

Global cooling from 1996 to 2013. Graph by Christopher Monckton http://wattsupwiththat.com/2013/08/07/the-agu-policy-statement-as-redrafted-by-monckton/
Conclusions
1. I have neither the desire nor reason to quarrel with Bob Tisdale—I suspect our differences are less than one might imagine. His Enso interpretations may well be correct, but they have no relevance to the data presented in my WUWT post.
2. Nothing in any of Tisdale’s comments invalidates any of the data that I presented.
3. The global cooling predictions that I made in 2000, based on recurring patterns of PDO and global climate, have so far proven to be correct.
4. Nature and time will ultimately prove whether or not my all of my predictions are correct.
5. I hope that we can now move on to more productive issues, especially what is the principal driving force of climate changes. I welcome open discussions of scientific issues with anyone, including Bob Tisdale, but I confess to having little patience with argumentum ad hominem.
I think the last PDO warm phase actually ended in 2007 which would be in line with a 30 year cycle. The drop into cool 2000-2002 is similar to the two year warm period around 1960 in the middle of the cool phase. If so, as your top chart still shows, cooling would continue until the late 2030s.
If you are looking for the ultimate base for our climate, you must find an explanation for the ~18K warmer deep oceans some 84 million years ago.
I think I have a solid explanation, but be warned, it has nothing to do with CO2.
see http://onlinelibrary.wiley.com/store/10.1029/2011JC007255/asset/supinfo/jgrc12191-sup-0010-fs09.pdf?v=1&s=79e93e124ca1fd8a33753fc667ff17deaa20b3e6
Handbags at ten paces.
“I hope that we can now move on to more productive issues, especially what is the principal driving force of climate changes”
The amount of solar energy able to enter the oceans in the first place skews the ENSO process between dominant El Nino and dominant La Nina.
A more active sun pulls the jets poleward for a zonal pattern with less clouds, more energy enters the oceans and El Nino dominates.
A less active sun pushes the jets more equatorward for a meridional pattern with more clouds, less energy enters the oceans and La Nina dominates.
The PDO may be an ‘after effect’ of ENSO but it is closely linked to it. I suspect that the variations in surface water temperature during the ENSO cycle cause the atmospheric pressure differentials that constitute the PDO.
During a warming period such as from LIA to date there would be upward stepping in temperatures from one positive mode to the next and in a cooling period such as from MWP to LIA there would be downward stepping in temperatures from one negative mode to the next.
Didn’t some thirteen year old girl posit this same theory re PDO a few years ago in Australia?
“All other things being equal, adding more greenhouse gases to the atmosphere will have a warming effect on the planet,” Judith Curry, a climatologist at the Georgia Institute of Technology, told the Los Angeles Times. “However, all things are never equal, and what we are seeing is natural climate variability dominating over human impact.”
http://sppiblog.org/news/study-earth-was-warmer-in-roman-medieval-times
As a reader who enjoys the debates and information on WUWT. I certainly enjoy a professional response to other respectable researchers who temporarily forgot their manners.
I am guilty of forgetting, and remembering myself. In a poor rendering of the fictitious Professor Dumbledor, “There is no reason to be rude, not even to our enemies.”
Thank you Don for your professional presentations, discussions for the public, and backing the scientific method.
Bob Tisdale
Please learn from Don, take a Dale Carnegie course, and work at addressing the science, not attacking the man.
Doesn’t this ‘Pause the Cause’?
Thank you Don. Besides, Tisdale, who would disagree with you and in what way?
Bob Tisdale, is Don missing something?
David L. Hagen says:
January 21, 2014 at 7:09 am
Thank you Don for your professional presentations, discussions for the public, and backing the scientific method.
Bob Tisdale
Please learn from Don, take a Dale Carnegie course, and work at addressing the science, not attacking the man.
================================================
That’s kind of a jackass statement to make about Bob until you’ve heard his response to this.
I agree with Easterbrook when he posts:
“…but these unprofessional, insulting remarks are not what I call science and do nothing to advance the understanding of issues.”
Professional & courteous . Well done.
Don B says:
January 21, 2014 at 6:37 am
“All other things being equal, adding more greenhouse gases to the atmosphere will have a warming effect on the planet,” Judith Curry, a climatologist at the Georgia Institute of Technology, told the Los Angeles Times. “However, all things are never equal, and what we are seeing is natural climate variability dominating over human impact.”
<<<<<<<<<<<<<<<<<<<<<>>>>>>>>>>>>>>>>>>>>>>>>>>>
I challenge Judith Curry or anyone else to show any impact of anthropogenic CO2 on climate.
1.N0 it looks like a snake.
2.No like a wall.
3.No like a tree.
4.No …rope.
5.No…fan.
Same elephant?
Popcorn futures are looking up. /munchmunchmunch
I once heard Roman Jackobson tell a story about Ferdinand de Saussure, AKA “the father of French linguistics.” The story went something like this: De Saussure had invited a friend, a prominent cleric, to a meeting of the Societe Philologique, Paris. The topic of the day involved some abstract theoretical point of phonology, and the participants became rather heated in their discussion. Dr. Saussure was quite embarrassed and later apologized to the good father for his colleagues’ demeaner.
To which his friend replied that Dr. Saussure should not feel bad. He (the friend) was in fact rather pleased when the speakers raised their voices and pounded the podium, because only then could he be sure that “they really believed the ridiculous things they were saying.”
I’m not suggesting that anyone is saying ridiculous things in this post, only that I am pleased not to encounter a party line that is not to be questioned.
Unlike some other sites….
Don is basing his forecasts on pattern recognition which is as far as I can see at this time is the best way of forecasting climate . His future forecasts show possible cooling trends based on whether we are entering a Dalton or Maunder minimum. For somewhat more quantitative estimates of the timing and extent of the coming cooling based on the patterns of the 60 year (PDO) and 1000 year quasi periodicities in the temperature and the current decline in solar data see
http://climatesense-norpag.blogspot.com
Here are the conclusions of the last post for comparison and discussion.Incidentally I agree with Don that Tisdale missed the point of Dons work and that Bob’s intemperate attack was completely uncalled for. I also, like Don think that Tisdale’s ENSO mechanism is probably the key climate thermostat.
Here’s the quote
“In earlier posts on this site http://climatesense-norpag.blogspot.com at 4/02/13 and 1/22/13
I have combined the PDO, ,Millennial cycle and neutron trends to estimate the timing and extent of the coming cooling in both the Northern Hemisphere and Globally.
Here are the conclusions of those posts.
1/22/13 (NH)
1) The millennial peak is sharp – perhaps 18 years +/-. We have now had 16 years since 1997 with no net warming – and so might expect a sharp drop in a year or two – 2014/16 -with a net cooling by 2035 of about 0.35.Within that time frame however there could well be some exceptional years with NH temperatures +/- 0.25 degrees colder than that.
2) The cooling gradient might be fairly steep down to the Oort minimum equivalent which would occur about 2100. (about 1100 on Fig 5) ( Fig 3 here) with a total cooling in 2100 from the present estimated at about 1.2 +/-
3) From 2100 on through the Wolf and Sporer minima equivalents with intervening highs to the Maunder Minimum equivalent which could occur from about 2600 – 2700 a further net cooling of about 0.7 degrees could occur for a total drop of 1.9 +/- degrees
4)The time frame for the significant cooling in 2014 – 16 is strengthened by recent developments already seen in solar activity. With a time lag of about 12 years between the solar driver proxy and climate we should see the effects of the sharp drop in the Ap Index which took place in 2004/5 in 2016-17.
4/02/13 ( Global)
1 Significant temperature drop at about 2016-17
2 Possible unusual cold snap 2021-22
3 Built in cooling trend until at least 2024
4 Temperature Hadsst3 moving average anomaly 2035 – 0.15
5 Temperature Hadsst3 moving average anomaly 2100 – 0.5
6 General Conclusion – by 2100 all the 20th century temperature rise will have been reversed,
7 By 2650 earth could possibly be back to the depths of the little ice age.
8 The effect of increasing CO2 emissions will be minor but beneficial – they may slightly ameliorate the forecast cooling and help maintain crop yields .
9 Warning !! There are some signs in the Livingston and Penn Solar data that a sudden drop to the Maunder Minimum Little Ice Age temperatures could be imminent – with a much more rapid and economically disruptive cooling than that forecast above which may turn out to be a best case scenario.
How confident should one be in these above predictions? The pattern method doesn’t lend itself easily to statistical measures. However statistical calculations only provide an apparent rigor for the uninitiated and in relation to the IPCC climate models are entirely misleading because they make no allowance for the structural uncertainties in the model set up. This is where scientific judgment comes in – some people are better at pattern recognition and meaningful correlation than others. A past record of successful forecasting such as indicated above is a useful but not infallible measure. In this case I am reasonably sure – say 65/35 for about 20 years ahead. Beyond that certainty drops rapidly. I am sure, however, that it will prove closer to reality than anything put out by the IPCC, Met Office or the NASA group. In any case this is a Bayesian type forecast- in that it can easily be amended on an ongoing basis as the Temperature and Solar data accumulate. If there is not a 0.15 – 0.20. drop in Global SSTs by 2018 -20 I would need to re-evaluate
Dr. Easterbrook,
You are certainly right that argumentum ad hominem has no place in scientific discussion. I agree with Dr. Curry, “… scientists [who] defend their theories by calling their opponents names, well that is a sign that their theories are in trouble.”
The worst part about argumentum ad hominem is that when used against a person, they tend to respond in the same way, even against people that did not use it against them in first place. Of course once used, it is very difficult to “climb down”, even knowing that is the right thing to do.
I don’t believe Tisdale’s theories are in trouble. He makes a reasonable case for “… what the PDO represents, and more importantly what it doesn’t represent”. You also make a strong case that global warming is associated with the PDO (index).
Getting back to the science, is it possible that your differences might be more with the assertion that “it was clear that PDO drove global climate”? Might that not be an overreach? Is it possible that what is driving the PDO (index) might also be driving global temperatures?
Cut it out and behave lads, we don’t have to pin our colours to the mast. It’s the alarmists that have to substantiate their theories and justify their carbon taxes etc.
5. I hope that we can now move on to more productive issues, especially what is the principal driving force of climate changes. I welcome open discussions of scientific issues with anyone, including Bob Tisdale, but I confess to having little patience with argumentum ad hominem.
<<<<<<<<<<<<<<<<<<<<>>>>>>>>>>>>>>>>>>>>>>>>>>
Yes, I would like to see more discussion of natural processes, especially what process is the root cause of the ENSO fluctuations, which study seems to be neglected.
Perfect. Beautiful. Like I always say, it’s nice when a post/comment doesn’t have all the rhetorical finesse of a flaming douchecanoe.
“Each of the two PDO warm periods (1915-1945 and 1978-1998) and the three cool periods (1880-1915, 1945-1977, 1999-2014) lasted 25-30 years.”
As the HadCrut4 data clearly shows.
http://www.woodfortrees.org/plot/hadcrut4gl/plot/hadcrut4gl/mean:180/mean:149/mean:123/plot/hadcrut4gl/mean:720
Thanks, Don. However, I would just like to point out that we haven’t really had much temperature cooling so far (when compared to earlier cool phases) and we are nearly halfway through the current cool phase of the PDO. As I mentioned yesterday, though, it should be possible to remove the statistical effect of the PDO and quantify the residual trend.
While not in disagreement with a number of valid points in this article, its very title makes me feel like addressing a topic of root cause.
“The AMO has multi-decadal warm and cool modes with periods of about 30 years, much like the PDO.”
As a reminder to readers, the AMO is defined as a temperature index itself. For instance, while Wikipedia is generally a terrible source on climate topics, it’ll suffice for this, as may be quoted:
“Van Oldenborgh et al. derived an AMO index as the SST [sea surface temperature] averaged over the extra-tropical North Atlantic (to remove the influence of ENSO that is greater at tropical latitude) minus the regression on global mean temperature.”
(Generally northern latitudes warm/cool more than the equator during times of global warming/cooling; the AMO would actually follow a still more related pattern to global temperature history if the latter wasn’t commonly published in forms heavily adjusted towards hockey sticks by activists).
Does one temperature index (the AMO) follow a pattern related to the pattern in another temperature index (global or Northern Hemisphere) in this case? Certainly.
Meanwhile, though, for a deeper prime cause for the pattern in temperature history (such as the LIA, the double peak in 20th century temperature history, etc.), there is … this, including particularly the illustrations 1/3rd of the way down: http://img250.imagevenue.com/img.php?image=45311_expanded_overview2_122_15lo.jpg
Don,
I have a number of questions which hopefully you can provide some answers to.
It appears that you have used the 1945-1977 negative PDO period, and assumed that if this were to recur, from around the year 2000, you predict a future period of global air temperature cooling.
However, if you look at the global air temperature for that same period them amount of global air temperature cooling was less than 0.1 degrees. I cannot therefore see how you arrive at a plot indicating an approximate 0.7 degrees cooling as shown in your Figure 4 (bottom)?
Also in your Figure 4 (bottom), it is claimed that if the PDO replicated what occured in the 1880-1915 period there would be greater cooling than if a 1945-1977 event occurs, totalling almost 1 degree from current temperatures.
However, if you look at the PDO index for the 1880-1915 period and 1945-1977 period at:
http://en.wikipedia.org/wiki/File:PDO1000yr.svg
it is clearly evident that the 1945-1977 event appears to be more signfiicant and for a great duration.
My question therefore, is how did you arrive at greater global cooling for a less intense PDO event?
Also in Figure 4 (bottom) you claim the projected IPCC warming. This does not appear to relate to any IPCC data that I am aware they have published. Why has this data got such massive year on year variations? Are they now predicting specific PDO events or volcanic eruptions – I think we know that this is not the case. This also purports to show 0.5 degrees warming per decade, which I am also unaware that they have stated.
Finally you state “Tisdale’s conclusion that “cooling is not occurring from the peak around 2001 through 2010” is easily proven false by the Christopher Monckton graph below.”
I think you shot yourself in the foot there, as the graph shows neither cooling nor warming, although it shows a different time period to that stated.
David in Texas says
“Getting back to the science, is it possible that your differences might be more with the assertion that “it was clear that PDO drove global climate”? Might that not be an overreach? Is it possible that what is driving the PDO (index) might also be driving global temperatures?”
I had that same thought myself and it is certainly a possibility. Perhaps I ought to refer to the PDO as an ‘indicator’ rather than a ‘driver.’
Don
“If the flip of the PDO into its cool mode in 1999 persists, the global climate should cool for the next several decades. “
Met Office Chief Propagandist said something very similar in her recent “we’re not out of the woods yet” comment.
Seems that at least the M.O are expecting a fairly long “pause”. The other main agencies still seem to be “in denial” about the problem.
Bloke down the pub says:
January 21, 2014 at 6:25 am
Handbags at ten paces.
LOL!
I had that same thought myself and it is certainly a possibility. Perhaps I ought to refer to the PDO as an ‘indicator’ rather than a ‘driver.’
Don
That would seem to be more correct. Bob is convinced that ENSO is the driver but I would apply the same principal. I don’t accept that ENSO creates itself, though I do agree with Bob’s hypothesis that changes in frequency and magnitude of Ninjo/Ninja 😉 event provides a means of producing a positive (or negative) energy imbalance.
We should concentrate on asking what is driving ENSO.
This is the biggest red scarf trick in climate science. By calling all these things “oscillations” they apply logical slight of hand to equate this to some kind of pendulum which has no net effect.
Word games in the place of science.
Yes Nutterchelli , this means you.
I’m sorry, I’ve become a bit out of touch with these matters. Who is this [trimmed] Tisdale?
I would rather have dirty laundry aired in public as long as it’s productive. Thanks to all for making it so.
“Perhaps I ought to refer to the PDO as an ‘indicator’ rather than a ‘driver.”
Indeed. PDO (and AMO) are abstract quantities. Their sign is only a matter of convention rather than physics.
Using the term ‘indicator’ also removes the concept of ’causes something to happen’ which ‘driver’ implies.
What’s with the GISP2 graph? It’s well known that the top of the GISP2 temperature reconstruction is back during the Little Ice Age, the year 1855. But Figure 5 moves that up 100 years so all the dates and inferences are mistaken.
This current inter glacial period is very long in the tooth. If the history of glaciation continues to repeat the established patterns we will be praying for a some global warming very soon
Gregory says:
January 21, 2014 at 8:16 am
Bloke down the pub says:
January 21, 2014 at 6:25 am
Handbags at ten paces.
LOL!
Anthony, interesting that an article aimed at avoiding the ad hominem generates the above exchange, no? Adding absolutely nothing but ridicule, they both deserved a snipping, in my opinion.
Anthony, along, obviously, with my own comments should you reconsider theirs…
Several people have commented that although Monckton’s graphs show cooling over the past 17 years (he also shows two other time intervals, 2001-2013 and 2005-2012), it is quite small. The more recent time intervals seem to show some deepening of the cooling (-0.25 C per century). The interesting question here is whether or not the cooling will deepen more with time. I’ve thought a lot about the question of where long-temperatures are heading as we’ve thawed out from the Little Ice Age. Are we headed back to where we were over the most of the Holocene (a couple of degrees above recent temps) and then tamper off, or are we perhaps headed back into Maunder/Dalton type cooling? That’s why I showed several possible scenarios (guesses, really) for my cooling projections–any of them are possible. Time will tell–I can only hope I live long enough to see the answer!
Don J. Easterbrook: Thank you for describing the source of the dubious looking data that you presented in your Figure 4. You wrote:
If read that correctly, you used global land+sea surface temperature data through 1999 and then spliced on land surface temperature data from 1999 through 2010. No wonder it looks bogus. It’s not a continuous global land+sea surface temperature dataset. It’s a hybrid that you manufactured that has no basis in reality. Contrary to your claims, it certainly makes a difference as the gif animation I provided in my January 19, 2014 at 6:34 am comment showed quite plainly. Here it is again.
The following gif animation overlays continuous NCDC global land+sea surface temperature from 1900 to year-to date (November) 2013 onto your Figure 4. Can you see how the two datasets coincide through the late 1990s and then, where you spliced on land surface temperature data, the real data doesn’t show the fictional cooling that you presented? That’s the problem with your splicing land surface temperature data onto a global land+sea surface temperature dataset.
Now that you’ve explained the problem with your graph you may want to update your figure 4, using real data, and accept that you erred by splicing two completely different datasets together.
Additionally, I did not use ad hominem arguments. My statements were not about you as a person; they were about the bogus data/graph that you presented, and continue to present as real.
Last, you also forgot to discuss or correct your Figure 6 from the last post.
Gotta go. Only a short time for lunch.
BA says, “It’s well known that the top of the GISP2 temperature reconstruction is back during the Little Ice Age, the year 1855. But Figure 5 moves that up 100 years so all the dates and inferences are mistaken.”
Actually they aren’t. The top of the GISP2 core is 1950 (see the Stuiver-Grootes 1997 data set). Don’t confuse the oxygen isotope data with the temperature reconstructions of Cuffy and Clow and Alley.
On the last page of a new article I put forth a (very specific) challenge to climate modelers.
Multidecadal Spatiotemporal Aggregation Primer:
☼ Sun-Climate 101:
Solar-Terrestrial Primer ☼
= Trivial Extension of Milankovitch
Sun-Climate 101 outlines law-constrained geometric foundations of solar-governed “internal” (a counterproductive misnomer) spatiotemporal redistribution (stirring) of terrestrial heat & water at a fixed, constant level of multidecadal solar activity.
Those with sufficiently deep understanding will recognize this as a 4-dimensional geometric proof.
See particularly item #5 on page 3, which underscores stirring & accumulation even with a fixed, constant level of multidecadal solar activity due to shifts & persistence of (large scale) terrestrial circulation that are an inevitable consequence of solar frequency shift.
It’s trivial and it’s geometrically proven.
The attractors (central limits) would be the same whether scrambled by white noise, spatiotemporal chaos, &/or lunisolar oscillations (the latter of which stand out clearly in observations).
The utility of these fundamentals extends beyond generalizing the role of stellar frequency in planetary aggregate-circulation to assessing the vision, competence, functional numeracy, honesty, & relevance of climate discussion agents, including those abusing authority.
Mod please, dearieme says: at 8:20 am.
Pointless and totally uncalled for.
Greg says:
January 21, 2014 at 8:09 am
….Met Office Chief Propagandist said something very similar in her recent “we’re not out of the woods yet” comment.
Seems that at least the M.O are expecting a fairly long “pause”…..
======================
Might get an indication of how long as the MO are due to update their “Decadal Forecast” this month:-
“Decadal forecast – Forecast issued December 2012. The forecast will be updated in January 2014.”
http://www.metoffice.gov.uk/research/climate/seasonal-to-decadal/long-range/decadal-fc
dearieme says:
January 21, 2014 at 8:20 am
“I’m sorry, I’ve become a bit out of touch with these matters. Who is this arsehole Tisdale?”
Bob Tisdale is a well respected contributor to this blog and does not deserve profanities thrown at him. Profanities in a blogpost only shows bad language skills.
REPLY I agree, the comment has been trimmed. Dearime is now on moderation to prevent future issues- Anthony
Dearie’ll learn, a bright one.
======
Bob Tisdale,
Having seen the original graph, I don’t understand why you persist in calling it “bogus” — why are you apparently so intent on discrediting me rather than addressing the points being discussed here? Substituting more recent temp curves in fig 4 won’t make any significant difference.
As for Fig 6, if you don’t like it, throw it out–look at Monckton’s graphs and the other two figures. These are just illustrations showing that cooling is indeed happening–do you disagree with that?
Let’s stop this squabbling and move on to more productive discussions.
“Is it possible that what is driving the PDO (index) might also be driving global temperatures?”
I had that same thought myself and it is certainly a possibility. Perhaps I ought to refer to the PDO as an ‘indicator’ rather than a ‘driver.’
Don”
I had a spark. As a layperson pondering this stuff.
Fearing no ridicule and assuming my language can be deciphered.
Could the the combined gravitational, earth’s rotation and lunar pull influences be driving the variation in the PDO? Sort of the sloshing around effect that affects ever so slightly the oceans with every subtle or grand vertical and horizontal warm/cold transference.
It seems to me since the oceans are a massive loose liquid covering most of the earth and are subjected to tremendous influences that cannot be collectively stable variation is unavoidable.
Ok that’s enough. I may not get a bite.
Don,
Welcome to the world of ENSO monomania. Good luck with that.
Steve Oregon says:
January 21, 2014 at 8:56 am
I too have pondered this question. The lateral tides on Earth from Sun and Moon are something rarely discussed. This is, the horizontal component on the Earth’s surface of the combined gravity field. The vertical, aka Tides, are well discussed and have been dismissed as being any part of the global temperature (though having a 28 day Lunar cycle and using a monthly summary of temperature may hide that quite well).
The lateral forces though, operating as they do in high latitudes, could cause effects all the way down through the water column and cause North to South ‘sloshing’ of the lower, colder water.
I do not know if anyone has done research on the data to determine if this is the case though.
Greg says:
January 21, 2014 at 8:19 am
I had that same thought myself and it is certainly a possibility. Perhaps I ought to refer to the PDO as an ‘indicator’ rather than a ‘driver.’
Don
That would seem to be more correct. Bob is convinced that ENSO is the driver but I would apply the same principal. I don’t accept that ENSO creates itself, though I do agree with Bob’s hypothesis that changes in frequency and magnitude of Ninjo/Ninja 😉 event provides a means of producing a positive (or negative) energy imbalance.
We should concentrate on asking what is driving ENSO.
<<<<<<<<<<<<<<<<<<<<<<<<<<<<<<<<<>>>>>>>>>>>>>>>>>
You have put your finger on the primary issue: “We should concentrate on asking what’s driving ENSO.”
This site has seen a multitude of postings on this topic and none have adressed this important question. ENSO does not drive itself, so what is going on?
mpainter says: @ January 21, 2014 at 7:40 am
I challenge Judith Curry or anyone else to show any impact of anthropogenic CO2 on climate.
>>>>>>>>>>>>>>>>>
Note she did not say how much of an effect or if it could be measured. What she implied is negative feedback. She also did not say anthropogenic CO2.
You really have to watch the pea.
Ocean scientist Dr Francisco P. Chavez (originally from Peru and now at the Monterey Bay Aquarium Research Institute) likes to call the positive phase of the PDO – El Viejo, and the negative phase La Vieja. I think Bob rightly argues the primacy of El NIno events as the driving mechanism, but he would also agree that an El Nino event leaves warm water in the eastern Pacific. That warm water re-emerges every winter and contributes to a weakened east west temperature gradient and weaker Walker circulation and thus slower Trade Winds. Weaker Trade winds can not so easily constrain the warm pool in the western Pacific and thus allow for more El NIno events. The term El Viejo means old man and Dr. Chavez uses it to indicate that the positive PDO is a longer lasting (or mature ) after-effect of El NIno (boy) and as such it has a major effect on winds and currents and biological regime shifts.
@Don Easterbrook
Bob has a valid question. If in fact you spliced land only data onto land+sea data, then his labeling might very well be appropriate. Would you kindly address that issue?
Thanks for your consideration.
Greg says: @ January 21, 2014 at 8:19 am
…We should concentrate on asking what is driving ENSO.
>>>>>>>>>>>>>>>>>>>>>
Silly Wild Ass Guess
I would think it would be what happens down in the Antarctic specifically the winds and sea ice and Drake Passage.
This temperature image shows the tongue of colder water running along the edge of South America from the wind driven Antarctic Circumpolar Current.
Effect of the Drake Passage on the Cenozoic Glaciation of Antarctica (It is a model but interesting)
And another:
Anthony,
I think the best way to address this is to plot an updated temp curve and see if it makes any difference–I doubt that it will, but I’ll do it and see. It’s probably time to update that curve anyway–the only reason I left the old one in was because it was what I used in 2000.
Don
@Don
“the only reason I left the old one in was because it was what I used in 2000.”
I’d say it is long past due to update then.
Steve O.
Have a look at Length of Day (LOD) changes & AAM which is a ratio of North South to East West winds. LOD links to PDO & has links to other forces.
Gail Combs says:
January 21, 2014 at 9:15 am
mpainter says: @ January 21, 2014 at 7:40 am
I challenge Judith Curry or anyone else to show any impact of anthropogenic CO2 on climate.
>>>>>>>>>>>>>>>>>
Note she did not say how much of an effect or if it could be measured. What she implied is negative feedback. She also did not say anthropogenic CO2.
You really have to watch the pea.
<<<<<<<<<<<<<<<<<<<<<<<<>>>>>>>>>>>>>>>>>>>>>
What could she have meant, if not AGW and CO2?
dearieme says: @ January 21, 2014 at 8:20 am
I’m sorry, I’ve become a bit out of touch with these matters. Who is this [trimmed] Tisdale?
>>>>>>>>>>>>>>>>>>>>
http://bobtisdale.wordpress.com/
Bob is our resident expert on ENSO, oceans, El Niño and La Niña.
If I may be so old (yes,old) as to suggest “The rock that sticks up is ground down”
Except when it is strong (hard?) enough to leave its mark.Sometimes to the point of altering the flow…
And it remains to be seen how two rocks may effect this flow…
Meandering Thalweg says: @ January 21, 2014 at 8:31 am
This current inter glacial period is very long in the tooth….
>>>>>>>>>>>>>>>>>>>
That has been covered here too by William McClenney.
He wrote the following WUWT threads:
http://wattsupwiththat.com/2011/01/05/on-“trap-speed-acc-and-the-snr/
http://wattsupwiththat.com/2010/12/30/the-antithesis/
http://wattsupwiththat.com/2012/03/16/the-end-holocene-or-how-to-make-out-like-a-madoff-climate-change-insurer/
http://wattsupwiththat.com/2012/10/02/can-we-predict-the-duration-of-an-interglacial/
RichardLH says: @ January 21, 2014 at 9:08 am
I too have pondered this question. The lateral tides on Earth from Sun and Moon are something rarely discussed….
>>>>>>>>>>>>>>>>
Doesn’t even register in a search. The best discussion I have seen is over at E.M. Smiths Lunar Resonance and Taurid Storms and Lunar Cycles, more than one… Of interest in this discussion Why Weather has a 60 year Lunar beat
Hi Don
Each of the two PDO warm periods (1915-1945 and 1978-1998 ) and the three cool periods (1880-1915, 1945-1977, 1999-2014) lasted 25-30 years. If the flip of the PDO into its cool mode in 1999 persists, the global climate should cool for the next several decades. “
1978-1998 is 20 years.
Anthony,
I agree. I’ve had a lot of publication deadlines the past few years so that didn’t make it to the top of the priority list, but, yes, it is indeed time for an update. I’ve been out of town all of the past month and three out the past four months so am presently wading thru a mountain of things requiring my attention that were awaiting me when I returned home this weekend. I’ll get to the update as quickly as I can.
Don
Bob Tisdale
Re: “I did not use ad hominem arguments”
I second Don’s observation that you did. e.g. you stated:
“Easterbrook’s post is misleading, it misinforms, it is contrived, it is far from good science”
“Easterbrook does more to mislead and misinform than to teach and inform”
not only is Figure 6 not the best way to show it, it’s misleading.
“He insists on misinforming readers”
These are ad hominem abusive attacks against Easterbrook’s character, inferring bad or evil character. See definitions of:
Mislead>
Misinform
You further stated:
“It’s bogus!”
“But I suspect it does not exist. I suspect it’s a fantasy dataset”
“. . .HADCRUT is based on data. Easterbrooks fantasy version is obviously not.”
“Easterbrook’s bogus-looking global temperature anomaly data”
This is another ad hominem abusive attack against Easterbrook’s character accusing him of concocting data, and contriving misleading data. See:
Bogus
Fantasy, definition:
That borders on serious libel against Easterbrook’s professional reputation as a scientist.
Libel
May I encourage you to actually study ad hominem attacks so you can avoid them. e.g. see The Fallacy Detective
To persuade people to your scientific argument, you need to make friends not enemies. e.g. see Dale Carnegie
May I encourage you to build your “Emotional Intelligence.”
e.g. study “Emotional Intelligence: Why it can matter more than IQ” Daniel Goleman
For Easterbrook’s subsequent work that incorporates much more on AMO etc. see
Don Easterbrook‘s Publications Climate Change e.g.,
Ch 5, Relationship of multidecadal global temperatures to oceanic oscillations
PS Matthew W
Why falsely attack me over not listening to the scientific debate when I made a statement on Tisdale’s using ad hominem logical fallacies and intemperate language? See my above followup to Tisdale. I recommend that you study logical fallacies so you can avoid them, and study how address a logical argument. I would also encourage you to build your emotional intelligence and persuasion skills. I’m still learning.
Ben Wouters says:
January 21, 2014 at 6:25 am
Thanks for the excellent chart of Cretaceous & Cenozoic temperature reconstruction.
I’d be interested in your explanation for the hot water then & Oceanic Anoxic Event 3, during Coniacian-Santonian time of the Late Cretaceous. The standard school solution of course involves volcanism & CO2.
mpainter says: @ January 21, 2014 at 9:55 am
What could she [Dr Curry] have meant, if not AGW and CO2?
>>>>>>>>>>>>>>>>>>>
That is why I said watch the pea. CO2 has many many sources. Mankind is a very small part. 117 ppm vs 350.2 ppm (natural) from a chart “adjusted for heat retention characteristics” and that is if you swallow what the IPCC crowd is telling you.
Here is the log graph for CO2 from Lindzen and Choi: http://joannenova.com.au/globalwarming/graphs/log-co2/log-graph-lindzen-choi-web.gif
Those two points combined means CAGW or even AGW is a tempest in a thimble. (It doesn’t even rate a teapot)
Dr. Curry knows all this but she is also good at playing politics.
Ocean CIRCULATION issues such as ENSO, PDO, AMO CYCLES are only products,
indicators, effects and results of other true CLIMATE DRIVERS.
All curve fitting exercise on a SIMULTANEOUS OCCURENCE does not prove
CAUSATION! Exactly the same applies with CO2: No causation is proven by curve
fitting exercise! The true climate drivers are determined in: Joachim Seifert “End
of global warming”. Detailed calculations are given, easy to follow. The booklet is
uncontested, unrefuted, take a look and try. JS.
Don
I reconstructed CET from its instrumental level of 1659 back to 1538 and hope to get it back to 1450 in next few months. I would be curious as to how well you believe it correlates with your graph.
http://wattsupwiththat.com/2013/05/08/the-curious-case-of-rising-co2-and-falling-temperatures/
Presumably as the oceans flip from cool to warm (and vice versa) different places will react differently with their climate as dry weather becomes wet and vice versa.
Has anyone ever looked to see which countries respond to the changing ocean and how that manifests itself with temperatures?
tonyb
Don says
I don’t know what causes the PDO nor does anyone else, including Tisdale.
henry says
well, just for the record, I lhad long figured out that in the end the PDO, AMO< ENSO, etc
all depend on what, in due time, is let through the atmosphere.
In this respect it might be an eye opener to read what I found was merely a confirmation of what had already been established by a report in William Arnold in1985
(100% correlation of the Gleisberg solar cycle by solar-planetary forces)
http://blogs.24.com/henryp/2013/04/29/the-climate-is-changing/
Does anyone perhaps know what happened to William Arnold?
Gail Combs says:
January 21, 2014 at 10:32 am
<<<<<<<<<<<<<<<<<<<<<<<<<<>>>>>>>>>>>>>>>>>>>>>>>>>
and so full circle: I challenge anyone, Dr. Curry included, to show that anthropogenic CO2 affects climate.
“Profanities in a blogpost only shows bad language skills.”
Too generous when directed at a fellow human being, especially a man like Bob T. Goes to character (of the commenter).
“All other things being equal, adding more greenhouse gases to the atmosphere will have a warming effect on the planet,” Judith Curry, a climatologist at the Georgia Institute of Technology, told the Los Angeles Times. “However, all things are never equal, and what we are seeing is natural climate variability dominating over human impact.”
She’s right of course, but what Judith often fails to mention is the insignificance of the warming man adds via CO2, one third of the IPCC positive feedback-based predictions so naturally it will get lost in any natural noise. Long term cycles will more than drown out AGW and so even overarching multidecadal trends are hopeless for measuring CO2 based warming unless we can fully account for all multidecadal oceanic/solar etc cycles. Not to mention the fact that CO2 gets absorbed in to the environment and CO2 measurements via ice cores are inaccurate regarding past CO2 concentrations as CO2 diffuses through the ice, making even their CO2 increase estimates dodgy.
The Holocene climactic patterns show we’re at the peak of an optimum due for a descent into another ice age, no amount of CO2 is going to stop that.
A key tactic of the globalists is to insert shills/trolls into Skeptic’s blogs to start creating division. Their goal is to divide and conquer via the creation of opposing factions and arguments.
A similar, more effective tactic if they can pull it off is to convince a high profile truth advocate to ‘turn’ to the dark side at the right time derailing the movement.
This has worked well in other ‘truth’ movements where high profile scientists have inexplicably changed their minds and started using ludicrous anti-science arguments tinged with rabid ad hominems.
I’m sure Bob is nothing of the sort, he’s a great scientists and fighter for truth but we must be careful to prevent the same symptoms occurring via innocent misunderstandings.
I disagree. Monckton has used one dataset (at least he cites his source) which shows a negative trend of -0.02 degrees per century since 1996. This trend is nowhere near close to being statistically significant. The trend is indistinguishable from ZERO.
No – let’s not. Let’s try and establish exactly what data your Fig 4 is using, i.e.
1. What data is represented by the graph for the period 1900-2000.
2. What data is used for the 2001-2010 period?
Note that your graph shows that 2000-2010 temperatures were consistently lower than those in the 1990s. You write
Which ground measurement data?
Like, Bob, I believe your graph is reconstructed from bogus data and nothing you have written above has altered that fact.
Don
You said
“Each time the PDO was warm, global climate warmed; each time the PDO was cool, global climate cooled.”
I would suggest
“Each time the PDO index was positive, global climate warmed; each time the PDO index was negative, global climate cooled.”
Don
You are one of the pioneers who recognized that climate runs in warm and cool phases and the decades ahead are more likely to be one of cooling rather than of warming. You were right when others in your field leaned the other way [some even do still as you have found out]. With respect to being able to correctly predict the cooling curve, I do not have problem here. No one is getting the prediction curve right. The key aspect of your work was that you correctly predicted the cooling trend leading to a 30 year or so pause, completely opposite of those alarmist projections and you are right on.
Bob Tisdale has criticised Don Easterbrook’s graph. A lot of people, including many who are sceptical of CAGW, agree with Bob. This is a graph of the UAH satellite record presented by Roy Spencer
http://www.drroyspencer.com/latest-global-temperatures/
Note that the 2001-2010 period is consistently warmer (1998 apart) than the 1991-2000 period. All other datasets show a similar pattern. The Easterbrook graph (Fig 4), however, shows the 1990s warmer than the 2000s. Is it not reasonable, then, to ask for the source of the data? … and if the information is not forthcoming to conclude that the data is effectively made up?
Even in this “setting the record straight” article, Don Easterbrook still hasn’t clarified the source of his data.
Personally, I would like to avoid making much of the PDO as a climate factor because all definitions of it that I have seen are too nebulous. If you need to measure twenty or thirty quantities to determine its state you are pretty far from what the climate is doing. What interests me, however, is the reference to cooling from 1945 to 1977 that is attributed to the PDO above. It does not look like cooling in every climate chart. Checking it on BEST global surface temperature chart that superposes four sources – GISS, Met Office, NOAA, and the Japanese Met Agency, there is a slight upward trend but certainly no cooling. That BEST chart also shows beautiful agreement among the four sources on the location of El Nino peaks from 1880 to 2009. Miller just says that “irregularities” of different temperature curves coincide. Irregularities they are not – what it shows is that the ENSO oscillation affects North America, Europe and Japan.equally. The only cooling involved in mid-twentieth century is the one that terminated the early century warming in 1940. That is the one responsible for the very cold winters of World War II that most temperature graphs show as a heat wave. From 1945 on we have recovery from that cold snap but temperature does not reach the previous peak again until about 1980. It is helped there partly by a step warming attributed to the PDO phase change in 1976. That is said to have raised global temperature by 0.2 degrees Celsius. It is hard to pick it out among all the El Nino peaks there. After 1980 all temperature curves are falsified and show you a fake warming when in fact there was an 18 year hiatus there, from 1979 to 1997. That fake warming just happens to cover the time period of James Hansen’s presentation to the Senate.
I believe Bob Tisdale had the best intentions. He just does not like misuse of his favorite terms; like combining PDO and AMO into a meaningless mix and comparing it against global temperature. PDO is a spatial pattern; AMO is a detrended SST. Cumulative ENSO creates PDO phase and not vice versa; etc.
pause [pawz]
noun
a temporary stop or rest, especially in speech or action: a short pause after each stroke of the oar.
The use of the term itself is indicative of bias. It suggests certainty that the warming will resume, for which there is no scientific basis. The models being used did not correctly predict the current situation, thus it is completely unscientific to assert that they are still a valid predictor, not to mention ludicrous on its face.
Tonyb says: “I reconstructed CET from its instrumental level of 1659 back to 1538 and hope to get it back to 1450 in next few months. I would be curious as to how well you believe it correlates with your graph.”
I’ve plotted the CET to 1659 (you need to blow it up considerably to extract the details, but it gives a very nice correlation with the data I’ve used). It shows the Maunder, 1700-1735 warming, Dalton coooling, 1850-1875 warming, 1875-1900 cooling, 1900-1950 warming, 1950-1975 cooling, 1975-2005 warming, and 2005-2013 cooling. All of these show up in my GISP2 ice core plot.
I would be much interested in what you find back to 1450.
Don
Don Easterbrook says, January 21, 2014 at 8:09 am:
“Perhaps I ought to refer to the PDO as an ‘indicator’ rather than a ‘driver.’”
This is the crux of the disagreement between you two …
PDO is in its essence merely an ‘indicator’, simply because it’s just an index portraying a certain variable SST pattern manifesting itself in the northern Pacific Ocean.
Thus, it does not represent an actual ‘physical process’ like ENSO.
PDO, however, is clearly an indicator of something big going on, of huge, abrupt and pan-Pacific climate regime shifts occurring at certain intervals that affect climate on a global scale.
There is evidence to suggest, though, that this basinwide decadal variability (let’s call it PDV), has its origin in the tropics rather than in the northern Pacific. The major climate shift of 1976/77 is a good case in point.
David L. Hagen says:
January 21, 2014 at 10:27 am
Bob Tisdale
Re: “I did not use ad hominem arguments”
I second Don’s observation that you did. e.g. you stated:
“Easterbrook’s post is misleading, it misinforms, it is contrived, it is far from good science”
“Easterbrook does more to mislead and misinform than to teach and inform”
not only is Figure 6 not the best way to show it, it’s misleading.
“He insists on misinforming readers”
These are ad hominem abusive attacks against Easterbrook’s character, inferring bad or evil character. See definitions of:
Mislead>
: to cause (someone) to believe something that is not true
Misinform
: to lead astray : give a wrong impression
You further stated:
“It’s bogus!”
“But I suspect it does not exist. I suspect it’s a fantasy dataset”
“. . .HADCRUT is based on data. Easterbrooks fantasy version is obviously not.”
“Easterbrook’s bogus-looking global temperature anomaly data”
This is another ad hominem abusive attack against Easterbrook’s character accusing him of concocting data, and contriving misleading data. See:
Bogus
not genuine : counterfeit, sham
Fantasy, definition:
the faculty or activity of imagining things, esp. things that are impossible or improbable.
That borders on serious libel against Easterbrook’s professional reputation as a scientist.
Libel
a published false statement that is damaging to a person’s reputation; a written defamation.
David L. Hagen says:
May I encourage you to actually study ad hominem attacks so you can avoid them. e.g. see The Fallacy Detective. .
You would be well advised to take your own advice. Except for the part about “The Fallacy Detective”. Haven’t read it, but it does not look particularly rigorous and that you suggest its use implies that it is the source of your own misapprehension on the matter. Reference to a proper philosophy text would likely have prevented you from calling out the things you did as ad hominem arguements. They are not.
Tisdale’s arguments were against and formed from the substance of Easterbrook’s post. The language he used was IMO something less than polite, perhaps ‘abusive’ in some eyes. Be that as it may, that is not ad hominem fallacy.
I generally agree with the findings of Dr. Easterbrook. I too have done some analysis of this very interesting phenomena. see http//www.bcclimate.com. I did some analysis of the PDO a few years ago (see website), and found a remarkable signal. I think that perhaps the most influence of the PDO itself is on the west Coast of North America. Of course the whole planet is teleconnected, but for the PDO the signal seems somewhat weaker than ENSO, for instance. That said, I believe most of the changes we have seen over the past one hundred years or so are linked to the Sun. And, as we are now (as I understand it) heading into a period of lower Sun activity, we should has Dr. Easterbook states, be expecting an overall cooling of the climate.
Don J. Easterbrook,
Would you be so kind and explain where the data in the post-2000 portion of your Fig.4 comes from, or what it respresents? Is this supposed to show actual observations from the late 90’s to present?
Thank you
Greg says: “We should concentrate on asking what is driving ENSO.”
The rotation of the Earth is driving ENSO.
jorgekafkazar says:
January 21, 2014 at 12:21 pm
Greg says: “We should concentrate on asking what is driving ENSO.”
The rotation of the Earth is driving ENSO.
><<<<<<<<<<>>>>>>>>>>>>>>>>
Bah! Impossible! The earth’s rotation is diurnal, ENSO is irregular at intervals of years.
A general observation: Could we stop using the term (word) “pause” to describe the lack of warming? Although the root of the word (Greek “pausis”) meant “a stopping” or an “ending,” the modern definitions are “temporary stop,” “break,” “rest,” “hesitation,” and “interruption,” which directly implies a later continuation of that which has paused. Could we use terms such as “cessation,” “stall,” “indefinite stop,” or some such expression that doesn’t implicitly stipulate that warming WILL continue after a pause? I understand that warming MAY continue, but it isn’t a certainty, is it?
I see the AGW Hoax has plenty of apologists and defenders even here at WUWT …
Don Easterbrook: A couple of days ago, I believe I determined how your graph (the disputed Figure 4) was created, but I was waiting for your reply to my comments. You threw me off with your statement in the post above that you had spliced land surface temperature data onto the end of the global land+sea surface temperature data, but it couldn’t have been land surface temperature data because that continued to climb higher.
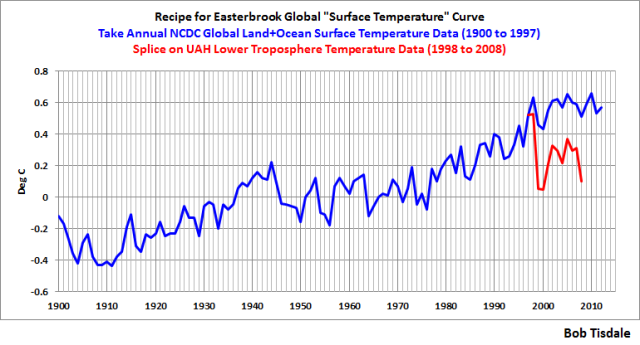
The following graph illustrates how you created your Figure 4. You presented land+sea surface temperature data through 1997. Then you spliced on lower troposphere temperature (TLT) data, starting in 1998 and ending in 2008. My graph (if we excluded the continuation of the surface data) is remarkably close to your Figure 4, especially when you consider the recent changes to the UAH TLT data and the 2008 changes to the NCDC sea surface temperature data. I suspect that if you go back to your old spreadsheet you’ll discover that’s what you did.
As shown, the global TLT data after your splice is in no way similar to global land+sea surface temperature data, so your Figure 4 is not a true representation of the global land+sea surface temperature record and would be confusing to anyone new to the instrument temperature record here at WUWT.
I tried to call your attention to the problem two and a half years ago in my post Comments On “Easterbrook on the potential demise of sunspots”, which Anthony linked to your post at that time. I sure wish you had corrected the problem back then. It would have saved me a lot of time and grief over the weekend. And it would have saved you the need to write this blog post.
In your reply to me above, you wrote:
I can’t throw it out, Don. It’s in your post, not mine. And as far as I know, we don’t delete stuff here at WUWT. We add updates, noting any errors. May I suggest that you add a note to that post from a few days ago, indicating the color-coding on the graph is in error. That way, newcomers to WUWT who are trying to learn won’t be confused or misled by that graph.
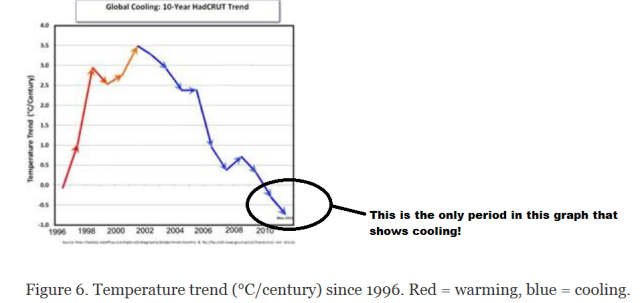
Pointing to Christopher Monckton’s graphs doesn’t solve the problem either, Don. The problem is you color coded a portion of your Figure 6 as being a cooling trend, when, in fact, the 10-year trends from about 2001 to about 2010 are above zero, meaning global surface temperatures had warmed during those 10-year periods. The only time the trend graph shows cooling is when the data points are less than zero. Granted, they were warming at reduced rates as they approached 2010, but they were still warming. See the illustration below, once again.
Don, you wrote in your post:
In reality, Don, on numerous occasions, I’ve provided reasonably easy-to-understand descriptions of how the PDO pattern (upon which the PDO data is based) is created. During an El Niño, coastally trapped Kelvin waves and other changes in atmosphere circulation cause the sea surface temperatures of the eastern North Pacific (near the west coast of the United States and Canada) to warm. The reversal of trade winds in the western tropical Pacific during the El Niño causes less warm water than normal to be transported poleward by the western boundary current in the North Pacific (the Kuroshio Current along the southeast coast of Asia). That reduction in the poleward transport of warm tropical waters in turn causes the cooling in the western and central North Pacific along the Kuroshio-Oyashio Current. Thus the positive PDO spatial pattern (warm in the east, and cool in the western and central portions of the North Pacific). See, it’s easy to explain.
For a La Niña, it’s just about the opposite, but much of the left over warm water from the El Niño gets spun up into the Kurosion-Oyashio extension during the trailing La Niña, and that explains much of the warm water in the western and central North Pacific during the “cool” PDO pattern.
However, because sea level pressure (and the interdependent surface wind patterns) also impact the PDO spatial pattern, the PDO data has a slightly different pattern in time than an ENSO index.
As for this post, you’ll have to make that decision after you update your Figure 4…as you have agreed to do at Anthony’s request.
In closing, once again, let me congratulate you for predicting the cessation of global warming.
Regards
Nature and time will ultimately prove whether or not my all of my predictions are correct.
And when they are proven horribly wrong?
what then???
what will you do when your economy collapses and food riots ensue, when people all over the planet have to shelter indoors to avoid heat stroke and we know that we are only just beginning to experience the increasing warming that has been locked in for the next 100 years or so.
what are you going to do when the Amazon rainforest burns, and plumes of methane erupt from the arctic?
in your figure 5 data from Struvier and Grootes (1997) you say you are using GISP2 data.
In tabulated GISP2 data it clearly says, Minimum age = .037Ky BP
That is 37 years “before present”
For GISP2 the before present is 1954
therefore, in your graph, you have erroneously shifted your timeline about 40 years toward the present because if you didn’t it wouldn’t fit your theory. This is such a simplistic error, it shows that you are really not doing science and really need to get some further education on the subject.
really, you work so hard on this stuff but in the end it is all a big deception, when are you going to stop?
What are you going to do when you realize that you helped to kill your own children?
Please forgive a novice question from a lurker…..
If you assume that Don has correctly identified a long-term cooling and warming cycles that occur on (roughly) a 27-30 year period.
And if you further assume that Bob’s Air-Sea temperature charts correctly do NOT show that cooling started around 2000, but that temperatures merely flattened (MAYBE slightly down to 2014).
Then can you theorize that the reason that the expected decrease in temeperature did NOT occur might be because of manmade increase of CO2?
That way, everyone is “right.” the warmists AND the doubters.
Bloke down the pub says: “Handbags at ten paces.”
Thanks. That’s very funny!
” The point here is I start with recognition of the existence of the PDO and it really doesn’t matter what the cause is—that’s a separate issue. Tisdale’s interpretations of the relationship of ENSO to the PDO may well be correct, but that does nothing to invalidate the data that I presented. ”
Dr. Easterbrook and Mr. Tisdale, while I appreciate the contributions you both have made I think one needs to take a broader view. The IPCC does too. Looking for a “cause” of climate change is a misnomer of “cause”. The earth, as part of the solar system, is a giant thermodynamic machine. “How” it operates is the question, along with understanding of how the details of the operation affect things we might measure or observe such as temperature or weather. The cause is obvious- the sun and the water/atmosphere on the surface of the earth interact in a very complicated way to produce weather and climate. Just look at the moon- no real climate change there.
A simplistic analogue might be a car factory, or better a petrochemical plant. At the factory a car rolls out every minute or two. What causes a car to come out? The driver? or the motor of the car? or the processes in the plant working together? In a large chemical plant a few inputs such as methane, oil, water, air get taken in. At other points out comes a tanker of vinyl chloride or a tanker of gasoline, or a truckload of polyethylene pellets. What causes the outputs? the workers? the various networks of pumps, tanks, and reactors? or the processes in the plant- distillation, catalysis, heat, pressure, sedimentation, etc.?
Ever since the UN Framework Convention assumed a cause for climate variations we’ve been fighting an uphill battle for the science to explain it. Until we can explain how the climate system works and predict(whatever is a suitable measure) is going to be affected we are most likely going to make bad decisions.
Thanks Dr. Easterbrook for the temperate, civil post.
jai mitchell says: “What are you going to do when you realize that you helped to kill your own children?”
Grow up, jai. You might want to peddle that claptrap somewhere else where people might listen to you.
Adios.
One can take no comfort from seeing Don J. Easterbrook and Bob Tisdale going at each other, hammer and tongs. Still at least neither of them is saying anything ridiculous, like, “Carbon Dioxide caused catastrophic global warming”!
Well come on Jai Mitchell tell us how to fix or mitigate YOUR CAGW. Should be a hoot. But remember the non OECD will emit 16 tonnes of co2 to the OECDs 1 tonne until 2040. So pack your bags and do your protesting in China or India. Unbelievably stupid post.
Data sources need to always be shown. It is highly suspicious to present findings and then not show source data.
It is no different to another crowd and it sets science back.
Charles Hart says: “Bob Tisdale, is Don missing something?”
See my comment above at January 21, 2014 at 1:13 pm.
Charles Hart says: “Besides, Tisdale, who would disagree with you and in what way?”
Anyone who understands the difference between ENSO and the PDO would disagree on that matter, but Don has now addressed that.
sabretruthtiger says:
January 21, 2014 at 11:03 am
….The Holocene climactic patterns show we’re at the peak of an optimum due for a descent into another ice age, no amount of CO2 is going to stop that….
>>>>>>>>>>>>>>>>>>>>>
More like head for the expiration date. graph
ARGGHHHHH
And STILL the use of HadCrut as if its actually representative of past (pre-1979) temperatures !!
Seriously ??????
Don Easterbrook: My apologies for being rude in my responses to you on that thread.
I will also ask that you correct your Figure 6 in the prior thread and update your Figure 4 on this thread and the former thread quickly. It should take less than 1/2 hour of your valuable time, and will put an end to this discussion.
Louis LeBlanc says: #
January 21, 2014 at 12:42 pm
A general observation: Could we stop using the term (word) “pause” to describe the lack of warming?…
>>>>>>>>>>>>>>>>>>>>>>
Perhaps we should us a word to describe the slow down and halting of the change in the rate of warming.
ntesdorf says:
January 21, 2014 at 1:56 pm
================================
On the contrary, the most informative and trustworthy blogs are the argumentative. The open argument distinguishes between lecture and learning, preaching and practice. Elsewhere the warm-mongers meet in cloistered conclave to conspire and adjust and fight off FOI requests. Church and state have never been so united. We breathe freely at WUWT. –AGF
While adding the same period again illustrating a future cool PDO, cooling global temperatures in future may not be ideal, but it gets the idea presented.
What is much better though is representing how the PDO, global temperatures and ENSO behave using real data up to now using smooth 121-month filter. (just mention the data set for Nino4.3 used here maybe not correct, but also might be correct.)
The graph shows firstly global temperatures rise with the warmer phase of ENSO and cool with the cooler phase of ENSO. Even if I had used HADSST2 it would have still showed this, but had no trend overall unlike this data set.
How about the PDO?
The graph show periods where the PDO increase ENSO increase and global temperatures increase. Likewise where the PDO decreases ENSO decreases and global temperatures decrease or remain steady. Predicting this pattern in future with the PDO, ENSO and global temperatures, already hinting what a next negative PDO phase would show. That is a slight cooling with negative PDO, but only based on if solar levels had remained similar. Solar activity looks like becoming much less active so a negative PDO will have a greater affect. While I am not claiming a indices like PDO itself represents cooling and warming because it doesn’t.. What it does represent is the trend with persistent Nino3.4 periods and that is where the warming and cooling trends come from.
Error, all Nino3.4 of course.
Jeff Dorsai says: @ January 21, 2014 at 1:00 pm
I see the AGW Hoax has plenty of apologists….
>>>>>>>>>>>>>>>>>>>>>..
It is called not shooting an ally in the back especially after she has just been in a Senate hearing and her testimony has been called “Ani-science” by Michael Mann.
Yep – It looks very much as though that’s what’s been done. TLT anomalies have, apparently, been spliced on to the end of a series of NCDC anomalies. Staggering!
It appears, from your post, that Anthony is now requesting that the graph should be corrected so I’ll refrain from commenting further.
dearieme says: “I’m sorry, I’ve become a bit out of touch with these matters. Who is this [trimmed] Tisdale?”
This [trimmed] Tisdale is someone who has explained and illustrated ad nauseam what the PDO is and what it is not. And this [trimmed] Tisdale is intimately familiar with global surface temperature data and can spot something unusual in a graph that does not fit the present understanding of the instrument temperature record. This [trimmed] Tisdale is someone who is usually very patient, but last Friday my patience departed and I was rude to Don Easterbrook. But this [trimmed] Tisdale has apologized for being rude.
Cheers!
Don Easterbrook says: “Perhaps I ought to refer to the PDO as an ‘indicator’ rather than a ‘driver.’”
That would be perfect.
I wish someone could give a link to the GISP 2 data end points that makes sense. We have a supposed 1950 end point but also a 1855 end point as well. Can anyone explain the difference? And in layperson’s language please ?
The kids at the table are noisy.
Gail Combs:
I write to support your comment at January 21, 2014 at 2:44 pm.
You were supporting Judith Curry who was attacked for this
Anybody who considers the matter dispassionately reaches the same conclusion.
Indeed, I have said similar – indeed, used very similar words – on WUWT without having seen her words.
http://wattsupwiththat.com/2014/01/12/global-warming-is-real-but-not-a-big-deal-2/#comment-1533823
Richard
Greg says: “We should concentrate on asking what is driving ENSO.”
There are a number of brilliant people researching that. One of the big problems is that El Nino events can be very different from one El Nino to the next. There are a number of theories about the underlying processes. Some might appear in one El Nino and others in the next one.
A prime example is the 1986/87/88 El Nino. According to the delayed oscillator theory, an upwelling (cool) Kelvin wave should have followed the 1986/87 portion and helped terminate that central Pacific El Nino after the first season–turning it into a La Nina. But a downwelling (warm) Kelvin wave came scooting across the equatorial Pacific in 1987 and turned the central Pacific El Nino into a stronger east Pacific El Nino.
Luckily, there are many of the basic ENSO processes that remain the same…on top of chaos.
milodonharlani says:
January 21, 2014 at 10:28 am
Ben Wouters says:
January 21, 2014 at 6:25 am
Thanks for the excellent chart of Cretaceous & Cenozoic temperature reconstruction.
I’d be interested in your explanation for the hot water then & Oceanic Anoxic Event 3, during Coniacian-Santonian time of the Late Cretaceous. The standard school solution of course involves volcanism & CO2.
———————————————————————————-
I take it you mean volcanism in the earths crust beneath the ocean rather than terrestrial?
jai mitchell says: @ January 21, 2014 at 1:17 pm
….what will you do when your economy collapses and food riots ensue, when people all over the planet have to shelter indoors to avoid heat stroke….
>>>>>>>>>>>>>>>>>>>>>>>>>>>>>
Oh good grief what utter rubbish!
We are in a CO2 starved time period causing carbon starvation in glacial trees and the evolution of C4 plants. Given the Solar energy reached a summer maximum (9% higher than at present) ~11 ka ago an anemic amount of CO2 is meaningless. If we are really really lucky (and you are correct) CO2 might keep the earth from heading into the next glaciation.
WHERE THE REAL DEBATE IS:
1.) Most scientists on both sides of the debate agree with the Milankovitch cycles. Gerard Roe did a recent modification that took care of the objections SEE: http://motls.blogspot.com/2010/07/in-defense-of-milankovitch-by-gerard.html and http://culter.colorado.edu/~saelias/glacier.html
2. ) Most scientists on both sides agree we are near the half precession point and solar energy at the earth surface in high summer at 65N is declining.
3.) The sticking point is what minimum level of solar energy in summer at 65N is the threshold for the descent into an ice age. The latest I have seen is “Comparison [of the Holocene] with MIS 19c, a close astronomical analogue characterized by an equally weak summer insolation minimum (474Wm−2) and a smaller overall decrease from maximum summer solstice insolation values, suggests that glacial inception is possible despite the subdued insolation forcing, if CO2 concentrations were 240±5 ppmv (Tzedakis et al., 2012) “ link
4.) The fourth point that no one is talking about is how unstable the weather becomes near that threshold. The general point of view is the climate has two stable states, warm and cold. That is it is bi-stable like a sail boat that is right side up or upside down. When it is in the in-between state the climate can swing wildly. This means approaching that threshold point can be as bad as crossing it. Note the steep inclines and declines in temperature in the geologic record. – graph
Even Woods Hole Observatory warned about wide temperature swings a few years ago and that politicians maybe barking up the wrong tree.
Even your side of the debate can see glaciation is possible.
Or if you prefer Dr Robert G. Brown at Duke Univesity link
Mike Fayette says:
January 21, 2014 at 1:21 pm
…Then can you theorize that the reason that the expected decrease in temeperature did NOT occur might be because of manmade increase of CO2?…
>>>>>>>>>>>>>>>>>>>>>
Too many variables. For one thing the Earth is still gently warming out of the Little Ice Age. Also CO2 has pretty much shot its wad: Log chart of temperature response to CO2
Third the “C” in CAGW was from water feed back that supposedly ‘Amplified’ the effect of CO2. That has been disproved. There is no tropical hotspot and water vapor in the air has not gone up as theorized.
You might want to read Dr Jeff Glassman on the subject:
http://www.rocketscientistsjournal.com/2006/10/co2_acquittal.html
http://www.rocketscientistsjournal.com/2007/06/on_why_co2_is_known_not_to_hav.html#more
ntesdorf says: @ January 21, 2014 at 1:56 pm
One can take no comfort from seeing Don J. Easterbrook and Bob Tisdale going at each other, hammer and tongs….
>>>>>>>>>>>>>>>>>>>>
Welcome to science. This is civilized compared to some of the meetings I have been in.
FrankK says:
January 21, 2014 at 3:13 pm
The usual explanation for high sea level during much of the Cretaceous is indeed thermal expansion from the submarine volcanism associated with active seafloor spreading during the Period as the continents continued rapidly drifting apart. But terrestrial volcanism has also by some been cited as a factor in the high air temperatures, lack of ice & exceptional equability of the Cretaceous, ie its shallow temperature gradient from equator to poles.
A study that seems quietly to have disappeared attributed these conditions, which CO2 based models can’t reproduce ()despite pretty high concentrations then), to lack of biological productivity in remarkably hot mid-Cretaceous oceans, leading to a lack of cloud concentration nuclei. Of course the Team’s GIGO GC models don´t do clouds.
AndyG55 says: @ January 21, 2014 at 2:27 pm
ARGGHHHHH…
>>>>>>>>>>>>>>>>>>>>>
I was thinking the same thing. We have no idea what the temperature is actually doing.
Other data:
Northern Hemisphere Snow
October http://www.ncdc.noaa.gov/sotc/service/global/snowcover-nhland/201310.gif
November http://www.ncdc.noaa.gov/sotc/service/global/snowcover-nhland/201311.gif
December http://www.ncdc.noaa.gov/sotc/service/global/snowcover-nhland/201212.gif
January: http://www.ncdc.noaa.gov/sotc/service/global/snowcover-nhland/201301.gif
February http://www.ncdc.noaa.gov/sotc/service/global/snowcover-nhland/201302.gif
and
March http://www.ncdc.noaa.gov/sotc/service/global/snowcover-nhland/201303.gif
Movements of the Koppen climate bounderies for Midwest USA (less ocean effects)
http://www.sturmsoft.com/climate/suckling_mitchell_2000_fig2_3.gif
I too like the reference to the PDO as an indicator rather than a driver. I do think, as I said before the PDO has much more influence in Western North America than elsewhere for obvious reasons. I have also have seen some references for an absence of at least the El Nino part of Enso about 5,000 BP? Any comments on that anyone?
Gail Combs says:
January 21, 2014 at 3:38 pm
Thanks for the excellent graph.
I’d add that in the water planet’s complex climate system, data obtained in dry air in a laboratory are unlikely to obtain in wet & wild nature. For most regions of earth, water vapor swamps out the already small & diminishing effect of more CO2. Only in the driest areas, such as hot temperate & tropical zone & even more so cold polar deserts, should IMO CO2 increases be expected to show anything close to their lab derived effect, which in any case is negligible by itself in going from 280 ppm to 560 ppm by volume, if we ever get there in the next century. The falsely assumed positive feedbacks leading to feared runaway catastrophe won’t happen on our homoestatic world. As you know.
I look at it this way. Most of the warming effect is due to the first molecule of CO2 per 10,000 dry air molecules. Thank God our planet still has that molecule, a vestige of our ancient atmosphere. Without it, not only would earth be a lot colder, but C4 plants couldn’t survive, so would not have evolved. Thank a higher power too for the second molecule, which could be thought to represent the air of qn Ice House world. The third molecule tells us we’re in an interglacial during a glacial epoch. Some part of the fourth molecule is probably thanks to human activity, but nobody really knows for sure how much of it. When & if we ever get a fifth & sixth molecule before the onset of the next major glaciation, those might be even more anthropogenic in origin. Maybe. Unlikely we’ll enjoy the benefits of a seventh or eighth molecule, despite earth having earlier in the Cenozoic basked in the comfort & luxuriant growth of around 15 CO2 molecules per 10,000 dry air molecules (v. roughly 7800 N2, 2093 O2 & 92 Ar).
Actually under one CO2 molecule per thousand would be better, IMO. At prolonged exposure to actual plant-growing greenhouse levels (1000 to 1300 ppm), some people get headaches.
milodonharlani says: @ January 21, 2014 at 4:17 pm
…Actually under one CO2 molecule per thousand would be better, IMO. At prolonged exposure to actual plant-growing greenhouse levels (1000 to 1300 ppm), some people get headaches.
>>>>>>>>>>>>>>>>>>>>>>
At 1000 to 1300 ppm of CO2 we would be too busy fighting the kudzu and poison Ivy to worry about headaches. http://www.youtube.com/watch?v=L7SkrYF8lCU
Gail Combs says:
January 21, 2014 at 4:30 pm
Hilarious!
But think how rapidly all the noxious weeds would suck CO2 out of the air. We wouldn´t have to worry about elevated levels for long. A thousand years, tops.
Fact is no one knows how long it takes to return earth to the levels its current climate system wants, because scientivists have been too busy hatching every crazier models to do the hard work of actually studying nature. Science doesn’t even know what all the sinks are, let alone how long they take to reach equilibrium, before a whole new equilibrium is called for by the shift from interglacial to glacial climate mode.
Neville. says: “I wish someone could give a link to the GISP 2 data end points that makes sense. We have a supposed 1950 end point but also a 1855 end point as well. Can anyone explain the difference? And in layperson’s language please ?”
Below is the original description (which is followed by several thousand isotope ratios from accelerator data). The top of the core is 1950. The 1855 date is based on temp reconstructions (not isotope ratios) by Cuffy and Clow and Alley.
GISP2 Oxygen Isotope Data
General Description
Between 1989 and 1993, the Greenland Ice Sheet Project 2 (GISP2) collected several ice cores from near the summit of the Greenland Ice Sheet (72°36’N, 38°30’W). Two of these were the 200m B core drilled in 1989, and the 3053m D core (drilled from 1989 to 1993) – the longest ice core drilled to date in the northern hemisphere. The D core penetrated the depth of the ice sheet, and allowed the further recovery of some 60-cm of bedrock. The Principal Investigators for the University of Washington’s contribution to this multi-university effort were M. Stuiver (Box 351360, University of Washington, Seattle WA 98195, USA) and P. M. Grootes (now at Leibniz-Labor, Max Eyth Strasze 11-13 24118 Kiel, Germany) .
All d18O values were determined at the Quaternary Isotope Laboratory (M. Stuiver, Box 351360, University of Washington, Seattle WA 98195, USA).
The data columns represent:
Depth Top depth of each interval, in meters. Samples are continuous unless specifically noted.
Age Layer count age at the given depth (in yr BP), where 0 BP represents AD 1950 summer to AD 1949 summer. Age corresponds to the top of the interval, unless noted otherwise.
Del 18O Mean d18O value (in per mil) over the interval starting at the indicated top depth. Standard deviation in a single d18O measurement is 0.14 per mil. Multiple measurements (such as in the data sets below) reduce the standard deviation to the 0.05 to 0.1 per mil range.
References
These references apply to all GISP2 files listed below.
I Stuiver, M. and P. M. Grootes. GISP2 Oxygen Isotope Ratios. Quaternary Research 54/3 (2000), in press.
II Grootes, P.M., and M. Stuiver. Oxygen 18/16 variability in Greenland snow and ice with 10-3- to 105-year time resolution. Journal of Geophysical Research 102, 26455-26470 (1997).
III Stuiver, M., P.M. Grootes, and T.F. Braziunas. The GISP2 d18O climate record of the past 16,500 years and the role of the sun, ocean and volcanoes. Quaternary Research 44, 341-354 (1995).
IV Meese, D.A., R.B. Alley, R.J. Fiacco, M.S. Germani, A.J. Gow, P.M. Grootes, M. Illing, P.A. Mayewski, M.C. Morrison, M. Ram, K.C. Taylor, Q. Yang, and G.A. Zielinski. Preliminary depth-agescale of the GISP2 ice core. Special CRREL Report 94-1, US. (1994).
V Grootes, P.M., M. Stuiver, J.W.C. White, S.J. Johnsen, and J. Jouzel. Comparison of oxygen isotope records from the GISP2 and GRIP Greenland ice cores. Nature 366, 552-554 (1993).
Yes, true enough water vapor is by far the larges greenhouse gas. I believe it comprises about .5% in drier areas of the planet and about 1.5% in the topical jungle regions. And yes, this makes a huge difference in longwave radiation able to escape into space. And I think you are right on the mark regarding the very tiny amounts that carbon dioxide comprise in our atmosphere, so for once humans are not guilty as charged.
John Finn says: “Yep – It looks very much as though that’s what’s been done. TLT anomalies have, apparently, been spliced on to the end of a series of NCDC anomalies. Staggering!”
Thanks for agreeing.
Plateau Plateau’d Plateau-ing
None of these imply a future rise or fall. A plateau could be a peak, as on Table Mountain in S. Africa. Or it could be a mere shelf or stairstep on the way to higher things.
Please, folks; Bob T was attacking the data as presented, not the man. His fine and seminal work shows how and why ENSO really operates. The data runs mainly in steps and plateaux. This is because of cloud-mediated tropical Pacific insolation. All of it is meticulously and labouriously put together. Anyone who takes the trouble can jump ahead of most Climatologists, especially with a little help from Stephen Wilde. So, not ad hominem, but rather towards graphs which made it easier to misread the message. Bob, I am in awe of your work. Don, you have also carried the flame through thick and thin, and hopefully will continue to do so. Thankyou both.
Brett from NZ
We really have far-less-certain knowledge of the actual global average temperature variations than manufactured indices, such as HADCRUT4, would indicate. And despite more-or-less realistic empirical descriptions of ENSO-related phenomena, nothing resembling a compelling dynamical theory to explain them from first principles has been presented by anyone. Only the tempest in a sea of unreliable notions seems unmistakable.
Dr. Easterbrook and Mr. Tisdale: This is a tempest in a teapot, and one of you is guilty of indulging a bit loosely in “geologic arm-waving” and the other of you is guilty of some intemperate statements. Both of you have some command of the situation, and it is my humble opinion, neither of you is correct beyond a certain, limited stretch. And both of you should be ashamed of using the temperature records produced by the current “resident experts” whose bogus reworking of the original records is in fact a crime in process.
Let’s say Tisdale is correct in that ENSO is the key process. Well, if the sun’s visible light output is as restricted in range as it currently understood, then there is nothing solar to drive ENSO. So it’s an earthly phenomenon. Basically, something causes the equatorial winds to blow hard – giving us La Nina – or not so hard, giving us El Nino. That then sets all the other “processes” or “oscillations” moving. So what makes the wind blow, or not? I think Willis’s “thermostat” ideas are involved in the answer (along with that Russia paper presented here about how the ITCZ thunderstorms actually represent the pressure sinks that stimulate the equatorial winds).
Now shake hands, get together, and come up with “the theory of plate tectonics” for the Earth’s current climate regime.
Bob
Thank you for your well deserved compliment to Don Easterbrook.
That required major courage of his convictions to present his analysis at the height of the global warming bandwagon, especially when there was so little evidence for the PDO at the time.
and John Finn and JJ
I did not address the scientific substance of Bob Tisdale’s posts, only the logical fallacies where he attacked Don Easterbrook. If I erred in that, please quote exactly what I said and show where I was logically wrong in that quote.
Note that the term “abusive” is the technical sub category of the ad hominem logical fallacy, not just being “impolite”. Note that I gave the definitions of the terms Bob used to explicitly show why they were “abusive” ad hominem attacks.
I chose Fallacy Detective as a popular high school/college presentation appropriate for initial understanding. If you wish a technical discussion, see the 85 mentions of “abusive” under Ad Hominem Arguments, Douglas N. Walton University of Alabama Press, 1998, 315 pp
For litigation see the Federal Rule of Evidence 404(a).
This has been a great thread. I hope that many have had the patience to read through it all, because it demonstrates important elements of scientific methodology, dispute, discussion, and advancement.
Don Easterbrook and Bob Tisdale are both competent scientists and honorable men, as they have amply demonstrated in WUWT presentations and discussions before.
Don is a geologist (as am I) who looks at the long-term geologic record and sees ample evidence of climate fluctuation that far exceeds the (relatively) trivial ups and downs of the last few hundred years – – clear indications that nothing today is “unprecedented” and nothing that requires extraordinary explanations tied to human use of hydrocarbon fuels.
Bob T is a master analyst of patterns in data records for air temperatures, sea-surface temperatures, and related climatic variables. I believe that his careful analysis of these data sets has identified factors that drive the ENSO,PDO, and other derivative indices of climate variation – or at least has illuminated the relationships of these variables and what they say about the movement of heat through the oceans and atmosphere over decadal scales.
So Don and Bob have a disagreement over the description of these climatic phenomena, in part related to differing interpretations of cause and effect. Hooray! This is how science gets tested and discussed and, ultimately, improved.
Thank you both, gentlemen, for having this discussion amidst the chattering chorus of blog-posters. You have both demonstrated your passion for your interpretations and your humility to acknowledge short-comings or intemperate remarks.
Both of you will improve your explanations, and we have all been enriched, by these discussions.
“1945-1977 cooling as CO2 soared?”
How about having a look at any of the major surface indices. My favorite is HadCRUT3, which shows less warming (and greater correlation with both the UAH and RSS satellite indices) than HadCRUT4, GISS, or NCDC. http://hadobs.metoffice.com/hadcrut3/diagnostics/global/nh+sh/
The last year more than .1 degree C coolder than the 1961-1990 average was 1976, and the smoothed curve was sloped upwards then and in 1977. 1977 was the 4th warmest year from 1850 to 1980. The post-WWII bottom was at 1950. It generally warmed since then, although the warming was fast from 1976 to 1998. Smoothed HadCRUT3 even shows slight warming from the smoothing period centered on 1945 to the the smoothing period centered on 1977.
As for major satellite indices, RSS is not the only one. The other is UAH: http://www.drroyspencer.com/latest-global-temperatures/
That one can’t even show a decade of nonpositive linear trend ending within the past few months, despite a century-class spike centered in early 1998.
It appears to me that most on both sides of the global warming debate are overstating their cases.
Re: Figure 4 (bottom):
The cooling shown is much more than even HadCRUT3 indicates, for that matter even HadCRUT2. And CO2 is rising faster, even on log scale, than it did in 1945-1977. Effect of CO2 change is not zero. I think a solar effect will be needed to keep the slope nonpositive this time.
Which I do expect, and I expect this to show the case of IPCC and its likes to be overstated. However, I expect only very slight cooling.
Just to clarify then, we’re now saying we can’t tell if the PDO causes global warming or if they have a common cause or are related at all. And the graph is based on Marcott style spliced data.
So all we’re left:
‘As well as temperatures going up and down, the PDO is also something that happens. ‘
What is the point of this please?
milodonharlani:
I am interested in your statement in your post at January 21, 2014 at 4:43 pm which says
Please explain how the climate system can “want” anything.
And, assuming the climate system can have a desire, then please explain how we could know what that desire is.
Your entire post is meaningless in the absence of those explanations.
Richard
Both Don and Bob need to get together over a good bottle of red wine. Both offer invaluable insight into the climate question.
As to the PDO, it is obviously a function of solar activity as is every climate driving process but how these all intermix needs a lot of work.
Pete Brown says: “What is the point of this please?”
If we assume the PDO is a proxy for ENSO, and based on our understanding that the multidecadal variability of the strengths, frequencies and durations of El Nino and La Nina events are the primary cause of the PDO, then there are mechanisms (portraying themselves as El Nino and La Nina events) that makes this work. See the post here:
http://bobtisdale.wordpress.com/2014/01/17/comments-on-the-nature-article-climate-change-the-case-of-the-missing-heat/
Which was cross posted at WUWT here:
http://wattsupwiththat.com/2014/01/18/comments-on-the-nature-article-climate-change-the-case-of-the-missing-heat/
Regards
Don Easterbrook says:
January 21, 2014 at 11:48 am
“I’ve plotted the CET to 1659 (you need to blow it up considerably to extract the details, but it gives a very nice correlation with the data I’ve used). It shows the Maunder, 1700-1735 warming, Dalton coooling, 1850-1875 warming, 1875-1900 cooling, 1900-1950 warming, 1950-1975 cooling, 1975-2005 warming, and 2005-2013 cooling. All of these show up in my GISP2 ice core plot.
I would be much interested in what you find back to 1450.”
GISP shows a warm spike around 1695 at the coldest part of Maunder, it then cools towards 1725, the complete opposite of CET. GISP shows strong warming from 1830 to 1845, CET again does the opposite. There are a few sections where they follow each other, but not many, through most of it they move in opposition.
What if there is no single “main driver” of climate change?
Clearly our orbiting the sun makes it possible for earth to have a variable climate. Were earth a rogue planet circling the galactic center of mass at its average distance therefrom, it would be frozen pretty much all the time, although there might be some effect from its internal heat. Maybe more so if it also were accompanied by its moon. Despite variable bombardment from GCRs & differing gravitational forces on its journey, not much would be happening here. Without life, the atmosphere would be different too.
But is there any other factor that could account for 50 to 90% of observed climate change, as IPeCaC posits for CO2 on the time scale of a century?
Here are some candidate terrestrial & extraterrestrial “forcing” factors. Please feel free to add to the list, as I’m sure to leave out some that have been suggested.
1. Solar irradiance variation, both in intensity & spectral composition,
2. Solar magnetic field flux, including impact of GCRs,
3. The Moon,
4. Rotation rate of the planet, related to distance to the moon,
5. Orbital mechanics, known to affect climate on the scale of tens of thousands of years,
6. Other planets (arguably included above, as affecting how elliptical our orbit is, which is not much compared to Mars),
7. Continental drift & mountain building & weathering,
8. Volcanism, superplumes & internal heat dissipation,
9. The hydrological cycle or wetness of the air (itself dependent to some unknown extent on solar influences, an area that should be studied instead of paying for more GIGO general circulation models),
10. Clouds, high & low (perhaps subsumed in hydro cycle, above) & their condensation nuclei, controlled by some of the factors above & below, including life,
11. Composition & density of the atmosphere (to include amount of GHGs other than water, such as CO2),
12. Life, including human effects on various of the above & below.
13. Ocean composition & currents, plus amount of water on the surface in general,
14. Ice & albedo.
15. GHG sinks, known & unknown, & consequent dwell time the air of same (related to atmospheric composition above),
16. Earth’s own magnetic field,
17. Energy of the system, ie temperature of air, water & land, IMO not climate itself, but a determinant factor.
Clearly many of these & other factors I missed are inter-related.
I like Dr. Ball’s analogy of a car to climate, in which the sun is the engine, water vapor the transmission & man-made CO2 a lug nut on one wheel (whether powered or not, he doesn’t say). Not sure what’s the U-joint. Maybe clouds.
Bob Tisdale
Thank you for your apology and congratulations. As I said earlier, I have neither the desire nor any reason to quarrel with you. We’re on different tracks—nothing in your work disproves anything in my work and nothing in my work disproves anything in your work. So why are we having this big ruckus? It’s a mystery to me.
Nothing you have said in any way affects my data or my predictions. As soon as I can get to it, I will update the temperature curve in fig 4, but that isn’t going to change anything of importance. At most, it might slightly alter the slope of the 1945-1977 cooling curve, but the difference won’t be significant and it certainly won’t change any of the PDO/climate correlations. Steve Goddard has shown how NOAA and NASA have corrupted data and changed past temperature measurements, so what to use for a temperature curve becomes a problem. I’ll probably use them all and try to use originally measured data as well. The only part of the curves that might affect predictions will be the slope of the 1945-1977 cooling curve and that should be quite minor.
You bring up your responses to my earlier post, “The demise of sunspots.” The reason I didn’t respond to your criticisms then was that they were so full of personal insults and argumentum ad hominem that I tossed them into the waste basket. If you want me to respond to questions, you will need to frame them in a more professional manner.
Let’s end this hassle on a positive note. I wish you well in your research on ENSO related issues and will look forward to reading your work.
Don Easterbrook says: “As soon as I can get to it, I will update the temperature curve in fig 4, but that isn’t going to change anything of importance. At most, it might slightly alter the slope of the 1945-1977 cooling curve, but the difference won’t be significant and it certainly won’t change any of the PDO/climate correlations…”
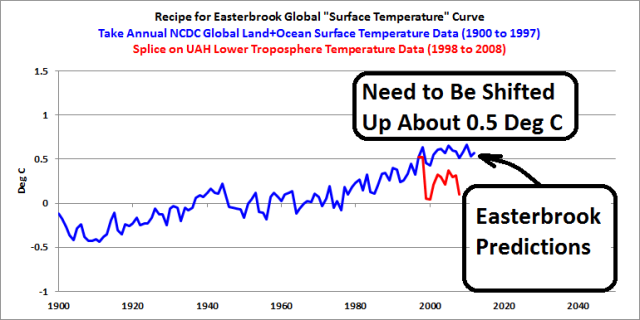
Don, many reading this thread are going to start believing that you’re avoiding making the correction. They know, as do I, that when you get around to updating that graph it will make a significant change to the presentation of your predictions. As I showed above, you appear to have spliced TLT data onto global land plus sea surface temperature data. In fact, it’s pretty obvious that’s what you did. Here, let me “update” your Figure 4 for you.
That’s the problem. Everyone understands it. Why not admit it and move on? Just eliminate the splice, forget showing the models and shift up your predictions. Then you can use that updated version in future posts.
The update will probably take you less time than it took to write your reply to me above.
As a reminder, Anthony asked you yesterday to update your Figure 4. It’s easy. Here’s a link to the source of the NCDC data:
http://www.ncdc.noaa.gov/monitoring-references/faq/anomalies.php
Just click on “Anomalies and Index Data” from the menu along the top. Then select “Annual”, “Global”, “Land and Ocean”. If you leave the last selection as csv, NOAA even provides you with the spreadsheet, so just save it as an Excel spreadsheet. No fuss. No muss.
Don Easterbrook says:
January 22, 2014 at 8:02 am
Nothing you have said in any way affects my data or my predictions. As soon as I can get to it, I will update the temperature curve in fig 4, but that isn’t going to change anything of importance.
Don
How can you say that (correctly) updating the temperature curve won’t change anything. You have spliced TLT anomalies on to the end of the NCDC graph. The two datasets use completely different base periods. UAH uses 1981-2010; NCDC uses 1951-1980. If you update Fig 4 with correct NCDC data , the 2001-2010 portion of the graph will be shifted upwards by at least 0.2 degrees.
Bob Tisdale has already done this and shown that the observations fall in line with the IPCC warming projection. See his post at Bob Tisdale says: January 21, 2014 at 8:42 am
@John, Bob, Don
No disrespect
but could you all stop looking at average global temps, ENSO, PDO, AMO, whatever
It does not work…
Start looking at maximum temperatures, i.e. evaluating energy that is let through the atmosphere.
http://blogs.24.com/henryp/2012/10/02/best-sine-wave-fit-for-the-drop-in-global-maximum-temperatures/
just me trying to set the record straight as William Arnold did in 1985
http://www.cyclesresearchinstitute.org/cycles-astronomy/arnold_theory_order.pdf
but up until now was ignored by everyone but me
http://blogs.24.com/henryp/2013/04/29/the-climate-is-changing/
btw does anyone here know what happened to William Arnold?
Bob Tisdale: Do you have any information on El Nino, La Nina, (ENSO), has not occurring about 5,000 BP, possibly back to the Younger Dryas about 13,000 BP? If so, and it was absent during any of those times, perhaps that deserves a further examination of what may drive ENSO. And yes, thank-you generally for the very good post, Rod Chilton Climatologist (http.www//bcclimate.com
Directed to Bob Tisdale: Overall a very good discussion, and I do think generally positive between you and Dr. Easterbrook. I have been doing some of my own research on both the PDO (see http//www.bcclimate.com) and the Younger Dryas. I came across some very interesting references (that I can provide if you are interested)? The crux of the matter is, that one of the references mentioned that El NINO was absent for a time 5,000 BP. Assuming that this was so, would not that be a good time to study further in hopes of determining something of the forcing that goes on of ENSO? Rod Chilton, climatologist.
CuMulus1 says: “Do you have any information on El Nino, La Nina, (ENSO), has not occurring about 5,000 BP, possibly back to the Younger Dryas about 13,000 BP?”
Nope. Have you checked the NOAA paleoclimatological data website?
http://www.ncdc.noaa.gov/data-access/paleoclimatology-data/datasets/paleoceanography
Even the sea surface temperature records of El Nino and La Nina events before 1950 are questionable. It’s likely the strengths of some El Nino events were under-reported then, and there was little ship traffic before the opening of the Panama Canal.
mysteryseeker says: “The crux of the matter is, that one of the references mentioned that El NINO was absent for a time 5,000 BP. Assuming that this was so, would not that be a good time to study further in hopes of determining something of the forcing that goes on of ENSO?”
It’s difficult at best to study sea surface temperature records before the satellite era–there’s so little source data for many parts of the globe–which is why I generally stick to the satellite era. And it works well, because that’s the period when manmade greenhouse gases are said (assumed) to be the cause of the warming.
Regards
John Finn says: “Bob Tisdale has already done this and shown that the observations fall in line with the IPCC warming projection.”
Actually, I don’t know the source of the model in Don’s graph and how he included it. Other model-data comparisons during that period show the models overestimating the warming. See:
http://bobtisdale.wordpress.com/2013/04/20/model-data-comparison-with-trend-maps-cmip5-ipcc-ar5-models-vs-new-giss-land-ocean-temperature-index/
And for that post I used GISS data.
Okay, I will bite.
You complain that climate scientists ignore your data/claims and attack you personally, but you fail to mention what response should they give someone who a) only uses “surface temperatures” when discussing Global Warming or b) is trying to pretend that “regional” temperature events like The Little Ice Age, The Medieval Warming Period, etc. have anything to do with “global”?
Only using surface temperatures indicates that you are a) ignorant of what “Global” means, or b) intentionally insulting people’s intelligence by pretending that cherry picking proves something other than A or C, or c) you are intentionally trying to deceive people by lying to them.
What would the response of a brain surgeon removing a brain tumor be to someone who shows up in the operating room and starts yelling that he is a quack because he has ignored a hangnail?
What would the response of a plumber fixing a leaking municipal pipe be to someone who shows up and starts yelling that he is a fraud trying to pad his bill at taxpayer’s expense because when he turned off the water feeding the pipe he is working on, was enough to stop the leak and thus no other billable work is needed?
Bob, I understand that you cannot say with absolute certainty which data Professor Easterbrook has used in the Fig 4 graph, but we do know that the post-2000 data is not from the same dataset as the pre-2000 data. We also know that if Professor Easterbrook updated the graph with a consistent set of data the graph would send a totally different message to the one Professor Easterbrook is intending.
Many commenters, including you, have praised the Professor for his ‘warming pause’ prediction. Don Easterbrook was, by no means the only person, to suggest that ocean influences explained at least some for the 1975-2000 and 1910-1940 warning. Several years ago I was banned from the Open Mind blog run by Grant Foster (Tamino) for daring to suggest that a modest warming in response increased CO2 concentrations had been amplified by natural factors.
I’m far from being on the CAGW side of the debate. This link shows an exchange between me and Michael Mann on the “hide the decline” issue with the hockey-stick graph. This took place in December 2004 – 5 years before “Climategate”.
http://www.realclimate.org/index.php/archives/2004/12/myths-vs-fact-regarding-the-hockey-stick/
As far as I’m concerned Mann and Don Easterbrook are, intentionally or not, guilty of exactly the same thing. They’ve both “mixed and matched” data to mislead their target audience.
PS to earlier post.
Bob, I take your point about the overwhelming majority of models over-estimating warming. But the fact that post-2000 NCDC data falls almost exactly in line with Professor Easterbrook’s “IPCC warming projections” suggests that is another issue which Don needs to address. Has he simply used an extrapolation of NCDC data to represent model projections?
To Bob Tisdale again: Thank-you for your reply. The information as to El Nino not occurring in the 5,000 BP time frame of course was not based on observations the Eastern tropical Pacific. It was inferred from conditions consistent with El Nino in northern Australia. Rod Chilton.
Rod Chilton, sorry for not noting that I understood that you were discussing paleoclimatological data, before I discussed the rest. I could have saved you a reply.
Cheers
So, is Don actually coming back to correct the errors that Bob Tisdale has pointed out, and provide the data he is using?
Also, why weren’t we given the data in the first place?
David L. Hagen says:
I did not address the scientific substance of Bob Tisdale’s posts, only the logical fallacies where he attacked Don Easterbrook.
Tisdale did not commit a logical fallacy when he attacked Easterbrook. Frankly, most of the things that you call out as attacks on Easterbrook were instead attacks on Easterbrook’s position, and were explicitly stated as such. That said, whatever attacks on Easterbrook himself you may see in your quotes of Tisdale are not logical fallacies. They may be impolite, they may even be abusive. Abusive is not a logical fallacy.
“You are ugly and your mother dresses you funny, therefore you are wrong about temperatures” is an ad hominem fallacy.
“You are ugly and your mother dresses you funny, and you are wrong about temperatures” is not.
If you wish a technical discussion, see the 85 mentions of “abusive” under Ad Hominem Arguments, Douglas N. Walton University of Alabama Press, 1998, 315 pp
Douglas N. Walton is wrong. That statement is not a logical fallacy.
What Douglas N. Walton says is bogus!!!. That statement is not a logical fallacy.
Walton’s book is misleading, it misinforms, it is contrived, it is far from good philosophy. That statement is not a logical fallacy.
None of those statements is a logical fallacy. Some might not think they are nice things to say. You may find them ‘abusive’, as you did when Tisdale said the same things to Easterbrook. That may be. It may also be the case that those three statements are false. However any of that shakes out, none of them is a logical fallacy.
For litigation see the Federal Rule of Evidence 404(a).
The quoted rule does not address ad hominem. It really cannot, as the substance of a criminal trial is materially different than the other questions to which “ad hominem” is applicable. Good thing. Otherwise you would be forced to conclude that a trial is nothing more than one extended ad hominem, given that the prosecution’s entire case is that the defendant is a low down, no good criminal.
Still waiting for the corrections and data.. Not holding my breath waiting at this point though, as that would have proved fatal by now.
drumphil, I’ve been holding my breath for 2 1/2 years and I’m still kickin’:
http://bobtisdale.wordpress.com/2011/06/17/comments-on-easterbrook-on-the-potential-demise-of-sunspots/
Bob Tisdale said:
“drumphil, I’ve been holding my breath for 2 1/2 years and I’m still kickin’:”
Seriously, am I the only one thinking that this business is actually pretty good evidence for the need for things like…. gasp, shock, horror.. peer review?
Frankly, having involved myself in debates over climate change over the years, I’m 100% damn sure, that at some point in the near future, someone is going to hit me with Don Easterbrook’s claims from the front page of WUWT. And none of them are going to have any idea what actually went down in the discussion here.
I will try and direct them towards the discussion here, but I’m only going to be doing so out of a desire to be doing the right thing, not because I actually expect any of them to read all this, and really understand the issues with all of this.
Sigh.
sigh
@drumhil
you did not get what is driving the climate
no matter what the PDO/AMO, whatever does
http://www.nonlin-processes-geophys.net/17/585/2010/npg-17-585-2010.html
what matters is what is allowed through the atmosphere….
drumphil, blogging here at WUWT is open peer review…after publication.
HrnryP Said:
“you did not get what is driving the climate
no matter what the PDO/AMO, whatever does
http://www.nonlin-processes-geophys.net/17/585/2010/npg-17-585-2010.html
what matters is what is allowed through the atmosphere….”
Um, how does that relate to anything I said?
Bob Tisdale said:
“drumphil, blogging here at WUWT is open peer review…after publication.”
How does that work if he wont provide the data, make the corrections, and retract the original article?
Heck, how about just at least putting a “warning, this is bogus” on the original article, so that people who are spreading it round the web will realize there is something going on, and maybe (who am I kidding, but anyway) actually get the perspective that at present only the few people who actually read all this stuff in the comments have.
Kind of a shame the way the system works here, compared to a more forum style layout, cause this will be long disappeared off the front page by the time this discussion has finally got the data and corrections, assuming we ever do.
So is that really it.. is discussion of this over? Is Don ever coming back to correct his article?
Don Easterbrook, the errors in your article, that Bob Tisdale has pointed out may make me wonder about your scientific capabilities, but perhaps you were just having a really bad day or something, so that by itself isn’t enough for me to make a judgement.
But when you fail to make corrections, and fail to supply the data necessary to check your work, and understate the difference that the corrections will make, and then disappear from the discussion, it gives me good cause to doubt both your personal integrity and scientific abilities.
So, what say you Don? Am I creating a storm in a teacup, because you just need another day or two to get the corrections done? Guess I’ll find out soon what sort of person you really are.
wow, as a spectator who is trying to understand it is obvious that there is no clear answer other than no one can really predict the future concerning global warming or cooling with absolute certainty, very entertaining
@Bennie
it is really quite simple
it is cooling for the equivalent of one solar cycle, 12 years
look here
http://www.woodfortrees.org/plot/hadcrut4gl/from:1987/to:2014/plot/hadcrut4gl/from:2002/to:2014/trend/plot/hadcrut3gl/from:1987/to:2014/plot/hadcrut3gl/from:2002/to:2014/trend/plot/rss/from:1987/to:2014/plot/rss/from:2002/to:2014/trend/plot/hadsst2gl/from:1987/to:2014/plot/hadsst2gl/from:2002/to:2014/trend/plot/hadcrut4gl/from:1987/to:2002/trend/plot/hadcrut3gl/from:1987/to:2002/trend/plot/hadsst2gl/from:1987/to:2002/trend/plot/rss/from:1987/to:2002/trend
there are those like John Finn who think or believe that man is doing the warming (like in the graph above, up until 2000) and to save their jobs, they hope it will soon start warming again. They even go over to changing or adapting data.
Luckily, there are normal scientsist like Don and me
who looked at what (heat) is coming through the atmosphere and who figured something out about the ozone and the cycles and they know it will not stop cooling until around 2040
http://blogs.24.com/henryp/2012/10/02/best-sine-wave-fit-for-the-drop-in-global-maximum-temperatures/
note that my own results are completely different to Don’s but we came to similar conclusions.
if your bet is on the arctic opening up soon, you make a big mistake.
http://oi40.tinypic.com/2ql5zq8.jpg
it won’t happen.
You want to bet?
If you are clever you will bet on the cooling (down trend) to continue
HenryP says: “If you are clever you will bet on the cooling (down trend) to continue”
I wouldn’t bet, because I know the next strong El Nino will kick up surface temperatures for another decade for a good portion of the global oceans. If the AMO has peaked, then there might not be a noticeable rise globally. If it hasn’t, then it may be noticeable.
Come on Bob,
surely you can see that sea temps have gone down for at least one Schwabe solar cycle?
http://www.woodfortrees.org/plot/hadcrut4gl/from:1987/to:2014/plot/hadcrut4gl/from:2002/to:2014/trend/plot/hadcrut3gl/from:1987/to:2014/plot/hadcrut3gl/from:2002/to:2014/trend/plot/rss/from:1987/to:2014/plot/rss/from:2002/to:2014/trend/plot/hadsst2gl/from:1987/to:2014/plot/hadsst2gl/from:2002/to:2014/trend/plot/hadcrut4gl/from:1987/to:2002/trend/plot/hadcrut3gl/from:1987/to:2002/trend/plot/hadsst2gl/from:1987/to:2002/trend/plot/rss/from:1987/to:2002/trend
we are cooling from the top [90] latitude down
http://oi40.tinypic.com/2ql5zq8.jpg
and that process will accelerate due to more clouds and rain at the lower latitudes (lower insolation)
I figure that there must be a small window at the top of the atmosphere (TOA) that gets opened and closed a bit, every so often. Chemists know that a lot of incoming radiation is deflected to space by the ozone and the peroxides and nitrous oxides lying at the TOA. These chemicals are manufactured from the UV coming from the sun.
Don’t count on too many El Nino’s anymore
we have had it.
we are back to where we were in 1925.
It is what heat gets through the atmosphere that is important.
Use (global) maxima as your proxy and see what you get?
e.g.
http://blogs.24.com/henryp/2013/04/29/the-climate-is-changing/
Best wishes
Henry
I really enjoy the open format being presented, I am an HVAC contractor and Landscaper so nothing special in the knowledge department, however I love to try to understand the functions that control or [influence] climate, I do not appreciate politicians trying to tell me what I must do concerning something that I know they have a financial benefit in promoting so self education is my best weapon. [Science] should present the facts and not conjecture on what is happening, but it is impossible to predict completely what the answer is, so I’m open minded and have no [agenda] to promote, nothing to gain or lose, a great position to be in, thank you all for giving me the tools to work with in order to form my own understanding
Wow, so this is how the “skeptic” model of peer review works at WUUT?
Author makes claims, without providing data that would let anyone else replicate his calculations.
Claims are repeated on the front page of WUUT, without data….
Holes are point out by people who do understand mathematical analysis and statistics.
Author disappears…
The end.. apparently..
Yeah, this “open peer review” model works brilliantly….
Of course, I’m talking to myself, because this is long disappeared from the front page of WUUT.
drumphil:
re your post at February 3, 2014 at 5:40 am.
Clearly, you are not talking to yourself because I am answering you.
Your post is bollocks.
Each and every of your assertions is false as anybody can check for themselves within seconds.
Perhaps you thought adding that nonsense to the end of an ‘old’ thread would mislead readers using the WUWT Search function in future. If so, then you failed. All you have shown is that anonymous idiots are not censored but are allowed to display their idiocy on WUWT.
Richard