Guest essay by Don J. Easterbrook, Dept of Geology, Western Washington University

The absence of global warming for the past 17 years has been well documented. It has become known as “the pause.” and has been characterized as the “biggest mystery in climate science,” but, in fact, it really isn’t a mystery at all, it was predicted in 1999 on the basis of consistent, recurring patterns of the Pacific Decadal Oscillation (PDO) and Atlantic Multidecadal Oscillation (AMO) and global climate.
Perhaps the easiest way to understand the causal relationship between global warming/cooling and the PDO and AMO is to recount how these correlations were discovered. In 1999, while studying recent glacial fluctuations on Mt. Baker in the North Cascade Range, a pattern of recurring advances and retreats became apparent. In the wee hours one night, I came across a 1997 paper by Mantua, et al., “A Pacific interdecadal climate oscillation with impacts on salmon production,” an early recognition of the PDO. The PDO is an index, not a measured value, based on about a dozen or so parameters that are related to cyclical variations in sea surface temperatures in the NE Pacific. The term “Pacific Decadal Oscillation” (PDO) was coined by Steven Hare (1996). It has two modes, warm and cool, and flips back and forth between them every 25 to 30 years.
The Mantua et al. curve looked so similar to my glacial curve that I superimposed the two and was surprised to see that they corresponded almost exactly. I then compared them to global temperature and all three showed a remarkable correlation (Fig. 1).
The significance of this correlation is that it clearly showed that the PDO was the driver of climate and glacial fluctuations on Mt. Baker. Each time the PDO mode flipped from one mode to another, global climate and glacier extent also changed. This discovery was significant in itself but was to lead to a lot more. At this point, it was clear that PDO drove global climate (Figs. 2,3), but what drove the PDO was not apparent.

Figure 2. 1945-1977 PDO cold mode and 1977-1998 warm mode. (Easterbrook 2011 modified from D’Aleo)

Figure 3. PDO fluctuations from 1900 to August 2012. Each time the PDO was warm, global climate warmed; each time the PDO was cool, global climate cooled. (modified from http://jisao.washington.edu/pdo/)
In 2000, I presented a paper, “Cyclical oscillations of Mt. Baker glaciers in response to climatic changes and their correlation with periodic oceanographic changes in the Northeast Pacific Ocean” at the annual meeting of the Geological Society of America (GSA). The following year at the GSA meeting, I presented another paper “The next 25 years: global warming or global cooling? Geologic and oceanographic evidence for cyclical climatic oscillations.”
Since this recurring pattern of PDO fluctuation and global climate held true for the past century, what might the future hold? If the pattern continued, then might we project the same pattern into the future to see where we are headed, i.e., the past is the key to the future. If we want to know where we are heading, we need to know where we’ve been. Each of the two PDO warm periods (1915-1945 and 1978-1998) and the three cool periods (1880-1915, 1945-1977, 1999-2014) lasted 25-30 years. If the flip of the PDO into its cool mode in 1999 persists, the global climate should cool for the next several decades. Using the past durations of PDO phases, I spliced a cool PDO (similar to the 1945-1977 cool period) onto the end of the curve and presented the data in a paper at the 2001 Geological
Society of America meeting in Boston. In this paper, I proposed that, based on the past recurring pattern of PDO and global climate changes, we could expect 25-30 years of global cooling ahead (Fig. 4). With memories of the 1998 second warmest year of the century, the audience was stunned at such a prediction, especially since it directly contradicted the IPCC predictions of global warming catastrophe.


Figure 4. (Top) PDO fluctuations and projections to 2040 based on past PDO history.
(Bottom) Projected global cooling in coming decades based on extrapolation of past PDO recurring patterns.
My first projection of future global cooling was based on continuation of past recurring PDO fluctuations for the past century. But what about earlier climate changes? Because climate changes recorded in the oxygen isotope measurements from the GISP2 Greenland ice core had such an accurate chronology from annual layering in the ice, it seemed a perfect opportunity to see if similar changes had occurred in previous centuries, so I plotted the oxygen isotope accelerator measurements made by Stuiver and Grootes (1997) for the past 450 years. Oxygen isotope ratios are a function of temperature, so plotting them gives a paleo-temperature curve. This was a real eye-opener because the curve (Fig. 4) showed about 40, regularly-spaced, warm/cool periods with average cycles of 27 years, very similar to the PDO cycle. There was no way to determine what the PDO looked like that far back, but the GISP2 warm/cool cycles were so consistent that correlation with PDO 25-30 year cycles seemed like a good possibility. Historically known warm/cool periods showed up in the GISP2 curve, i.e., the 1945-1977 cool period, the 1915-1945 warm period, the 1880-1915 cool period, the Little Ice Age, Dalton Minimum cooling, the Maunder Minimum cooling, and many others, lending credence to the validity of the GISP2 measurements.

Figure 5. Warm and cool periods to 1480 AD from oxygen isotope measurements from the GISP2 Greenland ice core. The average length of a warm or cool cycle is 27 years.
When I presented this data and my climate projections at the 2006 GSA meeting in Philadelphia, Bill Broad of the NY Times was in the audience. He wrote a feature article in the NY Times about my data and predictions and the news media went bonkers. All of the major news networks called for interviews, then curiously all except CNN, MSNBC, and Fox abruptly canceled, apparently because my data posed a threat to IPCC predictions of catastrophic warming.
Nine additional papers expanding the geologic evidence for global cooling were presented from 2007 to 2009 and several longer papers were published from 2011-2014, including
“Multidecadal tendencies in Enso and global temperatures related to multidecadal oscillations,” Energy & Environment, vol. 21, p. 436-460. (D’Aleo, J. and Easterbrook, D.J., 2010).
“Geologic Evidence of Recurring Climate Cycles and Their Implications for the Cause of Global Climate Changes: The Past is the Key to the Future,” in the Elsevier volume “Evidence-Based Climate Science; p. 3-51. (2011)
“Relationship of Multidecadal Global Temperatures to Multidecadal Oceanic Oscillations,” in the Elsevier volume “Evidence-Based Climate Science; p. 161-180. (D’Aleo, J. and Easterbrook, D.J., 2011)
“Observations: The Cryosphere,” in Climate Change Reconsidered II, Physical Science (Easterbrook, D.J., Ollier, C.D., and Carter, R.M., 2013), p. 645-728.
Reprints of any of these publications may be obtained from http://myweb.wwu.edu/dbunny/ or by emailing dbunny14 “at”yahoo.com.
During these years, important contributions were made by Joe D’Aleo, who showed that during warm periods, warm El Nino phases occurred more frequently and with greater intensity than cooler La Nina phases and vice versa. He also documented the role of the Atlantic Multidecadal Oscillation (AMO), which is similar to the PDO. The AMO has multi-decadal warm and cool modes with periods of about 30 years, much like the PDO.
So the question now becomes how could my predictions be validated? Certainly not by any computer climate models, which had proven to be essentially worthless. The obvious answer is to check my predictions against what the climate does over several decades. We’ve been within my predicted cooling cycle for more than a decade, so what has happened? We’ve now experienced 17 years with no global warming (in fact, slight cooling) despite the IPCC prediction that we should now be ~1° F warmer (Figs. 6, 7, 8). So far my 1999 prediction seems to be on track and should last for another 20-25 years.
Conclusions
The ‘mysterious pause’ in global warming is really not mysterious at all. It is simply the continuation of climatic cycles that have been going on for hundreds of years. It was predicted in 1999, based on repeated patterns of cyclical warm and cool PDO phases so it is neither mysterious nor surprising. The lack of global warming for the past 17 years is just as predicted. Continued cooling for the next few decades will totally vindicate this prediction. Time and nature will be the final judge of these predictions.
What drives these oceanic/climatic cycles remains equivocal. Correlations with various solar parameters appear to be quite good, but the causal mechanism remains unclear. More on that later.

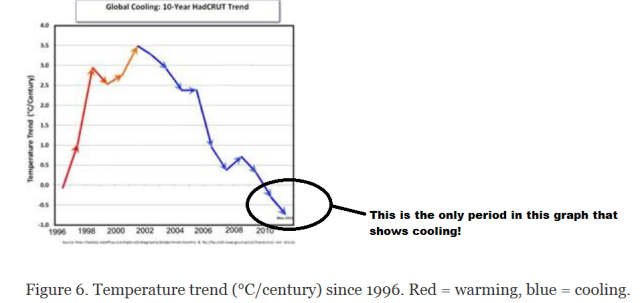
Figure 6. Temperature trend (°C/century) since 1996. Red = warming, blue = cooling.

Figure 7. Global cooling since 2000 (Earth Observatory)

Figure 8. Winter temperatures in the U.S. 1998-2013. 46 of the 48 states were significantly colder.
==========================================================
UPDATE 1/24/14, Dr. Easterbrook writes in with this update:
Here is an updated version of my 2000 prediction. My qualitative prediction was that extrapolation of past temperature and PDO patterns indicate global cooling for several decades. Quantifying that prediction has a lot of uncertainty. One approach is to look at the most recent periods of cooling and project those as possibilities (1) the 1945-1975cooling, (2) the 1880-1915 cooling, (3) the Dalton cooling (1790-1820), (4) the Maunder cooling (1650-1700). I appended the temperature record for the 1945-1975 cooling to the temperature curve beginning in 2000 to see what this might look like (see below). If the cooling turns out to be deeper, reconstructions of past temperatures suggest 0.3°C cooler for the 1880-1915 cooling, about 0.7°C for the Dalton cooling (square), and about 1.2°C for the Maunder cooling (circle). We won’t know until we get there which is most likely.

This updated plot really doesn’t change anything significantly from the first one that I did in 2000.
===============================================================
REFERENCES
D’Aleo, J. and Easterbrook, D.J., 2010, Multidecadal tendencies in Enso and global temperatures related to multidecadal oscillations: Energy & Environment, vol. 21, p. 436-460.
Easterbrook, D.J. and Kovanen, D.J., 2000, Cyclical oscillations of Mt. Baker glaciers in response to climatic changes and their correlation with periodic oceanographic changes in the Northeast Pacific Ocean: Abstracts with Programs, Geological Society of America, vol. 32, p.17.
Easterbrook, D.J., 2001, The next 25 years: global warming or global cooling? Geologic and oceanographic evidence for cyclical climatic oscillations: Geological Society of America, Abstracts with Program, vol. 33, p. 253.
Easterbrook, D.J., 2005, Causes and effects of abrupt, global, climate changes and global warming: Geological Society of America, Abstracts with Program, vol. 37, p. 41.
Easterbrook, D.J., 2006a, Causes of abrupt global climate changes and global warming predictions for the coming century: Geological Society of America, Abstracts with Program, vol. 38, p. 77.
Easterbrook, D.J., 2006b, The cause of global warming and predictions for the coming century: Geological Society of America, Abstracts with Program, vol. 38, p.235-236.
Easterbrook, D.J., 2007a, Geologic evidence of recurring climate cycles and their implications for the cause of global warming and climate changes in the coming century: Geological Society of America Abstracts with Programs, vol. 39, p. 507.
Easterbrook, D.J., 2007b, Late Pleistocene and Holocene glacial fluctuations: Implications for the cause of abrupt global climate changes: Abstracts with Programs, Geological Society of America, vol. 39, p. 594.
Easterbrook, D.J., 2007c, Historic Mt. Baker glacier fluctuations—geologic evidence of the cause of global warming: Abstracts with Program, Geological Society of America, vol. 39, p.13.
Easterbrook, D.J., 2008a, Solar influence on recurring global, decadal, climate cycles recorded by glacial fluctuations, ice cores, sea surface temperatures, and historic measurements over the past millennium: Abstracts of American Geophysical Union annual meeting, San Francisco.
Easterbrook, D.J., 2008b, Implications of glacial fluctuations, PDO, NAO, and sun spot cycles for global climate in the coming decades: Geological Society of America, Abstracts with Programs, vol. 40, p.428.
Easterbrook, D.J., 2008c, Global warming’ is over: Geologic, oceanographic, and solar evidence for global cooling in the coming decades: 3rd International Conference on Climate Change, Heartland Institute, New York.
Easterbrook, D.J., 2008d, Correlation of climatic and solar variations over the past 500 years and predicting global climate changes from recurring climate cycles: Abstracts of 33rd International Geological Congress, Oslo, Norway.
Easterbrook, D.J., 2009a, The role of the oceans and the sun in late Pleistocene and historic glacial and climatic fluctuations: Abstracts with Programs, Geological Society of America, vol. 41, p. 33.
Easterbrook, D.J., 2009b, The looming threat of global cooling – Geological evidence for prolonged cooling ahead and its impacts: 4th International Conference on Climate Change, Heartland Institute, Chicago, IL.
Easterbrook, D.J., ed., 2011a, Evidence-based climate science: Data opposing CO2 emissions as the primary source of global warming: Elsevier Inc., 416 p.
Easterbrook, D.J., 2011b, Geologic evidence of recurring climate cycles and their implications for the cause of global climate changes: The Past is the Key to the Future: in Evidence-Based Climate Science, Elsevier Inc., p.3-51.
Easterbrook, D.J., 2011c, Climatic implications of the impending grand solar minimum and cool Pacific Decadal Oscillation: the past is the key to the future–what we can learn from recurring past climate cycles recorded by glacial fluctuations, ice cores, sea surface temperatures, and historic measurements: Geological Society of America, Abstracts with Programs
Easterbrook, D.J., 2010, A walk through geologic time from Mt. Baker to Bellingham Bay: Chuckanut Editions, 330 p.
Easterbrook, D.J., 2012, Are forecasts of a 20-year cooling period credible? 7th International Conference on Climate Change, Heartland Institute, Chicago, IL.
Easterbrook, D.J., Ollier, C.D., and Carter, R.M., 2013, Observations: The Cryosphere: in Idso,C.D., Carter R. M., Singer, F.S. eds, Climate Change Reconsidered II, Physical Science, The Heartland Institute, p. 645-728.
Grootes, P.M., and Stuiver, M., 1997, Oxygen 18/16 variability in Greenland snow and ice with 10-3– to 105-year time resolution. Journal of Geophysical Research, vol. 102, p. 26455-26470.
Hare, S.R. and R.C. Francis. 1995. Climate Change and Salmon Production in the Northeast Pacific Ocean: in: R.J. Beamish, ed., Ocean climate and northern fish populations. Can. special Publicaton Fish. Aquatic Science, vol. 121, p. 357-372.
Harper, J. T., 1993, Glacier fluctuations on Mount Baker, Washington, U.S.A., 1940-1990, and climatic variations: Arctic and Alpine Research, vol. 4, p. 332‑339.
Mantua, N.J. and S.R. Hare, Y. Zhang, J.M. Wallace, and R.C. Francis 1997: A Pacific interdecadal climate oscillation with impacts on salmon production: Bulletin of the American Meteorological Society, vol. 78, p. 1069-1079.
Nothing but net with that 3 point shot. We don’t need any stinking models when we have real science. Thanks professor.
Nooooooooooooooo……………….
“but what drove the PDO was not apparent”
Natural variation of the Hadley Heat Hidey Hole, first postulated by some guy named Trainbreath (I think Jethro Tull produced song about him) and later confirmed by Al Gore who once found a warm spot while swimming off Cabo. When temperatures are stable, it means the H4 is gorging itself on heat somewhere deep inside the ocean. It apparently reaches right up through the intervening layers of the ocean and snatches the heat right out of the atmosphere La Nija style. When the PDO flips the other way, the H4 is disgorging itself of all that stored heat.
Pretty simple really. Now lets all open our wallets and send in all of our money if we want to make the bad heat stop.
Not buying it at all… it’s still all my fault and I should be made to pay pay pay.
How timely. I just got my 10 Dec through 10 Jan heating bill. I WANT my global warming back!
Ahh, that’s better…
Thank you Alan, thank you….
I felt dark and bereft of light without my self-loathing…
Don Easterbrook, an interesting walk through time and equally an indictment of the effect of a small group of climatologists using a political agenda and pressure behind the scenes and the sorry role of the media who had their fingers in the political process rather than the best interests of their readers.
Sadly an indictment also on the associations of science and scientists who were oblivious to the waste and detrimental impact on science by following such a contrived meme.! Especially so when those involved in evidence based observational science had clearly and succinctly reported the true facts, acknowledged the unknowns, that made it clear consensus was a contrived artefact to cover other agenda, and science suffered, and that is a real travesty.
Global Warming has stopped.
It is only a pause if it starts again, which it hasn’t.
It has stopped for at least 16 years and probably longer, a significant length of time which was not predicted in any of the IPCC models, so we can say, with 95% confidence, that they don’t know what they are doing, no matter how they attempt to dress it.
You almost had me with the data and logic you presented so tellingly Don until I cleverly spotted you weren’t a climatologist in a climatology dept and then I knew instantly you were in the pay of Big Oil. You can fool some of the people some of the time with cunning data and logic but…
Well done.
Geologists ROCK!
Bbbbut mapping the past into the future is not supposed to work. CCCCCCCCCCOOOOOOOOOOOOOOO2222222222222222222222!!!!!!!!!!!!!11!!!!!!!!!!!!!!!
If this prediction holds, it will be difficult for the climadrama to keep the show on the road. I find it curious that something as erratic as climate will end up saving out arses from ourselves.Too much of a close call. Just imagine if, by chance, warming had continued to increase…
Dr. Easterbrook,
Thank You, Thank You, Thank You!
This really presents well the natural variability essence of the PDO driving multidecadel climate warming and cooling trends over centruries, long before the despised Industrial Revolution. It also emphasizes a time testable prediction of cyclic cooling that is already showing positive cooling trend results, trumping all of the computer models used to shout “Unending Warming Ahead Unless Mankind Stops Exhaling CO2!”
I will direct as many engineers, scientists, politicians, and laymen to this blog post as I can, as it is so well constructed, illustrated, and presented in easily understandable terms. As I live in the Seattle area, the inclusion of the Mt. Rainier glacial advance/retreat correlations adds to the local interest and (we can only hope) understanding!
With highest regards,
Mac
Then we need to figure out what drives the roughly 200 year cycle between successive Grand Solar Minima, and the roughly millennial cycle between the Minoan, Roman, Mediaeval and Modern climatic maxima.
Great job. It’s certainly looks like vindication for your predictions.
And despite the 17 year pause in warming, Michael Mann hints that he wants to report skeptics to the Dept of Homeland security. Mann wrote: We scientists are citizens, too, and, in climate change, we see a clear and present danger. The public is beginning to see the danger, too. My Real Science comment:
Um, the public either thinks your climate change hooey is total bunk, or they think it’s not important, that there will certainly be no catastrophe, if anything at all. What much of the public does see, however, is the clear and present danger presented by the wacked out climate scientists and leftist politicos that want a communist takeover of the United States. No joke. What is the real danger here, Michael Mann??
http://dailycaller.com/2014/01/15/un-climate-chief-communism-is-best-to-fight-global-warming/
have been hoping this would gets its own thread today, as LAY people get this!
6:28: 17 Jan: BBC: Has the Sun gone to sleep?
Scientists are saying that the Sun is in a phase of “solar lull” – meaning that it has fallen asleep – and it is baffling them.
History suggests that periods of unusual “solar lull” coincide with bitterly cold winters.
Rebecca Morelle reports for BBC Newsnight on the effect this inactivity could have on our current climate, and what the implications might be for global warming.
http://www.bbc.co.uk/news/science-environment-25771510
“Figure 2. 1945-1977 PDO cold mode and 1977-1998 warm mode. (Easterbrook 2011 modified from D’Aleo)”
Precisely. 1945 to 1977 constituted the entirety of the cooling period that led to some fears of “Global Cooling” or another Ice Age, that hit the pop-sci press in the late seventies. Of course in some data sets today this cooling doesn’t exist anymore because of the data manipulation required to make global warming appear more significant.
Then 1977 to 1998 constitute the entirety of the warming period that led to the “Global Warming” fears. For a brief time global temperatures rose and correlated with rising CO2. That short period of time isn’t much of a foundation to rest a global shakedown of the world’s economies. And every year that goes by without warming reduces the correlation between CO2 and world temperatures (AKA the “Climate Sensitivity”).
Steven Goddard did a post on how the BBC is reporting on the strange “solar lull” and that climate scientists are talking about “it’s implications for global warming.” My comment:
Yeah, they are looking for excuses, to excuse close to 17 years of no warming, the record ice growth or extent at both poles, and all their climate models having totally failed.
But don’t let ‘em just rattle off the random excuses.
The fact is there is no proof that CO2 works as their theoretical model says it does. None. If temperatures were rising at a good clip, then we could say possibly you’re right, but it probably natural, and you still have no proof. But with flat or declining temperatures for nearly two decades, when their models predicted rapid temperatures increases, we can tell them flat out to stop with the excuses and mann up and admit that their whole theory is insane. There’s was never any proof that CO2 would do what they said it would, and now that CO2 hasn’t done what they said it would do, it’s clear that their theory is bunk, period, end of story. No more excuses. No epicycles until the cows come home. No mas!
So how are the PDO and AMO related to El Niño and La Niña? Looks like, from Fig 2, a PDO cold phase would correspond to a strong La Niña and a PDO warm phase to a strong El Niño. But does PMO drive the ENSO process frequency or amplitude, or is it the other way around? Is it possible a good understanding of PDO oscillations would help predict the ENSO changes (frequency or magnitude)?
PS: Would it be possible to change the graphics links so that clicking on a thumbnail would bring up a larger image?
Don Easterbrook
Congratulations on making your scientific predictions in the face of intimidation by the politically correct insisting it would warm. “Wisdom is proved right by her children.”
Thanks Don Easterbrook for persevering with empirical science, nice to see the beginning of the end of this CAGW madness.
There is nothing wrong with trumpeting “I told you so” to the consensus crowd, as they will give no credit to other peoples discoveries, not voluntarily, based on their behaviour to date.
You make another good observation, that the cycles were there for all to see, even in the unadjusted temperature records.
Yet these self appointed experts, threw out the null hypothesis and attacked everyone who doubted their theory of the magic gas.
Buy popcorn, as the animosity these charlatans and their fellow travellers have spread around is going to come home with a vengeance, the costs imposed have been enormous, the damage to civic institutions yet to be calculated.
The damage done to taxpayer confidence in government, bureaucratic fiat and planet saviours is yet to become apparent, I suspect good times are coming for all these parasitic groups.
Message to climate scientists :
1) Ignore the geologic record at your own peril !!
2) Geologist Rule …. Climatologists drool !! :)))
According to the text Figure 4 is supposedly the graph presented at the 2001 Geological Society of America meeting in Boston comparing Easterbrook projected cooling to the IPCC projected warming from 1998. The projection in this graph we are told “stunned” the audience. Why then does the graph show actual temperatures up to 2014.
Don Easterbrook will be disappointed with the post I just published, which once again confirms that the PDO is the wrong dataset to use for this discussion.
http://bobtisdale.wordpress.com/2014/01/17/comments-on-the-nature-article-climate-change-the-case-of-the-missing-heat/
What I find interesting in Fig 5 is that each long and deep cooling period is always preceded by a high double peaked warm period. It is also consistent in percentages. If one looks at the Maunder minimum, its preceding warm period is less pronounced than our current warming period. It makes me wonder if the cooling were about to see will be as pronounced as the high we just experienced.
huh!
16 Jan: Huffington Post: Sean McElwee: How the SEC Can Fight Climate Change
Several corporations sit on the boards of powerful business and trade organizations that take positions contrary to the companies’ purported stance on climate change, finds a new Union of Concerned Scientists report. They are able to do this without public accountability because, currently, trade associations aren’t required to disclose their funders and corporations are not required to disclose their political spending. The report’s author makes clear that in the crucial arena of climate change policy, “the public is still in the dark when it comes to how companies and their trade associations influence government decisions.”
There is a simple way to start to fix this lack of transparency and accountability. The U.S. Securities and Exchanges Commission (SEC) should proceed with its rule making that would require companies to disclose their political activities…
http://www.huffingtonpost.com/sean-mcelwee/sec-climate-change_b_4611933.html
Labeling this “The Pause” is completely misleading. It suggests that it is a short term interruption in an inexorable rise in the temperature of the Earth. It MAY be a pause. But nobody will know for decades if it was one. Until then I think it should be called the “Current Cooling Trend”.
I’ve changed the “Pause” to the “Stop” in Global Warming and the “Start” in Global Cooling.
Please make a note for future reference.
This article is just a little bit crazy. Not entirely, but certainly overconfident. The bottom line is we still don’t know the root cause of the pause. Full stop.
Then there’s this bravado:
The problem the IPCC has is it is fixated, obsessed, even, with temperature rise and temperature is a terrible indicator of the Earth/Sol energy balance as this article shows. The energy is arriving as it always has, but it is stashed here and there by the equivocal PDO process, and some equivocal thing causes all those energized molecules of what ever to form a crowd like lemmings and dash for the eastern Pacific and causing warming of the atmosphere. Ignoring the IPCC temperature curve, what if it were actually representative of energy imbalance that has not yet manifested itself as identifiable temperature rise? That seems very plausible since that is exactly what your discovery details.
Finally – we have no reason to celebrate these intervening cold years coming up if all the lemmings come home to roost in 2035. It is certainly looking like the climate is warming in the long term but in PDO-driven staircase steps and that those of you still alive in 2035 will see it unfold in real time. My own life will end in 10 to 15 years if left to nature so I’ll miss the fun.
With a possible extended period of reduced solar activity before us, it should make for an interesting period of study on the cyclical activity of the PDO … such as, will reduced solar activity result in weaker warm periods and stronger cool periods for the PDO during the period of reduced solar activity.
Makes this climate thingy a bit more complicated than projecting that CO₂ is making the climate warmer … probably just a bit player on a big stage with many larger, more potent actors driving things.
The 2001 Chinook salmon run in Alaska was good. When I looked into making another trip in the last several years, the run was poor, but I heard Oregon and WA had good runs in those years. So I take it the PDO means this will continue in the cool phase?
I think the PDO is the loose end of a fire hose, jetting this way and that, perhaps jumping sides of the Pacific Rise in response to Nino tides. The Pacific is the mother of all oceans, the Panthalassa. Its influence knows few bounds.
Bob,
Like both of you as tough fighters. I still bet on Don – you have to be really tough to endure the rain in Bellingham!
(from a cougar from WSU transplanted to Colorado)
Mike
Will the last person
believing CAGW –
turn out the lights.
Ouch that one is going to leave a mark.
For predictions of the timing and amount of the coming cooling based on the recent warming peak being a peak in both the 60 year PDO cycle and the 1000 year cycle in the temperature data see several posts at http://climatesense-norpag.blogpot.com
Link above should be
http://climatesense-norpag.blogspot.com
This is priceless. What do we pay these bureaucrats for if they can’t even answer a simple question?
EPA Head Unable to Defend President’s Warming Claims While Imposing Job-Crushing Climate Regs
I remain somewhat skeptical about the projected cooling. Humans have immense ability to see patterns where there are none. The climate remains inherently unpredictable. Anyway I rather hope it stays warm. Cooling is going to hurt.
Don Easterbrook: The color coding for your Figure 6 is wrong. You’ve presented trends. Just as long as the values are above zero, the trend is positive, meaning that global surface temperatures warmed during those 10-year periods. So the only time there is cooling in this graph is when the trend is less than zero! That is, cooling is not occurring from the peak around 2001 through 2010 as your color coding states.

And what kind of magical dataset did you present in your Figure 4?
There are no long-term global surface temperature reconstructions where the dip during the 1998-10 La Niña came close to reaching the values in the 1940s. Did you splice TLT data onto HADCRUT data? That’s what it looks like. Whatever it is, it’s bogus!
Mike Bentley, see my comment above to Easterbrook.
Nothing but net on the 3-pt shot indeed. As a Meteorologist, I also figured this out some years ago.
Thanks Don! Great, great post.
Ha! That BBC video ( http://www.bbc.co.uk/news/science-environment-25771510 ) mentioned by Eric Simpson and pat is just perfect for a quality late night laugh. I love how they all act as if this were brand spanking new, hot-off-the-press stuff. “NEWS FLASH (DATELINE, LONDON): IT HAS JUST BEEN DISCOVERED THAT THERE WAS ONCE THIS THINGY-DINGY CALLED THE MAUNDER MINIMUM…IT SEEMS THAT LOW SOLAR ACTIVITY CAN CORRELATE WITH LOWER TEMPS HERE ON EARTH…”
That’s not even the best part. (Gimme a sec — I’m laughing again, and I’m not just saying so to make a funny. Seriously.) Okay, I’m back. After saying over and over that reduced solar activity could make things relatively MORE cold, they never once even casually mention the logical flip side that increased solar activity might make things relatively LESS cold. Of course such dangerous thoughts would lead to the little people having dangerous thoughts of their own — can’t have that. I refuse to accept that everyone on that clip is truly too thick to have considered this, yet not a peep.
I have no idea how much value to place in any of the current hypotheses regarding the solar-climate link, but that a correlation (I didn’t say “causation”) has been documented on serial occasions in what is essentially very recent history is … hmm, how to put this … known to every climatologist on the planet? (Oh, God — here comes Leif. I’m in trouble now! :^> )
All of that is a long way to go to get to my real point, which is this: no matter what turns out to be the real, live ground truth as to what effects CO2 actually has on climate, the hard core warmists themselves do not believe in their own propaganda, even in reduced intensity format. People with the courage of their convictions do not tie themselves into knots keeping inconvenient facts from the public. When you truly believe the truth will set you free, you embrace pertinent facts and share them openly, convenient or not.
Apologies for what may seem an arrogant statement, but if you don’t get this simple, eternal truth of human nature, perhaps in order for you is the following tonic: one refresher on the scientific method, another on the practice of obscurantism, an epistemology course or two, and most importantly — a re-reading of Orwell. Time’s a wastin’ — chop chop!
Makes sense. Well done !
http://youtu.be/NkwJ-g0iJ6w
Several people (Easterbrook, D’Aleo, Joe B., to name 3, but there are others) seem to willfully not learn about the PDO. I’ve mentioned this a couple of times and Bob Tisdale has done so repeatedly. Now we have what likely could be a good report sent spinning topsy turvy into the dust bin because, because, ?? And Clay Marley @ 6:59 asks “does PDO drive the ENSO process” – Bob has answered this many times. I do agree with Clay about larger clear images.
We will shortly rue all the resources misspent on warming mitigation.
Clay Marley says:
January 17, 2014 at 6:43 pm
“Figure 2. 1945-1977 PDO cold mode and 1977-1998 warm mode. (Easterbrook 2011 modified from D’Aleo)”
—————-
I had pictured the warm trend as 1976/77 till 2006/07 approx. The 30+ year trend really fits well for the length of the graph. That would place the cool end around 2037, unless there is a shift at the 1/4 cycle around 2022. The CET graph clearly shows, in several places, 1/4 cycles where the first 15+ years is cool, then the next 15+ years is warm.
Clay Marley says: “Looks like, from Fig 2, a PDO cold phase would correspond to a strong La Niña and a PDO warm phase to a strong El Niño. But does PMO drive the ENSO process frequency or amplitude, or is it the other way around?”
The PDO is an aftereffect of ENSO. It’s actually inversely related to the sea surface temperatures of the North Pacific, where it’s derived, which makes it physically impossible for it to be doing what Easterbrook claims,. For more info on the PDO, what it is, and what it isn’t, see the posts here:
http://bobtisdale.wordpress.com/2011/06/30/yet-even-more-discussions-about-the-pacific-decadal-oscillation-pdo/
And here:
http://bobtisdale.wordpress.com/2010/09/03/an-introduction-to-enso-amo-and-pdo-part-3/
And here:
http://bobtisdale.wordpress.com/2010/09/14/an-inverse-relationship-between-the-pdo-and-north-pacific-sst-anomaly-residuals/
Keep in mind, Clay, that the PDO is also standardized (i.e. divided by it’s standard deviation). The standardization basically multiplies the “raw” PDO data by a factor of about 5.5, which increases it’s perceived value. That another reason it’s misunderstood.
Global warming has stopped and it’s a travesty Trenberth and his ilk continue to furiously doctor the models in a futile attempt to explain away the “pause” in CAGW parlance.
I’m sorry. My impression of reading the material at Skeptical Science is that there is NO HIATUS
or Pause! The world is still warming, its just that the “heat” is going into the deep oceans, oh, and its hiding in the Arctic. I am assured by the “consensus” scientist that this is true. After all, I read it on Skeptical Science! I was also told by a reliable friend to ignore the man behind the curtain…
/sarc.
“… there is NO HIATUS.” (Aussiebear)
THAT IS CORRECT! #(:))
Temporary (remember: Earth has been, overall COOLING FOR MILLENIA) warming (to the extent even that was real) has
STOPPED.
“Hiatus” is a misleading term.
Bob Tisdale says:
January 17, 2014 at 8:47 pm
That is, cooling is not occurring from the peak around 2001 through 2010 as your color coding states.
I figured out what the author did here. Bob, you are of course correct that a change of +3.5 and +3.0 are not cooling, but what the author meant to show was that from 1992 to 2002, the slope was +3.5 and from 1993 to 2003, the slope was 3.0. So in this sense, cooling occurred from 2002 to 2003 (and up to the present). However it may not have been the best way to show it.
I was going to say, Tisdale’s Who Turned up the Heat shows where the heat came from and where it went. Seems ENSO is where it’s all manifested to me.
This is all very well but can you make money out of it?
Some time ago, someone coined the expression ‘Natural Climate Cycle Deniers’ for alarmist theory believers.
It is a pity such an accurate description has fallen into disuse.
This is the most amazing thing of all to me! Six years after the FAR (IPCC’s first assessment report) a biologist in the Pacific Northwest (US) figured out PDO (1996), Ever since then all it’s been is silly buggers games. Expensive silly bugger’s games.
It simply has to be some sort of testament to H. sapiens intellect that it took ANOTHER 2 decades or so to see the forest for the trees!
One can only shudder to think how much longer it will take H. sapiens to glom onto the current age of the Holocene and what that might mean…..
The curious thing here is what we will do about the heathen devil gas CO2. If it is as fugly as prognosticated the last thing one might want to do is remove it at the half-precession old Holocene.
If it isn’t as fugly as prognosticated then removing it or leaving it up there will not materially impede onset of the next glacial.
The most important late Holocene question of all is who gets that?
michaelwiseguy says:
January 17, 2014 at 8:43 pm
————————————
I watched almost all of that last night. I almost lost my monitor several times, when listening to Boxer speak.
cynical_scientist says:
January 17, 2014 at 8:45 pm
I remain somewhat skeptical about the projected cooling. Humans have immense ability to see patterns where there are none. The climate remains inherently unpredictable. Anyway I rather hope it stays warm. Cooling is going to hurt.
——————————————————-
With most of the world,s governments looking out the wrong window, a cooling could become worse than it should be given that our level of technology should be able to manage well enough to support world needs with a little bit of foresight.
Russ R. says:
January 17, 2014 at 6:13 pm
Well done.
Geologists ROCK!
************************************
When I was a geology student at the University of Tasmania in the 1980s, I played drums in a rock band. We used to put posters up in the Faculty: Friday night, Geology’s own rock band — The Stones
If carbon(sic) causes Global warming, who would deny that the sun causes ice ages? If the sun does NOT cause ice ages, what does?
I know it been mentioned that the BBC has run with this story ( is The MSM starting to shift position ?)
“Is a mini ice age on the way? Scientists warn the Sun has ‘gone to sleep’ and say it could cause temperatures to plunge”
But so it the the Daily Mail
http://www.dailymail.co.uk/sciencetech/article-2541599/Is-mini-ice-age-way-Scientists-warn-Sun-gone-sleep-say-cause-temperatures-plunge.html
Just wait until Leif appears?
As an engineer I have relied on geologists to make accurate predictions for decades so this is not a surprise.
The Climate scientoligists have attempted to reinvent climate science in a shiny green agenda dress to steal it away from Geologists and Failed. LOL:)
From climategate emails:
Wils:[2007] “What if climate change appears to be just mainly a multidecadal natural fluctuation? They’ll kill us probably”
I think they all knew this was a distinct possibility.
This is the difference between driving a car over hills and valleys with your eyes open and driving up a hill with your eyes closed and thinking you’ll be going upwards forever!
Hmmm……….
http://wattsupwiththat.com/2010/09/26/bilderberg-group-discusses-global-cooling-at-2010-meeting/
goldminor says:
January 18, 2014 at 12:36 am
cynical_scientist says:
January 17, 2014 at 8:45 pm
“world needs with a little bit of foresight.”
The problem here is that there have only ever been two governance mechanisms practiced by H. sapiens on so large a scale; foresight and foreskin. Foresight necessarily includes hindsight: by knowledge (hindcast) we know with decent precision when we live; for instance, the half-precession+ old Holocene. Foreskin typically requires opportunity only. Being F’d around is not necessarily time dependent.
Life finds a way.
The intriguing thing is simply this: what role has/did flexible ethics play in our evolution?
We are what we are. We got here the way we did. Just how smart was/is that? Or was it opportunity only?
Only your hairdresser knows for sure……..
Bob Tisdale says:
January 17, 2014 at 8:47 pm
“That is, cooling is not occurring from the peak around 2001 through 2010 as your color coding states.”
You are indeed correct. But then so is he.
Sine = trend = Easterbrook
Cosine = value = Tisdale
Nobody seems to have mentioned the stadium wave hypothesis.
If 2014 is a cool year, it’ll break decisively below IPOCC’s 95%-confidence lower trend line, which will give us even more ammo.
When I look at the temperature record for the c20 I see a staircase. The temperature stays flat during the ‘cool’ periods and goes up during the ‘warm’ periods. So the picture is of a periodic process, like a sine wave, on which is superimposed an increasing trend. Where does the trend come from? Cycles so long that our data cannot reveal them, or CO2, or both?
The Mantua et al. curve looked so similar to my glacial curve that I superimposed the two and was surprised to see that they corresponded almost exactly.
I would be careful with statements like that – you could get Western Washington University shut down.
Ronald Daw says:
January 18, 2014 at 2:02 am
Nobody seems to have mentioned the stadium wave hypothesis.
Yes it would seem the decent human thing to do. There are very few decent human beings in academia.
Trust a geologist to get nearer to the truth. Thanks Dr Easterbrook but have a word with Bob Tisdale he is the resident PDO/ENSO expert.
Werner Brozek says: “So in this sense, cooling occurred from 2002 to 2003 (and up to the present). However it may not have been the best way to show it.”

Werner, not only is Figure 6 not the best way to show it, it’s misleading. After the peak in 10-year trends around 2001, the ten-year periods are simply warming at a lesser rate, until they drop below zero, then they’re cooling.
Additionally, as everyone knows, there are wide variations in 10-year trends. Why didn’t Easterbrook show them as well? So not only is Easterbrook’s Figure 6 misleading, it adds nothing of value to the discussion.
RichardLH, see my reply to Werner Brozek above.
RossCO says:
January 18, 2014 at 1:11 am
I wish to return the compliment. As a geologist I have striven to provide engineers the most precise envelope of natural conditions I can ascertain. They have always known exactly what to do with that. In respect of that respect, my geo-mentees have always been advised that the critical data they gather must be useful to the engineers that need it. Otherwise, as geologists, we are just wasting everyone’s time.
The thing is whatever is happening at the half-precession+ old Holocene simply isn’t anomalous, yet. Nothing I have read post 2005 supports greater than half-precession length for the Holocene. The operative quotation being found in the landmark paper by Lisiecki and Raymo (“A Pliocene-Pleistocene stack of 57 globally distributed benthic D18O records”, Paleoceanography, Vol. 20, PA1003, doi:10.1029/2004PA001071, 2005) being:
“Recent research has focused on MIS 11 as a possible analog for the present interglacial [e.g., Loutre and Berger, 2003; EPICA community members, 2004] because both occur during times of low eccentricity. The LR04 age model establishes that MIS 11 spans two precession cycles, with 18O values below 3.6 o/oo for 20 kyr, from 398{418 ka. In comparison, stages 9 and 5 remained below 3.6 o/oo for 13 and 12 kyr, respectively, and the Holocene interglacial has lasted 11 kyr so far. In the LR04 age model, the average LSR of 29 sites is the same from 398-418 ka as from 250-650 ka; consequently, stage 11 is unlikely to be artificially stretched. However, the June 21 insolation minimum at 65N during MIS 11 is only 489 W/m2, much less pronounced than the present minimum of 474 W/m2. In addition, current insolation values are not predicted to return to the high values of late MIS 11 for another 65 kyr. We propose that this effectively precludes a “double precession-cycle” interglacial [e.g., Raymo, 1997] in the Holocene without human influence.”
The geologist’s perspective as supplied to the engineer is simply this: (1) published final 2007 IPCC AR4 worst case estimate comes in at +0.59 meters amsl by 2099, (2) MIS-5e, the most recent interglacial, comes in at +6.0 M amsl at the bottom of the interval you may need to engineer for. Or an order or magnitude more than AGWs worst case, business as usual, scenario.
The upper envelope limit might be as much as +52 meters amsl (a factor of 88 times the AR4 worst case estimate), reportedly achieved in the Arkhangelsk area, northwest Russia by Lysa et al 2001 (http://lin.irk.ru/pdf/6696.pdf)
Even if we go back to the highest estimate of the MIS-11 highstand, +21.3 meters amsl (http://www.sciencedirect.com/science/article/pii/S0277379108003144)(paywalled), the most recent interglacial to also occur at an eccentricity minima, we are still going to have to do 35.5 times more sea level excursion than the AR4 worst case prognosticated +0.6 meters to get to +21.3 meters.
A natural range of possibly 1 to 2 orders of magnitude greater than the prognosticated anthropogenic “signal” necessarily means that engineers need not engineer for AGW. Not even CAGW.
The synthesis of geology and engineering suggests that AGW/CAGW must be at least 10 times more than that presently predicted to even reach the low-end of normal, natural, repeated end extreme interglacial climate noise.
If anyone here can provide coherent means and methods of separating a “signal” that at the very best is slightly less than 10% of the ambient noise level to slightly more than 1%, you will have an avid audience. Separating signal from noise at the sub-ambient noise level will probably always be considered a feat. Perhaps only the NSA is possessed of the technology to separate a signal ranging from ~10% to ~1% of the background noise. If not, this level remains to be achieved.
Engineers get this. I’m not sure who else does.
Easterbrook’s arguments seem convincing to me but as I am neither a climatologist nor a statistician my opinions don’t count for anything. However, if there is evidence that more heat is disappearing into the oceans, as supporters of the “consensus” maintain, wouldn’t that invalidate Easterbrook’s theory?
Clay Marley says: @ January 17, 2014 at 6:43 pm
….Precisely. 1945 to 1977 constituted the entirety of the cooling period that led to some fears of “Global Cooling” or another Ice Age….
>>>>>>>>>>>>>>>>>>>>
Actually it was a heck of a lot more that a cooling period.
Here is the actual story:
Nixon had the CIA look into the situation and a 1974 CIA report was written link
You can read the rest of the actual history of one of the most exciting discovers in geology HERE written by Nigel Calder who as science writer on the original staff of the New Scientist in 1956 and then editor in 1962 wrote about the story as it happened.
Now the warmists are trying to rewrite history and say the Ice Age scare of the 1970s never happened.
Now to confirm my earlier statement about Easterbrook’s Figure 4: The following is a graph of annual HADCRUT4 global surface temperature anomalies. As we can see, the dip in response to the 1998-01 La Niña does not come close to the values in the early 1940s as Easterbrook’s magical graph shows. Easterbrook’s Figure 4 is bogus.

Jeff L says: @ January 17, 2014 at 7:12 pm
Geologists Rule …. Climatologists drool !!
>>>>>>>>>>>>>>>>>>>>
Oh my, I have to have that as a bumper sticker or as a T-shirt!
pat says: @ January 17, 2014 at 7:59 pm
Boy would that blow the lid off the “Big Oil” funding fallacies and bite the warmists in the butt.
No way will it happen though. The puppet masters are not about to have their carefully covered up strings on display. But not to worry the Republicans will be blamed for doing the covering up. (Snicker)
A welcome dose of scientific common sense from Don Easterbrook. The question of what drives the PDO, AMO etc. should receive more attention in climate research.
Figure 5 (incorrectly referred to as fig 4 in the paragraph above it) does not show the regular frequency of warm to cold oscillation that one would expect from a direct astrophysical forcing. My guess is that the multidecadal oscillations are complex nonlinear oscillations driven in a bottom up way starting with the annual periodic forcing and phase-locking of the ENSO. From ENSO the PDO emerges as a nonlinear epiphenomenon, as Bob Tisdale argues. This emergent multidecadal oscillation could represent a Lorenz butterfly attractor.
A pause is not the same as cooling so to my mind the cool phase of the PDO is currently reducing an otherwise upwards trend. It should be possible statistically to remove the PDO influence and quantify the residual trend.
Dr Norman Page says: @ January 17, 2014 at 8:40 pm…
>>>>>>>>>>>>>>>>>>
Well that was weird.
I copied and pasted the URL and the page was a Jesus Saves /I was a Skeptic type blog with not a bit about climate in the entire blog!
Thought I would mention it in case you were hacked. (Your name gave me an entirely different blog.)
People should remember that temperatures are continually getting adjusted to remove the amplitude of these cycles.
They can’t do it all at once, but a 0.01C here and a 0.01C there every few months, adds up to a big change over a decade. (And they have been doing it for more than 20 years now).
ThinkingScientist says:
January 18, 2014 at 1:14 am
From climategate emails:
Wils:[2007] “What if climate change appears to be just mainly a multidecadal natural fluctuation? They’ll kill us probably”
I cannot believe ANY true scientist (or even someone with some basic scientific training/background) who has looked at the presented data, including palaeo proxy data, etc, – can look at such data and not immediately raise the question of ‘natural variability’ within the climate system.
So, no, I don’t think this was a possibility of being significant in their minds – I believe it was an absolute certainty that was completely ignored for potential financial/academic gain, etc. Whether this was ‘promoted’ by the politicos, we may never know for sure – but the fact remains that any scientist within the climate field who did not CONSTANTLY raise or caution against the natural variability issue – should be hung, drawn and quartered as being fraudulent or incompetent – take your pick which!
Good science without an agenda is refreshing. This appears to be good science. Although I have sceptical questions about the science and sceptical observations about the agenda, I like the idea that we can look at empirical data and make a best guess of where we are headed without overlaying any preconceptions regards Co2. That is Science and long may it thrive.
Don- I think it needs to be pointed out that you have been extremely close with your predictions starting in the early 200 – none of the IPCC contributors working on predictions or models have come even close to match what is happening with global temperatures. I have been using your work since 2002 and have been updating the slides whenever you had a new document – but presenting this to the students – is often a challenge. In particular students from the US – some of them from very prestigious institutions – have always been questioning my “conviction” of natural influence and cyclical nature of temps following PDO/AMO (etc). trends because they have been taught otherwise (i.e. CO2 and man-made controls). Just wanted to say thank you, Anthony and the other contributors for all your contribution to science over the years on this and some other blogs.
The sad thing is that the global warming crowd (I know – it is not “global warming” any more!) has been so influential in media and journal editorial positions, that promoting the “cause” in for example Science, Nature, etc publications will always be regarded as a top accomplishment and unis will make sure those people will keep getting grants, awards, acknowledgments, and get into those “political” positions! Therefore, it will take a long, long time to bring back real science to this field of climate science and real world data is often regarded sub-prime to computer model outputs!
Bob Tisdale says:
January 18, 2014 at 3:37 am
“RichardLH, see my reply to Werner Brozek above.”
I agree that his wording is poor. I did point out that his observation of ‘trend’ and your observation of ‘value’ are compatible.
Werner Brozek says: @ January 17, 2014 at 10:34 pm
I figured out what the author did here….
>>>>>>>>>>>>>>>>>>>>>>>>
What he is doing is showing a change in the RATE of warming. This is very significant and I wish Dr Easterbrook had made it clearer.
Lubos Motl and Gerald Roe can explain it better than I.
Easterbrook writes: “During these years, important contributions were made by Joe D’Aleo, who showed that during warm periods, warm El Nino phases occurred more frequently and with greater intensity than cooler La Nina phases and vice versa.”
Easterbrook continues to present his misunderstandings of the PDO. The PDO is an aftereffect of the ENSO.
As I’ve presented numerous times before, Zhang et al. (1997) was the first paper to determine and define the PDO. They determined the PDO was a response to ENSO.
http://www.atmos.washington.edu/~david/zwb1997.pdf
In Zhang et al (1997), the PDO was identified as “NP”, and they use Cold Tongue Index sea surface temperature anomalies (CT) as an El Niño-Southern Oscillation (ENSO) index. Zhang et al (1997) note:
“Figure 7 shows the cross-correlation function between CT and each of the other time series in Fig. 5. The lag is barely perceptible for TP and G and it increases to about a season for G – TP and NP, confirming that on the interannual timescale the remote features in the patterns shown in Fig. 6 are occurring in response to the ENSO cycle rather than as an integral part of it…”
Phrased differently, the PDO (NP) is an aftereffect of ENSO. One might conclude that Easterbrook’s assumptions are wrong when the paper that identified the PDO disagrees with Easterbrook.
See also Newman et al (2004):
http://courses.washington.edu/pcc587/readings/newman2003.pdf
The first sentence of the Conclusions of Newman et al (2004) reads:
“The PDO is dependent upon ENSO on all timescales.”
Both papers confirm that the PDO is an after effect of ENSO.
More recently, there’s Shakun and Shaman (2009) “Tropical origins of North and South Pacific decadal variability”. It also confirms that the PDO is an aftereffect of ENSO. In addition to the PDO, they use the acronym PDV for Pacific Decadal Variability.
http://ir.library.oregonstate.edu/xmlui/bitstream/handle/1957/18654/Shakun_and_Shaman_Geophys_Res_Lett_2009.pdf
The Shakun and Shaman (2009) conclusions read:
“Deriving a Southern Hemisphere equivalent of the PDO index shows that the spatial signature of the PDO can be well explained by the leading mode of SST variability for the South Pacific. Thus, PDV appears to be a basin-wide phenomenon most likely driven from the tropics. Moreover, while it was already known PDV north of the equator could be adequately modeled as a reddened response to ENSO, our results indicate this is true to an even greater extent in the South Pacific.”
These papers confirm my statements from past posts that the PDO is an aftereffect of ENSO. Those papers were also presented in a post from 2 years ago:
http://bobtisdale.wordpress.com/2011/06/30/yet-even-more-discussions-about-the-pacific-decadal-oscillation-pdo/
And Zhang et al and Newman et al were presented in my post from 3 years ago:
http://bobtisdale.wordpress.com/2010/09/03/an-introduction-to-enso-amo-and-pdo-part-3/
Easterbrook is aware of these papers, yet he insists on misinforming readers here at WUWT.
Easterbrook writes: “He also documented the role of the Atlantic Multidecadal Oscillation (AMO), which is similar to the PDO.”
There are no similarities between the AMO and PDO. The AMO is represented by detrended North Atlantic sea surface temperature anomalies. The PDO is not represented by detrended North Pacific sea surface temperature anomalies. The PDO is actually inversely related to the sea surface temperature anomalies of the North Pacific.
The PDO is the leading principal component of the North Pacific sea surface temperature anomalies after global surface temperature anomalies have been removed from the North Pacific data in their 5deg latitude X 5deg longitude grids. The PDO data is then standardized (effectively multiplied by a factor of 5.5) which inflates its importance.
Easterbrook is, in effect, comparing apples to the spatial pattern of the bumps on orange rinds.
I also addressed Easterbrook’s bogus-looking global temperature anomaly data in his “prediction” graph (his Figure 4 in this post) in a post from more than 2 years ago, yet he insists on continuing to mislead readers here at WUWT:
http://bobtisdale.wordpress.com/2011/06/17/comments-on-easterbrook-on-the-potential-demise-of-sunspots/
Mike Jowsey says: “Good science without an agenda is refreshing. This appears to be good science.”
Easterbrook’s post is misleading, it misinforms, it is contrived, it is far from “good science”.
Bob, have you ever considered that Hadcrud 4 might be BOGUS. !!
I understand why the AGW bletheren would use it,
But why are people seeking the truth still using it .???????
Doesn’t make any sense to me !
We KNOW its been massively adjusted to get rid of the peak in the 1940’s and that, pre-satellite, it most probably bears very little resemblance to reality.
RobB says: “A pause is not the same as cooling so to my mind the cool phase of the PDO is currently reducing an otherwise upwards trend. It should be possible statistically to remove the PDO influence and quantify the residual trend.”
The PDO does not have an influence on global surface temperatures so it is impossible to remove. The PDO does not represent the sea surface temperature data of the North Pacific, from which it is derived.
Bob: The data says there is a 60 year cycle to the data. HadCrut4, AMO and PDO.
http://www.woodfortrees.org/plot/hadcrut4gl/plot/hadcrut4gl/mean:180/mean:149/mean:123/plot/hadcrut4gl/mean:720
http://www.woodfortrees.org/plot/esrl-amo/plot/esrl-amo/mean:180/mean:149/mean:123
http://www.woodfortrees.org/plot/jisao-pdo/plot/jisao-pdo/mean:180/mean:149/mean:123
AndyG55 says: “Bob, have you ever considered that Hadcrud 4 might be BOGUS. !!”
Oh, I’ve considered it. But HADCRUT is based on data. Easterbrook’s fantasy version is obviously not. If it had been, he would have cited it’s source.
William McClenney says: @ January 17, 2014 at 11:33 pm
One can only shudder to think how much longer it will take H. sapiens to glom onto the current age of the Holocene and what that might mean….
>>>>>>>>>>>>>>>>>
Look on the bright side William, if you are correct H. sapiens is about to get another large boost in intelligence. :>)
(To explain)
One of Williams Articles: link goes into how major changes in hominid intelligence is linked to major challenges from glaciations. Links to all five parts HERE
Gail Combs says:
January 18, 2014 at 4:48 am
I had a typo in there, modern braincase measures closer to 1,500cc. My bad.
• The IPCC was established in 1988.
• The PDO was discovered in 1996.
• The Vostok ice cores (1998?) showed co2 rise followed temperature rise.
Would we have had this huge global warming scare if the IPCC had been established several years after the discovery of the PDO and the Vostok results? Are they really now so confident that co2 was responsible for most of the warming since mid 1970s? They may have doubts but will never openly come out and say it as it would ruin the game plan.
Thanks Mr. Easterbrook, that is a great article describing some great evidence based research. I learn a heck of a lot here.
Roy says: @ January 18, 2014 at 3:47 am
Easterbrook’s arguments seem convincing to me but as I am neither a climatologist nor a statistician my opinions don’t count for anything. However, if there is evidence that more heat is disappearing into the oceans, as supporters of the “consensus” maintain, wouldn’t that invalidate Easterbrook’s theory?
>>>>>>>>>>>>>>>>>>>
NO,
They have to PROVE that conjecture and the ARGO buoys that dive to a depth of 2000 meters have found no proof of heat moving into the depths of the oceans.
In other words it is a silly wild arse guess used to cover their behinds.
Bill Illis says: @ January 18, 2014 at 4:18 am
People should remember that temperatures are continually getting adjusted…
>>>>>>>>>>>>>>>>>
The temperatures in my locale get adjusted UP by 2-3 F (1-1.6 C) by the next day when the numbers become “Official” (my nearest weather station is a rural airport) I have been watching it happen on a regular basis for years.
The correlation between the PDO and global temperatures cannot be ignored. But the temperature graph is not periodic. It has a net trend upward. The net upward trend is more important than the periodicity that corresponds with the PDO.
If I understand Bob Tisdale, Easterbrook has the tail wagging the dog. ENSO causes the PDO. Variations in the Trade Winds (stronger winds, less clouds, more heat into the ocean) causes ENSO. So what causes the variations in the Trade Winds and is there a graph of this?
Could ENSO be a giant heat pump? When the Trade Winds blow more strongly heat is transferred into the oceans (and some makes its way into the atmosphere). When the winds return to normal, heat transfer returns to normal and there is a pause in temperatures. So ENSO would only lead to higher temperatures until interrupted by some greater process (e.g. M. cycles). Because when I look at the temperature record I don’t see increases and decreases. I see increases and pauses.
• “What drives these oceanic/climatic cycles remains equivocal.”
Incorrect. Constraints from laws of large numbers & conservation of angular momentum leave no such interpretive flexibility.
• “Correlations with various solar parameters appear to be quite good, but the causal mechanism remains unclear. “
mechanism = dead simple = trivial extension of Milankovitch
• “Mechanisms involving highly complex interactions of solar physics, magnetic fields and cosmic rays are on the cusp of delivering insights into possible mechanisms.”
This is wrong. The mechanisms are simple. Suggesting an important role for “complex interactions of solar physics, magnetic fields and cosmic rays” is counterproductive & unhelpful.
David L. Hagen says:
“Don Easterbrook
Congratulations on making your scientific predictions in the face of intimidation by the politically correct insisting it would warm.”
——————
I’d like to second that – steadfastly sticking to your facts-based position in the face of an overwhelming tide of lies and propaganda for so many years takes a certain character, certain traits I like:
Endurance.
Not willing to shut up.
Not bowing down to authority.
Willingness to hold and stick to a minority position.
Sticking to principles as a guide to actions.
Absolute faith that the truth will out.
Honest, trustworthy, etc.
Trivial Extension of Milankovitch
On the last page of a new article I put forth a (very specific) challenge to climate modelers.
•
[PDF]
Sun-Climate 101:
Solar-Terrestrial Primer
•
Sun-Climate 101 outlines law-constrained geometric foundations of solar-governed “internal” (a counterproductive misnomer) spatiotemporal redistribution (stirring) of terrestrial heat & water at a fixed, constant level of multidecadal solar activity.
Those with sufficiently deep understanding will recognize this as a 4-dimensional geometric proof.
See particularly item #5 on page 3, which underscores stirring & accumulation even with a fixed, constant level of multidecadal solar activity due to shifts & persistence of (large scale) terrestrial circulation that are an inevitable consequence of solar frequency shift.
It’s trivial and it’s geometrically proven.
The attractors (central limits) would be the same whether scrambled by white noise, spatiotemporal chaos, &/or lunisolar oscillations (the latter of which stand out clearly in observations).
The utility of these fundamentals extends beyond generalizing the role of stellar frequency in planetary aggregate-circulation to assessing the vision, competence, functional numeracy, honesty, & relevance of climate discussion agents, including those abusing authority.
Jimbo says:
January 18, 2014 at 4:58 am
• The IPCC was established in 1988.
• The PDO was discovered in 1996.
• The Vostok ice cores (1998?) showed co2 rise followed temperature rise.
“Would we have had this huge global warming scare if the IPCC had been established several years after the discovery of the PDO and the Vostok results?”
That’s a really good question Jimbo. The whole thing has the smell of “cold fusion” on it, doesn’t it? Whereas cold fusion has been examined closely since its introduction, AGW/CAGW confirmation is deferred to future generations. Only then, long after all current researchers and grants will have expired can the data pertinent to the hypothesis seemingly be obtained.
That is what makes this ultimate hoax pertinent. It need not be impeachable to be feared. It matters not that the scare-level is outrageously lower than anything actually recently achieved in the geologic record.
It’s all about belief structures, not knowledge structures. The Trenberth’s and Mann’s of our “modern day” delusions cobble all manner of fear fodder together. Belief structures. Why? Because it sells! And because the 90% can easily be sold by the 10% http://arxiv.org/pdf/1102.3931.pdf
In opposition other scientists might offer offer criticism/(denial). Perhaps for the briefest of moments in hominid evolution (Climategate) we get to see the dirty laundry. Which is actually as far as we seem to have come as a sentient species. Or at the very least those species (ours) that wrote their records down. And then altered them……
So that’s it! That is exactly how far we have come. Feel the late Holocene anthropogenic pride yet? I thought not……………..
>>>>>>>>>>>>>>>>>>>>>>>>>>>
A famous astronomer was once asked “Is there intelligent life in the universe?”
The famous astronomer gazed off into space and stroked his beard before replying. He then opined:
“There is some evidence on earth, but it is not conclusive………”
The defense rests.
I’ve been running monthly temperature reconstructions using these various natural cycles for awhile. (I haven’t had any luck using the PDO index, but for multi-decadal cycles, the AMO works much better and the southern ocean cannot be ignored – the Peru-Humbolt current and the southern Atlantic also have multi-decadal oscillations. In fact, the Peru-Humbolt current has a much more direct link to the ENSO regions than the PDO pattern has given this current feeds directly into the equatorial Pacific).
So here’s my reconstruction of Hadcrut4 on a monthly basis going back to 1856.
http://s27.postimg.org/g7jr0u15f/Hadcrut4_Model_1856_Nov2013.png
When you pull out these natural variables/cycles, one gets a pretty consistent steady warming trend. More steady than I seen in any other depiction. But it is a very low 0.037C per decade. One can also see in this chart, just how whacked out the climate models are now in reality. (The lines are on the same baseline and are completely comparable and NO Dana Nuccitelli-like playing around has been done here).
http://s16.postimg.org/5ofjo7bfp/Hadcrut4_Warming_1856_Nov2013.png
Going out to the year 2100 when we are supposed to have seen +3.25C of warming, the current trends are that we will get between +1.0C to +1.6C of warming.
http://s13.postimg.org/ays1nrxtz/Hadcrut4_Warming_1856_2100.png
Steve from Rockwood says: “So what causes the variations in the Trade Winds and is there a graph of this?”
The variations in trade wind strength are primarily a response to the changes in the temperature gradient (east to west)across the tropical Pacific. And the changes in the temperature gradient (east to west, cooler in the east than in the west on an absolute basis) across the tropical Pacific are primarily a response to the trade winds. They’re interdependent. Climate scientists use the word “coupled”. The temperature gradient and the trade winds reinforce one another, provide positive feedback, which is known as Bjerknes feedback.
There are, of course, additional weather-related factors that impact that feedback, and there are natural limits to how far the positive feedback can influence the strengths of the trade winds and temperature gradient of the tropical Pacific.
NOAA presents a number of trade wind indices here:
http://www.cpc.ncep.noaa.gov/data/indices/
Regards
“Each of the two PDO warm periods (1915-1945 and 1978-1998) and the three cool periods (1880-1915, 1945-1977, 1999-2014) lasted 25-30 years.”
Actually to 20 to 35 years.
Steve from Rockwood says: “Could ENSO be a giant heat pump?”
There are webpages that describe it as one. And a paper:
http://www.esrl.noaa.gov/psd/people/dezheng.sun/dspapers/ENSO-AGU/ENSO-AGU-final.pdf
Better (easier?) described as a chaotic, sunlight-fueled, naturally occurring, recharge-discharge oscillator, where El Ninos represent the discharge phase and La Nina represents the recharge phase (there is also redistribution of the leftover warm water that takes place during the La Nina).
Kev-in-Uk says:
January 18, 2014 at 4:19 am
I cannot believe ANY true scientist…
So, no, I don’t think this was a possibility of being significant in their minds – I believe it was an absolute certainty that was completely ignored for potential financial/academic gain, etc. Whether this was ‘promoted’ by the politicos, we may never know for sure –
>>>>>>>>>>>>>>>>>>>>>
I suggest you read Dr. Ball’s essay Overpopulation: The Fallacy Behind The Fallacy Of Global Warming
That CAGW is entirely political shows in these two quotes direct from the IPCC:
The IPCC mandate states:
The IPCC also said:
In other words the IPCC has known for 14 years that the Climate Models are crap that have no hope of predicting the next decade much less the next hundred years.
The banker’s stake in CAGW
Note: former IPCC chair Bob Watson worked for NASA then the World Bank while the IPCC chair and now is in the UK at Chief Scientific Adviser, Department for Environment, Food & Rural Affairs…
Pascal Lamy former Director-General of the World Trade Organization and possible new head of the EU executive, tells us the actual plans.
“The only way to get our society to truly change is to frighten people with the possibility of a catastrophe.” ~ Daniel Botkin emeritus professor Department of Ecology, Evolution, and Marine Biology, University of California, Santa Barbara.
“We wanted to make clear that a two degrees Celsius warmer world would be a disaster that we have to avoid…” ~ World Bank President Jim Yong Kim
Bob Tisdale The principal components of the temperature record temperature can be represented by the combination of a 60 year and 1000 year cycle in the temperature data. The 60 year cycle happens to coincide with the PDO .Which is a useful proxy for the temperature trends even if the PDO itself is driven by Enso events. The Enso itself is driven by a combination of changes in solar activity and the resonances in the Milankovitch cycles- especially whether the Precession insolation peaks falls in Northern or Southern hemisphere summer or winter. For a forecast of the coming cooling based on this simple observation of the periodicities in the temperature data and the current change in the neutron count as a proxy for changes in solar activity see http://climatesense-norpag.blogspot.com.
You do not have to calculate or even understand the physical processes involved in order to make quite useful predictions.
“…so I plotted the oxygen isotope accelerator measurements made by Stuiver and Grootes (1997) for the past 450 years. Oxygen isotope ratios are a function of temperature, so plotting them gives a paleo-temperature curve. This was a real eye-opener..”
The real eye-opener for me was that much of the ups and downs go in completely the opposite direction to what they do in the Central England Temperature series. 1665/6 was a high point on CET, 1675 was on CET, 1685-7 was higher on CET, 1694-5 was very low on CET, where from it rose to the 1720’s on CET. Through Dalton it was warmer in the first decade of the 1800’s than the second, it got warmer from 1820 to 1830 on CET, and fell into a very cool period up to 1845, all the opposite of the GISP series.
AndyG55, something else to consider. I’m sure most skeptics would appreciate a global surface temperature dataset that appeared as Don Easterbrook has presented in his Figure 4. Maybe if everyone asked Don to post its source, then we could all examine it and use it again in the future. But I suspect it does not exist. I suspect it’s a fantasy dataset.
Dr Norman Page says: “Bob Tisdale The principal components of the temperature record temperature can be represented by the combination of a 60 year and 1000 year cycle in the temperature data.”
Unfortunately, the PDO is inversely related to the surface temperature of the North Pacific.
Dr Norman Page says: “The 60 year cycle happens to coincide with the PDO.”
The 60-year cycle exists in some paleo reconstructions but not in others, so I suspect you’re using a paleo reconstruction that agrees with your 60-year assumption. Also, are the paleo reconstructions you’re using aliasing one another or aliasing some other factor and that’s the basis for their agreement?
You said, “There was no way to determine what the PDO looked like that far back”. Have you ever looked at the reconstructed PDO based off of tree-ring chronologies back to 993 AD by Macdonald and Case 2005? Would be interesting to see that compared with some of your charts.
RichardLH says: “The data says there is a 60 year cycle to the data. HadCrut4, AMO and PDO”
That’s well known.
And the relationship between the AMO and global surface temperature exists and it’s also well know, because the sea surface temperatures of the North Atlantic are part of global surface temperatures and the variations in the North Atlantic sea surface temperatures correlate with land surface temperatures for many parts of the globe.
http://bobtisdale.files.wordpress.com/2013/07/figure-82.png
But the PDO does not represent the sea surface temperature of the North Pacific and it is anti-correlated with land surface temperatures in the Northern Hemisphere:
http://bobtisdale.files.wordpress.com/2013/07/figure-92.png
Those maps are from this post:
http://bobtisdale.wordpress.com/2013/07/30/part-2-comments-on-the-ukmo-report-the-recent-pause-in-global-warming/
The fact that surface temperatures cool when the PDO rises and warm when the PDO drops certainly puts a crimp on Easterbrook’s assumptions.
Bob Tisdale says: @ January 18, 2014 at 4:33 am
….Easterbrook’s post is misleading, it misinforms, it is contrived, it is far from “good science”
>>>>>>>>>>>>>>>>>
ERRrrr, Bob didn’t Frank Lansner in his essay on The Original Temperatures Project show that oceans do influence the temperatures of the coastal areas?
Lansner says:
Since Don Easterbrook was looking at Mt. Baker, in the North Cascades of Washington State MAP, it is not surprising he found a correlation with the PDO. The WUWT thread GISS Swiss Cheese shows the surface temperature data collection is not exactly even and coastal areas are favored. Therefore a comparison to the ‘official’ global surface temperature is also going to find correlation with the PDO/AMO both of which have been in the warm phase.
I think what we have is a bit of the blind men and the elephant problem here and tantalizing glimpses of what effects the climate. I also think all three of you have done very good work which is more than I can say for the Climastrologists.
Bob Tisdale says:
January 18, 2014 at 6:50 am
“That’s well known.”
But often forgotten or not acknowledged. That we are currently at a peak in the 60 year cycle is rarely mentioned anywhere.
“The fact that surface temperatures cool when the PDO rises and warm when the PDO drops certainly puts a crimp on Easterbrook’s assumptions.”
So you are just observing that the phase of the two signals is out of step? I am not sure that it refutes his conclusions.
Bob Tisdale says: @ January 18, 2014 at 6:50 am
….But the PDO does not represent the sea surface temperature of the North Pacific and it is anti-correlated with land surface temperatures in the Northern Hemisphere…
>>>>>>>>>>>>>>>>>>>>>>>>
That needs to be repeated since it seems to be part of the confusion. Thanks for the clarification Bob.
It would be helpful if all writers of articles were to make themselves available to discuss their work in the accompanying comments thread.
Gail Combs:
At January 18, 2014 at 7:00 am
you say of Tisdale, Lansner and Easterbrook
SECONDED!
Richard
Bob You are still not getting my point – I’m not referring to temperatures in the Northern Pacific merely saying that when the PDO index is in its negative phase global temperatures generally cool and that there is an approximate 60 year cycle in the PDO index. Also I’m not using temperature reconstructions just looking at the actual temperature record over the last 100 years or so and power spectrum analysis of the temperatures over much longer interval by a number of people eg Scafetta.Most people don’t think that forecasting can be that simple – I believe it likely is. As for the 1000 year cycle see Figs 3 and 4 at the last post at
http://climatesense-norpag.blogspot.com
PJF says: “It would be helpful if all writers of articles were to make themselves available to discuss their work in the accompanying comments thread.”
Bingo. Sure would be nice for Easterbrook to provide a source for that global surface temperature dataset he provided in his Figure 4.
RichardLH says: “So you are just observing that the phase of the two signals is out of step? I am not sure that it refutes his conclusions.”
No. I’m observing that they are anti-correlated. You’re making an assumption that they’re out of phase. If memory serves, I believe you’ll find that the anti-correlation remains intact as you extend the time lag, until the point where the correlation no long has any significance.
Gail Combs says: “ERRrrr, Bob didn’t Frank Lansner in his essay on The Original Temperatures Project show that oceans do influence the temperatures of the coastal areas?”
After the nonsense that Lansner was pumping out a few years ago, I don’t pay attention to him. He’d argue until the post came off the front page of WUWT and then almost admit his mistake.
Gail Combs says: “I also think all three of you have done very good work which is more than I can say for the Climastrologists.”
Lansner’s posts were fatally flawed a couple of years ago. I don’t know if they still are, since I don’t pay attention to him. Easterbrook does more to mislead and misinform than to teach and inform. So where does that leave me, Gail?
provoter says:
January 17, 2014 at 9:30 pm
Ha! That BBC video ( http://www.bbc.co.uk/news/science-environment-25771510 )
————–
I did read the text on the BBC website re the “low solar activity” earlier today but I hadn’t seen the video. I didn’t find the reference to “more cold” but I’m glad I looked at the link. It’s a classic propaganda piece – from the masters of the art.
I was really with the video for the first 80%, thinking “wow, this is really good – even the BBC is reporting it” but then, of course, at the end – once you’re psychologically softened up – they deliver their real message (which is always designed to leave you in a state of confusion and fear – for more on this see the excellent documentary http://topdocumentaryfilms.com/the-power-of-nightmares/ ).
I took the trouble to transcribe what the so-called expert (I was going to give her name here but the video doesn’t appear to show it – have they stopped doing that?) said from the grounds of her North Downs home and it follows. But my point is that by this point in the video you’ve been sucked in: everything seemed so reasonable and made sense. So you trust the video and its actors. This is the point (5:25) where the real message is delivered, with reference to “global warming”:
“The world we live in today is very different to the world that was inhabited during the Maunder minimum, so we have human activity, we’ve had the industrial revolution, ehmm, all kinds of gases being pumped into the atmosphere, so on the one hand you’ve got perhaps a cooling of the sun, but on the other hand you’ve got human activity that can counter that.”
So you’re left kind of confused and afraid: “Oh no! Global warming sounded bad but cooling sounds pretty bad too…. Oh what to do…. Sounds like what ever I do I’m f*’d – even the experts agree… er….. or not. But global warming is real, yeah? Ok, I think I’ve got it”.
Anyway, I’ve seen this format (reasonableness and emotion followed by message) with BBC propaganda many times before. They are, really, masters of the art.
I think the message is “The warming is still there. I has not gone away. It is hiding, lurking in the shadows. It is going to GET you!”.
Dr. Easterbrook,
North Pacific (PDO), Central Pacific (ENSO) and the North Atlantic (AMO) are area of fundamental importance to climate change, while Arctic and Antarctic mainly respond to the ocean currents N. Atlantic inflow and circumpolalar current’s oscillations respectively. It should be of some interest to the climate science (if not currently, then sometime in future), that tectonic activity in the three key areas and corresponding climate indices show close correlation as shown
HERE
Bob Tisdale says:
January 18, 2014 at 7:27 am
“No. I’m observing that they are anti-correlated.”
http://www.woodfortrees.org/plot/hadcrut4gl/plot/hadcrut4gl/mean:180/mean:149/mean:123/plot/hadcrut4gl/mean:720
http://www.woodfortrees.org/plot/esrl-amo/plot/esrl-amo/mean:180/mean:149/mean:123
http://www.woodfortrees.org/plot/jisao-pdo/plot/jisao-pdo/mean:180/mean:149/mean:123
Looks like a phase offset to me.
The only online data that I have is from WFT. Can you point me to a longer series?
Sorry the link to the above doc does not work – it used to. Here’s one that appears to, so far:
https://archive.org/details/ThePowerOfNightmares-Episode1BabyItsColdOutside
RichardLH: The JISAO PDO data only exists back to 1900 because they’re so little source data. There are longer PDO datasets, but they’re based on infilled data. So you’d be doing a statistical analysis of the infilled not source data.
Bob: Do you agree that there is a periodic signal to the various data sets? At around 60 years?
In his long comment @ 4:30 am, Bob Tisdale says
The PDO is the leading principal component of . . .
Many people might read that and not realize the very specific mathematical meaning of “principal component.” Courses (or equivalent study) in algebra and statistics are needed and if you don’t have that background you likely are not going to understand from reading blog posts and comments.
Years ago one of the main folks doing PDO work (Bob, I don’t have the link now or the name) explained this issue visually. He wrote something like this: **Look at a Rugby ball from one end and the silhouette will have a round shape. Look at it from the the side and the silhouette becomes egg-shaped. Call the circular shape +1 and the oval shape -1. Numbers in between represent the spatial shape of the silhouette as the observer moves from end to side. The pattern is represented by a number. **
Note the use of the concepts of pattern and spatial. In the case of the PDO, the index is for a small part of the great Pacific Ocean and it is not an index of sea surface temperatures.
In the search for the cause of the pause (the OP) we learned from the author that the PDO was the culprit but what causes the PDO is “equivocal”.
PDO -> Pause/Not Pause
Then Tisdale boils to the top to say the PDO is a consequence of ENSO. So the gear that turns the wheel of PDO is connected to the ENSO gear, ending the equivocation. What then is in the shadows of the Earth/Sol energy system that turns the gear that drives ENSO?
(Shadowy stuff) -> ENSO -> PDO -> Pause/Not Pause
To cut to the chase, we are seeking the root cause of the pause – the engine that makes it happen, bonus points for identifying the drive chain that stands between the engine and the pause.
Earth/Sol Energy System -> Engine -> Shadowy stuff -> ENSO -> PDO -> Pause/Not Pause
A reasonable answer is “we don’t know”. I think too it is the only reasonable answer and that is why we don’t all agree on why the climate has done what it has and what it will do next.
Enso, PDO, AMO whatever blah, blah blah
is still controlled by whatever is coming through the atmosphere
Never mind Don, who it seems, does not even read this blog
Here is my final report on this
http://blogs.24.com/henryp/2013/04/29/the-climate-is-changing/
where I determined that the climate is controlled by external factors, e.g.
http://www.nonlin-processes-geophys.net/17/585/2010/npg-17-585-2010.html
So, during global cooling, at the higher latitudes it will become cooler
Would some of you guys perhaps want to give a comment on my latest results for Alaska?
http://tinypic.com/view.php?pic=2ql5zq8&s=5#.UtqXa9L8I2w
Bob Tisdale says:
January 18, 2014 at 6:24 am
——————————————
Thanks Bob, for both the comments and the links. Regarding the charging and discharging effect of El Nino, La Nina this would not explain the net effect of warming since 1850. It is almost as though the El Nino warms and the La Nina pauses.
Don – you have written twenty papers, apparently exploiting the idea of PDO influence on climate. Good way to handle that publish or perish situation but in my opinion a dead end. It has no explanatory power except perhaps for salmon fishery. And I am not too sure of that either because Alaska salmon just went up to 16 dollars per pound in my supermarket. Lets go back to basics. The hiatus exists, you can’t deny it because official temperature curves all show it. It has lasted for the entire length of this century, and if you include the super El Nino, back to 1997. Atmospheric carbon dioxide just kept on going up but there was no warming. Greenhouse theory from IPCC tells us that addition of carbon dioxide to the air will cause greenhouse warming because Svante Arrhenius says so. Since theory predicts warming and there is no warming, that particular theory is wrong, case closed. True believers are now looking for the lost heat, especially Trenberth, who at one time lost 80 percent of global heat. If I had been the reviewer for that paper I would have sent him back to learn about Argo floats that reported the loss. But buddy reviewers have to be nice to big shots and can’t order them to fix their erroneous work. There are now two questions that need to be answered. The first is an explanation of why the theory failed. The second is an explanation of how is it possible for this failure to happen so suddenly if global warming was on course at least since 1988 when Hansen reported it. The answer to the second question is that the underlying assumption of warming through the years is false. So-called “climate” scientists reporting this were not just incompetent but at times criminal with their temperature reports. I became aware of this doing research for my book “What Warming?” Satellite temperature record for the eighties and nineties showed an eighteen year stretch of The ENSO oscillation where global temperature stayed the same. Ground based curves showed a “late twentieth century warming” in that same time slot. It was obviously phony and I put a warming about it into the preface of the book. Nothing happened for two years but then I found out that GISTEMP, HadCRUT, and NCDC had suddenly decided not to show this warming again. What they did was to line up their data for this time period with satellites that never showed the fake warming. It was done secretly and no explanation was given. We can now add these eighteen years to the current hiatus of 17 years and find that the total no-warming period is 35 years. 17 years is enough to convince me that the greenhouse effect does not exist. 35 years is a bonus that puts the icing on the cake. It is extremely improbable from this that any of the earlier warming can be greenhouse warming. It is actually easy to prove this by using the Keeling curve and its extension from the Law Dome in Antarctica. The combined curve for the entire twentieth century is smooth except for the yearly wiggle from falling leaves. Now it happens that in order to start a greenhouse warming you must increase the amount of atmospheric carbon dioxide at the same time. In the twentieth century there were three known instances where warming suddenly started. These happened in 1910, in 1976, and in 1999. From the Keeling curve and its extension we see that there was no corresponding increase of carbon dioxide at these dates. We can therefore say with extreme confidence that there was no greenhouse warming at all during the entire twentieth century. That takes care of history but what about the IPCC theory that went KAPUT? It turns out that the Hungarian scientist Ferenc Miskolczi published the correct theory of greenhouse gases in 2007. His theory encompasses the more general case of several greenhouse gases simultaneously absorbing in the infrared that Arrhenius cannot handle. In such a case, an optimum absorption window exists that the gases involved jointly control. In the earth atmosphere the two gases that count are carbon dioxide and water vapor. The IR optical thickness of their optimum absorption window is 1.87. It corresponds to a transmittance of 15 percent or an absorbance of 85 percent. If we now add carbon dioxide to the atmosphere it starts to absorb as the Arrhenius theory says. But this will increase optical thickness and as soon as this happens water vapor will begin to diminish, rain out, and the optimum optical thickness is restored. That is what is causing the hiatus now and what also happened in the eighties and nineties, and before that. The addition of carbon dioxide simply does not cause global warming and money spent on “mitigation” is a total waste. Time to cancel out the laws designed to fight an imaginary warming and return the economy to normalcy.
Bob Tisdale on January 18, 2014 at 6:24 am
Steve from Rockwood says: “Could ENSO be a giant heat pump?”
There are webpages that describe it as one. And a paper:http://www.esrl.noaa.gov/psd/people/dezheng.sun/dspapers/ENSO-AGU/ENSO-AGU-final.pdf
Better (easier?) described as a chaotic, sunlight-fueled, naturally occurring, recharge-discharge oscillator, where El Ninos represent the discharge phase and La Nina represents the recharge phase (there is also redistribution of the leftover warm water that takes place during the La Nina).
I’m happy to hear you describe the ENSO as a chaotic oscillator, I agree of course. In addressing Don Easterbrook you assert repeatedly that the PDO is an “aftereffect” of the ENSO. This in no way contradicts anything that Don said, he left the cause of the PDO as unknown. He just accepted it as a fact. Do you accept it as a fact?
Have you any suggestions for a mechanism by which the ENSO nonlinear oscillator can generate as an aftereffect a multidecadal cycle switching between two phases? Could it be the two wings of a Lorenz butterfly attractor for example?
I have posted the theories of Dr. Willam Gray more than once. His thoughts, as I understand them, are that ENSO variability is driven by the MOC. Hence, we have MOC -> ENSO -> PDO. The MOC also drives the AMO.
http://typhoon.atmos.colostate.edu/Includes/Documents/Publications/gray2012.pdf
The MOC is the giant circulation within the global oceans. It speeds and slows down due to density differences (and other possible factors) across the entire planet. When the MOC speeds up you get more cold water upwelling and flowing up the west coast of S. America. This cold water enhances the trade winds which reduces the probability of seeing El Nino events. It also means that warm surface water spends less time giving up heat before it is driven to the poles, cools and submerges.
This circulation could also be behind the longer term changes like the MWP and LIA.
As some have indicated the most recent PDO probably ended around 2005-7. Here’s a graphic that ties the phases of the PDO to hadrut4:
http://woodfortrees.org/plot/hadcrut4gl/from:1850/to/mean:10/plot/hadcrut4gl/from:1880/to:1912/trend/plot/hadcrut4gl/from:1912/to:1944/trend/plot/hadcrut4gl/from:1944/to:1976/trend/plot/hadcrut4gl/from:1976/to:2005/trend/plot/hadcrut4gl/from:2005/to/trend/plot/hadcrut4gl/from:1850/to:1880/trend
As one can see the trends match perfectly. Remove the adjustments made to the data and we are left with a very minor warming trend with variations due to the oceans.
From Dr. Gray’s paper:
So now we have:
Equivocal stuff -> MOC -> Climate Change
where “Climate Change” seems to enfold ENSO and all things to the right of it. But we’re still left with that secret sauce on the left side. Maybe it’s time to bring in James Burk.
Equivocal stuff -> MOC -> Climate Change
Here’s one possibility. During a melt-water pulse at the end of any glacial period we get a surge of lower density cold water into a small part of the MOC. Generally the water flows into the North Atlantic or Arctic Oceans. We then have this difference in density taken around the world over hundreds of years. When it tends to be located on the top of the oceans the MOC slows down (and vice versa). This could explain the MWP, LIA, etc.
The other question would be what drives the 60 year cycle within the larger much-century cycle. I lean towards a gravity driven model. Lunar tides possibly or maybe some variation within the Earth’s core.
Yeah, this is all speculative but rather than a wiggle matching approach this proposes a reasonable mechanism that could be tested.
RichardLH says: “Bob: Do you agree that there is a periodic signal to the various data sets? At around 60 years?”
Considering that I wrote this post…
http://bobtisdale.wordpress.com/2013/05/14/multidecadal-variations-and-sea-surface-temperature-reconstructions/
…and this post…
http://bobtisdale.wordpress.com/2013/10/14/will-their-failure-to-properly-simulate-multidecadal-variations-in-surface-temperatures-be-the-downfall-of-the-ipcc/
….it would be easy for anyone to observe that I have prepared posts that show multidecadal variations in surface temperature data with “cycles” of about 50 to 80 years.
But you’ll note that I did not present the PDO in them. When discussing the multidecadal variations in the sea surface temperatures of the North Pacific, I used the sea surface temperature anomalies of the North Pacific or the detrended sea surface temperature anomalies there. I used the right tool for those discussions.
Bob Tisdale’s tirade against my posting distorts and misrepresents my work. His demagoguery and personal insults do nothing to advance science. Nothing he has said disproves my predictions, which so far seem to be right on track. My 1999 predictions have so far proven to be correct–what happens in the next few decades will show whether I’m right or Tisdale is right. In the meantime, I prefer to let nature and time judge my work.
I’m heading out the door to the airport so won’t be able to respond further.
Doln
phlogiston says: “In addressing Don Easterbrook you assert repeatedly that the PDO is an “aftereffect” of the ENSO. This in no way contradicts anything that Don said, he left the cause of the PDO as unknown.”
Easterbrook presents the correlation between the PDO and global surface temperature. This suggests that the PDO drives global surface temperatures. Unfortunately, there is no mechanism through which the PDO (as defined by JISAO) can drive global surface temperatures, so the premise is flawed.
phlogiston says: “Do you accept it as a fact?”
I accept that ENSO creates the spatial pattern in the North Pacific, which many call the PDO pattern (warm in the east and cool in the central and western North Pacific during El Nino, etc.). I’ve presented it numerous times. But I also understand that there are other variables that influence the spatial pattern of sea surface temperature anomalies in the North Pacific, and that that those variables are sea level pressure and winds.
Dr Norman Page says:
January 18, 2014 at 6:26 am
You do not have to calculate or even understand the physical processes involved in order to make quite useful predictions.
==============
This point is all too often overlooked. Look at history. Successful prediction comes first, following from observation. This tells us we are on the right track. From this we determine the mechanism. As we learn more, we find that almost universally there is another mechanism underneath what we thought was the mechanism, on to infinity. Thus, the modern insistence on mechanism as a condition of prediction is largely a nonsense. Such a requirement assumes that the unknown is finite in size, and rather small. Pretty much limited to the thing we are investigating.
ferdberple You say ” this point is all too often overlooked” – actually it is almost always overlooked by the establishment and the skeptics, both of whom prefer arguing mechanics and process rather than using simple common sense. Humanity’s capacity for ignoring the obvious is practically limitless especially when ones professional reputation and income depend on it.
Bob
“AndyG55, something else to consider. I’m sure most skeptics would appreciate a global surface temperature dataset that appeared as Don Easterbrook has presented in his Figure 4. Maybe if everyone asked Don to post its source, then we could all examine it and use it again in the future. But I suspect it does not exist. I suspect it’s a fantasy dataset.”
Long ago I suggested to Anthony that he require posts to have data and code.
Willis does it and EVERYONE benefits it opens the door to others who may have special talents. It hastens corrections. It builds confidence.
easterbrook and his pals ( scafetta ) and others refuse to follow the most basic requirements. show your work. It makes their work utterly reliable.
Don J. Easterbrook says: “Bob Tisdale’s tirade against my posting distorts and misrepresents my work.”
No tirade on my part, Don. Please post a link to the source of the global surface temperature data you presented in your Figure 4. That way we can confirm if your “predictions” were based on a real dataset, not some fictional one.
Don J. Easterbrook says: “His demagoguery and personal insults do nothing to advance science. Nothing he has said disproves my predictions, which so far seem to be right on track.”
Demagoguery? I presented my opinions about your Figures 4 and 6. There’s nothing emotional about it, Don. My speaking frankly does not indicate emotion on my part. And my presenting real data in place of your mystery data indicates that I was being rational. I can see why you might have been insulted by my calling your Figure 4 bogus and your Figure 6 misleading. Until you provide a source of the data you presented in your Figure 4, I will continue to describe it as bogus. And until you correct the color coding of your Figure 6, it will be misleading.
As I noted in a recent reply above, my argument is not about your “prediction”. You presented a correlation between the PDO and global surface temperature. This suggests that the PDO drives global surface temperatures. Unfortunately, there is no mechanism through which the PDO (as defined by JISAO) can drive global surface temperatures, so the premise is flawed. That’s my argument in a nutshell.
It is unfortunate that you didn’t bother yourself to answer all of the questions presented to you on this thread by others…before you hopped on a plane. They are sure to be disappointed with your continued absence here.
I’m looking forward to your link to the dataset you illustrated in your Figure 4.
Have a nice holiday or business trip.
So, In 12 or 13 years, when the “pause” is over, we have to again listen to the Warmistas crow about how the Earth is going to burn up and kill us all?
Congratulations, Don, on this wonderful synthesis of your long a lonely battle! Now is the time for anyone with “scientist” in their bio to begin pressing their professional organizations (mine is the American Physics Society) shamefacedly to withdraw any and all official policy statements (the APS one is quite “hysterical”) claiming AGW is a world-class, immediate, life-threatening must-send-money-quick crisis. The credibility of the entire scientific enterprise is at risk from a continuation of this orgiastic rent-seeking.
DocWat says: “So, In 12 or 13 years, when the “pause” is over, we have to again listen to the Warmistas crow about how the Earth is going to burn up and kill us all?”
It looks like you’re assuming a 30-year halt starting in 1999. To me it appears that La Ninas became dominant around 2007 at the end of the 2006/07 El Niño. Recall that there were 3 El Niños every other year in the early to mid-2000s. And those El Ninos appear to be secondary events of the 1997/98 El Nino.
http://www.cpc.ncep.noaa.gov/products/analysis_monitoring/ensostuff/ensoyears.shtml
2007 was the start of the “double-dip La Niñas”. We had one before the 2009/10 El Niño and one after it. If the breakpoint is in fact 2007, and assuming the halt lasts for 30 years from then, then we’ve got more than 2 decades to watch global warming enthusiasts make excuses and pint fingers.
Please edit my post to correct typos “…long and lonely…American Physical Society…” Apologies.
Me too – as it seems to suggest that temperatures in the 2000s were consistently below those in the 1990s.
……or is the post-2000 bit part of the Easterbrook projection? Can anyone clarify?
Bob Tisdale says: “….But the PDO does not represent the sea surface temperature of the North Pacific and it is anti-correlated with land surface temperatures in the Northern Hemisphere…”
Gail Combs says: “That needs to be repeated since it seems to be part of the confusion. Thanks for the clarification Bob.”
Bob has repeated that statement many, many times in previous threads here and elsewhere.
William McClenney says:
January 18, 2014 at 3:41 am
Thanks to William from an engineer. I don’t want to cause a scene, but any empirical formula that produces successful results, even if flawed or wrong – will be used until something better comes along and that isn’t GIGO. Back in the 60’s I was told a computer is “nothing but a fast idiot”. Very often a slide rule, nomograph and graph paper produced better results until we got the computer parameters sorted out. I can put in all the parameters for a complex water system and run it through a computer simulation for days; or apply some good engineering fundamentals, nomographs and safety factors and get the same results. But that is engineering – applied sciences.
Sciences on the other hand, are research that some day may provide a basis for engineering. For now, anyone who depends on climate models rather than solid researched applied science and geosciences is likely to get some nasty surprises.
Great discussions, but I must keep reminding myself this site is about research, science, opinion and competing theories/philosophies and not engineering so nothing is as certain (even in engineering there is never “certainlty”).
Thanks to everyone for the educational information.
Bob Tisdale on January 18, 2014 at 1:04 pm
phlogiston says: “In addressing Don Easterbrook you assert repeatedly that the PDO is an “aftereffect” of the ENSO. This in no way contradicts anything that Don said, he left the cause of the PDO as unknown.”
Easterbrook presents the correlation between the PDO and global surface temperature. This suggests that the PDO drives global surface temperatures. Unfortunately, there is no mechanism through which the PDO (as defined by JISAO) can drive global surface temperatures, so the premise is flawed.
Bob you appear to be contradicting your own argument. There appears to be an issue of definitions and semantics here. You have set out at great length in your book “who turned up the heat” your central premise that large ENSO events elevate global temperature in a stepwise manner. You further state that the Pacific ocean alternates between multi decadal periods of el Nino and La Nina dominance. What you imply is what Joe D’Aleo ( as cited by Don Easterbrook) and many others in the literature describe as ENSO asymmetry. Your focus is mostly on the recent few decades which show an el Nino > La Nina asymmetry. You are cautiously silent about the flip side of this scenario, that there must be alternating periods of the opposite asymmetry i.e. La Nina > el Nino. This is the alternation that many would recognise and describe as the PDO. Many in the literature imply the PDO in another way using the term “ground state” of the Pacific, which alternates between favouring el Nino and La Nina.
So the “PDO” is sometimes a shorthand for multidecadal ocean driven cycles in general. The proposal that the “PDO” drives global climate is not exclusive to Don Easterbrook, many have made it and it has now even been published in Nature. You imply it in your own writing but don’t like to admit it. Don Easterbrook has at least published it many times for which he deserves credit. He made a prediction that the recent warming period would reverse before the current “pause”.
Marcia Wyatt and Judith Curry essentially make the same argument in a more sophisticated way in their stadium wave paper, where they extend it beyond just the PDO and bring in the other global oceanic oscillations such as the AMO.
Finally, you use what looks like argumentum ad ignorantium in saying “Don cant say that the PDO drives global climate because he doesn’t have a mechanism”. This sounds like a “the models dont predict it” type argument. On the subject of mechanisms why do refuse to answer my question about what mechanism you propose for the PDO being an aftereffect of the ENSO?
I’m a great fan of your work but it seems you’re being a tad territorial about ENSO and the PDO. You are right of course to call out Don on data sources and validity.
John Finn on January 18, 2014 at 5:22 pm
Me too – as it seems to suggest that temperatures in the 2000s were consistently below those in the 1990s.……or is the post-2000 bit part of the Easterbrook projection? Can anyone clarify?
Its a projection. It was presented in a conference in 2001 (see text).
Richard M
I agree with your point concerning the strong influence of the MOC / THC in climatic trends and that it is a mistake to exclude this when discussing ENSO. Thanks also for bringing to our attention the work of Dr William Gray, I’ll check out the paper.
phlogiston: The PDO means different things to different people. The PDO can mean the variability of ENSO. It can also refer to a dataset. This is why I have argued that when discussing ENSO another phrase should be used–Pacific Decadal Variability (PDV) for example.
Once the PDO dataset is introduced into a discussion, the term PDO is no longer referring to the variability of ENSO on any time frame.
Trenberth understands the difference, so the question is: why did he and Fasullo use the PDO instead of an ENSO index like NINO3.4 SSTa? I suspect he wanted or needed the breakpoint of 1999 that came with a newly created PDO dataset (he didn’t use the JISAO version), and that, if he used NINO3.4 data, then it could be argued that the ENSO breakpoint was in fact 2007. Maybe it has to do with the ORA-S4 reanalysis as well. Something to ponder, phlogiston.
Here’s a link to Trenberth and Fasullo (2013). Reading between the lines, why aren’t they using an ENSO index?
http://onlinelibrary.wiley.com/doi/10.1002/2013EF000165/pdf
Enjoy the rest of your weekend.
Regards
phlogiston, PS: Papers like von Storch et al (2013) are using 1998 as the start of the hiatus. Obviously, Trenberth is trying to shift that to 1999 which does impact the hiatus period trend. The models still look bad, but not as bad.
Regards
phlogiston says:
January 18, 2014 at 6:33 pm
Its a projection. It was presented in a conference in 2001 (see text).
Taking a close look at the diagram, I agree, but furthermore I think the projection actually started from 1998 since the “IPCC projected warming” seems to start in 1998. So it seems to me that the extra low point that Bob Tisdale mentioned was also a projection.
(I recall a very recent post by Dr. Ball where an issue was brought up repeatedly and was never answered. It would be nice if any person doing a posting would be available for at least the following 4 hours to address issues that may arise.)
Bob Tisdale,
Dang it, Bob! All you’re doing here is strafing your own allies! Your disagreements with Dr. Easterbrook and Dr. Page are a distraction from what should always be a determined focus on the main target: Refuting the false CO2 scare mongering of Anthropogenic Global Warming pseudoscience and the irrational megalomania it is driving in our national governments and energy policies! In comparison to THAT, your differences with Drs. Easterbrook, Page, and others are trivial.
Please, Please! Stop strafing your own troops and allies and get your sights focused on the main target…again!
Mac
Paul Vaughan says:
January 18, 2014 at 5:52 am
================================
You quote Sidorenkov thus: “[…] the asthenosphere underlying the lithosphere does not behave like a solid body but rather flows like a viscous fluid. […]”
This seems to be an invention on his part– “viscous” maybe, but in the sense that very warm glass is viscous, flow rates being in the range of centimeters per year. dLOD of 1ms amounts to displacement of half a meter per day, hundreds of meters per year. What seismic or ceramic evidence supports such a peculiar characterization of the asthenosphere? –AGF
Mac the Knife says:
January 18, 2014 at 9:07 pm
===============================
While we are engaged in ideological warfare with radicals, unlike the radicals we are also engaged in the pursuit of truth. We have no need of any appearance of false unity like the CRU crew are so fond of projecting. The fact remains, the “deniers” are more in line with the IPCC than Gore and Hansen, and here at WUWT nothing could be more healthy than debate between conflicting views. We don’t agree about much of anything besides the obvious point that when you pull the cover off the junk science, the radicals don’t agree about anything either. We have no need of anthing but complete transparency. –AGF
Given the following:
1. Werner Brozek says: January 17, 2014 at 10:34 pm
Re: Bob Tisdale says: January 17, 2014 at 8:47 pm: “That is, cooling is not occurring from the peak around 2001 through 2010 as your color coding states.”
I figured out what the author did here. Bob, you are of course correct that a change of +3.5 and +3.0 are not cooling, but what the author meant to show was that from 1992 to 2002, the slope was +3.5 and from 1993 to 2003, the slope was 3.0. So in this sense, cooling occurred from 2002 to 2003 (and up to the present). However it may not have been the best way to show it.
*********************************
2. Bob Tisdale says: January 18, 2014 at 3:35 am
Re: Werner Brozek says: “So in this sense, cooling occurred from 2002 to 2003 (and up to the present). However it may not have been the best way to show it.”
Werner, not only is Figure 6 not the best way to show it, it’s misleading. After the peak in 10-year trends around 2001, the ten-year periods are simply warming at a lesser rate, until they drop below zero, then they’re cooling.
…………………………..
Dear Mac,
You make a good point (at 9:07pm today). Bob Tisdale is an exceptionally conscientious scholar and scientist. However, the very LOUD noise Tisdale is making in the course of correcting Easterbrooks’ apparently ham handled graphs via his assertions that the warming has not stopped but only slowed OVERWHELMS any tiny bit of truth we are gaining about trends versus data values.
We are, indeed, in a war for truth. At ALL TIMES, we need to be aware of that fact, otherwise, we play into the enemy’s hands. The manner in which to correct Easterbrook on such a detail is privately or, at the least, ALSO AFFIRM THE BASIC TRUTH THAT WARMING (to the extent that it is, indeed real) HAS STOPPED. Instead of simply knocking down Easterbrook’s poorly constructed rocket, give him (and, thus, all of us) the blue-print for re-building it so that we end up launching our offensive missile and hitting the target. As it is, we are just sitting here looking at Tisdale standing triumphantly over the shattered ruins of Easterbrook’s graphs.
The upshot of Tisdale’s remarks is to, indeed, promote AGW. I was dismayed as I read Tisdale’s comments. Accuracy is good, but AFFIRMATION of the main truth:
CO2 UP –> WARMING STOPPED, is the most important thing, here.
All that said, Easterbrook has failed miserably to provide:
1) his data; and
2) to be present for questioning (unless his absence was due to an emergency).
Take care, down there, in The Socialist State of Seattle (ugh),
Janice
An Open Letter to Bob Tisdale:
Dear Bob,
In my “How dare he talk that way to my friend, Mac” vehemence above (for, my post was mainly aimed at refuting A.G. Foster’s smirking attack on Mac), I spoke a bit too strongly. Hypocrite that I am (eye roll), I did not follow my own advice and affirm YOU for the good you have brought to this thread.
Thank you for your so diligently answering questions above and, although with a bit of a narrow focus, doing your best to keep us precise and accurate. Thank you for so generously sharing your many, many, painstaking hours of research with us all over the past months (years, for many here).
Most of all, I respect and value you as a valiant ally in this battle for truth-in-science and very much want you to know that, despite my standing by the essence of my comment just above, I still admire you highly and am sorry for speaking so harshly. I let my emotions get the best of me a little, there. Can you forgive my bluntness? (btw: that’s nothing compared to how I used to talk to Dr. Svalgaard (before I understood him better))
Hoping your answer is “Yes,”
Janice
Janice Moore says:
January 18, 2014 at 10:36 pm
All that said, Easterbrook has failed miserably to provide:
1) his data; and
2) to be present for questioning (unless his absence was due to an emergency).
Take care, down there, in The Socialist State of Seattle (ugh),
Janice
Hey Sweet Pea!
I agree with your points about Dr. Easterbrook. I really appreciate Bob Tisdales precise work but I am a pragmatist that understands that team mates can have differing views about how specific nuances of the game should be played inside the club house but on game day, we all play to win! Team building is a hard thing to learn and to teach. I know – I’m a rather rebellious and cantakerous cuss myself. I can’t say as I’m an expert at it… but I have built some fairly effective engineering and technical teams at the big aeroplane factory. And every now and then, one of the more intelligent team mates has to be ‘taken to the wood shed’ because of their unwillingness to just accept the minor differences in viewpoints amongst the team members. I was ‘taken to the wood shed’ several times in my early career, for just such similar indiscretions, by a mentor that taught me well:
Keep Your Eyes On The Prize!
I hope the sun was shining on you today, Janice!
Mac
Oh, Mac, thanks, so much, for responding. I was hoping you would. I hope you could see from my post above that we agree COMLETELY. Re: your leadership ability (I know you weren’t fishing for affirmation, just want to!) — just yesterday, I was listening to a Chuck Swindoll sermon while I did my BOOOORRRRING Pilates stretching on “What Makes a Good Boss” — and guess who I thought of (after myself, of course, LOL, I ALWAYS think about myself first, heh, heh) as exemplifying leadership skills? YOU. I can tell just by how you write and when you choose to say something and what you say (and what little you’ve said about the ol’ office). I’ll bet you are terrific. Tough to be a manager… I hope you have all the authority you need to easily execute the responsibility you’ve been given. (And a straightforward way of not only rewarding (is Operation Eagle still going? I helped with that a little as a college student), but getting rid of the bad apples (THAT is soooo hard — everyone else keeps passing them on to the next barrel instead of just firing their annoying selves). I hope you get lots of atta boys — managers usually don’t.
Well, enough already!
The sun didn’t shine, but, I saw lots of blue sky — hurrah! (and the stars, ah) And, thanks to you, my day is ending on a good note.
Bye for now,
Janice
agfosterjr says:
January 18, 2014 at 9:37 pm
Mac the Knife says:
January 18, 2014 at 9:07 pm
===============================
While we are engaged in ideological warfare with radicals, unlike the radicals we are also engaged in the pursuit of truth. We have no need of any appearance of false unity like the CRU crew are so fond of projecting. The fact remains, the “deniers” are more in line with the IPCC than Gore and Hansen, and here at WUWT nothing could be more healthy than debate between conflicting views. We don’t agree about much of anything besides the obvious point that when you pull the cover off the junk science, the radicals don’t agree about anything either. We have no need of anthing but complete transparency. –AGF
+++++++++++++
agfosterjr: I think this is well stated.
agfosterjr says:
January 18, 2014 at 9:37 pm
Mac the Knife says:
January 18, 2014 at 9:07 pm
===============================
While we are engaged in ideological warfare with radicals, unlike the radicals we are also engaged in the pursuit of truth. We have no need of any appearance of false unity like the CRU crew are so fond of projecting.
agfosterjr,
Who said anything about false unity or any falsehoods?
Explain your allegation.
Mac
@ Mac — A.G. Foster will never get it; he’s a great 1st Lieut. (great on technical details and knows “the book” inside and out), but would never make a good general.
@ Mario — Mario! Waaaa, that made me sad. Well, we’ve had our first fight. Sniff. Still pals, though (I hope). Yours, truly, Janice.
Mac the Knife says: “All you’re doing here is strafing your own allies! Your disagreements with Dr. Easterbrook and Dr. Page are a distraction from what should always be a determined focus on the main target: Refuting the false CO2 scare mongering of Anthropogenic Global Warming pseudoscience and the irrational megalomania it is driving in our national governments and energy policies!”
We can’t do it with lies, Mac. Figure 4 includes a cartoon-like version of global surface temperature anomalies that is far from reality. And Figure 6 is blatantly wrong.
Bob Tisdale says:
January 18, 2014 at 12:50 pm
I am sorry that you think I am attacking you. I admire and appreciate the work you do. I do NOT mean to imply that the PDO drives anything. It could well be following something for all I know.
Mine was purely a simple piece of observation. That there is a 60 year (or thereabouts) in the data sets. (The data is WAY too short to give precise values to anything really and, anyway, this is an ‘organised chaos’ environment at best. Unlikely to give precise sine waves).
As Janice also noted above, Easterbrook’s poor wording about ‘cooling’ whilst meaning ‘trend of cooling’ is like sine and cosine as I tried to put to you also.
I will try and improve my words better so that I do not cause offense in the future.
phlogiston says: “Its a projection. It was presented in a conference in 2001 (see text).”
Wrong. The following is an early version of the Easterbrook projection.
http://wattsupwiththat.files.wordpress.com/2008/12/agu2.png
See the post here:
http://wattsupwiththat.com/2008/12/29/don-easterbrooks-agu-paper-on-potential-global-cooling/
Figure 4 in this post was updated sometime between 2008 and now. For Figure 4, Easterbrook spliced on bogus-looking data after 1998.
RichardLH says: “I am sorry that you think I am attacking you.”
Never crossed my mind, Richard. We were simply having a discussion.
Regards.
Janice Moore: There was no reason for me to be concerned about your bluntness, Janice, so no apology is necessary. Similarly, you’ve interpreted my comments to Don Easterbrook as being loud, when I, like you, was simply being blunt.
Regards
Right – so it’s a projection as we can see from Don Easterbrook’s comment: “I spliced a cool PDO (similar to the 1945-1977 cool period) onto the end of the curve and presented the data in a paper at the 2001 Geological”
I’m still a bit confused. Don has included a dashed line to indicate cooling similar to 1945-77 which seems to start – well – about now in 2013/14. The solid line implies a continuation of the dataset. Incidentally, which dataset is it? It is unrecognisable to me – and several others apparently.
I, therefore, have a number of questions.
1. When does the 1945-77 splicing start – in 2001 or later? If it’s in 2001 why does the earlier bit appear part of the data while the latter part is displayed as a dashed line.
2 Why does the 1945-77 splice look nothing like the 1945-77 data in the “Easterbrook” dataset. The 1945-77 data looks broadly flat whereas the splice shows a decline of about 0.5 deg from 2000 and about half that from 2012/13/14/whatever.
3 On what evidence does Don justify a temperature decline of 1 deg between 1790 and 1820.
4 And to repeat earlier requests: Which dataset is don Easterbrook using?
The BBC has a story on why the floods on the Thames!
http://www.bbc.co.uk/news/uk-england-oxfordshire-25793358
Oops. Sorry. Wrong tab. Was intended for http://wattsupwiththat.com/2014/01/18/flooding-in-the-somerset-levels-a-case-study
What a l of people are overlooking is that, if the warmists turn out to be wrong and this is all a natural multi-decadal cycle, the nex decades are going to not only be part of a “cooling” trend, but during them we’re going to see many of the wild predictions of the warmests coming true.
i.e.
– more atlantic hurricanes
– stronger hurricanes
– shorter food growing seasons > less food / higher food prices
– leading to famines in already fragile/tenuous political economies
– more flooding
– etc
I fully expect them to, at some point, switch on a dime and start trumpeting how they told us this was going to happen all along …
Don J. Easterbrook: I apologize for not first congratulating you on your prediction back in the early 2000s that global surface temperatures would cease to warm for a few decades.
Your first prediction graph that I can find on WUWT is Figure 2 in the December 2008 post here. The caption reads:
But it’s very obvious the data actually ended in the late 1990s and your “predictions” began at 2000. If we now overlay real data (NCDC global surface temperature anomalies), we can see that your “prediction” is too low, but it’s not bad.

The real problem lies in your newer “prediction” graph. The problematic “prediction” graph that you used in this post first appeared (as far as I can tell) in the November 1011 WUWT post here. There your caption for the illustration reads:
But anyone with a keen eye can tell that’s not real data after the mid-1990s. In fact, the 1997/98 El Niño is missing. Refer to the following animation that again overlays NCDC global surface temperature data onto your graph.
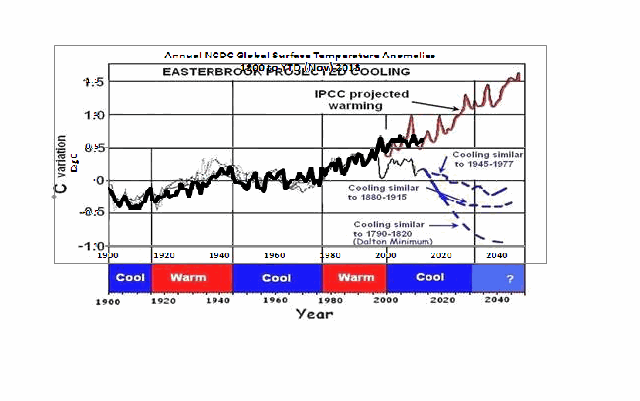
The problems with the mystery data are obvious. Your prediction falls far below the actual global surface temperature anomaly curve, and the data actually falls in line with whatever IPCC model you presented.
Will you supply the source for the data in that graph, as many have asked of you on the thread above? In lieu of that, will you issue an errata for the blog posts and journal papers in which that graph appears. As you’re aware, that prediction graph you presented as Figure 4 in this blog post also appears as Figure 59 in your 2011 paper Geologic Evidence of Recurring Climate Cycles and Their Implications for the Cause of Global Climate Changes – The Past is the Key to the Future. Does it also appear in other peer-reviewed publications? Or will you continue to ignore the problem and “let nature and time judge [your] work”?
A lot of people have faith in you as you can tell by the well wishes on this thread. The ball’s in your court.
PS: I went to your climate publications webpage to check the paper Easterbrook, D.J. and Kovanen, D.J., 2001. The next 25 years: global warming or global cooling? Geologic and oceanographic evidence for cyclical climatic oscillations: Abstracts with Program, Geological Society of America, vol. 33, 253. But the link no longer works.
phlogiston & John Finn: Thanks for finding this quote. Easterbrook wrote in the post, “… I spliced a cool PDO (similar to the 1945-1977 cool period) onto the end of the curve and presented the data in a paper at the 2001 Geological Society of America meeting in Boston.”

I believe that means Easterbrook spiced smoothed PDO data (starting about 1945) onto the end of the smoothed global surface temperature data (ending about 1995). In other words, he shifted the PDO data back in time 50 years, smoothed it with about a 10-year or longer filter, then scaled it and shifted it upwards to “fit” onto the end the global temperature data.
If that’s the case, then it’s remarkable, because Easterbrook’s been presenting it as global surface temperature data. Whatever it is, it’s really misleading
Janice Moore says:
January 18, 2014 at 10:36 pm
Thank you for your comments here. I know you were quoting someone else here:
After the peak in 10-year trends around 2001, the ten-year periods are simply warming at a lesser rate, until they drop below zero, then they’re cooling.
However I think that the warming at a lesser rate was actually misleading on Figure 6. It is actually cooling from 2002 to 2012 and 2002 to date for that matter as shown below.
http://www.woodfortrees.org/plot/hadcrut4gl/from:2002/to/plot/hadcrut4gl/from:2002/to:2012/trend/plot/hadcrut4gl/from:2002/trend
Bob Tisdale says:
January 19, 2014 at 1:50 am
Figure 4 includes a cartoon-like version of global surface temperature anomalies that is far from reality.
I am wondering if he put in the wrong graphic by mistake here.
Werner Brozek, Easterbrook used that graph in other posts here at WUWT. And he used it in at least one paper. I don’t think it was a mistake.
Regards
Mac the Knife says: @ January 18, 2014 at 11:27 pm
…. And every now and then, one of the more intelligent team mates has to be ‘taken to the wood shed’ because of their unwillingness to just accept the minor differences in viewpoints amongst the team members. I was ‘taken to the wood shed’ several times in my early career, for just such similar indiscretions, by a mentor that taught me well:
Keep Your Eyes On The Prize!
>>>>>>>>>>>>>>>>>>>>>>>>>>
I will agree with you there.
None of us has a monopoly on the truth and often only see a tiny bit of the whole truth. Also it is very easy to get tripped up on the use of words to describe what you mean. It can be very frustrating when talking to someone who does have a more extensive vocabulary when trying to describe a point or a much less extensive vocabulary.
That is probably the best part of WUWT. We have many different people from many different fields bring in different knowledge. It is important NOT to let ego get in the way of the exchange of ideas and the formulation of a better picture of how our climate operates. That is the prize we all want.
Well done. You’ve illustrated the main problems with the Easterbrook graphics perfectly.
Fig 4 is an embarrassment to all responsible climate sceptics.
Bob Tisdale says: @ January 19, 2014 at 8:03 am
Bob could he be using Steve Goddards data? (Tongue in cheek)
http://stevengoddard.files.wordpress.com/2010/10/1998changesannotated.gif?w=500&h=355
Steve just found a huge error in the USA data: http://stevengoddard.wordpress.com/2014/01/19/just-hit-the-noaa-motherlode/#comment-310458
Steve is showing adjustment over the last century of over 1.5C!!!!
Janice Moore says:
January 19, 2014 at 12:59 am
==================================
If I were keen on ideological warfare, here is what I would do. I would identify pro GW blogs which do not practice censorship, go there, and shout about Exit and Jorge Montt glaciers, which as far as I know, have not been mentioned together in one sentence by anyone but me.
–Private Foster
Gail:
Your petard, ma’am:
” It can be very frustrating when talking to someone who does have a more extensive vocabulary when trying to describe a point or a much less extensive vocabulary.”
Say what?
Bob Tisdale says:
January 19, 2014 at 6:34 am
Don J. Easterbrook: I apologize for not first congratulating you on your prediction back in the early 2000s that global surface temperatures would cease to warm for a few decades.
Your first prediction graph that I can find on WUWT is Figure 2…….
Bob Tisdale,
Your communique of Jan 19 @ 6:34am is precisely how your issues with Easterbrooks article should have been handled from the very start: Polite and Direct. All of the other harsh words only created unnecessary antagonism combined with an extended ‘time suck’ of wasted energy.
Blogs like this can be a bit of an electronic echo chamber, a synthetic reality. But ‘out there’ in the world of hard matter, in our world of hard physical matters, the AGW megalomaniacs are shutting down our cheap and efficient coal fired power plants based on the false hypothesis that the CO2 they emit is pollution! Out there, in an increasingly cold and unreliably powered world, the AGW fanatics are turning off our heat and turning out our lights…..
You can continue to expend your considerable talents on ‘time sucks’ like the extended comments to this post have been… but ‘outside’ the lights are dimming around us as the AGW cadres use false science to destroy our power plants.
Focus on the main target and expend your precious, prodigious talents there, my friend!
Best regards,
Mac
Bob Tisdale says:
January 19, 2014 at 9:16 am
I don’t think it was a mistake.
OUCH! I was hoping it was a mistake. Guess who is pouncing all over Don for the obviously low predictions from 1999.
Brian H says: @ January 19, 2014 at 12:48 pm
… Say what?
>>>>>>>>>>>>>>>>>>>>>>>>>>>>
Bob T. has specialized in ENSO and he has a much better vocabulary to describe what he means. Don Easterbrook does not from what I can tell.
Tisdale
Easterbrook’s hypothesis that PDO is the cause of global cooling and warming observed in the last century is supported by the research of Dr. Roy Spencer to quote:
“A simple climate model forced by satellite-observed changes in the Earth’s radiative budget associated with the Pacific Decadal Oscillation is shown to mimic the major features of global average temperature change during the 20th Century – including three-quarters of the warming trend.”
“While the PDO is primarily a geographic rearrangement in atmospheric and oceanic circulation patterns in the North Pacific, it is well known that such regional changes can also influence weather patterns over much larger areas, for instance North America or the entire Northern Hemisphere (which is, by the way, the region over which the vast majority of global warming has occurred).”
“Spencer and Braswell (2008) showed theoretically that daily random variations in cloudiness can actually cause substantial decadal time-scale variability on ocean temperatures. This is not a new finding, as it was also demonstrated over 30 years ago (Hasselman, 1976) and is related to the fact that the ocean, due to its large heat capacity, retains a ‘memory’ of past changes in the Earth’s radiative budget for a very long time.”
“When the feedback is removed, we see a good match in Fig. 5 between the low-frequency behavior of the PDO and the radiative forcing (which is presumably due to cloud fluctuations associated with the PDO). Second-order polynomials were fit to the time series in Fig. 5 and compared to each other to arrive at the PDO-scaling factor of 1.9 Watts per square meter per PDO index value.”
“The evidence presented here suggests that most of that warming might well have been caused by cloud changes associated with a natural mode of climate variability: the Pacific Decadal Oscillation.”
http://www.drroyspencer.com/research-articles/global-warming-as-a-natural-response/
Dear Mr. Tisdale,
So, there is “no reason” for my being blunt to be of concern to you. Wow. Always good to know where one really stands with someone. I mistakenly thought that we were pals of a sort, thus, my speaking so bluntly could potentially hurt your feelings. I didn’t realize that your heart is impervious to any bluntness from me. Thanks for being so candid.
You miss at 2:48am (not intentionally, I’m going to assume) my main point,
(here: http://wattsupwiththat.com/2014/01/17/cause-of-the-pause-in-global-warming/#comment-1540873)
however, which is NOT that your tone was “loud,” but that the content of your comments above (which I took pains to quote at length in my comment) supports AGW.
I am now, not only “dismayed,” but sad. I have completely mis-read you in these past months. And that’s my problem. Live and learn.
Thanks again for sharing all your research with us, and
for taking the time to respond,
Janice Moore
Janice Moore, you’ve misunderstood what I wrote. I’m never concerned about someone being straightforward, candid, direct to the point. There’s no reason to mince words. That was my point.
Dr. Strangelove, Dr. Spencer has now changed the metric to ENSO that he uses for the Pacific variability. Check out his newer paper.
Janice Moore says: “…the content of your comments above (which I took pains to quote at length in my comment) supports AGW.”
If that’s your interpretation, then you’ve misread and misunderstood what I’d written. Don’t worry, I haven’t turned to the other side.
Cheers.
An alternative ‘Cause for the Pause’.
Null Hypothesis = Scenario C
A more scientific, statistical, claim that can be made about the above ‘slogan’ is
The longer that Global Surface Temperatures track Scenario C, the more likely it is that Climate Sensitivity is ~0.0.
There are only two questions that need answering.
1. Is it true that Global Surface Temperatures are tracking Scenario C?
(see http://snag.gy/FeWzn.jpg)
2. Is it fair to characterise Scenario C as having a Climate Sensitivity of ~0.0 given that greenhouse gasses did NOT track the levels after 2000 as proposed in that scenario but that Global Surface Temperatures HAVE tracked it rather well?
Notes about http://snag.gy/FeWzn.jpg:
1. Original image
‘http://web.archive.org/web/20010223232940/http://www.giss.nasa.gov/edu/gwdebate/’
which is Hansen’s original publication.
2. New observations are from GISS and scaled to match the original figure.
How is the 2006-now trend map done from MODIS data? I can find only anomalies on their page.
The attached graph best illustrates to me the key point that Bob is trying to make . The NORTH PACIFIC SST and PDO are not directly related. They are inversely related.
.http://i52.tinypic.com/ipaxjr.jpg
herkimer says:
January 20, 2014 at 6:14 am
“The NORTH PACIFIC SST and PDO are not directly related. They are inversely related.”
The PDO is an abstract quantity. You can reverse the sign without changing its meaning. So then they would be directly as opposed to inversely related.
RichardLH
Yes you can do anything with an abstarct quantity, but it is a bit of a stretch to then claim that an abstract quanity with a reversed sign ” drove global climate ” I think Bob is just saying that wth all the improved understanding that we have of the various factors affecting climate , we can now be more selective of the words and meaning we assign to the various factors. PDO is a pattern or spatial indicator only and if you imply that it works in the same manner as AMO which is a temperature indicator you can mislead the reader without further explanation . I have no further comment
Bob Tisdale says: @ January 20, 2014 at 1:01 am
Dr. Strangelove, Dr. Spencer has now changed the metric to ENSO that he uses for the Pacific variability….
>>>>>>>>>>>>>>>>>>>>>>
And Don Easterbrook needs to be led in the same direction. I think a lot of people who are not careful with their vocabulary use PDO to mean ENSO or El Niño when they mean ENSO.
Care with vocabulary is why I cringe every time I hear someone say they have a Thoroughbred Great Dane. (I wonder if it was the stud that was a race horse…..)
Don Easterbrook: I apologize for being rude in my comments on this thread.
I will also ask that you correct your Figure 6 in this thread and update your Figure 4 on this thread and the follow-up post quickly. It should take less than 1/2 hour of your valuable time, and will put an end to this discussion.
Those are tiny NOAA charts. Where are they from? What sensors?
Is this a pause? Is warming over with? Have you ever watched the temps when summer approaches? The cycle of temps go up a little, then down, then up a little more, then back down… until summer hits and the heat stays. Seasonal changes are never a constant slope. Who knows what the planet is doing, but quoting a few years worth of charts seems… short sighted. And slapping around a lot of curious terms… befuddling. Too, too funny.
I apologize if I seem argumentative, but since you were using NOAA charts, I thought I’d head over there and see what they have to say about this. The NOAA site talks about global warming and each link and most charts in that section seem to all say global warming exists. They say that CO2, global surface temps, global mean sea levels are at an all time high and that snow cover extent has decreased in the U.S. by 10% since 1966.
To quote one section of theirs: “For Northern Hemisphere temperature, recent decades appear to be the warmest since at least about 1000AD, and the warming since the late 19th century is unprecedented over the last 1000 years.”
You folks are confusing me especially since NOAA charts seem to be picked apart to support some other perspective. I like how NOAA simplifies the numbers over the long haul. Not short.
Thanks.
An update and graph from Dr. Easterbrook has been added to the body of the post.
IMO low latitude ocean currents (& the energy or heat content they carry) are a major driver of climate on the water planet. The present glacial climate mode was initiated by the closure of the Isthmus of Panama about three million years ago. Before that time, equatorial currents could flow more freely from the Pacific into the Atlantic.
Earth was already in an Ice House phase from about 34 million years ago, when Antarctica was finally separated South America & Australia by deep ocean channels. But the connection of North & South America led to changes in ocean circulation that caused ice sheets to grow in the Northern Hemisphere as well as on Antarctica.
Previously, equatorial currents ran clear across the globe, thanks to the early Cenozoic Tethys Sea, of which the Mediterranean, Caspian, Aral & possibly Black Seas are remnants. Its eastern end was closed by the collision of the Indian & Eurasian tectonic plates starting in the Eocene, but for much of the Oligocene & Miocene, Atlantic water could still reach the Indian Ocean between Europe & Africa at low latitudes.
Within our Ice House, the extent of NH glaciation has been shown driven by orbital mechanics on the scale of tens to hundreds of thousands of years. But what drives the shorter term fluctuations on decades to millennia would still be controversial were it not for the baleful influence of the Carbon Cult.
IMO likely candidates deserving more research are, extraterrestrially, the seemingly small fluctuations in solar irradiance & magnetism, and terrestrially, volcanism, to include superplume activity. Man-released CO2, not so much.
Reference a decent book titled “Unstoppable Global Warming Every 1500 Years” by S. Fred Singer and Dennis T. Avery, 2007 Rowman and Littlefield Publishers Inc.