El Niños and La Niñas are parts of naturally occurring, sunlight-fueled processes—amazing processes—that produce warm water and redistribute it from the tropical Pacific. When I was first able to fathom the processes, when they finally clicked for me, I was in awe of Mother Nature’s handiwork. Cloud cover, sunlight, ocean heat content, sea surface temperatures, sea level, surface winds, ocean currents, etc., all interwoven, all interdependent, with the events occurring at massive scales. I’ve been sharing their complexity, magnitude and aftereffects ever since. Hopefully, this post will allow you to gain some insight–or spark your interest.
El Niño and La Niña events are extremely important parts of Earth’s climate. They are the dominant mode of natural climate variability on annual, multiyear and decadal timeframes. El Niño and La Niña events impact everything from drought and rainfall to surface temperatures around the globe. Consider this: El Niños and La Ninas occur in the tropical Pacific, but more than a decade ago it was determined that they rearranged sea ice in the Southern Ocean surrounding Antarctica. Recently, they were even linked to temperature of the water below the Antarctic sea ice, through changes in ocean wind patterns. See Dutrieux et al. (2014) Strong Sensitivity of Pine Island Ice-Shelf Melting to Climatic Variability and the corresponding ScienceDaily article here.
The following is Section 1 from my ebook Who Turned on the Heat? This presentation was created to fill the gap between overly scientific texts and the basic (but way too simple) descriptions of El Niño and La Niña processes that are available on the internet. As I noted above, hopefully, it will help you to understand those seemingly complex processes. Please ask questions.
Notes: I’ve struck through text from the book (strikethrough) where it refers to other sections of the book, and I deleted a short note that refers to a feature of Abobe readers (the book is in pdf format). This post contains 29 illustrations, so it may take a little while to load. If they don’t appear full-sized, just give them a click.
[START OF SECTION 1 OF WHO TURNED ON THE HEAT?]
1.1 Preliminary Discussion of the ENSO Annotated Illustrations
Most introductions to the El Niño-Southern Oscillation (ENSO) on the web include boiler-plate descriptions and three illustrations: one each for El Niño, La Niña and ENSO-neutral phases. The reader has to jockey back and forth, scrolling up and down, to read the text and compare it to the illustrations. Unfortunately, much of what’s discussed in the text of those ENSO introductions isn’t shown in the graphics. To overcome that, I’ve prepared a 29-cell series of annotated (cartoon-like) illustrations that first introduce readers to background information about the Pacific Ocean. There are also introductions to trade winds and ocean currents, both of which have important roles in ENSO. With multiple cartoon-like illustrations for each phase and the transitions between them, the reader is taken through a complete cycle of ENSO phases: ENSO neutral to El Niño, back to ENSO neutral, on to La Niña, and then back to ENSO neutral. At each phase, the interaction between sea surface temperatures across the tropical Pacific, trade winds, sea surface height, precipitation and subsurface ocean temperatures are illustrated and discussed. Also presented are the differences between El Niño and La Niña events and the reasons why global surface temperatures vary in response to ENSO events.
To reinforce and confirm what’s presented in this section, Section 3 includes more-detailed, data-reinforced descriptions and illustrations.
1.2 The ENSO Annotated Illustrations

# # # # #

# # # # #

# # # # #

# # # # #

# # # # #

# # # # #

# # # # #

# # # # #

# # # # #

# # # # #

# # # # #

# # # # #
Now’s a good time to take a quick break from the cartoon-like illustrations. We’ll go into more detail in Section 3 about the interrelated processes taking place before an El Niño, but it’s important now to reinforce what’s been discussed so far. I’ll reword the presentation a little with hope that it will help make things click for you.
The trade winds are an important part of our discussion of ENSO-neutral, or “normal”, conditions in the tropical Pacific. They blow from east to west across the surface and cause the surface waters to also travel from east to west. That makes sense. If you blow on a liquid long and hard enough, the surface of the liquid will move it the direction you’re blowing.
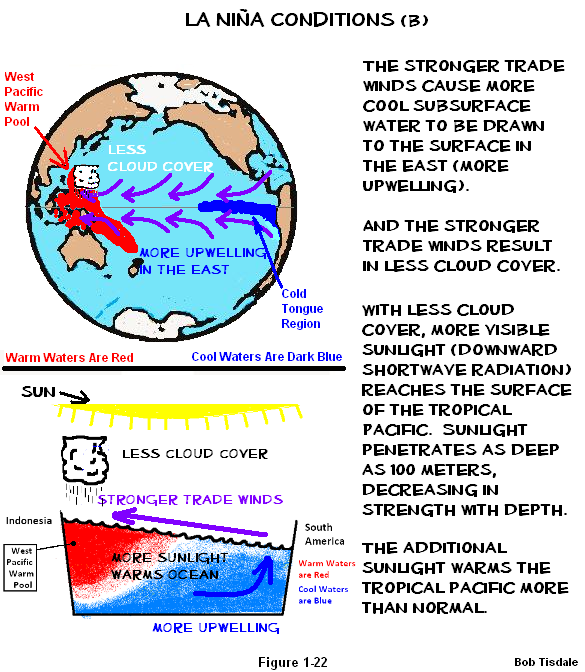
The trade winds also blow clouds toward the west. That’s not hard to imagine, either. This allows that wonderfully strong tropical sun to beat down on the surface of the tropical Pacific and to reach into the subsurface waters to depths of 100 meters. Though most of that sunlight is absorbed nearer the surface, in the top 10 meters (roughly 33 feet) or so, it does reach farther. All of Mother Nature’s glorious sunlight warms the tropical Pacific waters as they travel west.
The trade winds push the waters up against the land masses of Indonesia and Australia. This causes the warm water to, in effect, pile up in the western tropical Pacific, in an area called the west Pacific Warm Pool. The trade winds driving the westward movement of surface waters also draw cool waters from below the surface of the eastern equatorial Pacific, in a process called upwelling. That upwelled water provides a continuous source of cool water at a relatively constant temperature that’s then warmed by the sun as it travels west. The water is, therefore, cooler in the eastern equatorial Pacific, in an area called the Cold Tongue Region, than it is in the west Pacific Warm Pool. Remember, the tropical Pacific stretches almost halfway around the globe, so that nice cool supply of water in the east travels a long way under the tropical sun before it reaches the warm pool in the west.
The trade winds cause the temperature difference between the east and west portions of the tropical Pacific. Now, here’s the interesting part. The temperature difference between the eastern and western tropical Pacific causes the trade winds to blow. That’s right. The temperature gradient of the tropical Pacific sea surface temperatures and the trade winds interact with one another in a positive feedback loop called Bjerknes feedback.
Why does that happen?
There nothing mysterious going on. The warmest water is in the western tropical Pacific. We’ve discussed that, and we’ll confirm it in Section 3. The warm water there heats the air above it, and that relatively hot air rises. All of that rising hot air has to be replaced by other air, and it’s the trade winds out of the east that supply the necessary make-up air. Because the tropical Pacific is cooler in the east, the air sinks there, and eastward-blowing upper winds complete the circuit. Overall, the warm air rises in the west; it cools as it’s carried east by the upper winds; then it sinks in the eastern tropical Pacific, where it heads back to the west as the trade winds. That circuit is called a Walker cell. The trade winds continuously push cool water from the east to the west, sunlight warms the water as it travels west, and when that warm water reaches the west Pacific Warm Pool, it supplies the heat necessary to maintain the updraft, which, in turn, causes to trade winds to blow. The briefest way to explain it: the trade winds and the sea surface temperatures are coupled, meaning they interact with one another.
With all of that warm water being piled up in the western tropical Pacific, and with all of the cool water being drawn from the eastern equatorial Pacific, the surface of the water—the sea level—in the west Pacific Warm Pool is about 0.5 meters (approximately 1.5 feet) higher in elevation than it is in Cold Tongue Region in the east.
Everything’s in tune, running in its normal state. The temperature difference between the east and west keeps the trade winds blowing—and—the trade winds maintain the temperature difference between east and west—and—the trade winds keep the warm water in the west Pacific Warm Pool at a higher elevation than it is in the eastern equatorial Pacific.
We can’t forget about gravity. It’s always there, our constant companion. Gravity would like the sea surface height in the west to equal the height in the east. It likes level playing fields. It’s working against the trade winds, and the trade winds are piling up the warm water against gravity. Still, everything is in relatively constant state of balance, with little gives and takes here and there.
Then some weather event—and that’s precisely what it is, a weather event or group of weather events—causes the trade winds to relax. That means the coupled ocean-atmosphere processes taking place in the tropical Pacific are no longer in balance. Sometimes, the weakened trade winds aren’t strong enough to hold the warm water in place in the west Pacific Warm Pool against gravity, so gravity takes over and all of that lovely warm water that was piled in the west Pacific Warm Pool suddenly sloshes to the east. That’s how an El Niño starts.
I’m now going discuss parts of the process that haven’t been shown in the illustrations yet.
The Pacific Ocean is awfully wide at the equator, so it takes a while, about 2 months, for the warm water to slosh to the east as far as the coast of South America.
Let’s put things into perspective. The west Pacific Warm Pool holds a massive amount of warm water. It varies in size. When it’s large, the west Pacific Warm Pool can cover a surface area of about 19 million square kilometers (7.3 million square miles) but it averages about 12 million square kilometers (4.6 million square miles). Numbers that large are hard to embrace, so, when the west Pacific Warm Pool is larger than normal, think of an area the size of Russia or a little less than twice the size of the United States. Refer to the Mehta and Mehta (2004) presentation Natural decadal-multidecadal variability of the Indo-Pacific Warm Pool and its impacts on global climate. Also imagine the warm water reaches depths of 300 meters (about 1000 feet). Sometimes, during a very strong El Niño, most of that water from the west Pacific Warm Pool will be transported east and much of it will spread across the surface of the central and eastern tropical Pacific. Now remember that the Pacific stretches almost halfway around the globe at the equator. An El Niño dwarfs all other weather-related events. How big are they? Sometimes it takes a pair of tropical cyclones just to trigger an El Niño. Yes, tropical cyclones as in hurricanes.
Let’s return to the ENSO-neutral phase for a second. A weather event—for example, a couple of tropical cyclones or a pair of them that straddle the equator—a weather event that’s teeny by comparison, has caused the Pacific trade winds to relax, which in turn has unleashed a monstrously large phenomenon that is capable of raising global temperatures 0.4 degrees C in less than a year. In turn, there are heat waves and cold spells. Floods will strike some parts of the globe. Drought conditions form in others. Snowfall will pile to record heights in some areas, and in others it will decrease. These effects were studied and documented decades ago, and they’re still being studied, for example, to account for differences between Central Pacific and the more powerful East Pacific El Niño events.
Of course, some publicity seeking climate scientists continue to (very unwisely) blame carbon dioxide for the heat waves and cold spells, flooding and drought, blizzards and low snowfall, creating further disbelief in climate science. They have only themselves to blame for their loss of credibility. I digress.
An El Niño is one of Mother Nature’s ways of reminding us who’s in charge.
Back to the cartoon-like illustrations.
# # # # #

# # # # #

# # # # #

# # # # #

# # # # #

# # # # #

# # # # #

# # # # #

# # # # #

# # # # #
# # # # #

# # # # #

# # # # #

# # # # #

# # # # #

# # # # #

# # # # #

# # # # #
1.3 Recap of Section 1
Trade winds cause the sea surface temperature and height in the western tropical Pacific to be greater than they are in the east. El Niño events are started by the weakening of the trade winds. The weaker trade winds can no longer hold the warm water in place in the west Pacific Warm Pool, and this allows gravity to carry the warm water east, raising sea surface temperatures in the central and eastern equatorial Pacific.
El Niño events are the abnormal phase of ENSO. The Equatorial Countercurrent strengthens and carries a large volume of warm water from west to east, and that increased volume from west to east opposes the normal east-to-west flow during ENSO-neutral and La Niña phases. The winds also change directions during an El Niño, with trade winds becoming westerlies in the western tropical Pacific. On the other hand, during ENSO-neutral and La Niña phases, the trade winds are blowing in their normal east-to-west direction.
La Niña events are easy to describe. They are exaggerations on the ENSO neutral phase. However, La Niña events play the important role of replenishing the heat given off by the El Niño that precedes it, and sometimes a La Niña can create more warm water than was released by the El Niño.
Warm water that has traveled east during the El Niño and that is not “exhausted” by the El Niño does not remain in the eastern tropical Pacific. It is returned to the West Pacific and Indian Oceans, where much of it remains on the surface. Before the El Niño, most of that warm water is below the surface of the west Pacific Warm Pool and excluded from the surface temperature record. Then, after the El Niño, part of what remains of that warm water is now on the surface of the West Pacific and East Indian Oceans. The opposite does not occur during the La Niña phase. The result: strong El Niño events can raise global sea surface temperatures for extended periods of time. This will be discussed in detail in Section 5.
[END OF SECTION 1 OF WHO TURNED ON THE HEAT?]
Again, if you have any questions, please ask.
Now that you’ve run through the processes, here’s a one sentence description of ENSO: ENSO acts as a chaotic, naturally occurring, sunlight-fueled, recharge-discharge oscillator, where the La Niña phase acts as the recharge phase and El Niño acts as the discharge phase.
As long as the climate science community continues to treat ENSO as noise, they will make little progress in understanding the natural contribution to global warming, and it’s a sizeable contribution. We’ve discussed for years that the climate science community has failed to account for the “leftovers”, the residual warm water, from strong El Niños.
I also used those cartoon-like illustrations in my two-part video series “The Natural Warming of the Global Oceans”, which first aired on the WUWT-TV special in September 2012. That series is available on YouTube. Part 1 is here, and Part 2 is here.
I went into much more detail to explain ENSO processes and the aftereffects of El Niño and La Niña events in my ebook Who Turned on the Heat? I’ve lowered the price of Who Turned on the Heat? from U.S.$8.00 to U.S.$5.00…for a month or so, with hope of increasing sales a little bit. A free preview in pdf format is here. The preview includes the Table of Contents, the Introduction, the first half of section 1 (which was provided complete in this post), a discussion of the cover, and the Closing. Take a run through the Table of Contents. It is a very-detailed and well-illustrated book—using data from the real world, not models of a virtual world.
Who Turned on the Heat? is only available in pdf format…and will only be available in that format. Click here to purchase a copy. Thanks. Unless I can find funding for my research, it will be book sales and tips/donations that allow me to return to blogging full-time.
Got to get ready for work. I’ll be available to answer questions this evening and over the weekend.
Regards
Nice post Bob, only one concern, this ” Consider this: El Niños and La Ninas occur in the tropical Pacific, but more than a decade ago it was determined that they rearranged sea ice in the Southern Ocean surrounding Antarctica.” Considering the link you provide is from GISS, my confidence in the validity in this claim is astoundingly low. Not to mention that some serious caution needs to be used here to ensure that there is a “significant” relationship between these two events as the Antarctic Circumpolar Current (ACC) that was established millions of years ago upon Antarctica’s split from Australia makes this area relatively more independent of oceanic “outside” influences like ENSO.
Great article Bob. Found it while supervising a 3 hour exam and the cartoons were an excellent way to get a handle on these weather events. Many thanks.
Excellent, Bob.
It’s all beginning to make sense for me now.
Hi Bob – excellent post. Thank you. One typo in the very last line “… return to bogging…”
Another article to add to those already saved. Many thanks Bob, don’t let work get you down.
David says: “One typo in the very last line ‘… return to bogging…’”
Thanks. Fixed.
Excellent work – exemplary!
Bob, When an El Nino occurs, there would also be a large release of energy just from the change in sea surface levels, wouldn’t there?
I mean 0.5m at one side of the Pacific must have one heck of a lot of potential energy.
Very well done!! Drawings aid understanding to a considerable extent.
Thanks Bob. Perhaps a line or two to explain the role of the Earth’s rotation on the direction of the trade winds might be a useful addition?
AndyG55, surely the lowering of the West Side of the Pacific is matched by the raising of the rest of the Ocean? It should cancel out.
Well done! I frequently used careful cartoons in my work, teaching complex systems.
That is a really good presentation, I am impressed by you simple, but well thought out, graphics.
Do we have measurements of surface salinity across the pacific during a full cycle?
Excellent. Bob’s presentation in the WUWT-TV special in September 2012, was the first time I really understood ENSO.
His book should be a textbook. (At +$100/ a pop)
Bob Tisdale:
Severe thanks for your excellent article above which provides a clear introduction to ENSO effects.
I write because I was much saddened that circumstances have forced you to stop blogging. The above article demonstrates we have not completely lost you, and that is very good to know.
As Pielke snr. said, it would be good if your work were to obtain funding from your government which – sadly – chooses to waste such monies on flawed climate models.
Richard
I never really understood El Nino/La Nina before this; that was extremely concise and informative for a layman to comprehend! Which leads me to my questions, which I’m guessing you go into in the rest of your book…. Why are there decades long La Nina and El Nino dominant phase cycles? And what is the PDO and is that the driver of my first question? And how long does it take to dissipate the heat from El Ninos (less than a year? multiple years?)
So if they treat these oscillations as white noise they are oversimplifying (and discounting) a natural source of temperature variation which leads them to over-estimate attribution and sensitivity calculations.
Excellent Job!!!!
Now I need to go back and read your previous posts on how folks try to “remove” the influence of ENSO from the temperature record. I seem to remember you criticizing the fact that much of the residual warm surface water remains long after the actual El Nino event and they were therefore not correcting for El Nino’s properly. I don’t recall whether you opined whether this adjustment can be done at all or offered an alternative adjustment of your own.
Thanks for your effort Bob. Pictures really are worth a 1,000 words.
And of course Bob tied in with all you have indicated is the Southern Oscillation Index that indicates the likely weather conditions in Eastern Australia.
http://www.bom.gov.au/climate/glossary/soi.shtml
“The Southern Oscillation Index, or SOI, gives an indication of the development and intensity of El Niño or La Niña events in the Pacific Ocean. The SOI is calculated using the pressure differences between Tahiti and Darwin.
Sustained negative values of the SOI below −8 often indicate El Niño episodes. These negative values are usually accompanied by sustained warming of the central and eastern tropical Pacific Ocean, a decrease in the strength of the Pacific Trade Winds, and a reduction in winter and spring rainfall over much of eastern Australia and the Top End. You can read more about historical El Niño events and their effect on Australia in the Detailed analysis of past El Niño events.
Sustainted positive values of the SOI above +8 are typical of a La Niña episode. They are associated with stronger Pacific trade winds and warmer sea temperatures to the north of Australia. Waters in the central and eastern tropical Pacific Ocean become cooler during this time. Together these give an increased probability that eastern and northern Australia will be wetter than normal. You can read more about historical La Niña events and their effect on Australia in the Detailed analysis of past La Niña events.”
Wetter, drier nothing to do with fictional “CO2 induced climate change” but every thing to do with sun induced weather circulation and dynamic ocean heat conditions.
Excellent Bob! Mega!
Anybody who wants to get an idea of what is happening now see the following from BOM – “4-month sequence of vertical temperature anomaly sections at the equator, Pacific for January 2014” for the present day conditions:-
http://www.bom.gov.au/cgi-bin/oceanography/wrap_ocean_analysis.pl?id=IDYOC007&year=2014&month=01
Updated approx every 4 days so it is possible to observe any developments.
From the following data set with snapshots back to 1997 (Full) and 1980 (Partial)
“4-month sequence of vertical temperature anomaly sections at the equator, Pacific”
http://www.bom.gov.au/oceanography/oceantemp/pastanal.shtml
Looking forward to how the change in the “Pacific” circulations influences the circumpolar current that connects all the oceans.
The “after el Niño” circulation appears (to me) to add to the circumpolar current, pushing more water through Drake’s Passage and increases the rate of circulation of the Atlantic in the Weddel Sea. Without knowing the magnitude of the change, it’s hard to tell if and how the Indian Ocean currents could change. Those are important to me because they’re outside my “front door”.
There are distinct changes in weather patterns (aka “climate”) in the SW of Western Australia along with the Pacific oscillations. Especially the multi-decadal ones which seem to bias the strength and recurrence of the “phases”.
Of course the Indian ocean is big enough to be a significant solar energy sink and emitter with its own oscillations. It doesn’t however substantially span the equator as does the Pacific.
The Atlantic Oceans OTOH do span the equator but may not be wide enough (only about 4 hours at its widest) to establish currents and sinks in order to oscillate.
Love the cartoons. Really helpful for my old brain. Thanks.
Hi Bob,
Thanks for the opportunity to show some gratitude for the wonderful education you have given us all. I’m only sorry I didn’t do it more and sooner. Happy new Year to you, and let’s hope you get recognised for the wonderful contribution you have made to climate science.
Outstanding. I have been able to put all these ideas in a simple cohesive whole in a few minutes better than having tried from reading bits and pieces over the last few years.
Given the pushing of the water to the west, is this the reason some of those South Pacific islands are the focus of a lot of attention about sea level rise threatening their existence? How much variance in that rise would they experience over say a 20 or 30 year period? I had thought much of the concern might have been subsidence but it appears these cycles add to the levels as well.
Thanks for a terrific and helpful piece.
Outstanding post! For the first time I think I now understand El-Nino, La-Nina and ENSO. Thanks so much!
DocWat says:
January 10, 2014 at 4:13 am
Very well done!! Drawings aid understanding to a considerable extent.
_______________________
No kidding. Even I get it.
Thanks Bob, an excellent article!
The right amount of simplification and good illustrations.
The drawings are perfect, they really help to understand this complex and very natural/normal behavior.
Sweet! – I actually get thisnow. Only took about a half hour.
Thanks Bob.
Couple of “dummy” questions:
What happens to ENSO during an ice age?
Does ENSO cause or contribute to ice ages or warm ages?
Ron Richey
Bob, thank you for your explanation. I have never taken the time to understand these events. With your explanation, I learned both the mechanism and the importance of these events enough to explain both aspects to others. Thanks again. I’ll be buying the book.
A keeper
Excellent description. It helped me to understand the entire process more completely.
There is an interesting article at: http://cimss.ssec.wisc.edu/goes/blog/archives/14716 “Tehuano wind event in the wake of a strong eastern US winter storm,” that shows when a strong cold front reaches and crosses Mexico east of the Yucatan which causese strong off-shore flow on the Pacific side.
Perhaps this flow may increase upwelling and phase with other ingredients that cause or force La Nina events? Just a thought.
So an El Nino directs surface warming streams at the area off the coast of Africa where hurricanes and tropical waves form in the Atlantic. This raises the question of whether poor hurricane season predictions are the direct result of lack of predictability of El Ninos or have we entered the era of boilerplate bureaucratic press releases for hurricane season predictions tipped to the active side by the likes of John Holdren at the White House?
Good stuff, Bob. You’ve answered a question that has been nagging me for quite a while: Is the warming associated with El Nino merely a rearrangement of existing heat or somehow an addition to the Earth’s total heat energy? To a significant degree it must be the former. As you say the waters of the warm pool get moved into locations where they are more fully available to our efforts at measurement. So your essay also points to a significant source of error in our measurment of global temperature.
Perhaps I read to fast ; but what happens with the global sea level during these events ; I read that it increases during El Nino events because rain falls in the sea , while during La Nina , rain falls over Land ; that comparison is only true for what you call Central Pacific events ; other question : the transfer of heat from the sea to the atmosphere should normally decrease its thermal expansion ; do you have made calculations about the impact of both factors to the global sea level heigth ?
Sorry for my English
Excellent exposition to cement my understanding. One small question: part of the difference in sea-level will be due to lower density of the amassed warm water, or is it of higher salinity to counterbalance this reduction in gravity or even add to it?
Curiosity question: Since the water in the West Pacific Warm Pool is warmer than the water in the Cold Tongue Region, the water in the West is less dense than the water in the East. Is this explicitly accounted for? How much does it matter?
Thank you for the pictures.
Bob,
Excellent work as usual! My question for you is this:
It seems like we have been bouncing around in then ENSO-Neutral range for quite some time now. Do you see a “breakout” in one direction or another any time soon? Right now it looks like we are getting “teased” with a potential La Nina, but we still can’t seem to break out of the neutral range. Do you think we will remain in the neutral range for some time yet, or are we due (or overdue) for a La Nina or an El Nino?
If ENSO is just a natural oscillation, why do we see these step-like shifts in global atmospheric temperatures after powerful El Ninos such as 1997-98?
Bob, great post. Much appreciated. Question 1: When global warming and global cooling do actually occur over extended periods of time (such as variations in thr earth’s orbit or sun’s activity), how might this affect the intensity of the processes you described? Question 2: I haven’t seen the video yet, but is it possible to make a widely distributed motion animation of these processes? If so, how might that be accomplished? Question 3: What kind of resistance have you run into with respect to this information?
Lance- my guess is that effect is due to the residual warm water which does not go back to the Pacific warm pool but gets circulated poleward and into the Indian Ocean releasing heat for years after. I’m sure his book goes into this. Therefore if you look at it on a short timescale it might look like permanent step changes. Which means if you are going to treat this as noise that cancels itself out in the short-term, and do attribution/sensitivity calculations based on observational data without some sort of valid correction for ENSO and it’s true long-term modes and effects, then you are going to fool yourself. And based on the ENSO mode (El Nino dominant) we were in during the IPCC analysis, they over-attributed the warming and sensitivity to CO2 by improperly ruling out natural variability effects of ENSO. By how much is the question…
Kudos Mr. Tisdale – an article well worth saving to my bookmarks.
Well done. All it needs is a big bow to wrap it up
What causes trade winds to become stronger during a La Nina?
Thank you.
What makes your understanding of this part of “Global Climate” a treasure is your ability to communicate it in a way understandable to people like me.
This all sounds absolutely wonderful. However you, like the rest of the world, continue to underestimate the Heat From Within the planet. Consider, if the sun is the main ingredient here, then why doesn’t this oceanic heating occur all over the planet? Why is this happening exclusively within the Ring Of Fire? Why just the Pacific?
I’ll tell you why. El Nino is the result of the heat from within, escaping along the deep oceanic floor, through plates/vents, where the heat radiates upward/outward, until it reaches the oceanic surface, and then moves into the atmosphere, along with moisture, and there it move along the jet stream, causing the El Nino effect we all know. and when it slows down, La Nina occurs.
If you refuse to see this, fine. I personally don’t care. That’s your problem. But like Continental Drift, its time will arrive, whether you like it or not. Just remember this and know where you read it first.
G-d Bless!
Bob, thanks for the clear explanations.
I already bought the book. I wanted to support you. $ 5 for a PDF over 500 pages, it is a gift.
Thank you, Mr Tisdale, for this concise and clear description of what had been for me something of a mystery. No longer. I originally thought the heat was produced by undersea volcanos…
I’m homeschooling a young lad. When we get to the weather in his Physical Science course I would like to use this if it is okay with you Bob. Great presentation.
@John L Kelly
Why does this happen every 10 years or so ; OK , the geothermal gradient assures the upward branch of the thermohaline circulation ; and possibly events like D-O events during glaciations ; but why would the oceanic crust release its heat with such a regular timing ?
MCourtney, The rest of the ocean doesn’t rise. It has to stay where it is while the higher water from the west falls on top of it.
Exaggerated example:
BEFORE
111
222222
333333333
AFTER
222222111
333333333
The water volume represented by the 1s above has fallen down one level. Yes, the level at that point has risen from where it has, but it has done so by means of water seeking a lower level. The potential energy represented by a half meter fall is converted into the kinetic energy strengthening the equatorial counter-current. Eventually, that kinetic energy becomes heat. Every kilogram of water that falls a half meter will release 4.9 joules of energy. The sheer area of the Pacific Ocean means that it will be a significant amount of energy in total, but when divided over that same area, the contribution to surface temperatures is probably insignificant.
Thank you. Excellent pictures that are worth a thousand words.
Thanks a lot it was very helpful. I never really understood El Niño/La Nina before, I thought I did but if I was quizzed on the basics yesterday I would have flunked.
As I’ve posted at Bob’s site, everyone contact your local library and see if they support ebooks (mine does). If so ask them to buy a copy. It is first rate material and needs a wide audience.
The Monster (@SumErgoMonstro),January 10, 2014 at 11:35 am:
Thanks,
You are right.
I was wrong.
The Monster (@SumErgoMonstro) says:
January 10, 2014 at 11:35 am
The potential energy represented by a half meter fall is converted into the kinetic energy strengthening the equatorial counter-current.
I am not convinced there is any net gain in kinetic energy. With regard to the 0.5 m first of all, if the far left side dropped half of that, namely 0.25 m, and if the right side gained this amount, then the surface would be flat. Also, this relative height of 0.25 m only applies to the far left. It goes to 0 m in the middle and to -0.25 m on the right side.
Of course we can calculate the gain in kinetic energy if a mass is dropped in a vacuum a distance of 0.25 m, however for all intents and purposes, the friction in this case would make it more similar to a feather falling in air in that terminal velocity would be reached almost immediately.
Darn. If I waited, I could have saved $8. But then, at my age, I needed the remedial review. Was that redundant?
Nice work. Thanks.
Bob, you will find this blog post quite interesting:
http://notrickszone.com/2014/01/10/oops-trenberth-concedes-natural-ocean-cycles-contributed-to-1978-1998-warming-after-all-co2-diminishes-as-a-factor/
Bob,
Thank you for this excellent work. Question: how do e-books work- can they run on any computer, or do they require a kendle type reader?
Andy Halloran says: “What causes trade winds to become stronger during a La Nina?”

Because the trade wind strength and the temperature gradient between the eastern and western tropical Pacific are interrelated, an increase in the temperature gradient would cause stronger trade winds.
As you’ll recall, there is a flood of warm water traveling from west to east at the start of an El Niño, much of it below the surface. That’s called a warm “downwelling Kelvin wave”. According to the “delayed oscillator theory” of ENSO, that downwelling Kelvin wave initiates cool but slow moving “upwelling Rossby waves” moving in the opposite direction. They reflect off of the land masses and eventually make their way eastward along the equator as a cool “upwelling Kelvin wave” which helps to shut down the El Niño. That cooler subsurface water is drawn to the surface along the eastern equatorial Pacific, which increases the temperature gradient between east and west, which in turn causes stronger trade winds.
NOAA has a brief answer at their La Niña FAQ webpage here. See “What causes a La Niña?”:
http://www.elnino.noaa.gov/lanina_new_faq.html
And IRI has an introduction to the delayed oscillator theory here:
http://iri.columbia.edu/climate/ENSO/theory/
I also present it in Chapter 4.9 of my book, using another group of cartoons as reference:
lurker, passing through laughing says: “Thank you for this excellent work. Question: how do e-books work- can they run on any computer, or do they require a kendle type reader?”
My ebook “Who Turned on the Heat?” is only available in PDF form, which means it will run on any computer that has Abobe Reader software.
My other books are available in PDF and Kindle formats. Kindle Reader software is available (free from Amazon) for computers and handheld devices, so it can run on just about anything.
John L Kelly says: “This all sounds absolutely wonderful. However you, like the rest of the world, continue to underestimate the Heat From Within the planet…”
Unfortunately, there are little to no subsurface data at the depths you’re talking about to support your hypothesis.
John L Kelly says: “Consider, if the sun is the main ingredient here, then why doesn’t this oceanic heating occur all over the planet?”
The Atlantic has El Nino events. aka Atlantic Equatorial Mode and Atlantic NINO:
http://en.wikipedia.org/wiki/Atlantic_Equatorial_mode
John L Kelly says: “If you refuse to see this, fine. I personally don’t care. That’s your problem.”
There’s no problem, John. Everything I’ve presented is supported by data. You’ve presented speculation.
Pethefin, thanks for the link.
chemman: Okay with me. In fact, I’d be honored by your use of it.
Rich Carman says: “When global warming and global cooling do actually occur over extended periods of time (such as variations in thr earth’s orbit or sun’s activity), how might this affect the intensity of the processes you described?”
Rich, there is no way to tell with the lack of ENSO “data” over paleoclimatological timescales.
Rich Carman says: “I haven’t seen the video yet, but is it possible to make a widely distributed motion animation of these processes? If so, how might that be accomplished?”
I wish I had animation skills but I don’t.
Rich Carman says: “What kind of resistance have you run into with respect to this information?”
I don’t believe the ENSO basics presented in this post are controversial. On the other hand, my presentations of the long-term effects of ENSO (i.e. the natural warming of the global oceans) are not well received by the AGW camp. They call me nasty names in response.
Lance Wallace says: “If ENSO is just a natural oscillation, why do we see these step-like shifts in global atmospheric temperatures after powerful El Ninos such as 1997-98?”
And in response to the 1986/87/88 El Nino.
That was basically the basis for part of my questions in the “Manmade Global Warming Challenge?”:
http://bobtisdale.files.wordpress.com/2013/01/the-manmade-global-warming-challenge.pdf
Ron Richey says: “What happens to ENSO during an ice age? Does ENSO cause or contribute to ice ages or warm ages?”
I haven’t studied ENSO on paleoclimatological terms due the absence of data. In fact, I normally stick to the satellite era.
PeterB in Indianapolis says: “It seems like we have been bouncing around in then ENSO-Neutral range for quite some time now. Do you see a “breakout” in one direction or another any time soon?”
Sorry to say, but I don’t make predictions. The models are edging toward weak El Nino conditions toward summer, but it’s still early. We haven’t yet passed the “spring prediction barrier” for ENSO.
http://iri.columbia.edu/climate/ENSO/background/prediction.html#barrier
Michael Barnes says: “Since the water in the West Pacific Warm Pool is warmer than the water in the Cold Tongue Region, the water in the West is less dense than the water in the East. Is this explicitly accounted for? How much does it matter?”
I don’t believe I’ve ever seen your questions addressed anywhere.
Gary Pearse: Sorry. Can’t answer your questions. I haven’t studied the density or salinity of the waters involved in ENSO, and I don’t recall any papers that address those topics, but I didn’t look for them, either.
@ Bob Does this ocean process drive cyclones and hurricanes when it couples with the stratosphere ?
fritz says: Perhaps I read to fast ; but what happens with the global sea level during these events ; I read that it increases during El Nino events because rain falls in the sea , while during La Nina , rain falls over Land ; that comparison is only true for what you call Central Pacific events ;
That relationship is also true for East Pacific El Niño events (refer to the 1997/98 El Niño):
http://bobtisdale.files.wordpress.com/2013/07/figure-54.png
The graph is from the following post:
http://bobtisdale.wordpress.com/2013/07/23/no-consensus-among-three-global-precipitation-datasets/
fritz says: “other question : the transfer of heat from the sea to the atmosphere should normally decrease its thermal expansion ; do you have made calculations about the impact of both factors to the global sea level heigth ?”
Sorry. No.
BTW, your English is fantastic.
Birdieshooter says: “Given the pushing of the water to the west, is this the reason some of those South Pacific islands are the focus of a lot of attention about sea level rise threatening their existence? How much variance in that rise would they experience over say a 20 or 30 year period? I had thought much of the concern might have been subsidence but it appears these cycles add to the levels as well.”
Sorry, Birdieshooter. There’s only satellite-based sea level data since the early 1990s, and I haven’t done any comparisons of east and west Pacific tidal gage data.
Ok, how many Hiroshima bombs per second does it take to pile up that .5m of water in the Pacific Warm Pool? Is that amount of gravitational potential energy being properly accounted for in the Global Warming energy budget?
W^3
Great article, should be part of a high school curriculum! The only thing that needs explaining for me is what weakens the trade winds, that then leads to the slosh back east. Is it when discharge is high or expanding cloud cover with less surface heating?
Excellent primer, only slightly soured by the sanctimonious little digression against climate scientists.
Eduard says: “The only thing that needs explaining for me is what weakens the trade winds, that then leads to the slosh back east.”
The weakening of the trade winds are caused by “Westerly Wind Bursts”. See the post here:
http://bobtisdale.wordpress.com/2013/10/22/enso-basics-westerly-wind-bursts-initiate-an-el-nino/
Regards
Several “aha” moments for me as I read your excellent post. Thank you.
D Ashcart says: “Excellent primer, only slightly soured by the sanctimonious little digression against climate scientists.”
I assume you’re referring to the following paragraph:
As long as the climate science community continues to treat ENSO as noise, they will make little progress in understanding the natural contribution to global warming, and it’s a sizeable contribution. We’ve discussed for years that the climate science community has failed to account for the “leftovers”, the residual warm water, from strong El Niños.
There’s nothing sanctimonious about it. It’s the truth. They’re only misleading themselves.
Hi Bob: Thanks for responding. I was referring to that para and the following:
“Of course, some publicity seeking climate scientists continue to (very unwisely) blame carbon dioxide for the heat waves and cold spells, flooding and drought, blizzards and low snowfall, creating further disbelief in climate science. They have only themselves to blame for their loss of credibility. I digress.”
Your article is professorial and nicely done. In my opinion, these jabs did not add value. So there you are. I think you’re a solid & thoughtful contributor to the field and I will continue to follow your work.
How very interesting. My undying gratitude for making it so simple.
In fact I really knew almost all of that, but had never even tried to put it together in such an understandable way, even for myself. No wonder I had trouble trying to explain it to someone else.
If only we had more people with this understanding, who could put things together for us.
Regarding eBooks and the PDF format. You mentioned that they require Adobe reader. Many people do not like installing Adobe Reader on their PCs because it’s a bloated and insecure product. There are several excellent free alternative like Foxit Reader and Sumatra PDF. Both products perfectly read all PDFs, but best of all, they are tiny programs that don’t slow your computer down like Adobe products, and they are immune to the security treats from Adobe products. Both can also be run as “portable” programs – you don’t even need to install them, your just run them as a single executable file that never installs itself.
At 86 responses already, I am just catching up. Well done presentation/questions/answers.
Thanks, Bob.
~~~~~~~~~
at John L. Kelley and “ring of fire”
JLK asks “. . . then why doesn’t this oceanic heating occur all over the planet? Why is this happening exclusively within the Ring Of Fire?
That is not what Bob T. wrote – he is writing mostly of the area about 1,500 miles on either side of the Equator. If he mentioned Ring of Fire, I missed it. For what it is worth, sunlight warms water any time it penetrates the surface. Seeing things underwater requires light and light is energy. If you look straight down on the ocean where the water is clear with the Sun directly above then the water will appear almost black. The light is absorbed – heat is entering the water. As mentioned in the post, that happens in the to 100 m. or so. Away from the normal-rays reflection increases. [Earth is called the Blue Planet because of the scattering of light as it passes through the atmosphere and producing a blue shell. It is also called the “water planet” but for a very different reason.]
and: the “heat from within”:
Maybe a real geologist could answer this but, anecdotally I have been down to about 8,500 feet below sea level in a mine where the internal heat cannot be missed. Upon return to the surface the ground temperature was determined by the air temperature – frozen in winter, warm in summer. A short distance underground, say in Mammoth Cave, the temperature is about 54 degrees Fahrenheit year round. This suggests to me the contribution to “Climate” of internal heat is small.
I really liked that you made the following frank statement, because we never stop hearing about “all the climate scientists” who agree with CO2 climate theory, and for every one like you who is willing to state his/her professional opinion on the matter, there are undoubtedly many more who agree with you who don’t stand publicly against the “consensus”:
“Of course, some publicity seeking climate scientists continue to (very unwisely) blame carbon dioxide for the heat waves and cold spells, flooding and drought, blizzards and low snowfall, creating further disbelief in climate science. They have only themselves to blame for their loss of credibility. I digress.”
Bob, great explanation! I asked you several years ago about keeping track of the energy balance for the world: [Energy Difference = Energy In – Energy Out] or [Sunlight In – Heat Radiated Out]. In a simple model of the world, a positive energy difference increases the temperature of the world while a negative difference lowers the temperature of the world. I asked you why the science community only uses temperature for its analysis and predictions instead of calculating the energy balance. You responded that you did not know why.
The simple model of energy balance is not useful because it does not take into account for the[Energy In] that is stored out of sight only to be released later. For instance, if 1% of the incoming sunlight is sometimes stored in the ocean instead of heating the atmosphere, the global atmospheric temperature may appear to drop even if the incoming radiation rate has not changed. Eventually that heat will find its way back into the atmosphere from the ocean. When it does find its way into the atmosphere is the factor that determines what happens. If the atmosphere is cooling, the extra release of heat may lessen or stop the cooling. If the atmosphere is heating up for some other reason, heat released from the ocean may cause it to increase faster. This “timing” is called the “phase” of the signal in the physics world and my world of engineering. One way to prevent phase effects from distorting a measurement, any measurement, is to measure over very long periods, periods that far exceed the cycle time for periodic mechanisms like ENSO.
I know that you understand this as do many of your readers but some of your readers may not. I wanted to give the introduction before asking my questions. You described in your explanation that El Ninas recharge the warm water pool. In other words, El Ninas store [Energy In]. If every El Nino released exactly as much energy as the preceding El Nina stored, then ENSO would have no long term effect on the earth’s temperature. However, you noted that some El Nino’s undercharge while others overcharge. Even if over the long term the energy stored minus that released averages to zero, the variance from one cycle to another will cause variations in the heat released to the atmosphere from the ocean and possibly affect global temperatures one way or another.
In particular, you pointed out that El Nina overcharged in the middle of the 70’s and again in the middle of the 90’s. If the heat release by El Nino has a 5 or 10 year phase delay, then might those two overcharging events have contributed to the present warm cycle that started in the 80’s? How much energy is involved in an overcharging event? Is it enough to account for the energy required to increase our atmospheric temperatures to the level peaked around 2000? With a phase delay of 10 years, might the overcharging event in ’95/’96 be delaying a cooling cycle that should have already started? Is there any understanding of the phase delay for El Nino releasing heat stored by El Nina? Are there cold cycles in the atmospheric temperature that appear related to undercharging El Ninas? To even out the cycles, how long do you think we must wait while collecting data before we can confidently ascertain the coupling between ENSO and the long temperature cycles (60 to 90 years) that seem to show up everywhere in historical data?
Lots of questions, I know, but thanks!
Bob, what is the time constant?
Thinking of a RC circuit, your recharge discharge oscillator.
After the warm pool sloshes east, how much is the western warm pool depleted in volume and temperature?
How long does it take to recharge?
How long from pulse to complete dissipation of its effects?
As in flow west, return east and then curve north and south as the gyres, how likely are the gyres to effect polar ice.
Caleb Shaw’s posting of WUWTJanuary 9th prompts these pieces of an idea, from a large El Nino, how long does it take for the western pool to grow ?
What happens to the gyre currents during the transition?(El Nino, neutral, El Nina)
Does the amount of water being moved change?
Do we have ocean temperature data of sufficient duration, to see one complete cycle?
Great explanation Mr. Tisdale. In fact I bought your ebook.
You show (in the book and videos) the East Indian-Western Pacific SST anomalies increase during El Nino events, then slowly decrease between events. This is leading to a stair-step increase in SSTs from the 70’s to current. But this increase in SSTs can’t go on forever. How do the temperatures return to lower levels? Have El Nino events occurred less frequently in the past, giving the ocean SSTs time to drop?
Michael Barnes says: “Since the water in the West Pacific Warm Pool is warmer than the water in the Cold Tongue Region, the water in the West is less dense than the water in the East. Is this explicitly accounted for? How much does it matter?”
Bob Tisdale says: I don’t believe I’ve ever seen your questions addressed anywhere.
I’ve not seen this addressed, either, so far, though it does seem to indirectly relate to your heat pump/Walker cell diagram. Another similar question never addressed is:
A. During La Nina conditions, as eastern Pacific temperatures drop, ocean surface tension, density and viscosity all increase (particularly viscosity). There are parallel changes in atmospheric conditions: rises in density and viscosity, a drop in humidity. All of these physical properties would present greater wind resistance in sea and sky. Is the magnitude of these changes sufficient to present a significant obstacle to the trade winds above or adjacent to the cold tongue?
Some new questions that might be of general interest:
B. Are there really trade winds? Or does the air stand still and the Earth move beneath it?
C. How stable is the cold tongue?
D. Could an apparently minor fluctuation in the cold tongue location initiate an eastern Pacific N-S oscillation in the trade winds? (Depending on your frame of reference, this could equate to westerly wind bursts. See B, above.)
Ich bin ein Slosher. Great post, Bob.
Great work. Yet another example of the “picture > 1000 words” principle. I now understand the Spanish children.
(But it really is CO2 doing it all, isn’t it?)
Thanks Bob. I always get El Nino & La Nina mixed up. Maybe I can get it straight now with your easy to understand illustrations. Very good post. (Get to work now – lol)
Bob –
If I come off as a contrarian here, it is not my intention, but your start of the El Niño here doesn’t agree with the El Niño formation in 1998 – as shown in your own YouTube video.
In your earlier post “La Niña is not the Opposite of El Niño”*** you point to this YouTube video:
In the video as the 12-month averages progress one month at a time, the first thing one sees is a warming above the East Pacific Rise (EPR) in the eastern Pacific without a commensurate anomaly lowering in the west (the west is still white). If the El Niño starts as a stoppage of the equatorial easterlies that are piling up warm water in the west, then the west Pacific warm Pool (WPWP) should cool down. Where is the cooling down?
We should see two things if the warm piled up water is moving east: We should see a warm anomaly starting east of the WPWP and a cooling IN the WPWP. And the warm anomaly should be continuing to move eastward and expanding – and leaving a remnant warm anomaly all along the way, AND the WPWP should continue to cool. After all, the warmth is leaving and traveling eastward.
But we don’t see that. Or anything close to it.
Look at 0:25: [Dec-Nov97] There is a warm bloom beginning over the EPR – IN THE EAST, off the coast of S America. The WPWP is white.
At 0:26: [Jan-Dec97] The EAST anomaly is growing. The WPWP? Still white. It should be cooling and turning bluer. I AM paying attention to the fact that these are anomalies, so I assume that the WPWP is as warm as it is normally during ENSO Neutral conditions.
At 0:27: [Feb-Jan98] WOW. The bloom over the EPR has grown and warmed considerably. Hottest over the Galapagos. The WPWP? Still white. Where is the cooling? If the El Niño is this massive warm pool moving east and CAUSING it all – bringing the heat eastward – where is the cooling that must come in the WPWP? That “piled up” warm water is moving east? Where is the evidence here?
At 0:27-28: [Mar-Feb98] MUCH bigger and warmer heat bloom over the EPR. It stretches to the S America coast and west as far as Seattle. Still nothing doing in the WPWP. The warmth moving east still hasn’t shown up as a cooling in Indonesia. There is some warmth moving eastward out of the Indian Ocean.
At 0:28: [Apr-Mar98] HUGE EPR bloom with PINK showing in the center, just west of the Galapagos. It extends from SA to as far west as the Bering Strait. In addition, a northern warm bloom has extended west of Central America all the way to about the longitude of Kamchatka. The WPWP? Finally some warmth, NOT COOLING, and it is that warmth from the Indian Ocean extending into Indonesia.
At 0:28: [May-Apr98] The warm bloom over the EPR has now turned PINK, and extends all the way from SA to as far west a Anchorage. The yellow is as far west as New Zealand. The WPWP? Still no cooling.
At 028:-0: [Jun-May98] The PINK has grown even more, wider and a bit longer to the west. The long warm tongue from the east has joined with the warm tongue out of the Indian Ocean. The WPWP is warmer than when the sequence started.
I could continue, but I am addressing the START of the El Niño, not the middle or end of it.
If your YT video is correct, there was NO piled up sloshing eastward to start the 1998 El Niño. The first and ONLY feature in the video is the heat bloom beginning and growing over the Eastern Pacific Rise and expanding and expanding until it reached all the way westward.
Bob, your two posts are 180° contradicting each other.
What gives with this?
It is patently clear that the 1998 El Niño began in the EAST, not the west. Unless your earlier video is based on bad data. In which case you would have taken it down.
Which is correct? The presentation here or the data-based video?
Note to Anthony: THIS video is exactly what my proposed post the other day is about. There is clearly a heat source on the Eastern Pacific Rise that started the 1998 El Niño. I propose that the heat source is the Eastern Pacific Rise itself. This Ridge is the fastest spreading mid-ocean ridge in the world, meaning more heat comes out of it than any other. At the Galapagos it joins the Galapagos Rift, which is where hydrothermal vents were found and have been found in abundance. There is every reason to think this region has the most terrestrial “heat flow” (technical term), coming out of the Earth from the mantle. The heat flow here has been measured at ten times the global average and more, so it is always a hot spot. Variations in this heat flow from below may well be the cause of El Niño. Bob’s YT video supports this premise. This post contradicts the video and this premise. There IS no heat bubble moving eastward. There is only a heat plume forming in the eastern Pacific, and the heat flows WEST from there.
And BTW, the heat flow averaged over this EPR region is – to the best I can get out of the data – from the International Heat Flow Committee – is that the heat flow here is approximately equal to all of the internal heat of the entire world.
The upshot of this is really this: The climate people may be missing an integral portion of heat in their balancing of the climate. And if the missing element has variations, then it could explain the oscillations in the ENSO, as well as their variability in time and duration. I do not KNOW that there are such variations, but Bob’s YouTube video shows a LOT of heat warming up the EPR region in 1998.
[Cross-posting this to my blog at http://www.feet2thefire.wordpress.com]
——-
***http://wattsupwiththat.com/2010/06/11/la-nina-is-not-the-opposite-of-el-nino-%E2%80%93-the-videos/
Misworded: “…the heat flow here is approximately equal to all of the internal heat of the entire world.” Should read “…the heat flow here is approximately equal to all of the terrestrial heat flow of the entire world, according to my rough calculation and the limited data available.”
Quite insightful i must say.http://highflyersarena.wordpress.com/2014/01/10/challenges-of-future-leaders-f-mod/
@Bob
Great post. There are all sorts of effects here that you have to guess are not modeled correctly at all. For example, what happens to the trade winds as they push up against the slope of the water – this must in some way affect the winds as it effectively causes the wind to push uphill, then as it rolls over in the north it’s back to going downhill.
@Monster
It’s the potential energy of the water massed up on one side which gets more or less totally used up pushing the water back to equilibrium, it will not get “released” in any significant way as heat.
None says: “There are all sorts of effects here that you have to guess are not modeled correctly at all.”
See Guilyardi et al (2009). One might conclude that there are only a few parts of ENSO processes that are simulated correctly and they’re only right in a few climate models:
http://www.knmi.nl/publications/fulltexts/guilyardi_al_bams09.pdf
BTW: the slope of the tropical Pacific sea level is only 0.5 meters over 16,000 km during ENSO neutral conditions.
Steve Garcia says: “If I come off as a contrarian here, it is not my intention, but your start of the El Niño here doesn’t agree with the El Niño formation in 1998 – as shown in your own YouTube video.”
Thanks for linking the video, but I’ll explain why there’s no conflict or contradiction.
Steve Garcia says: “In the video as the 12-month averages progress one month at a time, the first thing one sees is a warming above the East Pacific Rise (EPR) in the eastern Pacific without a commensurate anomaly lowering in the west (the west is still white). If the El Niño starts as a stoppage of the equatorial easterlies that are piling up warm water in the west, then the west Pacific warm Pool (WPWP) should cool down. Where is the cooling down?”
Good observation. You’re right; there is a relatively small drop in the sea surface temperatures of the West Pacific Warm Pool during the El Niño…compared to the rise in sea surface temperatures in the eastern tropical Pacific. That indicates the warm water that fuels the El Niño isn’t coming only from the surface of the West Pacific Warm Pool. So where’s it coming from? Below the surface.
The sea level drops in the West Pacific Warm Pool during the El Nino. See the following animation, with sea surface temperature anomalies in the top maps and the sea level anomalies in the bottom ones:
http://bobtisdale.files.wordpress.com/2012/02/with-sea-level.gif
It’s Animation 6-4 is from this post:
http://bobtisdale.wordpress.com/2012/09/03/animations-discussed-in-who-turned-on-the-heat/
Steve Garcia says: “It is patently clear that the 1998 El Niño began in the EAST, not the west. Unless your earlier video is based on bad data. In which case you would have taken it down.”
The 1997/98 El Niño began in the west. The warm water for the El Niño comes from the West Pacific Warm Pool. Here’s an animation from the JPL that starts with two (warm) downwelling Kelvin Waves streaking (over about 2 months) from west to east across the equatorial Pacific. The first (weaker) Kelvin wave started about Christmas in 1996. The second one began in March 1997.
http://bobtisdale.files.wordpress.com/2012/06/animation-4-2.gif
You’re assuming that an El Niño is only a surface phenomenon, when much is taking place below the surface and, therefore, does not appear in the sea surface temperature data.
There are no conflicts between my posts or videos.
Regards
Clay Marley says: “You show (in the book and videos) the East Indian-Western Pacific SST anomalies increase during El Nino events, then slowly decrease between events. This is leading to a stair-step increase in SSTs from the 70′s to current. But this increase in SSTs can’t go on forever. How do the temperatures return to lower levels? Have El Nino events occurred less frequently in the past, giving the ocean SSTs time to drop?”
Thanks for using the East Indian-West Pacific data. That’s the first subset I used to describe the upward shifts or ratchet-like effect.
From the early 1940s to the late 1980s, East Indian-West Pacific sea surface temperature anomalies showed a slight long-term cooling. It definitely shows no long-term warming. During that period, there were few strong El Niños (other than the 1982/83 El Niño which was opposed by the eruption of El Chichon). Then they shifted upwards in response to the 1986/87/88 and 1997/98 El Niños:
http://bobtisdale.files.wordpress.com/2014/01/figure-8-22.png
Prior to that, there also appears to have been an upward shift in response to the 1939/40/41/42 El Niño:
http://bobtisdale.files.wordpress.com/2014/01/figure-8-23.png
Before then, the data is more like science fiction.
Will we go another couple of decades before another strong El Niño causes another upward shift in the East Indian-West Pacific sea surface temperature data? We’ll have to watch and see.
Regards
PS: Those two graphs are discussed in Chapter 8.12 of “Who Turned on the Heat?” And thanks for buying a copy.
Joe Evans: You’ve asked a great many questions that no one can answer. There are no datasets with sufficient resolution or accuracy to calculate many of the things you’ve asked. Recall the Trenberth “travesty” email. Trenberth’s follow-up email on October 14, 2009 read:
“Where did the heat go? We know there is a build up of ocean heat prior to El Nino, and a discharge (and sfc T warming) during late stages of El Nino, but is the observing system sufficient to track it?”
Obviously, it’s not sufficient.
john robertson says: “Bob, what is the time constant? Thinking of a RC circuit, your recharge discharge oscillator. After the warm pool sloshes east, how much is the western warm pool depleted in volume and temperature? How long does it take to recharge?”
You’re assuming there are “constants” in chaotic weather processes. Sea level and ocean heat content (vertical average temperature) data could probably be used to get a rough order of magnitude for the reductions in volume and temperature. See Trenberth quote in my reply to Joe Evans above.
How long for a recharge? Based in the NODC Ocean Heat Content data for the tropical Pacific, the warm water for the 1997/98 El Niño was created in about 1 year during the 1995/96 La Niña, but the 1998-01 La Niña only recharged part (most) of it in 3 years.
http://bobtisdale.files.wordpress.com/2013/03/22-trop-pac-ohc-1995-96-la-nina-and-1997-98-el-nino.png
Thank you Bob for comments and references
Please don’t go Bob, you are a valuable asset.
The article clarified things for me greatly and now I have bought the book. Thanks man.
Bob!
Great Post
Have you looked at the strengths of the North and South Pacific gyros which are both driven by the Coriolis Effect and compared them with the variations of currents at the ENSO region?
In other words have you for example compared the southern equatorial current with the strength of the Humboldt Current and Northern equatorial current with the current outside California?
As you may know I’m looking into ENSO using an Artificial Neural Network.
I have been working recently to improve the ANN so that I can make better presentation and more reliable forecast for ENSO, LOD, NINO3.4 and SOI indexes.
My data show that the most important drivers of ENSO are changes in the strength of the Pacific gyros which are driven by a combination of changes in tidal forcing, solar driven changes in the magnetic field and changes in the solar wind.
In other words ENSO is driven by tidal forcing with a considerable influence from the Sun.
BTW My calculations point to La Niña condition next winter (Northern Hemisphere) which should further frustrate the AGW crowd.
Per Strandberg (@LittleIceAge), I’m looking forward to seeing what you come up with. ENSO as an modified aftereffect of solar variations always sounded plausible to me.
Regards
Bob
Thanks for this ENSO article with especially helpful images.
In some literature the step up in OHC associated with a strong el Nino and following La Nina is referred to as nonlinear dynamic heating (NDH) and it is associated with the observed asymmetry of ENSO, e.g. Al et al 2004:
http://lumahai.soest.hawaii.edu/MET/Faculty/jff/2004_02%20Nonlinearity%20and%20Asymmetry%20of%20ENSO.pdf
Here is an excerpt:
The strong warm events are accompanied by a strong warming tendency due to NDH. During the weak minor event, NDH is weaker (Fig. 3b). The cooling tendency due to NDH is much weaker than the warming tendency due to NDH (Fig. 3b) so the strong cold events are not expected. Consequently, this low-order nonlinear ENSO model suggests that the NDH concurs with the El Nin˜o (warm event) bursting, which also ultimately generates the strong El Nin˜o–La Nin˜a asymmetry.
…
The time evolutions of the SST tendency over the region of 58N–58S and 1708–1008W due to linear and nonlinear advective heating are shown in Fig. 6. For each time series, a 3-month running average has been applied. As shown in Fig. 6, the nonlinear heating is as strong as the linear advective heating throughout much of the ENSO episodes of 1982/83 and 1997/98. The amplitudes of these strong ENSO events were strongly skewed toward the warm event. On the contrary, during the modest and weak ENSO events such as 1986/87, the nonlinear advective heat was negligible and the warm and cold SST anomalies had similar amplitudes.
This suggests that the intensity and asymmetric behavior of strong ENSO events can be attributable to NDH.
Bob Tisdale says:
“Will we go another couple of decades before another strong El Niño causes another upward shift in the East Indian-West Pacific sea surface temperature data? We’ll have to watch and see.”
I think a warmist might say something like: “I agree the El Niño caused a step increase in SST but AGW prevents sufficient cooling between El Niño events to return the SST to the pre-El Niño values, resulting in a general upward trend in temperatures.”
The obvious response of course, is that AGW would require increasing SST in the Eastern Tropical Pacific, which we do not see.
But still, for this not to be caused by AGW, there must be some much longer cyclical pattern, probably a multi-century period, which keeps the SSTs within some normal range. IOW eventually one would expect the Indian Ocean/Western Pacific SST to return to pre-1918 levels. We just happen to be seeing a period of El Niños frequent enough and strong enough to result in an overall rising SST period. Is there any evidence of this kind of pattern? Do we have at least, El Niño dates that go back further? Or is data prior to ~1900 too sparse?
Bob:
As always, you provide an easy-to-understand, graphic description for the layman of the various phases of the highly irregular ENSO cycle. Unfortunately, it is also misleading in certain key aspects.
The kinematics of hydrostatic readjustment of water-level upon the cessation of wind-driven pile-up against coasts are physically well-established in the theory of seiching. There simply is no way that a half-meter pile-up in the West Pacific would result in “sloshing” water any appreciable distance across the ocean upon the slackening of trade-winds! Nor can Rossby waves (which transport mechanical energy far more than mass) account for the westward spreading of the “warm pool.”
Without getting into the dynamical intricacies of the Peru Coastal Current, what you miss entirely is the shallow, subsurface Cromwell Current, which flows west to east. Also neglected in your presentation is the reduction in evaporative surface cooling that accompanies the slckened trade-winds.
Correction: My comment on Rossby waves should read “account for the EASTWARD spreading…”
1sky1 says: “As always, you provide an easy-to-understand, graphic description for the layman of the various phases of the highly irregular ENSO cycle. Unfortunately, it is also misleading in certain key aspects.”
Based on the remainder of your comment, I believe you might be reading more into my simple presentation than is warranted. This was an introductory overview. Example: I never implied or suggested that Rossby waves “account for the eastward spreading of the ‘warm pool.'”
Regards
Bob,
Thanks for this post. I do appreciate the ‘picture book’ version as it truly makes much of this easier to understand. With the official exchange rate of a picture being worth a thousand words, that certainly reduces the required reading.
However, one thing just did not sit well with me, the proposition that the trade winds hold the warm pool up against the pull of gravity. Knowing that water expands with a rise in temperature (not counting extremes of the fluid range), I believe that alone is sufficient to explain the water level differential you indicated.
If I read elsewhere correctly, the volumetric expansion coefficient for water is 0.000214. That’s likely for fresh water, and seawater is probably different, but here goes anyway. A 300 meter water column at 21C would balance a 30C water column of 300.5778 meters. Exactly a half meter taller.
Although the total water column is in balance, east to west, the same can not be said of the warm/cold temperature/density boundary which is at the surface in the east and 300 meters deep in the west. I would posit that it is this thermocline’s ‘desire’ to level out in a westward direction which forces the overlying warm water to slosh back eastward when the trade winds drop off.
Your mileage may vary.
Found via Google:
http://www.engineeringtoolbox.com/volumetric-temperature-expansion-d_315.html
Thanks Bob for all your work in that article. Priceless.
“As long as the climate science community continues to treat ENSO as noise, they will make little progress in understanding the natural contribution to global warming, and it’s a sizeable contribution.”
I have several times asked a question, and gotten answers from both Judith Curry and commenters at Real Climate, that suggest that they do not see ENSO as merely noise, but that El Ninos do increase global average temperature, aka “contribute to global warming.”
The question was whether El Ninos, by releasing heat already in the oceans, cause a spurious rise in reported GAT (global average temperature), rather than actually increasing GAT, properly defined. All of the reported temp series show spikes in El Nino years. My question basically was, how did an El Nino add heat to the system, if it was simply moving heat around within it.
I understand how it contributes to an increase in reported surface temperatures. Your figure 1-25 explains it quite well. The release of heat from deeper ocean waters not included in GAT, increases the reported air surface and sea surface temperatures. But that still is a matter of just moving heat around within the climate system. It just shows that GAT is not really global.
Both Dr. Curry and the folks at Real Climate answered that El Ninos cause an increase in clouds, and that those clouds retained heat that would otherwise be released from the atmosphere by radiation. (I did not ask how they knew the net impact of the clouds would be positive, since incoming sunlight, would be reflected and thus not enter the system. I just wanted to know what their theory was for the mechanism by which El Ninos increased GAT.) So as I understand it, to them, the increases in reported temps were not noise, but were evidence of the increased heat in the system as a result of El Nino produced clouds.
My question for you is, what do you see as the mechanism for ENSO “contributing to global warming”? I think I understand your post here well enough, as it is written in a way that makes the concepts understandable to even a layman like myself. But I do not see how the system you described increases the energy or heat content of the global climate system.
I can see how an El Nino contributes to the release of heat, that might otherwise be retained in the deeper ocean; and how a La Nina could, for a time, cause more heat to be retained, until it is released by an El Nino. But how does the system as a whole operate as a “natural contribution to global warming”?
Bernard Felsche, you might find this of interest. It is the Indian Ocean Dipole linked to Enso.
http://www.bom.gov.au/climate/enso/history/ln-2010-12/IOD-what.shtml
Thanks Bob, excellent explanation. However, 19195/96 La Nina was pathetic. We moved from drought 13 inches per year to 15 inches in a 26 inch rainbelt.
Makes the IPCC’s bogeyman of the missing heat hiding in the deep ocean look more foolish than the dog ate my homework.
Why is not funding going strongly into this and related fields instead of the lunatic CO2 scares?
See Lockheed’s Skunkworks division has or is developing hot fusion.
These are worthwhile endeavors that advance mankind and the natural world, unlike funding conferences in Rio etc for gasbaggers.
GaryM says: “I can see how an El Nino contributes to the release of heat, that might otherwise be retained in the deeper ocean; and how a La Nina could, for a time, cause more heat to be retained, until it is released by an El Nino. But how does the system as a whole operate as a ‘natural contribution to global warming’?”
In addition to retain and release functions you’ve outlined, there is another function of ENSO. It also helps to redistribute heat from the tropical Pacific to adjacent ocean basins. During multidecadal periods when the strength, frequency and duration of El Niños exceed La Niñas, more heat than “normal” is released and redistributed from the tropical Pacific. Global surface temperatures have to warm during a period when El Niño events dominate. Maybe it’s easier to think of ENSO as an additional “source” of heat when it comes to surface temperatures. Conversely, when La Niñas are dominant, less heat than “normal” is released and redistributed from the tropical Pacific.
Also keep in mind that the recharge aspects of La Niñas vary widely per event. According to the ocean heat content data for the tropical Pacific, the warm water for the 1997/98 super El Niño was created by the 1995/96 La Niña, which lasted about a year and wasn’t especially strong in terms of the normal ENSO indices. Then after the 1997/98 El Niño, it took the 3-year 1998/99/00/01 La Niña to replace most of the warm water and it was a stronger event at times than the 1995/96 La Nina.
Additionally, during an El Niño, the warming of regions of the globe that are remote to the tropical Pacific is not caused by a direct exchange of heat. That warming is caused by changes in atmospheric circulation patterns–changes in trade wind strength and the jet streams. So during multidecadal periods when El Niño events dominate, the atmospheric circulation patterns would tend to be in “warm mode”, for lack of a better phrase, which would also contribute to long-term trends.
Jack says: “However, 19195/96 La Nina was pathetic.”
The 1995/96 La Nina wasn’t anything special in many respects, except that it created the warm water for the 1997/98 El Nino in a relatively short time period.
MikeW: There are a number of other explanations around the web that describe the trade winds “piling up” the warm water in the western tropical Pacific, including the NOAA FAQ webpage by Bill Kessler here:
http://faculty.washington.edu/kessler/occasionally-asked-questions.html
Bob, many thanks for an excellent tutorial on the El Nino/La Nina cycles . Is there any way of purchasing your book without going through PayPal ?
“fritz says:
January 10, 2014 at 11:21 am
@John L Kelly
Why does this happen every 10 years or so ; OK , the geothermal gradient assures the upward branch of the thermohaline circulation ; and possibly events like D-O events during glaciations ; but why would the oceanic crust release its heat with such a regular timing ?”
Who stated that it was regular? I certainly didn’t. My guess is that the same thing is going on with our planet, that causes the sun’s barycenter to dance around the exact center of the solar system: Gravity from other masses.
Bob Tisdale, responding to John Kelly, states the following: “There’s no problem, John. Everything I’ve presented is supported by data. You’ve presented speculation.”
John replies, “I feel honoured that you should include me in the ranks of such pioneers as Alfred Wegener(continental drift), and Eugene Shoemaker(lunar impact theory). Both were scoffed, but were proven correct over time. You just remember this when the science catches up on this issue, ok?
Anthony Keen says: “Is there any way of purchasing your book without going through PayPal ?”
Unfortunately, no. If you’re concerned that the PayPal webpage asks you open a PayPal account, simply scroll to where it advises you that you can purchase with a credit card, etc.
Regards
John Kelly says: “I feel honoured that you should include me in the ranks of such pioneers as Alfred Wegener(continental drift), and Eugene Shoemaker(lunar impact theory).”
I didn’t include you with them. You put yourself among Alfred Wegener and Eugene Shoemaker. Please don’t put words in my mouth.
John Kelly says: “Both were scoffed, but were proven correct over time.”
There was no scoffing or jeering or sneering or ridiculing on my part, John. I simply stated that everything I’ve presented in the post is supported by data and that you’ve presented speculation. Show me the data to support your speculation, John, so that you can prove your conjecture to be correct. That’s all. Simple.
Regards
Bob Tisdale,
“Maybe it’s easier to think of ENSO as an additional ‘source’ of heat when it comes to surface temperatures.”
I got that. I understand how El Nino increases the surface air and sea surface temp averages. But your comment was that ENSO is a “natural contribution to global warming, and it’s a sizeable contribution.”
Are you using the term “global warming” to mean merely the sruface temperature records? Or are you referring to global warming in the sense of an increase in total heat/energy in the global climate system as a whole? If the latter, I still don;t see the mechanism by which ENSO adds heat to the system as a whole And if t doesn’t, then isn’t the “increase in global warming” in fact spurious, merely a product of heat in the system that had not been measured (included in the “global average”), now entering an area of the climate system where it is measured?
Gary @ 4:59
Clear sky between the Tropics allow solar rays to penetrate the top layer of the ocean and for the energy to be absorbed in that water. That warms the water. This is natural warming added to the Earth system. Over time that energy will be removed from the water and flow back to space. The system can warm and cool. I read Bob’s material as explaining how the tropical Pacific gets and releases this warmth and redistributes it to other geographic areas.
Over the last few years, in comments, it is apparent that some people would like him to do more – build a model, make a prediction, and so on. He doesn’t do that.
I thank him for what he does do.
GaryM says: “Are you using the term “global warming” to mean merely the sruface temperature records? Or are you referring to global warming in the sense of an increase in total heat/energy in the global climate system as a whole?”
Both, but there are also other natural factors that contribute to the warming of the oceans to depth.
One of my more detailed explanations of the natural warming of ocean heat content can be found in the post “Open Letter to the Royal Meteorological Society Regarding Dr. Trenberth’s Article ‘Has Global Warming Stalled?’”
http://bobtisdale.wordpress.com/2013/06/04/open-letter-to-the-royal-meteorological-society-regarding-dr-trenberths-article-has-global-warming-stalled/
The discussion starts about half-way through the post, under the heading of THE IMPACTS OF EL NIÑO AND LA NIÑA ON OCEAN HEAT CONTENT.
Also see the discussion of Lozier et al. (2008) “The Spatial Pattern and Mechanisms of Heat-Content Change in the North Atlantic” in the post “Is Ocean Heat Content Data All It’s Stacked Up to Be?” It starts after Figure 13.
http://bobtisdale.wordpress.com/2013/03/11/is-ocean-heat-content-data-all-its-stacked-up-to-be/
Regards
Bob:
Especially in introductory presentations, it’s essential to identify unequivocally the primary mechanisms involved in observed phenomena, without getting lost in the weeds of adjunct mechanisms and phenomena It’s no misreading on my part that your presentation fails to do that.
In your Fig. 1-12, you state that gravity takes over and in 1.13 that warm water sloshes east as sea-level flattens. I’ve pointed out that the illustrated eastward spreading of warm water across much of the Pacific cannot be the result of such seiching. And in Fig. 1-19 you speak of subsurface waters “returned west via Rossby waves,” as if they produced mass transport on the requisite scale. In both cases, you appeal to adjunct mechanisms that cannot produce the observed ENSO effects. Along with arrows that mistakenly indicate the deep ocean–rather than continental shelves–as the source of cool upwelling water, this detracts from the physical realism of your presentation.
John F. Hultquist says: “Clear sky between the Tropics allow solar rays to penetrate the top layer of the ocean and for the energy to be absorbed in that water. That warms the water. This is natural warming added to the Earth system.”
Clear skies over the Pacific describes “neutral” and La Nina conditions according to the post. But reported surface temps (described as “global average temperature”) go up during El Ninos, and down during La Ninas, for the reason set forth in the article.
Bob Tisdale says: “One of my more detailed explanations of the natural warming of ocean heat content can be found in the post ‘Open Letter to the Royal Meteorological Society Regarding Dr. Trenberth’s Article “Has Global Warming Stalled?”’”
My questions are not as to ocean heat content. I think I understand that well enough. Fewer clouds during neutral and La Nina conditions allow more sunlight, and thus heat, to enter the Pacific. During El Ninos, this additional heat is then released, with clouds increasing,, ocean heat content decreasing, and less sunlight heating the ocean due to additional clouds.
What I do not see in the above article, or the article you just linked to, is an explanation for the mechanism by which ENSO as a whole “contributes to global warming”, in the sense of an increase in net global heat/energy content.
The warmists claim that additional clouds during El Ninos retain more heat, and therefore the increase in global average temperature reflects an increase in the total heat/energy content of the global climate system. as a whole.
You view is diametrically opposed, so I don’t see how you can think the rise in temps that coincide with El Ninos, is anything other than spurious.
But I appreciate your answers, and will just live with my confusion.
Sky: Two quotes from the UCSD webpage “Pacific equatorial circulation and ENSO (interannual Variability)”:
http://www-pord.ucsd.edu/~ltalley/sio210/Equatorial_circulation/
“At the equator, the easterly trade winds push the surface water directly (frictionally) from east to west. This water piles up gently in the western Pacific (0.5 meters higher there than in the eastern Pacific).”
“When the trade winds weaken or even reverse, the flow of water westward at the equator weakens or reverses and upwelling weakens or stops. Surface waters in the eastern Pacific warm significantly since upwelling is no longer bringing the cool waters to the surface. The deep warm pool in the western Pacific thins as its water sloshes eastward along the equator in the absence of the trade winds which maintain it.”
GaryM says: “The warmists claim that additional clouds during El Ninos retain more heat, and therefore the increase in global average temperature reflects an increase in the total heat/energy content of the global climate system. as a whole.”
And you believe warmists? Refer to Trenberth et al. (2002) for the causes of the warming in response to El Niño events:
http://www.cgd.ucar.edu/cas/papers/2000JD000298.pdf
And while you’re reviewing Trenberth et al, see the following quote:
“The negative feedback between SST and surface fluxes can be interpreted as showing the importance of the discharge of heat during El Niño events and of the recharge of heat during La Niña events. Relatively clear skies in the central and eastern tropical Pacific allow solar radiation to enter the ocean, apparently offsetting the below normal SSTs, but the heat is carried away by Ekman drift, ocean currents, and adjustments through ocean Rossby and Kelvin waves, and the heat is stored in the western Pacific tropics. This is not simply a rearrangement of the ocean heat, but also a restoration of heat in the ocean.”
And for a discussion of the processes that cause the tropical North Atlantic to warm during El Niños, see Wang (2005):
http://www.aoml.noaa.gov/phod/docs/Wang_Hadley_Camera.pdf
Regards
Bob:
Your cited quotes from an introductory course in physical oceanography hardly address the dynamical issues that I raise here. The ill-chosen word “sloshes”–which summons ideas of the fundamental “sloshing” mode of seiching–is later changed to “drains” on the same link, indicating that pressure-gradient forces, rather than gravity alone, are involved in spreading warm waters eastward during the inception of El Nino. Your link clearly identifies the agents of such draining as the strengthened Northern ECC along with the Cromwell current–not the quarter-cycle of the “sloshing” mode as your Fig. 1-12 and 1.13 strongly suggests.
I would like to see you avoid propagating misconceptions about ocean dynamics. While not quite as egregious as the misattribution of anticyclonic oceanic circulation to always-cyclonic planetary vorticity enshrined in WUWT’s reference pages, your attribution of significant westward transport by Rossby waves during the re-establishment of La Nina should be stricken from your otherwise admirable layman’s introduction to ENSO.
Bob, I always enjoy your work. Do you have any thoughts about why the ENSO models have been stubbornly wanting to predict El Nino development for many months now, despite reality not cooperating? The ENSO-meter is actually showing the index having dropped all the way to -0.5.
Bravo, Bob!