By Christopher Monckton of Brenchley
This time last year, as the honorary delegate from Burma, I had the honor of speaking truth to power at the Doha climate conference by drawing the attention of 193 nations to the then almost unknown fact that global warming had not happened for 16 years.
The UN edited the tape of my polite 45-second intervention by cutting out the furious howls and hisses of my supposedly grown-up fellow delegates. They were less than pleased that their carbon-spewing gravy-train had just tipped into the gulch.
The climate-extremist news media were incandescent. How could I have Interrupted The Sermon In Church? They only reported what I said because they had become so uncritical in swallowing the official story-line that they did not know there had really been no global warming at all for 16 years. They sneered that I was talking nonsense – and unwittingly played into our hands by spreading the truth they had for so long denied and concealed.
Several delegations decided to check with the IPCC. Had the Burmese delegate been correct? He had sounded as though he knew what he was talking about. Two months later, Railroad Engineer Pachauri, climate-science chairman of the IPCC, was compelled to announce in Melbourne that there had indeed been no global warming for 17 years. He even hinted that perhaps the skeptics ought to be listened to after all.
At this year’s UN Warsaw climate gagfest, Marc Morano of Climate Depot told the CFACT press conference that the usual suspects had successively tried to attribute The Pause to the alleged success of the Montreal Protocol in mending the ozone layer; to China burning coal (a nice irony there: Burn Coal And Save The Planet From – er – Burning Coal); and now, just in time for the conference, by trying to pretend that The Pause has not happened after all.
As David Whitehouse recently revealed, the paper by Cowtan & Way in the Quarterly Journal of the Royal Meteorological Society used statistical prestidigitation to vanish The Pause.
Dr. Whitehouse’s elegant argument used a technique in which Socrates delighted. He stood on the authors’ own ground, accepted for the sake of argument that they had used various techniques to fill in missing data from the Arctic, where few temperature measurements are taken, and still demonstrated that their premises did not validly entail their conclusion.
However, the central error in Cowtan & Way’s paper is a fundamental one and, as far as I know, it has not yet been pointed out. So here goes.
As Dr. Whitehouse said, HadCRUTt4 already takes into account the missing data in its monthly estimates of coverage uncertainty. For good measure and good measurement, it also includes estimates for measurement uncertainty and bias uncertainty.
Taking into account these three sources of uncertainty in measuring global mean surface temperature, the error bars are an impressive 0.15 Cº – almost a sixth of a Celsius degree – either side of the central estimate.
The fundamental conceptual error that Cowtan & Way had made lay in their failure to realize that large uncertainties do not reduce the length of The Pause: they actually increase it.
Cowtan & Way’s proposed changes to the HadCRUt4 dataset, intended to trounce the skeptics by eliminating The Pause, were so small that the trend calculated on the basis of their amendments still fell within the combined uncertainties.
In short, even if their imaginative data reconstructions were justifiable (which, as Dr. Whitehouse indicated, they were not), they made nothing like enough difference to allow us to be 95% confident that any global warming at all had occurred during The Pause.

If one takes no account of the error bars and confines the analysis to the central estimates of the temperature anomalies, the HadCRUt4 dataset shows no global warming at all for nigh on 13 years (above).
However, if one displays the 2 σ uncertainty region, the least-squares linear-regression trend falls wholly within that region for 17 years 9 months (below).

The true duration of The Pause, based on the HadCRUT4 dataset approaches 18 years. Therefore, the question Cowtan & Way should have addressed, but did not address, is whether the patchwork of infills and extrapolations and krigings they used in their attempt to deny The Pause was at all likely to constrain the wide uncertainties in the dataset, rather than adding to them.
Publication of papers such as Cowtan & Way, which really ought not to have passed peer review, does indicate the growing desperation of institutions such as the Royal Meteorological Society, which, like every institution that has profiteered by global warming, does not want the flood of taxpayer dollars to become a drought.
Those driving the scare have by now so utterly abandoned the search for truth that is the end and object of science that they are incapable of thinking straight. They have lost the knack.
Had they but realized it, they did not need to deploy ingenious statistical dodges to make The Pause go away. All they had to do was wait for the next El Niño.
These sudden warmings of the equatorial eastern Pacific, for which the vaunted models are still unable to account, occur on average every three or four years. Before long, therefore, another El Niño will arrive, the wind and the thermohaline circulation will carry the warmth around the world, and The Pause – at least for a time – will be over.
It is understandable that skeptics should draw attention to The Pause, for its existence stands as a simple, powerful, and instantly comprehensible refutation of much of the nonsense talked in Warsaw this week.
For instance, the most straightforward and unassailable argument against those at the U.N. who directly contradict the IPCC’s own science by trying to blame Typhoon Haiyan on global warming is that there has not been any for just about 18 years.
In logic, that which has occurred cannot legitimately be attributed to that which has not.
However, the world continues to add CO2 to the atmosphere and, all other things being equal, some warming can be expected to resume one day.
It is vital, therefore, to lay stress not so much on The Pause itself, useful though it is, as on the steadily growing discrepancy between the rate of global warming predicted by the models and the rate that actually occurs.
The IPCC, in its 2013 Assessment Report, runs its global warming predictions from January 2005. It seems not to have noticed that January 2005 happened more than eight and a half years before the Fifth Assessment Report was published.
Startlingly, its predictions of what has already happened are wrong. And not just a bit wrong. Very wrong. No prizes for guessing in which direction the discrepancy between modeled “prediction” and observed reality runs. Yup, you guessed it. They exaggerated.


The left panel shows the models’ predictions to 2050. The right panel shows the discrepancy of half a Celsius degree between “prediction” and reality since 2005.
On top of this discrepancy, the trends in observed temperature compared with the models’ predictions since January 2005 continue inexorably to diverge:

Here, 34 models’ projections of global warming since January 2005 in the IPCC’s Fifth Assessment Report are shown an orange region. The IPCC’s central projection, the thick red line, shows the world should have warmed by 0.20 Cº over the period (equivalent to 2.33 Cº/century). The 18 ppmv (201 ppmv/century) rise in the trend on the gray dogtooth CO2 concentration curve, plus other ghg increases, should have caused 0.1 Cº warming, with the remaining 0.1 ºC from previous CO2 increases.
Yet the mean of the RSS and UAH satellite measurements, in dark blue over the bright blue trend-line, shows global cooling of 0.01 Cº (–0.15 Cº/century). The models have thus already over-predicted warming by 0.22 Cº (2.48 Cº/century).
This continuing credibility gap between prediction and observation is the real canary in the coal-mine. It is not just The Pause that matters: it is the Gap that matters, and the Gap that will continue to matter, and to widen, long after The Pause has gone. The Pause deniers will eventually have their day: but the Gap deniers will look ever stupider as the century unfolds.
Here’s hoping the next El-Nino is at Least 3 years away.
“prestidigitation” – I quite like your writing normally, but that is a step too far. I can’t say that word, I’ve no idea what it means and I’m not going to bother to look it up in the dictionary on the basis that I’d never be able use it in a sentence anyway ! It is nice that you push our limits, but come on, give us a chance. I read it over and over again, then just when I think I’ve got the hang of it, I try to read the whole sentence again, and bam ! tongue well and truly twisted.
substitute “sleight of hand”
“The fundamental conceptual error that Cowtan & Way had made lay in their failure to realize that large uncertainties do not reduce the length of The Pause: they actually increase it.”
I’d like to see a quote where C&W are making that conceptual error. In fact, the “length of the Pause” as formulated here is a skeptics construct, and you won ‘t see scientists writng about it. The period of “no statistically significant increase” is a meaningless statistical test. Rejecting the null hypothesis can lead to useful conclusions; failing to reject does not. It means the test failed.
Yes, HADCRUT takes account of the missing data in its uncertainty estimate, but does not correct for the bias in the trend. That’s what C&W have done.
Nick Stokes,
So it doies have meaning then. It means that there is no reason to reject the null hypothesis. And the null hypothesis is that there is no significant warming for the period under review.
So you accept that greater uncertainty leads to weker statistical tests…
And so leads to less ability to detect changes in the measured temperature… Hmm.
But, from that, do you see any evidence at all that the models (which predicted a measurable change in temperature) are not failed and so shoud not be rejected?
Nick, I just love your ability to see the one tree (Yamal?) in the forest that just might prop up the failing theory of AGW.
I bet you can bake good (cherry) pies.
Mind the gap
Lord Monckton
I agree to some degree but I think you might talking around the point rather than hitting it the nail on the head. I could be completely wrong…
If they grid the data they grid the data. Their value, whatever interpolation method they used is still just an estimate. The question is whether the method, and associated artifacts, creates something more or less reliable than other methodologies.
I’m probably teaching you to suck eggs here but in order to be comprehensive…
Kriging as absolutely fine so long as you can remove any structural component (such as trend) in order to produce a stationary data set. There are a variety of kriging methods that implicitly deal with any structural component, but in my experience, the best way is: to assume a variable trend (structural component is “non-linear”); create the structural surface using some fit such as a B-Spline; remove this; then Krige using the residuals and finally add the structural component back into our gridded data to give us the temperature map.
The issue as I see it…
The important point here, is that it is implicit within the Kriging algorithm, that there is 100% confidence in any structural surface that we might use; but of course one now has the problem that our structural component relies on very sparse data, therefore our trend (structural component) is worthless and any Kriged surface will have much larger uncertainties than the Kriging variance would suggest – they have likely been superficially deflated due to the use of an expansive trend.
M Courtney says: November 20, 2013 at 1:54 am
“But, from that, do you see any evidence at all that the models (which predicted a measurable change in temperature) are not failed and so should not be rejected?”
Well, that’s the point. You can adopt the null hypothesis that the models are right, and if you can reject that, you’ve proved something. But AGW isn’t deduced from the temperature record, so isn’t dependent on rejecting a null hypothesis of zero warming.
Nick Stokes, you are like the shop keeper in the Monty Python dead parrot sketch. “That global warming ain’t dead, its just sleeping”.
The “null hypothesis” is the default position: that there is no relationship between two measured phenomena.
Phenomena 1: CO2 increasing in the atmosphere.
Phenomena 2: Global mean surface temperature rises.
So the “null hypothesis” is that as CO2 in the atmosphere rises the mean surface temperature fails to show any relationship to that rise – that is it either stays the same, falls or randomly changes in a way that does not suggest any linkage to rising CO2.
The results of this experiment from the last 10 to 18 years, depending on which data set you use, is that the mean global surface temperature has not risen.
As time goes by the idea that the null hypothesis has been disproved by the climate scientists looking for signs of AGW looks less and less tenable.
Nick Stokes, I just hit the floor in gales of laughter when I read this:
Now let us just remind ourselves what the letters AGW stand for:
“Athropogenic Global Warming”
Now please enlighten me how you measure “warming” without measuring the temperature?
Nick says that AGW is not deduced from the temperature record. Now there’s a surprise, to me at least. I’ve understood that the output of the numerous “climate models” AGW is invariably expressed as potential warming (in degrees Celsius), typically up to the end of the century.
So, what role do the temperature records actually play in model simulation? Nick’s answer seems to be “None”. The inference to be drawn is that that models rely /entirely/ on proxy measurements, and that their outcome is translated magically, after they have been run, into the familiar scale of temperatures as we experience them. I’d like a bit more instruction on this from someone who really knows what they are talking about.
Me thinks Nick Stokes just pops in near the front of any thread discussion to try and get folk off on a tangent and to try and wreak the thread by uttering confusing nonsense! Ignore him is the best thing to do imo
It looks as though the warmies haven’t learned the lessons of the past. We seem to be entering something akin to the hockeystick wars where any old rubbish that supported the disappearance of the MWP was immediately feted as great science. I believe this is the first shot in the “pause war” and will be followed with a plethora of faux papers demonstrating there is no pause, each one greeted with swooning and adulation by the climate science community and each one destroyed on the blogosphere by the so called “citizen scientists” until, like the hockeystick the warmies will try to quietly drop it.
[Snip. Bad email address. — mod.]
Nick Stokes says:
November 20, 2013 at 2:10 am
As nothing that that warmists claim ever seems to be falsifiable, I suppose they don’t need to concern themselves with trivialities such as the temperature record.
By the way Lord M. Is it just a coincidence that since you started representing the Mayanmar government, they’ve been welcomed back into the international community?
TLM says: November 20, 2013 at 2:27 am
“Now please enlighten me how you measure “warming” without measuring the temperature?”
AGW has been around since 1896. Arrhenius then deduced that CO2 would impede the loss of heat through IR, and would cause temperatures to rise. There was no observed warming then. AGW is a consequence of what we know about the radiative properties of gases.
AGW predicted that temperatures would rise, and they did. You can’t do better than that, whether or not the rise is “statistically significant”.
robinedwards36 says: November 20, 2013 at 2:39 am
“So, what role do the temperature records actually play in model simulation? Nick’s answer seems to be “None”.”
Yes, that’s essentially true. GCM’s solve the Navier-Stokes equations, with transport of materials and energy, and of course radiation calculations. A GCM requires as input a set of forcings, which depend on scenario. GISS forcings are often cited. But a model does not use as input any temperature record.
[Snip. Bad email address. — mod.]
“later, Railroad Engineer Pachauri, climate-science chairman of the IPCC,”
This shows at least some good practice within the IPCC.
In the nuclear construction industry, we attach great importance to people being suitably qualified and experienced (SQEP) for the task/ role they are performing.
Mr Pachauri sounds eminently qualified for running a “gravy train”
Nick Stokes says:
November 20, 2013 at 2:10 am
“But AGW isn’t deduced from the temperature record”
And as the “pause” either does not exist (Cowtan & Way) or is not (yet) long enough to actually invalidate the models then AWG is still a potentially valid argument?
Is that your true position or have I misstated you?
Nick
Your points sort of jump around the place.
Arrhenius then deduced that CO2 would impede the loss of heat through IR
No that it should. And in single phase system where CO2 is the only variable then yes. But that is not a good description of the atmosphere.
AGW predicted that temperatures would rise, and they did.
Firstly, temperature can only do three things go up, stay the same or go down. Now climate is never static so it’s a fifty-fifty chance that it will go up/down. Making a prediction that it will go up and it does, does not mean that you understand why it does. You’re assuming correlation is causation it is not.
You can’t do better than that, whether or not the rise is “statistically significant”
You’re easily impressed. If you claim to understand what causes climate change then make predictions that their will be statistically significant warming with increasing CO2, and at a particular rate, and then it fails to materialise then by all scientific standards the null hypothesis is accepted.
Lord Monckton-
I think the RMS allowing this paper needs to be put into the context of the RSA’s pursuit in earnest of the Social Brain Project. It also needs to be linked with the sponsorship last week of Roberto Mangabeira Unger to speak on “Freedom, Equality and a Future Political Economy: the Structural Change We Need.”
Listening to that sent me looking for Unger’s book and the democratic experimentalism being pursued in both the UK and the US hiding under federal agency spending but quite systematic. The bad science you so ably dissect is just the excuse to make the experimentation seem necessary and justified.
The “We want equity now” formal campaign I attended last night is closely related with the same funders but it doesn’t play well in the suburbs. Yet.
Well said Lord M.
Climate Alchemy crystallised its false predictions in 1981_Hansen_etal.pdf (Google it). In this paper they changed the IR emission from the Earth’s surface from Manabe and Strickland’s correct but vastly exaggerated ~160 W/m^2 (SW thermalised at the surface) to ‘black body’. To do so, they assumed the ‘two-stream approximation’ applies at an optical heterogeneity, the surface. You can’t do that. Thus in 1988, Congress was misled. We know this from experiment, the real temperature record.
The key issue is from when did ‘the team’ realise it was wrong? It seems to be1997 when it was proved that CO2 follows warming at the end of ice ages. This begat the ‘Hockey Stick’ to get AR3.
In 2004, Twomey’s partially correct aerosol optical physics was substituted by the Sagan-origin claim of ‘more reflection from the higher surface area of smaller droplets’, untrue. This begat AR4.
In 2009, the revised Kiehl-Trenberth ‘Energy Budget’ introduced 0.9 W/m^2 ‘abyssal heat’, what I call ‘Pachauri’s Demon’, the magick whereby hotter than average sea surface molecules are miraculously transported below 2000 m, where you can’t measure the extra heat, without heating the first 2000 m of ocean! This begat AR5.
That suggests 16 years of knowing prestidigitation by people paid to be scientists when they weren’t following its most absolute condition – never deceive the punters.
Nick Stokes says:
November 20, 2013 at 2:50 am
“AGW predicted that temperatures would rise, and they did. You can’t do better than that, whether or not the rise is “statistically significant”.
Assuming that there are no other reasons for the temperatures to rise over the same period, such as natural variability.
The paragraph, “Those driving the scare have by now so utterly abandoned the search for truth that is the end and object of science that they are incapable of thinking straight.They have lost the knack.” brought to mind a quote of Alvin Toffler that was posted today on a FB science page that, quite ironically, is very pro-CAGW:
“The illiterate of the 21st century will not be those who cannot read and write, but those who cannot learn, unlearn, and relearn.”
It seems that many of the climate ‘science’ practitioners fail Toffler’s literacy test.
Nick Stokes says:
November 20, 2013 at 2:10 am
———————————————-
“You can adopt the null hypothesis that the models are right, and if you can reject that, you’ve proved something.”
Nice try Mr Stokes , but it won’t wash. Despite “travesty” Trenberth’s crazed proposal to the AMS that the null hypothesis should be reversed in the case of AGW, the null hypothesis “AGW is utter tripe” remains in place. And the null hypothesis still stands for not just AGW but the radiative greenhouse hypothesis underlying it.
“But AGW isn’t deduced from the temperature record, so isn’t dependent on rejecting a null hypothesis of zero warming.”
No, that won’t work either. AGW has not been “deduced”. It has been proposed, rejected, reanimated, hyped and used for blatantly political purposes. Anyone with any reasoning ability should be able to deduce that adding radiative gases to the atmosphere will not reduce the atmospheres radiative cooling ability.
RicharLH: I believe that excess warming, including the rise in OHC, in the 1980s and 1990s was because of Asian industrialisation and forest burning. The extra aerosols reduced cloud albedo.
The effect saturated about 1999 when the ‘Asian Brown Cloud’ appeared. this seems to have been the ‘false positive’ which encouraged ‘the team’ to continue its serious dissembling.
PS the physics behind this is the correction to Sagan’s incorrect aerosol optical physics. He misinterpreted the work of van der Hulst.
Lewis P Buckingham says:
November 20, 2013 at 1:18 am
“When Cowtan and Way infilled the Arctic temperature data, did they also calculate error bars inherent in that infilling?”
Did Cowan and Way “infill” the Arctic temperature data? To me it looks as if Cowan and Way made retrospective predictions about what Arctic temperatures would have been, rather than providing “actual data”. There is a lamentable tendency to treat predictions as “actual data”. By “actual data” I mean real temperature measurements made, and recorded, by flesh and blood people. Cowan and Way have not provided any new “actual data.” There is another point. How does anyone know whether or not temperatures in the Arctic are rising rapidly, if, as is generally admitted, there is a scarcity of “actual data” for the Arctic?
Nick Stokes, I have heard of “moving the goal posts” to win an argument, but you have taken the goal posts off the pitch entirely.
Look up the scientific method, or re-take science 101!
The CAGW hypothesis, as demonstrated by models, has been entirely and completely falsified, by true, unadjusted, untampered, real, empirical scientific measurements. The prediction of the accepted and established hypothesis, (that a doubling in CO2 will result in a warming rate with a central estimate of 3 degrees warming) has NOT happened. the prediction is false, the hypothesis is falsified. Go back to the drawing board and find a hypothesis which is validated by empirical evidence. Stop adjusting the evidence to fit the hypothesis!
Bottom line –
CO2 has risen, is still rising, and temperatures are not.
Nick Stokes, I cannot believe you are even trying to defend your laughable position, particularly with this classic:
OK right, so if a theory is accepted by a scientific consensus as “proved” then it stays proven regardless of all subsequent evidence to the contrary? Gallileo and Einstein might have something to say on that idea.
Well nick is right, in that AGW is not deduced from the temperature record, its a failed hypothesis that persists despite solid evidence to the contrary….IE models designed with AGW in mind invariably overestimate warming by large amounts. Natural variability is the primary driver of climate and if you can’t see that by now, you should really take a close look at why you believe in CAGW.
NicK Stokes says “AGW has been around since 1896. Arrhenius then deduced that CO2 would impede the loss of heat through IR, and would cause temperatures to rise. There was no observed warming then.”
While the IPCC likes to show warming only from 1850, 46 years before 1896; longer time series show warming since the LIA. How much of that if any is AGW is yet to be demonstrated.
@ Nick Stokes:
AGW has been around since 1896. Arrhenius then deduced that CO2 would impede the loss of heat through IR, and would cause temperatures to rise. There was no observed warming then. AGW is a consequence of what we know about the radiative properties of gases.
One wee flaw, he completely reversed his opinion about 10 years later! AGW is still just a hypothesis, not even a theory, but once the all encompassing Precautionary Principle is invoked, anything is possible, even fairies at the bottom of your garden! 🙂
cd says: November 20, 2013 at 2:59 am
“If you claim to understand what causes climate change then make predictions that their will be statistically significant warming with increasing CO2, and at a particular rate, and then it fails to materialise then by all scientific standards the null hypothesis is accepted.”
No, statistical testing never leads to the null hypothesis being accepted. The outcomes are reject or fail to reject.
If you want to disprove something statistically, you have to adopt the null hypothesis that it is true, and then show that that has to be rejected.
Alan the Brit says: November 20, 2013 at 3:33 am
“One wee flaw, he completely reversed his opinion about 10 years later!”
I’d like to see a citation for that.
As Dr Roy Spencer has stated, the climate Null Hypothesis has never been falsified.
The Null Hypothesis is a corollary of the Scientific Method. Because it has never been falsified, it means that the current climate remains well within historical norms. There is nothing either unusual or unprecedented happening, therefore all the arm-waving to the contrary is simply Chicken Little-type alarmism.
In a way Nick Stokes is correct in saying “AGW isn’t deduced from the temperature record”. The debate is actually about whether and, if so, how, when and where climate becomes significantly more dangerous overall having taken account of demographic changes in the broadest sense”.
Global average temperature is used as a simplistic proxy by both sides of the debate to try and justify political actions.
Taking the focus to the real issue and looking at existing data , apart from sea-level behaviour there is as yet nothing to indicate how, when and where things will get more dangerous..
Nick Stokes says:
November 20, 2013 at 2:55 am
“But a model does not use as input any temperature record.”
I find this difficult to accept!
Do people write simulations with many variables and not seed the variables at the start of simulation?
Surely every simulation run ought to be preceded by an initialization step?
To Alan the Brit: the Arrhenius hypothesis is based on the assumption of ‘black body’ surface-emitted real energy being absorbed by GHGs in the atmosphere with that energy being thermalised in the atmosphere.
Only one of these assumptions is valid; if there were IR emission in the self-absorbed GHG IR bands, that energy would be absorbed. However, anyone with sufficient statistical thermodynamics’ knowledge knows that this energy cannot be thermalised in the gas phase (assumes higher or equal temperature surface).
The bottom line is that it all comes down to Tyndall’s experiment having been seriously misunderstood. The GHGs absorb IR energy but the thermalisation has to be at optical heterogeneities, the interface with condensed matter for which the vibrationally activated density of states is much broader.
As for surface emission: the most basic radiative physics is that radiation fields are added vectorially, so there can be no net surface IR in most H2O or CO2 bands. That so many physicists accept the IPCC case proves that modern physics’ education is rubbish. I forgive the climate people because they are taught incorrect physics No professional engineer with process engineering experience accepts this mistaken view because we have to get the right answer.
“However, the world continues to add CO2 to the atmosphere and, all other things being equal, some warming can be expected to resume one day.”
Isn’t this conflation of the two and the implied cause and effect, an example of a logical fallacy? I’m sure it will get warmer again and it will get colder again, but without very much reference to CO2.
steverichards1984 says: November 20, 2013 at 3:42 am
“Do people write simulations with many variables and not seed the variables at the start of simulation?
Surely every simulation run ought to be preceded by an initialization step?”
Yes, they do initialize. But typically with a climate model, the initial state is set way back (many decades), and the model left to “wind up”. That’s an acknowledgement that the initial state is not well known, and probably contains unrealistic things that have to be left to settle down. The initial state would be based on climate norms.
dbstealey says: November 20, 2013 at 3:42 am
“As Dr Roy Spencer has stated, the climate Null Hypothesis has never been falsified.”
I presume that NH includes zero trend. And that just isn’t true. The fact that people are talking about 20 years or whatever without significant warming implies that the trend over longer times is significantly different from zero. Otherwise what does the number mean?
TLM says: November 20, 2013 at 3:25 am
“OK right, so if a theory is accepted by a scientific consensus as “proved” then it stays proven regardless of all subsequent evidence to the contrary?”
No, there’s a well established way of disproving it. Do it! If you want to do it statistically, posit some consequence of the theory as null hypothesis and try to reject it. Just saying that you have failed to disprove some alternative theory doesn’t work.
Surely whether there has been a pause in warming or not over the past 17 years is neither here nor there. The key point is that the GCM models predicted that temperatures would rise a lot faster than they have over the past 17 years due to increasing emissions/concentrations of CO2, and the fact that the temperature hasn’t risen as quickly as predicted, kind of suggests that the sensitivity of the surface temperature to CO2 concentrations is low, and hence future impacts will be less severe than currently predicted.
Surely that is a good thing? And thus climate change becomes something less to worry about? Or am I missing something?
Nick Stokes says:
November 20, 2013 at 2:55 am
“GISS forcings are often cited. But a model does not use as input any temperature record.”
The temperature record is used in the calculation of the most critical input of all in the models. And not the entire temperature record, but only a tiny fraction of the record that is extremely cherry-picked. The temperature record of late 20th Century warming is used in the calculation of climate sensitivity, which is the sole reason for any significant debate on AGW.
Now, the water vapor feedback hypothesis does not need a temperature record to become a hypothesis. One can hypothesize that the feedback is any number at all, from extremely negative to extremely positive. Yet it is absolutely critical that the feedback number be seen as potentially legitimate, and that it seems to equate with at least some actual temperature record. The late 20th century warming plus CO2 trend are the only time in history that we have any evidence that the current water vapor feedback hypothesis could be valid. Outside of this time, the hypothesis is falsified by evidence that is far more scientifically valid than Cowtan and Way’s Arctic temperatures.
Remove the cherry-picked temperature record from the assumption of a water vapor feedback and the AGW Theory becomes a 1 degree, largely beneficial, temperature rise in which the world can rejoice. So go ahead and remove the temperature record, Nick, and we can all go home pretend the last 25 years of fear mongering never happened. However you can not defend the temperature record as justification for the input assumptions and then deny that the temperature record is relevant to the output.
If the temperature record is not relevant, then the AGW theory is not relevant, from beginning to end.
Jim Clarke says: November 20, 2013 at 4:15 am
“The temperature record is used in the calculation of the most critical input of all in the models. And not the entire temperature record, but only a tiny fraction of the record that is extremely cherry-picked. The temperature record of late 20th Century warming is used in the calculation of climate sensitivity, which is the sole reason for any significant debate on AGW.”
Climate sensitivity is not an input to GCM’s. You can use a GCM to estimate CS. People also try to independently estimate CS from the temp record, but it isn’t easy.
Great thread!
“AlecM says:
November 20, 2013 at 3:43 am”
Could not have said it better myself. Give this man a VB!
Hi Nick
Have you ever done the exercise whereby you remove the Arctic stations/data from the equation and then graphed the results?
That is to say that what is produced is ;
A) A ‘global’ record excluding the Arctic
B) A NH record excluding the arctic
C) JUST the Arctic itself?
Tonyb
So,,,,,, who are these individuals that have written this paper?
What is their history in climate science?
What else have they written?
What groups do they belong to?
What is their motivation for attempting to explain away the pause?
Who funds them?
Who reviews them?
@Nick
“But AGW isn’t deduced from the temperature record, so isn’t dependent on rejecting a null hypothesis of zero warming.”
I got a bigger and longer laugh from your squirming today than from the good Lord’s wise words, and that is saying something! Of all the desperation – I just can’t spend the time to address all of it so just one reminder about 1896 and all that LWIR radiation.
Arrhenius did make his observation of course, but later admitted he got it really wrong! How about citing that for a change! All the IPCC and their running mates are doing is repeating his first mistake, only to have to (inevitably) correct it later just as he did: CO2 warms, but not by very much.
Christopher M observes that the warming is so slight that even a lack of El Nino’s for a time cancels it entirely. You will recall, of course, outrageous prophecies from the likes of Hansen who had the oceans boiling and a “Venus-like climate” in a few centuries, based on the continued redoubling of emissions from burning fossil fuels that same crowd screams are going to run out soon. When that happens we will still be able to burn the piles of accumulated stupid over at the IPCC offices.
Monty Python never made up a sketch as dumb as the kneejerk defenses of CAGW. 1896….my a$$!
Wow, Nick Stokes has really jumped the shark in this comments thread. Needs to be preserved for posterity, as the moment he can look back on and realise what the AGW agenda had done to his scientific objectivity.
Been away, sorry for the delay.
It is a big step to go from:
A: The temperature record has diverged from the models and so the models are wrong.
to
B: The temperature record has diverged from the models and so CO2 is not a greenhouse gas.
Point A seems to be proven, within any statistical meaning. But that does not lead to Point B. The climate is a complex system with many factors. How they all interact is not known… indeed proving Point A shows they are not all well-estimated.
Conversely, Point B being a reasonable fact (some might say a self-evident fact from our knowledge of spectroscopy) does not necessarily lead back to Point A. Although it might be a justifiable leap if the models did have a proven track record of approximating the real woorld
Failure of the models is a reason to not use the models in making expensive and poverty inducing policy decisions.
Failure of the models is a reason to question the impact of CO2 and other greenhouse gases on the whole climate system.
That’s two steps with different justifications required.
Yet it seems to me that many people get so carried away with their policy battles that they go so far as reify the link from policy to the Navier-Stokes equations: Firming it up both ways.
They are very tenuous links.
tonyb says: November 20, 2013 at 4:28 am
“Have you ever done the exercise whereby you remove the Arctic stations/data from the equation and then graphed the results?”
Well, not quite. What I’ve been doing lately is contrasting the normal practice of HADCRUT (and most recently, NOAA) of discarding cells with no data, with instead infilling with a latitude average.
Discarding means in arithmetical effect that the dataless cells are treated as having the value of the global average. This underweights the information we have about the region. Treating them as typical of what we know of their latitude, rather than what we know of the world, makes more sense.
So it’s not exactly with/without, but nearly.
I have tried ways of estimating Arctic and Antarctic in isolation. Here’s Antarctica.
“Crispin in Waterloo but really in Ulaanbaatar says:
November 20, 2013 at 4:33 am”
Another “wrong” for Arrhenius was Eugenics! But most people keep quiet about that too!
OssQss says:
November 20, 2013 at 4:29 am
Reading through the related thread on Climate Audit it appears that the authors have form on SkS.
AlecM says:
November 20, 2013 at 3:00 am
The key issue is from when did ‘the team’ realise it was wrong?
AlecM, they always knew they were wrong, it was never, ever about real Science, it was about Control & Cash.
Nick
Thanks for that.
The amplification in the Arctic is, I suspect, artificially inflating the Global and NH temperatures albeit Giss and Hadley don’t really appear to properly account for it
There is also the ‘uhi’ factor that recognise that far more readings are taken in urban areas than used to be the case, but lets ignore that for the moment
I have done a lot of work on CET and was at the Met Office discussing it just a couple of weeks ago. It is a pretty reliable proxy for NH temperatures at least. Look at what it has been doing over the last decade.
http://www.metoffice.gov.uk/hadobs/hadcet/
There appear to be many other datasets showing cooling, but they are being lost in the general noise of the bigger record.
I suspect the Arctic is (or has been) warming, just as it did in the 1920-1940 period (where 1930-1940 In Greenland remain the two warmest consecutive decades on record) and we also know of considerable warming in the 1820-1850 period.
Bearing in mind all the above I would have thought it a very useful and very fundamental exercise for someone with the appropriate skills (You) to produce the three graphs I suggest.
I suspect there is a Nobel prize in this for both of us 🙂
tonyb
Arctic North of 70 deg North is less han 3% of the World. If it warmed 1 deg C only, the World would warm 0.03 deg C!!
For Arctic alone to warm up the World 1 deg C it would have to warm up moret han 33 deg C
Hyperthermania @ 01:30 says:
Here ya go:
pres·ti·dig·i·ta·tion
ˌprestəˌdijəˈtāSHən/
noun
formal
noun: prestidigitation
1.
magic tricks performed as entertainment.
Nick Stokes says:
November 20, 2013 at 3:52 am
steverichards1984 says: November 20, 2013 at 3:42 am
“Do people write simulations with many variables and not seed the variables at the start of simulation?
Surely every simulation run ought to be preceded by an initialization step?”
Yes, they do initialize. But typically with a climate model, the initial state is set way back (many decades), and the model left to “wind up”. That’s an acknowledgement that the initial state is not well known, and probably contains unrealistic things that have to be left to settle down. The initial state would be based on climate norms.
—————————————————————–
That may be true but you overlook the point that the models then use the existing temperature record to “calibrate ” (i.e. modify -some say fudge – the model parameters) to make the models “fit” the temperature record before the prediction runs.
Nick Stokes says:
November 20, 2013 at 2:10 am
“But AGW isn’t deduced from the temperature record, so isn’t dependent on rejecting a null hypothesis of zero warming.”
In other words, the hypothesis of Antropogenic Global Warming stays unfalsified even when it’s not warming?
In other words, rising temperatures are not a prediction of the theory?
Ok. Let’s just accept that.
You have just said that the AGW theory does not predict rising temperatures.
If that is the new official position of IPCC climate science, we can stop talking about spending hundreds of billions to protect us from warming.
Nick Stokes says:
November 20, 2013 at 4:40 am
“Discarding means in arithmetical effect that the dataless cells are treated as having the value of the global average.”
Infilling by any method has the logical effect that you are then estimating rather than measuring. The assumption is that the infilling method provides a “correct” value to substitute for a truly measured one.
To be sure you should only compare “like with like” thus not increasing the error potential/margin.
That is the main problem with “Cowtan and Way”, they create data by estimation then treat it as “measured” for the conclusion they derive.
Many thanks to all who have contributed here. Mr. Stokes is perhaps on shaky ground when he suggests that observed temperature change is not an input to the models. Of course it is, and in many places. For instance, it is one of the inputs that they use in their attempts to quantify the water vapor and other temperature feedbacks.
He is also on shaky ground in suggesting that the fact of little or no warming over the past couple of decades does not show the theory to have been wrong. Of course it does. Everyone who is rational accepts that adding greenhouse gases to the atmosphere will cause some warming, all other things being equal: but Arrhenius, whom Mr. Stokes cites with approval, did indeed change his mind about the central question in the climate debate. That question is not, as Mr. Stokes tries to imply, the question whether CO2 is a greenhouse gas and can cause warming. That question has long been settled in the affirmative.
Mr. Stokes is incorrect to say that Arrhenius was the first to posit the warming influence of CO2. It was in fact Joseph Fourier who did so, for he had deduced that it might influence the escape of “chaleur obscure” (i.e. infrared radiation) to space. Tyndall’s experiment of 1859 demonstrated that CO2 does indeed inhibit the passage of long-wave radiation. Arrhenius, during the long Arctic winter of 1895/6, after the loss of his wife, consoled himself by carrying out 10,000 individual spectral-line calculations, and he had not even brought a pocket calculator with him, still less a computer.
Unfortunately, his calculations were wrong. They were based on defective lunar spectra, and he had not at that time come across the fundamental equation of radiative transfer, which had been demonstrated a quarter of a century previously and would have saved him much computation. In 1906 he realized he had gotten his sums wrong, and, in a paper published in Vol. 1, no. 2 of the Journal of the Royal Nobel Institute, he published a new estimate about one-third of the original estimate, though he also added a water-vapor feedback.
As the head posting demonstrates, there is a growing discrepancy between even the most recent predictions of the IPCC about the rate of global warming and the observed rate. That discrepancy is now serious. The discrepancy between the First Assessment Report’s predictions in 1990 and what has happened since are still more serious. Then, the IPCC predicted that global warming would occur at 0.35[0.2, 0.5] K/decade. However,, the actual warming since then has been 0.14 K/decade, or only 40% of the predicted rate.
Furthermore,much of the warming since 1990 occurred during the positive phase of the Pacific Decadal Oscillation that endured from the sharp cooling-to-warming phase transition in 1976 to the warming-to-cooling transition late in 2001. As Pinker et al. pointed out in 2005, the positive phase of the PDO was coincident with – and perhaps causatively correlated with – a naturally-occurring reduction in cloud cover that greatly reduced the planetary albedo and exercised as very large forcing (approaching 3 Watts per square meter).
Analysis by Monckton of Brenchley and Boston (2010), in the 42nd Annual Proceedings of the World Federation of Scientists, suggests that between one-third and one-half of the warming since 1983 had been anthropogenic, and the rest was caused by the reduction in cloud cover.
Like it or not, the continuing failure of global mean surface temperature to change at anything like the predicted rate (or, in the past couple of decades, at all) is a serious challenge to the official theory, raising questions about the magnitude of the feedbacks the IPCC uses as a sort of deus ex machina to triple the small direct warming from CO2.
Mr. Stokes, in trying to suggest that the debate between skeptics and extremists centers on whether or not there is a greenhouse effect, is being disingenuous. The true debate is about how big the direct warming effect of CO2 is (for there are many non-radiative transports that act homeostatically and are undervalued by the models: evaporation, for instance), and how big the feedback factor should be (several papers find feedbacks appreciably net-negative, dividing climate sensitivity by up to 5).
Mr. Stokes also gives the impression that the uncertainties not only in the data but also in the theory are far smaller than they are. It is perhaps time for him to accept, in the light of the now-manifest failure of global temperatures to respond as predicted, that those of us who have raised legitimate and serious questions about those many aspects of the theory that are not settled science may have been right to do so.
Intellectual honesty is essential to true science. Mr. Stokes would earn more respect if he conceded that the discrepancy between what was predicted and what is observed is material, and that, if it persists, the skeptics he so excoriates will have been proven right.
I believe that Nick Stokes deserves an award for agile and persistent hand-waving around the fact that the warming has stopped for at least 17 years. Well done. It takes a very special amount of diligence and effort to ignore the truth, which has his cohorts in such a panic that they can’t even decide how to respond to it, resorting to amazing feats (and quite amusing) of straw-grasping.
BREAKING NEWS ALERT!!!
20 Nov: Washington Post: AP: Turmoil at UN climate talks as question of who’s to blame for global warming heats up
An old rift between rich and poor has reopened in U.N. climate talks as developing countries look for ways to make developed countries accept responsibility for global warming — and pay for it.
With two days left, there was commotion in the Warsaw talks Wednesday after the conference president — Poland’s environment minister — was fired in a government reshuffle and developing country negotiators walked out of a meeting on compensation for climate impacts….
The question of who’s to blame for climate change is central to developing countries who say they should receive financial support from rich nations to green their economies, adapt to shifts in the climate and cover costs of unavoidable damage caused by warming temperatures.
http://www.washingtonpost.com/world/europe/turmoil-at-un-climate-talks-as-question-of-whos-to-blame-for-global-warming-heats-up/2013/11/20/17a34bf6-51e5-11e3-9ee6-2580086d8254_story.html
u must check the pic in the above, whose caption is:
(PRECIOUS) Photo Caption: United Nations Secretary General Ban Ki-moon, right, and Executive Secretary of the UN Framework Convention on Climate Change Christiana Figueres, left, talk during a meeting with the Ghana Bamboo Bike initiative, at the UN Climate Conference in Warsaw, Poland, Wednesday, Nov. 20, 2013.
HOPEFULLY THE DEVELOPING COUNTRIES WILL NOW GET OUT OF THE PROCESS ALTOGETHER, & CHASE AWAY THE SOLAR/WIND SALESPEOPLE PUSHING TECHNOLOGY ON THEM THAT WE IN THE DEVELOPED WORLD CAN’T EVEN AFFORD IN THEIR PRESENT STAGE OF DEVELOPMENT.
@DirkH
“That may be true but you overlook the point that the models then use the existing temperature record to “calibrate ” (i.e. modify -some say fudge – the model parameters) to make the models “fit” the temperature record before the prediction runs”
Unless we have a different understanding of ‘model parameter’ what you are saying is not correct.
Could you clarify what you mean by ‘model parameter’ and how you think they are ‘calibrated’?
@Nick Stokes
Serious question for information. Do the GCMs have any adjustable parameters? If so are these parameters fit to the prior history? By contrast, are the GCMs first principle models with well established inputs from known physical measurements?
Re hurricanes. I said it before, but I will reiterate.
Hurricanes cannot be dependent on absolute surface temperature, as has been claimed by some politicians and media outlets, otherwise Venus would be raging with them – and it is not. Yet Mars manages some impressive hurricanes with little in the way of surface temperature.
In reality, large depressions and smaller tornadoes depend on differential temperatures in the airmass, not absolute temperatures. This was nicely demonstrated in the recent US tornado swarm, which raged along a large and vigorous cold front.
R
“prestidigitation” – slight of hand. Magic.
Nick
I see you’ve resorted to being pedantic.
If you want to disprove something statistically, you have to adopt the null hypothesis that it is true, and then show that that has to be rejected.
Sorry but if I were being pedantic I would have to correct you here; you don’t have to adopt anything, the null hypothesis is the default position. That default position is either accepted or rejected after experimentation via statistical inference (as stated). The converse must therefore also be true (relating to the hypothesis or alternative hypothesis).
@Patrick
>Another “wrong” for Arrhenius was Eugenics! But most people keep quiet about that too!
Yup, he was quite a guy. What I do like able him was that he admitted the first go-round was in error and he raised the (unproven) idea that there are multipliers that might kick in if CO2 warmed things first.
I spent the greater part of today calibration to several significant digits a machine that uses infra red radiation to stimulate CO2 and CO molecules so they can be counted. The reason I was successful was because CO2 absorbs IR and lights up nicely so we can count a ‘show of little carbon hands’.
Anyone who claims CO2 does not cause a slight insulating effect is denying reality – a reality I use to determine CO and CO2 levels in gases. Many machines used in industry (all the good ones) operate on the same principle.
But, that does not a climate model make. How the atmosphere deals with any additional heat is very different from how a few thousand parts per million react to a laser beam. As Willis has ably demonstrated, when heated, the atmosphere dumps a lot more heat higher up by creating thunderstorms, and/or condenses additional cloud cover to cool the planet. It is a governed system, unlike the simplistic model I use each day to make measurements, with a delay of about 8 months, right Willis?
But I digress. The topic of the hour is the fact that if you smear the data to increase the width of the error bars, you allow for an interpretation that includes possibly greater cooling, not just possibly greater warming. Given the additional uncertainty, the period for which there may have been no warming at all is extended further back in time. That is the unavoidable consequence.
Nick Stokes says:
November 20, 2013 at 3:59 am
dbstealey says: November 20, 2013 at 3:42 am
“As Dr Roy Spencer has stated, the climate Null Hypothesis has never been falsified.”
I presume that NH includes zero trend. And that just isn’t true. The fact that people are talking about 20 years or whatever without significant warming implies that the trend over longer times is significantly different from zero. Otherwise what does the number mean?
To see if any thing abnormal is going on since the end of the Little Ice Age, approximately 1850. The trend line should approximate the average of the ones at the start of the Minoan, Roman and Medieval warm periods.
M Courtney says:
November 20, 2013 at 4:40 am
Failure of the models is a reason to not use the models in making expensive and poverty inducing policy decisions.
Failure of the models is a reason to question the impact of CO2 and other greenhouse gases on the whole climate system.
That’s two steps with different justifications required.
Yet it seems to me that many people get so carried away with their policy battles that they go so far as reify the link from policy to the Navier-Stokes equations: Firming it up both ways.
They are very tenuous links.
You are correct that CO2 is a greenhouse gas. I do not think that the position of a reasonable sceptic is that it is not a greenhouse gas. I do think what we are saying it is not the significant factor that the warmest think it is. I do not think at this time anyone knows what causes El Niño and La Niña or what the effects of sun spot activity has on climate both of which seem to be much more important to climate than CO2.
I am highly impressed, as I so often am, by Lord Monckton’s bandwidth, his command of so many relevant facts, and his seeming ability to summon them at a moment’s notice.
So it was probably salutary for me, as one who, not being so blessed, am among those most likely to be enthralled by such virtuoso performances, to encounter here: http://joannenova.com.au/2013/11/monckton-bada/#comment-1342330 an instance in which one needs little more than high-school algebra to recognize that on occasion Lord M. can be intransigently wrong.
It reminded me once again to reserve judgment about things I have not analyzed completely for myself.
Bruce Cobb says:”I believe that Nick Stokes deserves an award for agile and persistent hand-waving around the fact that the warming has stopped for at least 17 years. Well done. It takes a very special amount of diligence and effort to ignore the truth, which has his cohorts in such a panic that they can’t even decide how to respond to it, resorting to amazing feats (and quite amusing) of straw-grasping.”
Ditto. Carry on, Nick! This is entertaining.
It is important for each of us to realize that intelligent people can get an idea in their mind, adopt it, and carry on in the face of disproving evidence and counter-argument.
This is human nature.
“We” (by “we,” I mean DesCartes, Popper and so on, not me specifically) have developed science not because we think scientifically, but because we humans do not think scientifically.
Perfectly rational, enlightened, intelligent, church-going, tax-paying, well-meaning citizens defended slavery for quite a long time.
I am not calling Stokes a supporter of slavery; odds are he or she is against it; just using this well-recognized point of consensus to illustrate how any of us, despite having a college education and use of an intellect, can hold fast to ideas in the face of great contrary evidence. if we can appreciate this, we can appreciate two precious things: one is active, respectful debate, and the other is science itself.
While passing time on a conference call, I took a peek at some of this authors background in climate. Hummm, wait a minute, there is none for Cowtan. A list of papers from the supporting information section from Wiley linked below. Way had only the paper referenced in this post.
http://onlinelibrary.wiley.com/advanced/search/results?searchRowCriteria%5B0%5D.queryString=“Kevin Cowtan”&searchRowCriteria[0].fieldName=author&start=1&resultsPerPage=20
WUWT?
Perhaps I am missing the link between chemistry and geography (which are the fields these two are in) …….. and climate studies and temperature records.
Why did they do this paper and who paid them to do so?
Nick Stokes says:
November 20, 2013 at 2:10 am
But AGW isn’t deduced from the temperature record, so isn’t dependent on rejecting a null hypothesis of zero warming.
=========================
So what your saying is that a failed prediction of AGW (increased warming with increased CO2) cannot falsify AGW because AGW was not deduced from the temperature record.
Nick, that is utter nonsense. That is like saying the Relativity cannot be falsified by time dilation because it was not deduced by time dilation. Nothing could be further from the truth.
Scientific theory takes what is know from observation and from this predicts what is yet unknown. If the prediction fails, then the theory fails. Relativity correctly predicted time dilation in the GPS navigation system. At the time GPS was implemented there was a great deal of disbelief in time dilation. There was large number of time dilation deniers in the scientific community.
So much so, that when GPS was first turned on the correction for time dilation was not enabled. And the system proved inaccurate. When the correction for time dilation was enabled, the accuracy improved considerably.
So, if AGW is correct, then we should see a similar effect in temperature predictions. Temperate predictions should be more accurate with AGW corrections in the climate models than if the AGW corrections are removed. However, that is not the case. Temperature predictions are more accurate if we remove the AGW corrections, which strongly suggests that AGW is a failed theory.
Hyperthermania says:
November 20, 2013 at 1:30 am
Oh, it’s not so bad, I think a prestidigator is magician or forecaster. Perhaps the term fell out of use as gypsies were run out of town.
Lessee, Google says “magic tricks performed as entertainment.”
http://en.wikipedia.org/wiki/Sleight_of_hand says “Sleight of hand, also known as prestidigitation (“quick fingers”) or léger de main, is the set of techniques used by a magician (or card sharp) to manipulate objects such as cards and coins secretly.”
Well, half right, and precisely what Lord Monkton wanted to say, as usual. Perhaps it’s been subsumed by “illusionist.” Oh rats, I forgot to record the David Blaine special last night.
Pronouncing it isn’t too bad, I’ve seen worse words in early 20th century grade school readers. Start with presto – digit – nation and tweak.
In my opinion, the single most important point made in Monckton’s post was this:
“Before long, therefore, another El Niño will arrive, the wind and the thermohaline circulation will carry the warmth around the world, and The Pause – at least for a time – will be over.”
Similarly, pick whichever cycle you want (AMO, PDO, solar, etc.) it will soon enough enter a warm phase, and the pendulum of pointless arguments will swing the other way, with alarmists pointing at the recent temperature record as evidence of catastrophe, and skeptics arguing that the recent movements are merely noise.
So, do yourselves a favour and forget about counting how many years and months “The Pause” can be measured… The long run trend remains the only thing that matters.
(And in the long run, we’re all dead.)
It seems my link is broken that was posted. The path to the same information is on this page.
http://onlinelibrary.wiley.com/doi/10.1002/qj.2297/suppinfo
Prestidigitation is very common – at least to us older folks. It is the word you use to humorously dramaticize supposed magic being performed. it adds more humor, mixed with disdain or scorn, than does “sleight-of-hand.”
Intellectual honesty is essential to true science. Mr. Stokes would earn more respect if he conceded that the discrepancy between what was predicted and what is observed is material, and that, if it persists, the skeptics he so excoriates will have been proven right.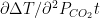 .
.
Well said, actually.
After all, it is nothing more than the truth, and furthermore, a truth that was specifically excised from the AR5 SPM between the leaked draft and the published report. If you look at the CMIP5 model results and the actual GASTA points and squint a bit, you can perhaps convince yourself that the “models have not yet failed” provided that you pretend that the models are somehow independent and identically distributed samples whose mean and variation are meaningful quantities. If you instead look at the model results individually, it is impossible not to conclude that some of them have failed — the models that are predicting 3.3C+ warming/century, for example, that are not well over 0.5C warmer than observations and that do not ever descend to the level of the observations even over many runs with many perturbations of their initial conditions.
But it is difficult to deny the central tenet of science itself — if GASTA does indeed stubbornly refuse to rise, or rises at a rate that is substantially below any of the continuing model predictions, as some point any honest scientist will concede that many — quite possibly all, eventually — of the models have failed.
In between it is a matter of degree. In my opinion, it is perfectly evident that some of the models have failed badly enough to warrant their removal from a Summary for Policy Makers, where the only reason for their inclusion is to politically increase the degree of alarm generated by a figure supposedly showing runaway warming predictions. Continuing to include them in analyses of CMIP5 results that judges whether or not any of these models have yet diverged enough to be safely rejected is perfectly good science (especially if that analysis rejects the ones that should be rejected!)
Including failed models in a figure intended to influence policy is dishonest. Refusing to critically analyze model predictions by comparing them to the actual data that they failed to predict (while weaseling around by calling the predictions “projections” to hedge the substantial risk that those projections turn out to be wrong and to make the model non-falsifiable) is dishonest. Constantly altering the climate record methodology to discover “more warming” to avoid having the model results falsified is blatent confirmation bias at work and dishonest. Using the temperature anomaly without substantial error bars, presented on a scale that exaggerates the variation, and without acknowledging that we don’t actually know the Global Average Surface Temperature itself within a range of rough two whole degrees C (while purporting to know its deviation within a range far less than this) is if not dishonest highly suspect. Calling every single climate observation concerning the present “unprecedented” in spite of the fact that they are in fact precedented repeatedly over any sufficiently long time scale within the resolution of our ability to tell is dishonest. Claiming that we fully understand the physics and that all of the model predictions are physics based (and hence trustworthy) when the models themselves (in spite of presumably being based on the same underlying physics differ by a range of over 2 C in their end-of-century predictions, in spite of the fact that when models are compared head to head on toy problems with none of the complexity of the Earth’s climate system they differ substantially in their outcome is dishonest.
The big question is: Can we model the climate accurately at all yet?
I think that there are very good reasons to think that the answer is “no”. With substantial disagreement between models, and even more substantial disagreement between models and reality, differences in many dimensions and not just GASTA, with GASTA itself constantly being tweaked because (one supposes) we didn’t know it or compute it correctly in the past, it is difficult to gain much confidence in them. It’s not like they are working perfectly, after all.
So the big question for Nick is: Just how long does the pause have to continue for you to reject, or modify, the null hypothesis that the models are accurate predictors of future climate? How are you using the actual data to modify the Bayesian priors of large climate sensitivity in a continuous fashion as reality continues well below the high sensitivity predictions? Is everything static for you, so that the models are right no matter what GASTA has done, or will do, or do you acknowledge that it is reasonable to think that the models are leaving out some important physics or failing to account sufficiently for natural variation as the pause continues?
It’s an important question right now. I have no strong opinion on whether or not a Maunder-type minimum will influence the climate — there is some correlation between solar state and climate state visible in the past but it is not sufficiently compelling to be anything like “certainty”. However, we don’t have any better explanation for the LIA, at least not one that I’m aware of, and solar scientists are saying that there is a good chance that we may be entering a Maunder-type minimum that will extend over 2-4 solar cycles, most of the rest of the century. If there is a causal connection between solar magnetic state and e.g. albedo, tiny variations in albedo can produce profound climate changes and there is some evidence that the mean planetary albedo has been changing and that GHG distributions have been shifting in ways that might be connected with solar state.
I’m of the opinion that we do not, in fact, fully understand all of the physics of the climate yet, and of the further opinion that the computational problem is enormously difficult even with the physics in hand, hence the substantial disagreements between distinct models. Even the best (most computationally intensive and detailed) models may well be inadequate. As Mr. Monckton points out, this isn’t about “denying” that a greenhouse effect exists — it is about reducing a nonlinear dynamical problem with an enormous dimensionality to a single partial derivative double derivative :
I’ll say it clearly. It is absurd to think that this quantity is even approximately a constant over the next 80 years, or that we know its value.
rgb
prestidigitation — i have seen this word used in articles about magic. It is generally considered to be a synonym for magic of all types.
Reading it here i assumed its specific purpose was to arouse thoughts of a particular type of magic in the reader’s mind (there are many types of magic) — that specific type being “hand magic” — magic perform by slight of hand with no props or helpers. Breaking the word down it sorta means — the use of quick fingers. The use of this word by his lordship seems meant to imply that that the authors of the discussed article were performing “paper and pencil magic” on data — hand magic. (I mean they actually measured nothing.)
By “magic”, out of thin air, they were claiming to create new “data”. And it is all “slight of hand”.
So my take on the word “prestidigitation” is that a word that has fallen into use as a general synonym for all magic is actually being taken back to its root meaning — hand magic — slight of hand. That is how you are suppose to read it.
Eugene WR Gallun
ossqss says:
November 20, 2013 at 6:31 am
That’s because they are members of the SkS team, see their request to “Help make our coverage bias paper free and open-access” by taking down the firewall at http://www.skepticalscience.com/open_access_cw2013.html
More background from http://www.skepticalscience.com/team.php :
Kevin C
Kevin is an interdisciplinary computational scientist of 20 years experience, based in the UK, although he has also spent two sabbaticals at San Diego Supercomputer Center. His first degree is in theoretical physics, his doctoral thesis was primarily computational, and he now teaches chemistry undergraduates and biology post-graduates. Most of his reasearch has been focussed on data processing and analysis. He is the author or co-author of a number of highly cited scientific software packages.
His climate investigations are conducted in the limited spare time available to a parent, and are currently focussed in two areas; coverage bias in the instrumental temperature record, and simple response-function climate models. He is also interested in philosophy of science and science communication.
robert way
Robert Way holds a BA in Geography, Minor Geomatics and Spatial Analysis and an M.Sc. in Physical Geography. He is currently a PHD student at the University of Ottawa. His current research focus is on modeling the distribution of permafrost in the eastern Canadian sub-Arctic. Previously his work examined the climatic sensitivity of small mountain glaciers in the Torngat Mountains of northern Labrador. Robert has also studied at Memorial University of Newfoundland and the University of Oslo. He has participated in course and field work in Antarctica, Iceland, Labrador, Norway, Patagonia and Svalbard. As an Inuit descendent from a northern community, he has witnessed first hand how changing ice and snow conditions have impacted traditional hunting and travel routes, making climate change omnipresent in his life.
His graduate student profile can be found at the following url:
http://artsites.uottawa.ca/robert-way/en/background/
Shutting down coal and nuclear plants in the US is already underway (70% of generation in total) and nobody will notice until the lights go out or worse the AC goes off. Like Obamacare, then it will be too late, no healthcare, no power, same thing. You can’t rebuild generation within a year, so people will suffer cause they can not think more than one step ahead. That is precisely what they count on. Lie, destroy, apologize, but it’s all one-way.
I spoke to a friend in Europe once who is very Green and anti Corporations. She favored less electricity. So I put it to her: What do you think of the big banks? Hate ’em. Do you think the big banks in New York will keep the lights on somehow? Probably. How about some small factory owner in upstate or rural New York – how does he pay to keep the lights on, keep his factory running? Uhhhh, may not be able. So the world you’re creating is Big Banks in NYC with enough electricity to send out foreclosure notices to small companies, who are then bought out or replaced by big Corporations.
That’s the game.
Nick Stokes says:
November 20, 2013 at 2:55 am
But a model does not use as input any temperature record.
=============
That is a false statement. The models are backcast to the historical temperature record, and the parametric assumptions about aerosols and other factors are adjusted to improve the fit. This process happens by genetic selection – those parameters that do not fit well are not published – they are eliminated from further consideration.
So while the temperatures are not directly fed into the models, they are part of the decision making process of the model builders, in the setting of parameters. As such, temperatures are one of the inputs to the climate models.
The problem for model builders is that they continue to pretend that their models are solving for temperature. They are not. The model building process is solving for those combination of parameters that best meet the expectations of the model builders.
In other words the model do not show us the future, they show us what the model builders believe the future will look like. In this fashion the models are no different than the oracle of Delphi in the past, or modern day fortune tellers. People pay money to hear what they want to believe.
Nick Stokes says:
November 20, 2013 at 2:50 am
“AGW predicted that temperatures would rise, and they did. You can’t do better than that, whether or not the rise is “statistically significant”.
LOL, Much ado about nothing. Nick, the theory is CAGW, otherwise it is all academic. The “C” is missing in CAGW. Actually the C, the G and the W are all MIA, or at the bottom of the ocean, or hidden in the coolest summer on record in the artic, or….
The more they dig, the deeper the hole gets.
Nick Stokes said
“AGW has been around since 1896. Arrhenius then deduced that CO2 would impede the loss of heat through IR, and would cause temperatures to rise. There was no observed warming then. AGW is a consequence of what we know about the radiative properties of gases.
AGW predicted that temperatures would rise, and they did. You can’t do better than that, whether or not the rise is “statistically significant”.
Nick is referring to AGW theory, not AGW.
The deduction of AGW signal is made by argument from ignorance; “We don’t know what else could have caused it”.
I’m a big fan of Lord Monckton. I admire and appreciate the efforts he makes and courage he demonstrates in opposing global warming extremists. It is therefore with a certain nontrivial amount of unhappiness that I say I’d think twice about the argument here.
Lord Monckton says,
Is that what they were claiming. I haven’t read the paywalled paper. However, publicly available here:
http://www-users.york.ac.uk/~kdc3/papers/coverage2013/background.html
is a background containing the following statement:
It is possible, perhaps likely, that I am simply naive. At Climate Audit (http://climateaudit.org/2013/11/18/cotwan-and-way-2013/) I read this:
which is not the sort of forum I’d expect objective scientists to participate in, nor the sort of PR strategizing I’d expect objective scientists to indulge in. This is a red flag in my heuristics. Still, this is not enough by itself for me in my ignorant inexperience to impugn Way’s motives.
I could certainly be wrong, it wouldn’t be the first or even the thousandth time. But my conscience requires me to suggest that Cowtan & Way’s work deserves a little more careful scrutiny before it is dismissed.
Maybe your misunderstanding lies with the EM energy which is radiated back and forth? Getting a ‘handle’ on EM (Electro-Magnetic) phenom is not for the faint of heart nor those who ‘feint’ on the subject either …
??? Can this be explained differently? On the ‘surface’ (without further elucidation) this would appear incorrect … (What does vectorial addition of propagated EM energy ‘waves’ have to do with IR emission from CO2 et al?)
.
The Emperor “CAGW” a Hansen – Mann strode onto the parade to pan a tricked invisible costly cloak, so fine and regal his staff a crooked stick, carved from rare Yamal tree, but held upside down in trickery. A child declared he hasn’t got any clothes at all to see, he ducked an weaved and Curds and Way wove a new and finer cloak, Cooked up and tricked for all to see, but now the child’s all seeing eye saw right through the trick and lies, he’s still naked Lord for all to see and the laughter Stokes to a high degree, time to leave CAG(w) as our sides ache, and your naked lies are full of fake!!
Nick Stokes says:
November 20, 2013 at 2:50 am
AGW predicted that temperatures would rise, and they did. You can’t do better than that, whether or not the rise is “statistically significant”.
======================
AGW predicted temperatures would continue to rise, which they did not. So of course you can do better.
In contrast to AGW there were many climate predictions in the past that said that climate moved in natural cycles of warming and cooling. And that the cooling trend of the 50’s and 60’s would be followed naturally by a warming trend in the 80’s and 90’s.
Which is what we saw. These same predictions of natural climate cycles said that this late 20th century warming would end in the next century, which it did.
So yes, one can do a whole lot better that the failed AGW predictions of continued warming. There were many climate scientists that predicted cycles of warming and cooling, before Hansen and Gore made their (now falsified) predictions of continued warming due to CO2.
The problem is that Gore and Hansen used politics to divert large sums of money slated for manned space exploration into climate science, and the results are evident. When the US wants to send someone into space, they have to hire the Russians. The Russians! But we know the temperature of the earth to 1/1000 of a degree, plus or minus 2 degrees.
Completely unsubstantiated at the “70%” value “of generation in total” cited; closing 70% of total generation would be catastrophic come the warm weather of spring …
.
I will see your “differential temperatures” factor and raise you with a “divergent jet” overhead (in an affected area) … often we get HUGE swings in the nature of airmasses out here are the ‘great plains’ with LITTLE in the way of precip even …
Way off course? Yes.
Par for the course? Yes.
Change course? No.
Of course.
Damn the iceburgs,full speed ahead!
‘Grunt work’; veritable cannon fodder backing the Maginot Line constructed by CAGW forces …
.
Nick Stokes’ selective swinging between convenient intellectual malleability and blind rigidity is a lesson in contradiction and immense hypocrisy.
One has to wonder why Mann, Schmidt, Hansen, Trenberth etc have not tried to play Nick’s new sleight of hand.
Stokes says,
“But AGW isn’t deduced from the temperature record,”
&
“The period of “no statistically significant increase” is a meaningless statistical test”.
Well then AGW is not supported by any actual temperature records and the previous period of 1979 to 1998 claimed warming is also a meaningless statistical test.
But Nick has set up a new temperatures don;t matter default going forward, forever, or at least till we are all dead.
By his new decree it will not matter how much longer the period of non warming grows beyond the previous period of warming. We can have 30, 40 50 or 60 years of no warming without AGW being discredited because AGW is not deduced from temperature records.
I presume Nick also believes ocean acidification is not deduced from alkalinity records?
Species extinction threats are not deduced from population records?
And so on?
Why all the costly measuring and monitoring of all things?
Monckton: “Mr. Stokes, in trying to suggest that the debate between skeptics and extremists centers on whether or not there is a greenhouse effect, is being disingenuous. ”
Define: greenhouse effect. As the AGW sophists like to use one of two incompatible notions as best serve their purposes. In the one case they mean ‘greenhouse effect’ to be that ‘atoms absorb and emit radiation in selective frequencies.’ Which isn’t a ‘greenhouse effect’ at all, by why green leaves are green, red sports cars are red, and whitewash is white. Which is the go-to position to argue against skeptics of the other case. But they cannot state that it is why things have color, as no one would attach hysterical moral dimensions to quantum physics otherwise.
In the another case, it is the idea that CO2 is the sole, sufficient cause for the Earth’s temperature being other than what a black body would be. And it is necessarily about a sole, sufficient cause as we cannot assign blame and hysterical moral dimensions to the quantum physics otherwise. It is this issue they deeply desire but cannot permit. For if we accept it, then known, uncontested, and replicated data acquisition refutes it. Which is not simply wrong, or that the hysterical moral dimensions are a slippery slope fallacy, but a counterfactual slippery slope fallacy.
In the other case, it is the idea that CO2 is not the sole, sufficient cause; but that there is a correlation. And while it is not a sole, sufficient cause they wish to treat it as one. Which is little more than accepting the last case out one side of their neck, and refuting it out the other side. This is, more often than not, the position professed by AGW sophists as an introductory premise. That we should be hysterical about CO2, precisely because there is no reason to be concerned.
In the last of these cases, it is the idea that CO2 is a necessary cause of the temperature being different. But then CO2 isn’t a quanta of black body unobtanium, but a completely normal bit of ‘star stuff,’ as Carl Sagan would have had it. But of course it is necessarily different from a black body, for it is not a black body.
These all cannot go together in one notion, or we would be hearing constantly about CO2 being the necessarily sole insufficient reason for why Ferrari’s are famously red. And no one could object to that at all, for necessarily CO2 has no causal relation to automotive colors. But this is fertile ground for the AGW sophist. For they wish never to state any manner of causal relationship, as to do so makes a claim that can be tested. Perhaps, falsified.
Robert Brown says:
November 20, 2013 at 6:46 am
well put
I see you’ve resorted to being pedantic. on an absolute scale against GAST on an absolute scale. It is why no one ever presents the full climate record of the Holocene with sufficient error bars in both directions, to correctly account for proxy uncertainty and errors in projecting what is inevitably a tiny sampling of the globe to a temperature anomaly on the whole thing in any given timeslice and the fact that time resolution of the time slices goes from as fast as hourly in the modern era to averaging over centuries per observation in proxy samples representing the remote past. We can, perhaps, speak of monthly anomaly peaks and troughs over the last 30 years with similar resolution, but there is no possible way to assert some particular value, reliably, for monthly anomalies in 1870. The error bars in the latter are so large that the numbers are meaningless. It isn’t even clear that the modern numbers on a monthly scale are meaningfull. The system has a lot of natural noise, and then there are the systematic measurement errors.
If you want to disprove something statistically, you have to adopt the null hypothesis that it is true, and then show that that has to be rejected.
Sorry but if I were being pedantic I would have to correct you here; you don’t have to adopt anything, the null hypothesis is the default position. That default position is either accepted or rejected after experimentation via statistical inference (as stated). The converse must therefore also be true (relating to the hypothesis or alternative hypothesis).
To be picky about this, you are both right, but you both need to define the hypothesis in question:
http://en.wikipedia.org/wiki/Null_hypothesis
Nick is precisely correct in that one can state a hypothesis — “AGW is true” or (in my own work) “The RAN3 random number generator generates perfectly random numbers”. This then becomes the null hypothesis — the thing you wish to disprove by comparing its predictions with the data.
In the case of the random number generator a test is simple. Generate some statistic with a known distribution from a series of supposedly perfectly random values produced by the generator in question. Compute the probability of getting the empirical result for the statistic given the assumption of perfect randomness. If that probability — the “p-value” — is very low, reject the null hypothesis. You have grounds for believing that RAN3 is not a perfect random number generator (and, in fact, this generator fails certain tests in exactly this way!)
In the case of AGW, each model in CMIP5 constitutes a separate null hypothesis — note well separate. We should then — one at a time, for each model — compare the distribution of model predictions (given small perturbations in initial conditions to allow for the phase space distribution of possible future climates from any initial condition in a chaotic nonlinear system) and compare them to actual measurements, and compute the fraction of those climate trajectories that “encompass” the observation and/or are in “good agreement” with the observation. This process is somewhat complicated by the fact that both the prediction and the observation have “empirical” uncertainties. Still, the idea is the same — models that produce few trajectories in good agreement with the actual observation are in some concrete sense less likely to be correct in a way that must eventually converge to certainty as more data is accumulated (lowering the uncertainty in the data being compared) or the divergence in prediction and observation widens.
This is only one possible way to test hypotheses — Jaynes in his book Probability Theory, the Logic of Science suggests another, Bayesian approach, which is to begin with a hypothesis (based on a number of assumptions that are themselves not certain, the Bayesian priors). One then computes the posterior distribution (the predictions of the theory) and as new data comes in, uses the posterior distribution and Bayes’ formula to transform the posterior distribution into new priors. In Bayesian reasoning, one doesn’t necessarily reject the null hypothesis, one dynamically modifies it on the basis of new data so that the posterior predictions remain in good agreement with the data. Bayesian statistics describes learning and fits perfectly with (indeed, can be derived from) computational information theory. If one applied Bayesian reasoning to a GCM that gave poor results when its posterior prediction was compared to reality, one would modify its internal parameters (the priors) until the posterior prediction was in better agreement.
This isn’t a sufficient description of the process, because one can weight the hypothesis itself with a degree of belief in the various priors, making some of them much more immune to shift (because of separate observations, for example). There are some lovely examples of this kind of trade-off reasoning in physics — introducing a prior assumption of dark matter/energy (but keeping the same old theory of Newtonian or Einsteinian gravitation) versus modifying the prior assumption of Newtonian gravitation in order to maintain good agreement between certain cosmological observations and a theory of long range forces between massive objects. People favor dark matter because the observations of (nearly) Newtonian gravitation have a huge body of independent support, making that prior relatively immune to change on the basis of new data. But in truth either one — or an as-yet unstated prior assumption — could turn out to be supported by still more observational data, especially from still more distinct kinds of observations and experiments.
Although there exist some technical objections to the application of the Cox axioms to derive Bayesian statistics in cases where probabilities are non-differentiable, the Cox/Jaynes’ general approach to probability theory as the basis for how we accrue knowledge is almost certainly well-justified as “knowledge” in the human brain is in some sense differentiable, degree of belief of propositions concerning the real world is — after factoring in all the Bayesian priors for those propositions — inevitably not sharply discrete. In the case of climate science, one would interpret the failure of the posterior predictions of climate models as sufficient reason to change the model assumptions and parameters to get better agreement, retaining aspects of the model that we have a very strong degree of belief in in favor of those that we cannot so strongly support by means of secondary evidence, to smoothly avoid the failure of a hypothesis test based on faulty priors.
Yet, you are correct as well. One can always formulate as a null hypothesis “the climate is not changing due to Anthropogenic causes”, for example, and seek to falsify that using the data (not alternative models such as GCMs). This sort of hypothesis is very difficult to falsify, as one is essentially looking for variations in the climate that are correlated with anthropogenic data and that did not occur when the anthropogenic data had very different values. Humans very often use this, the assumption that their current state of belief about the world is “normal”, as their null hypothesis. Hence we assume that a coin flip is an unbiased 50-50 when we encounter a new coin rather than a biased 100-0 tails to heads, even though we are aware that one can construct two-headed coins as easily as coins with one head and one tail, or coins that have a weighting and construction that biases them strongly towards heads even though they have two sides.
This is why the term “unprecedented” is arguably the most abused term in climate science. It is inevitably used as pure argumentation, not science, trying to convince the listener to abandon the null hypothesis of nothing to see here, variation within the realm of normal behavior. It is why climate scientists almost without exception make changes in methodology or in the process that selects observations for inclusion to exaggerate warming trends, never reduce them. It is why Mann’s hockey stick was so very popular in the comparatively brief period before it was torn to shreds by better statisticians and better science. It is why no one ever includes the error bars in presentations of e.g. GASTA, and why GASTA is always presented, never the actual GAST. It is why no one ever presents
In actual fact, little of the modern climate record is unprecedented. It has been as warm or warmer (absolute temperature or anomaly, take your pick) in the past without ACO_2, on any sort of 1000 to 3000 year time scale, and much warmer on time scales longer than that stretching back to e.g. the Holocene optimum or the previous interglacials. There is no perceptible change in the pattern of warming over the last 160 years of thermometric records (e.g. HADCRUT4) that can be confidently attributed to increased CO_2 by means of correlation alone. The rate of warming in the first half of the 20th century is almost identical to the rate of warming in the second half, so that is hardly unprecedented, yet the warming in the first half cannot be reasonably attributed to increases in CO_2. The periods of neutral to cooling in the last 160 years of data are not unprecedented (again, they are nearly identical and appear to be similarly “periodically” timed) and in both cases are difficult to reconcile with models that make CO_2 the dominant factor in determining GASTA over all forms of natural variation.
Indeed, the null hypothesis of warming continuing from the LIA due to reasons that we understand no better than we understand the cause of the LIA in the first place simply cannot be rejected on the basis of the data. While warming in the second half of the data could be due to increased CO_2 and the warming in the first half could be due to other causes, until one can specify precisely what those other causes are and quantitatively predict the LIA and subsequent warming, we won’t have a quantitative basis for rejection. It is not the case that mere correlation — the world getting warmer as CO_2 concentrations increase — are causality, and nothing at all here is unprecedented in any meaningful sense of the term.
I won’t address the issue of null hypothesis and alternate hypothesis, as things start to get very complicated there (as there may be more than one alternate hypothesis, and evidence for things may be overlapping. For example, there is a continuum of hypotheses for CO_2-linked AGW, one for each value of climate sensitivity treated as a collective parameter for simplicity’s sake. It isn’t a matter of “climate sensitivity is zero” vs “climate sensitivity is 2.3C”, it is “climate sensitivity is anywhere from slightly negative to largely positive”, and the data (as we accumulate it) will eventually narrow that range to some definite value. Bayesian reasoning can cope with this; naive hypothesis testing has a harder time of it. According to Bayes, climate sensitivity, to the extent that it is a Bayesian prior not well-established by experiment and different in nearly every climate model should be in free-fall with every year without warming pulling its most probable value further down. And to some extent, that is actually happening in climate science, although “reluctantly”, reflecting a too-great weight given to high sensitivity for political, not scientific, reasons from the beginning of this whole debate.
rgb
Nick Stokes says:
November 20, 2013 at 2:50 am
TLM says: November 20, 2013 at 2:27 am
“Now please enlighten me how you measure “warming” without measuring the temperature?”
AGW has been around since 1896. Arrhenius then deduced that CO2 would impede the loss of heat through IR, and would cause temperatures to rise. There was no observed warming then. AGW is a consequence of what we know about the radiative properties of gases.
AGW predicted that temperatures would rise, and they did. You can’t do better than that, whether or not the rise is “statistically significant”.
—————————–
Temperatures have gone up & down. They were already rising in 1896, as indeed had been the temperature trend since c. 1696, ie the depths of the LIA. (The longer term trend since c. 2296 BC however remains down.) The warming trend in the 1920s to ’40s reversed to cooling in the 1940s to late ’70s, then reversed again back to warming c. 1977. It appears to be in the process of returning to cooling.
So you could in fact do much better than what has actually happened since 1896. If CACA were valid, ie 90% of observed warming in this century supposedly caused by human-released GHGs, then temperature would have gone up in lock step with CO2, but it hasn’t. Human activities may have some measurable effect, but natural fluctuations still rule.
Russ R. says:
November 20, 2013 at 6:38 am
The long run trend remains the only thing that matters.
Which one? Remember, the ‘Larmists like to only blame warming after 1950 on man, since most of the increase in CO2 occurred after that. Therein lies their big problem; how to explain the 17-year stop in warming now, with CO2 levels at their highest levels and continually increasing. The real reason is simple; CO2 wasn’t driving temperatures up in the first place. But “Larmies are if nothing else, slow learners.
rgbatduke says:
November 20, 2013 at 9:15 am
I know Ive written this before but…
jeez are your students lucky.
Jim says: November 20, 2013 at 7:23 am
Silver ralph says November 20, 2013 at 6:00 am
I will see your “differential temperatures” factor and raise you with a “divergent jet” overhead (in an affected area) … often we get HUGE swings in the nature of airmasses out here are the ‘great plains’ with LITTLE in the way of precip even …
___________________________________
Perhaps no precipitation where you are, but somewhere else…….?
A warm and a cold airmass residing side by side causes massive pressure differentials at high altitude. Those pressure differences cause the high altitude jetstreams, and the Earth’s spin will quickly have them moving in an easterly direction. And it is the jetstreams, and their massive movements of air, that drive the surface pressure differences that produce surface cyclonic conditions.
Thus no temperature differentials = no jetstreams = no cyclones. So a uniformly warm planet will produce …. not a lot really (in terms of weather). (And a waving jet stream produces the most active weather.)
rgbatduke: “This isn’t a sufficient description of the process, because one can weight the hypothesis itself with a degree of belief in the various priors, making some of them much more immune to shift ”
I’ve weighted the prior belief in Bayesian testing, such that I can categorically state it’s absurd. And being asymptotically derived it wholly free of modifications of belief until every other source of probability becomes, to a one uniformly, absurd with respect to measurements. Then and only then must I reject the whole tapestry. And on the next use my ‘principle of sufficient bias’ restates that Bayesian hypothesis testing is absurd.
There are a lot of interesting things to say about Bayesian notions. Not the least of which is that ridiculously simple networks of neurons can be constructed as a Bayesian consideration. And, indeed, there are good reasons to state that it is a primary mode of statistically based learning in humans. Which, if you consider at all, is exactly where we get confirmation bias from. When something is wholly and demonstrably false, but we have prior and strongly held beliefs, *nothing changes* despite that the new information shows that the previous information is wholly and completely absurd.
But of another note, the ability to smoothly avoid falsification that you mention with regards to AGW, is precisely the use of weighted priors in a Bayesian scheme. That is, they are doing exactly what Bayes would have of them if they are stating anything other than a ‘principle of insufficient reason’ for anything not already and independently established. Bayes is not simply belief formation and learning, it is belief retention and absurdity as well.
The problem here is a rather old and basic one. Until you’ve proved your premises: Nothing follows.
Yet another breathtaking post from Professor Brown, whose contributions are like drinking champagne to the sound of trumpets. His profound knowledge, always elegantly expressed, is a delight. His outline of the purpose, methods and value of Bayesian probability is one of the clearest I have seen. And the economy with which he points out the fundamental statistical inadequacies in the case for worring about CO2 is valuable. A few more like him and scientists would once again be treated with respect and admiration.
Mr. Bofill queries my conclusion that the Cowtan and Way paper does not establish to 95% confidence that the Pause has not happened, on the unusual basis that the authors themselves allowed the possibility that that conclusion was true. However, I was careful not to say that they had themselves allowed for the possibility that there has been a Pause:, I said that on the basis of their work WE could not do so.
Their paper concluded that the terrestrial datasets exhibit a cooling bias in recent decades and that, therefore, the Pause might not have happened. That is what has been published in too many places, and the authors have not demurred.
I had hoped I had demonstrated that no such conclusion that which they had drawn could legitimately be drawn from the patchwork of techniques they deployed. The fundamental mistake they made, which the reviewers should not in my submission have allowed, was to assume that their techniques constrained, rather than widening, the uncertainties in the surface temperature record.
Another commenter asserts, as trolls and climate extremists so often do, that in an unrelated discussion on a different blog on the other side of the world I had persisted in asserting something that anyone with elementary algebra ought to have accepted was incorrect. However, as so often, the troll in question did not specify what point he thought I had misunderstood. This is a particularly furtive instance of the ignoratio elenchi fallacy in two of its shoddy sub-species: ad hominem and irrelevancy to the matter at hand. If the troll would like to instruct me on a point that has little or nothing to do with this thread, let him not pollute this thread by fabricating a smear: let him write to me and say what it is he challenges and why.
Finally, there has been some discussion in this thread about my use of the word “prestidigitation”. I use it in its original meaning, sleight of hand, and in its metonymic derivative, trickery, with an implication of less than honest dealing.
OssQss says:
November 20, 2013 at 4:29 am
So,,,,,, who are these individuals that have written this paper?
What is their history in climate science?
What else have they written? …
Here’s a brief answer to some of your questions:
“Dr Kevin Cowtan is a computational scientist at the University of York, and Robert Way is a cryosphere specialist and PhD student at the University of Ottawa. … Dr Cowtan, whose speciality is crystallography, carried out the research in his spare time. This is his first climate paper.”
With respect, Nick Stokes and others have inverted null hypothesis and hypothesis to be tested in order to favor the AGW, especially the CAGW, view.
From Wikipedia: http://en.wikipedia.org/wiki/Null_hypothesis
Please note: refers to a general or default position: that there is no relationship between two measured phenomena With respect to AGW this means no relationship between anthropogenic carbon dioxide increase and global warming.
In science, logic and calculations prove nothing; they only show consistency with assumptions. The same is true of models which are nothing but complicated logic and calculation. In science the only things which provisionally prove anything are experiments and observations of the actual phenomena.
We are in the Holocene interglacial, a period of warm climate between glacials. There have been several previous interglacials. Whatever caused the other interglacials to warm probably caused the Holocene interglacial to warm. Natural warming is thus the null (default) hypothesis. It is totally intellectual dishonest to claim ones newly invented preferred hypothesis is the null (default) hypothesis. AGW is what is being tested against the null (default) hypothesis of natural interglacial warming.
If it takes thirty years to define climate, then thirty years of warming proportional, as defined by the models, to anthropogenic carbon dioxide increase over previous levels, and outside the warming limits defined by Holocene and earlier interglacials is required to provisionally prove AGW, or at least highly statistically significant proportional warming outside the previously established norms for over fifteen years.
The next step is to prove it will be catastrophic or at least dire enough to support prevention rather than adaptation.
The entire CAGW community seems to me to have done this intellectually dishonest inversion of null hypothesis from the beginning, thus requiring skeptics to prove the actual null (default) hypothesis.
Nick – The problem with using Arrhenius in a pro-AGW discussion is, even he changed his mind regarding the amount of heating CO2 could be responsible for.
Lord Monckton,
I haven’t been following the hype or the authors handling of it, but I suspected this might be the case. Ok, as I noted, my position may be naive.
You are quite correct that my criticism entirely misses the thrust of your argument. 🙂 Thank you for pointing that out, I was indeed sidetracked on a minor detail, and thanks so much for your response sir.
_Jim 7.09 am.
The Conservation of Energy Law between kinetic energy change and EM radiative flux is:
qdot = -Div Fv where qdot is the monochromatic heat generation rate of matter per unit volume and Fv is the monochromatic radiation flux density. Integrate this over all wavelengths and the physical dimensions of the matter under consideration and you get the difference between two S-B equations.
This gives the vector sum of the two radiation fields. You can easily prove that Climate Alchemy’s version at the surface, add as scalars net radiation flux not convected away to ‘back radiation’, increases local energy generation rate by 333 W/m^2, or twice the 160 W/m^ from the Sun.
The models then assume that Kirchhoff’s Law of Radiation applied to ToA offsets about half of this extra flux, leaving Ramanathan’s ‘Clear Sky Atmospheric Greenhouse factor 157.5 W/m^2. This is just less than 6.85x reality 23W/m^2) and heats up the hypothetical seas, more evaporation; this is the phoney 3x feedback.
It’s phoney because 1981_Hansen_etal.pdf falsely claimed the GHE is the (lapse rate) difference of temperature between the Earth’s surface at a mean +15 deg C and the -18 deg C ‘zone in the upper atmosphere’ in radiative equilibrium at 238.5 W/m^2.
Two problems here: firstly there is no -18 deg C zone, it’s the flux weighted average of -1.5 deg C H2O band emission (2.6 km where T and pH2O are falling fast, so it’s that spectral temperature), the -50 deg C 15 micron CO2 band and the 15 deg C atmospheric window IR; secondly, the real GHE is the temperature difference if you take out the water and CO2 so no clouds or ice, 341 W/m^2 radiative equilibrium for which surface temperature in radiative equilibrium would be 4-5 deg C, a GHE of ~11 K. The ration 33/11 = 3 is the phoney positive feedback.
To offset the extra atmospheric heating in the models, they are hindcast using about twice real low level cloud optical depth. This is a perpetual motion machine of the 2nd kind, the lower atmosphere using its own heat to cause itself to expand. No professional engineer, and I am one who has measured and modelled coupled convection and radiation many times, and made processes actually work can accept this juvenile nonsense.
It’s time this farrago was ended.
Nick – The problem with using Arrhenius in a pro-AGW discussion is, even he changed his mind regarding the amount of heating CO2 could be responsible for.
No, the problem with using Arrhenius in any discussion of climate is that it is 2013 and we’ve done a few things in physics since 1906. Like invent quantum field theory and electrodynamics. Ditto Fourier. I’m just sayin’…
The modern theory of atmospheric radiation owes almost nothing to Arrhenius or Fourier, almost everything to statistical mechanics, thermodynamics in general, and things such as the Planck distribution and quantum radiation processes that Arrhenius had at best a dim grasp of. Postulating that absorptive gases interpolated between a warm surface and a cold surface will have a warming effect on the warm surface — that’s simple first law energy balance for almost any radiative model of the interpolated gas. So the idea of the GHE can be attributed to him. However, there is nothing remotely useful in his quantitative speculations given that he was completely ignorant of all of the details of the thermal radiative process, and mostly ignorant of the full spectral details of the atmosphere, its internal thermodynamics/statistical mechanics, the details of the DALR that is currently held to be an important aspect of the process, and so on.
I’m not sure what the point of any of this discussion is. Correlation is not causality. A simple one-slab model is not the GHE, especially when it isn’t even parametrically sophisticated. The climate is described by a coupled set of Navier-Stokes equations with nonlinear, complex couplings (including both radiation and substantial latent heat transport) and numerous persistent features we cannot predict, arguably cannot accurately or consistently compute at all, and do not understand, insofar as attempts to compute their solution do not agree with one another or the observed climate. Outside of this, everything is mere speculation.
rgb
Nick Stokes says:
November 20, 2013 at 2:55 am
robinedwards36 says: November 20, 2013 at 2:39 am
“So, what role do the temperature records actually play in model simulation? Nick’s answer seems to be “None”.”
Yes, that’s essentially true. GCM’s solve the Navier-Stokes equations, with transport of materials and energy, and of course radiation calculations. A GCM requires as input a set of forcings, which depend on scenario. GISS forcings are often cited. But a model does not use as input any temperature record.
———————————————————
Baloney. They use the temperature records to “train” the simulators. This is the only reason that the models track the temperatures in considerable detail up until the end of the training period. Later model editions reset the starting point of projections. That is the only reason that their discrepancies with real world data do not show up as glaring. Anyone want to guess what the results would be if they truncated their training period in, say, 1970?
Robert Brown says: November 20, 2013 at 6:46 am
“So the big question for Nick is: Just how long does the pause have to continue for you to reject, or modify, the null hypothesis that the models are accurate predictors of future climate?”
Well, you’ve made my point, and put the null hypothesis the right way around. You can test whether the models predictions, taken as null, should be rejected. That’s what Lucia has been doing. I don’t think she has succeeded yet, but it’s the way to go.
But you’ve put in this framing “how long does the pause have to continue”. That’s irrelevant to the test, and in important ways. A period of inadequate rise could invalidate the models. A period of decline would do so faster. You test the discrepancy, not zero slope.
Isn’t the Gap actually even worse than the 0.22 C number? As I understand it, the range of model predictions includes models with a range of different assumptions about how much CO2 would rise. Since we now have actual data on how much CO2 has risen since 2005, the only models whose predictions are relevant in a comparison with the actual data are those whose assumptions matched the actual CO2 rise. The average temperature rise predicted by those models will be *larger* than 0.2 C, meaning the true Gap between the relevant models and the actual data is larger than 0.22 C, correct?
Monckton of Brenchley: “[T]he troll in question did not specify what point he thought I had misunderstood..”
Lord M. is correct; I did not in this thread specify what I (“the troll in question”) thought he had misunderstood. In an attempt to return his attention–with as little distraction as possible from this thread–to a subject about which he should be tightening up his game, I instead provided a link to a blog comment in which he gave an inapposite response to three different commenters who had separately attempted to disabuse him of the same misapprehension: that the residence time of 14CO2 after the bomb tests can inform us much about how the CO2-concentration increase caused by a temporary emissions-rate bulge would take to dissipate.
I would be happy to discuss it separately if he would specify the venue. (Clicking on this name above only sent me to wnd.com.) Realistically, though, I think that my goal–which is to help him make his presentations more bullet-proof–would best be served in a forum in which others could show him that they, too, think he should reconsider his position. (Or maybe I’ll be educated instead.) Joanne Nova’s blog, where he prematurely broke off the discussion, would seen appropriate–particularly since, if memory serves, Dr. Evans has made (what several of us believe is) the same mistake.
Monckton of Brenchley: “Another commenter asserts . . . that I had persisted in asserting something that anyone with elementary algebra ought to have accepted was incorrect.” Actually, I don’t think that “anyone with elementary algebra” ought to have accepted it, at least without some reflection. I merely meant that it was the type of thing that doesn’t require a lot of background to appreciate; that’s not the same as saying it should be immediately apparent; it certainly wasn’t to me. (And, strictly speaking, a couple of differential equations would actually be involved; it’s just that the salient part is simply algebra.)
Monckton of Brenchley says: November 20, 2013 at 5:37 am
“For instance, it is one of the inputs that they use in their attempts to quantify the water vapor and other temperature feedbacks.”
GCMs don’t use either feedbacks or climate sensitivity. It’s not part of the way they work. You can try to deduce feedback from GCM results.
“Arrhenius, whom Mr. Stokes cites with approval, did indeed change his mind about the central question in the climate debate”
Well, as you say later, he revised his estimate of sensitivity. That’s hardly a complete change of mind.
“Mr. Stokes would earn more respect if he conceded that the discrepancy between what was predicted and what is observed is material”
The discrepancy is material, and is what should be tested. The appropriate test is whether the observations are an improbable outcome given the model. That would invalidate the model. But you keep talking about whether the observed trend is significantly different from zero. Statistical testing could affirm that is true, as it is for recent long periods, but I don’t think that’s what you want. Failing to show that it could not be zero doesn’t prove anything.
Finally, there has been some discussion in this thread about my use of the word “prestidigitation”. I use it in its original meaning, sleight of hand, and in its metonymic derivative, trickery, with an implication of less than honest dealing.
The modern use of the word “prestidigitation” is a polite way of calling someone a liar.
prestidigitation = deception.
Sleight of hand. Feel better now? Great word. Similar to prevarication, sleight of tongue.
oops, forgot to blockquote.
The modern use of the word “prestidigitation” is a polite way of calling someone a liar.
prestidigitation = deception.
rgbatduke says:
November 20, 2013 at 10:38 am
“I’m not sure what the point of any of this discussion is. Correlation is not causality. A simple one-slab model is not the GHE, especially when it isn’t even parametrically sophisticated. The climate is described by a coupled set of Navier-Stokes equations with nonlinear, complex couplings (including both radiation and substantial latent heat transport) and numerous persistent features we cannot predict, arguably cannot accurately or consistently compute at all, and do not understand, insofar as attempts to compute their solution do not agree with one another or the observed climate. Outside of this, everything is mere speculation.”
pearls before swine.
the analysis is, however succinct and spot on.
youve been active posting today. thanks.
Jim Rose says: November 20, 2013 at 5:51 am
“@Nick Stokes
Serious question for information. Do the GCMs have any adjustable parameters? If so are these parameters fit to the prior history? By contrast, are the GCMs first principle models with well established inputs from known physical measurements?”
bones says: November 20, 2013 at 11:12 am
“Baloney. They use the temperature records to “train” the simulators. This is the only reason that the models track the temperatures in considerable detail up until the end of the training period.”
GCMs are first principle models working from forcings. However, they have empirical models for things like clouds, updrafts etc which the basic grid-based fluid mechanics can’t do properly. The parameters are established by observation. I very much doubt that they fit to the temperature record; that would be very indirect. Cloud models are fit to cloud observations etc.
The reason that models do quite well with backcasting is that they use known forcings, including volcanoes etc.
Of course people compare their results with observation (not just temperature), and if they are failing, try to do better, as they should. But that’s different to ‘use the temperature records to “train” the simulators’.
Steve Oregon says: November 20, 2013 at 8:42 am
“I presume Nick also believes ocean acidification is not deduced from alkalinity records?”
Yes. The reason that ocean acidification is expected is that CO2 in the air has increased, and we know the chemistry (there’s a calculator here). Observations may provide confirmation. If they turn out to be noisy, or hard to get, that doesn’t invalidate the expectation.
“But you’ve put in this framing “how long does the pause have to continue”. That’s irrelevant to the test, and in important ways. A period of inadequate rise could invalidate the models. A period of decline would do so faster. You test the discrepancy, not zero slope.” — Stokes
For the first installment on Dancing with Sophists: Note here that Mr. Stokes has not stated that the pause is a zero slope, or that a zero slope is not an ‘inadequate rise.’ Specifically he has introduced self-contradictory red herrings for people to chase, such as: “Are you claiming that some cooling is an inadequate rise?”
As Stokes has answered a question by not answering, he his hoping that the less cautious interlopers will complete his Red Herring for him by taking the discourse on a tangent. This is the sort of misdirection used by stage magicians, where they hope to distract the audience with production values and the choreography of their assistants.
@Stokes: So we’re all still curious — how long was it then?
rgbatduke says: November 20, 2013 at 10:38 am
“No, the problem with using Arrhenius in any discussion of climate is that it is 2013 and we’ve done a few things in physics since 1906.”
I used Arrhenius to show that theories of global warming are not deduced from the temperature record. In his day, there was no reliable global record available.
” The parameters are established by observation.” — Stokes in reponse to a question about adjustable parameters.
@jim Rose: As their are a plethora of IPCC models, each with wide disagreement on the parameters, then yes. De facto they are tuned. Given the wide disagreements it would be impossible for them to stay close in relation to each other unless they were not. But, of course, the temperature readings themselves are adjustable parameters as the choice of interpolation and infilling to produce data that does not exist is — by definition — a tunable parameter.
Known forcings? Yuk-yuk. The post-facto fitting of values to said “forcings” reduces them to arbitrary unknown inputs, an ensemble of WAGs. Calling them SWAGs would be too kind.
rgbatduke says: November 20, 2013 at 9:15 am
“In the case of AGW, each model in CMIP5 constitutes a separate null hypothesis — note well separate. We should then — one at a time, for each model — compare the distribution of model predictions…”
I disagree. Earth and models both are systems of chaotic weather, for which after a period of time a climate can be discerned. The timing of GCM weather events is not informed by any observations of the timing of Earth events; they are initialized going way back and generate synthetic weather independently. This is true of medium term events like ENSO; if the Earth happens to have a run of La Nina’s (as it has), there is no way a model can be expected to match the timing of that.
The only thing we can expect them to have in common is that long run climate, responding to forcings. If you test models independently, that will take a very long time to emerge with certainty. If you aggregate models, you can accelerate the process.
Stokes;
Nope, sorry. Unless the existence and values of the forcings can be deduced deterministically from first principles (physical law), they are pure plugs plucked from presumed possibilities. The Parameters of Pseudo-Scientific Pretense.
Nick please give this a read. The comments section has links to the actual research papers
http://stevengoddard.wordpress.com/2011/05/26/1979-before-the-hockey-team-destroyed-climate-science/
Here we have real science in action. A prediction made in the mid to late 1970s that the following would occur:
1) The cold would continue until the early to mid 1980s
2) It would then warm until the end of the century
3) The warming would then stop
4) A drop of 1-2 degrees C would then occur.
3 out of 3 so far makes me a lot more confident in the 4th prediction that models that have never been right.
I have a simple question for you. How long with rising CO2 and flat or falling temperatures before you admit that CO2 doesn’t control the climate? 20 years? Almost there now. 30? Never?
” Earth and models both are systems of chaotic weather, for which after a period of time a climate can be discerned. ” — Stokes
“The only thing we can expect them to have in common is that long run climate, responding to forcings. If you test models independently, that will take a very long time to emerge with certainty.” — Stokes
On this installment of Dance with Sophists you will note that Stokes has confessed that Global Climate Models are Local Weather Models. And that, as it will take a long time to test the model, that either the null hypothesis has not been discharged, and so there has never been a test for Global Warming. Or that the null hypothesis has been discharged, in which case he knows how long it takes to reject the same if the correlation from the models is spurious.
“If you aggregate models, you can accelerate the process.” — Stokes
But in the very next sentence he states that if a classroom of students is given the math question 1 + 1, then the average answer of the students wrong results will produce the correct answer. Such that if 32 students are in the class, and at most one states ‘2’ that the average of all other results is ‘2.’
The Sophist here is attempting, as Sophists do, to prevent judgement on any measure of metric by introducing nonsense. For if the Sophist believed this position credibly, then the average of all the wrong papers about the failures of the AGW hypothesis have certainly converged on the answer that the AGW hypothesis failed. Or, to have some sport with Einstein:
“A large amount of failed experiments prove me right, but no amount of failed experiments prove me wrong.” — Einstein
Brian H says: November 20, 2013 at 1:35 pm
“Stokes;
Nope, sorry. Unless the existence and values of the forcings can be deduced deterministically from first principles (physical law)”
I think you have the wrong idea about what the forcings are. The main ones are measured GHG gas concentrations (esp CO2), volcano aerosols and TSI changes. Not much doubt about their existence and values (well, OK, maybe aerosols are not so easy).
TRM says: November 20, 2013 at 1:53 pm
“A prediction made in the mid to late 1970s that the following would occur:
1) The cold would continue until the early to mid 1980s
2) It would then warm until the end of the century
3) The warming would then stop”
3 out of 3? The cold didn’t continue – people talk of the 1976 climate shift. It warmed. But they didn’t say the warming would stop; they predicted a severe cold snap after 2000, while we had the warmest year ever in 2005, then 2010.
Nick Stokes: “3 out of 3? The cold didn’t continue – people talk of the 1976 climate shift. It warmed. But they didn’t say the warming would stop; they predicted a severe cold snap after 2000, while we had the warmest year ever in 2005, then 2010.”
So 10 years early, or 10 years late is a suitable disproof. So you have now committed to 10 years as suitable for the purpose, and as the answer for rgb that you have avoided providing.
So by your self-professed metric, then 17 years of failure is nearly twice the failure you use in disproving a hypothesis. The question then is whether you state AGW has failed as it’s been nearly twice as long as the 10 year mark, or whether it has not failed as 17 is adequately less than 10 + 10.
Jquip says:
November 20, 2013 at 9:53 am
“There are a lot of interesting things to say about Bayesian notions. Not the least of which is that ridiculously simple networks of neurons can be constructed as a Bayesian consideration. And, indeed, there are good reasons to state that it is a primary mode of statistically based learning in humans. Which, if you consider at all, is exactly where we get confirmation bias from. When something is wholly and demonstrably false, but we have prior and strongly held beliefs, *nothing changes* despite that the new information shows that the previous information is wholly and completely absurd.”
A simple Bayesian probability computation is stateless and therefore without memory. The memory or learned content of a neuronal network constructed from Bayesian computations must either be set in a form of back propagation learning; i.e. set from the outside during a training phase as fixed constants (or parameters; as when we fix the parameters for a GCM during curve fitting); or the network retains information through some form of feedback (as a Flipflop does in the digital world).
The properties of such a special algorithmic implementation cannot be used to say anything general about the field of Bayesian probabilities at all. In other words, Bayesian probability computations as such have nothing to do with strongly held beliefs in the face of new information.
bones says:
November 20, 2013 at 11:12 am
“Anyone want to guess what the results would be if they truncated their training period in, say, 1970?”
Which is exactly what they should do as a standard validation test. And yet, I have never heard of any attempt by the worlds best GCM modelers of building a high quality standard validation suite.
GCM’s are the healthcare.gov of the scientific world. (Same attention to testing)
Thank you all for this thick post of sharing. There is more than a days worth of reading and contemplation contained here!
The one and most astonishing things that I take away from all of the comments made came from Mr. Stokes with respect to the timing of temperature records in our past.
“In his day, there was no reliable global record available.”
Now I ask this,,,,,,,,,,
Is not this entire post and associated paper about compensating for deficiencies in exactly the same thing over 100 years later?
Maybe its just me,,,,, just sayin {©¿©}
“””…..Hyperthermania says:
November 20, 2013 at 1:30 am
“prestidigitation” – I quite like your writing normally, but that is a step too far. I can’t say that word, I’ve no idea what it means and I’m not going to bother to look it up in the dictionary on the basis that I’d never be able use it in a sentence anyway ! It is nice that you push our limits, but come on, give us a chance. I read it over and over again, then just when I think I’ve got the hang of it, I try to read the whole sentence again, and bam ! tongue well and truly twisted……”””””
Try “sleight of hand” as a pedestrian alternative. Personally, I like his Lordship’s choice of word.
OOoops!! Read Everything, before doing anything.
Alternate titles for this paper:
An Inconvenient Pause
Infusion of Data Confusion.
“Whack-a-Mole”: mole is in the Arctic.
I Reject Your Reality and Replace it With My Krigings
Mr. Donis asks whether the Gap between models’ prefictions and observed reality is greater than the 0.22 K shown in the latest monthly Global Warming Prediction Index. He wonders whether the models had correctly predicted the rate of increase in CO2 concentration since 2005. The models had gotten that more or less right (a little on the high side, but not much): and, in any event, over so short a period as eight and a half years a small variation in the CO2 estimate would not make much difference to the temperature outturn in the models.
However, one could add the 0.35 K offset at the beginning of 2005 in Fig. 11.33ab of IPCC (2013) to the 0.22 K divergence since 2005, making the Gap almost 0.5 K. However, the divergence on its own is more interesting, and I suspect it will continue. Indeed, the longer it continues the less likely it will be that the rate of global warming since January 2005 will ever reach, still less exceed, the 2.33 K/century rate that is the mid-range estimate of the 34 climate models relied upon by the IPCC.
Mr. Stokes says the models “solve the Navier-Stokes equations”. They may try to do so, but these equations have proven notoriously refractory. If I remember correctly, the Clay Institute has offered $1 million for anyone who can solve them. Mr. Stokes may like to apply (subject to my usual 20% finder’s fee). He also makes the remarkable assertion that the models do not attempt to quantify feedbacks. Of course they do. See Roe (2009) for an explanation. Gerard Roe was a star pupil of the formidable Dick Lindzen.
Briefly, the models begin by determining the Planck or instantaneous or zero-feedback climate-sensitivity parameter. The only reliable way to do this is to start with the fullest possible latitudinally-distributed temperature record (which Mr. Stokes incorrectly states is not used in the models). The models do it the way I did it after consulting Gerard Roe, one of the very few scientists who understands all this. John Christy kindly supplied 30 years of latitudinally-distributed satellite mid-troposphere temperature data, and I spent a happy weekend programming the computer to do the relevant radiative-transfer and spherical-geometry and solar-azimuth calculations, latitude by latitude. I determined that, to three decimal places, the value used in the models is correct, at 0.313 Kelvin per Watt per square meter (the reciprocal value is given as 3.2^-1 Watts per square meter per Kelvin in a more than usually Sibylline footnote in IPCC, 2007, at p. 631, but Roe says the Planck parameter should really be treated as part of the climatic reference frame and not as a mere feedback, so he prefers 0.313 K/W/m2.
The Planck parameter, which, as I have explained, is indeed temperature-dependent, is used twice in the climate-sensitivity equation. First, it is used to determine the instantaneous or zero-feedback climate sensitivity, which (absent any change in the non-radiative transports, whose absence cannot at all be relied upon: see Monckton of Brenchley, 2010, Annual Proceedings, World Federation of Scientists) is 1.2 K per Co2 doubling. Then the product of the unamplified feedback sum and the Planck parameter is taken, for that constitutes the closed-loop feedback in the climate object.
The individual temperature feedbacks whose sum is multiplied by the Planck parameter to yield the loop gain are each also temperature-dependent, being denominated in Watts per square meter per Kelvin of temperature change over some period of study.
In my expert review of the IPCC’s Fifth Assessment Report, I expressed some disquiet that the IPCC had not produced an explicit curve showing its best estimate (flanked by error-bars) of the evolution of the Planck parameter from its instantaneous value (0.3 K/W/m2) to its eventual equilibrium value 0.9 K/W/m2 3500 years later. The shape of the curve is vital. Deduction based on examination of the models predictions under the then six standard emissions scenarios (IPCC, 2007, p. 803, fig. 10.26) indicates that the value of the climate-sensitivity parameter rises to 0.44 K/W/m2 after 100 years and to 0.5 K/W/m2 (on all scenarios) after 200 years. That implies quite a rapid onset of the feedbacks, which, however, is not observed in reality, suggesting either that the shape of the curve of the evolution of the climate-sensitivity parameter is not as the models think it is or that the feedbacks are not at all as strongly net-positive as the models need to imagine in order to maintain that there may be substantial global warming soon.
Frankly, the continuing absence of the time-curve of the climate-sensitivity parameter is a scandal, for it is chiefly in the magnitude of feedbacks that the models’ absurd exaggerations of global warming occur, and this, therefore, is the chief bone of contention between the climate extremists and the skeptics.
There are several excellent theoretical reasons for considering that feedbacks are likely to be net-negative, or at most very weakly net-positive. Not the least of these is the presence of a singularity in the curve of climate sensitivity against loop gain, at the point where the loop gain reaches unity. This singularity has a physical meaning in the electronic circuits for which the Bode feedback-amplification was derived, but – and this point is crucial – it has no meaning in the physical climate, and it is necessary to introduce a damping term into the equation to prevent the loop gain from reaching the singularity. The models, however, have no damping term. Any realistic value for such a term would reduce climate sensitivity by three-quarters.
Empirical confirmation is to be found in the past 420,000 years of temperature change. In all that time, global temperatures have varied by only 1% in absolute terms either side of the long-run median. Since something like today’s conditions prevailed during the four previous interglacials over that period, the implication is that feedbacks in the climate system simply cannot be as strongly net-positive as the modelers imagine: for otherwise global temperatures could not have remained as remarkably stable as they have.
The reason for the self-evident temperature homeostasis in the paleotemperature record is not hard to find. For the atmosphere is bounded by two vast heat-sinks, the ocean (5000 times denser than the atmosphere) and outer space (an infinite heat-sink). So one would not expect much perturbation of surface temperature: nor has it in fact occurred; nor is it at all likely to occur. Since the climate has been temperature-stable for almost half a billennium, it would be a rash modeler who predicted major temperature change today. Yet that is what the modelers predict. And, though these obvious points are really unassailable, the IPCC simply looks the other way and will not address them.
It is the intellectual dishonesty behind the official story-line that concerns me. Science is supposed to be a search for truth, not a propaganda platform for international socialism or communism. In a rational world, the climate scare would have died before it was born.
Talking of “born”, Mr. Born says I am wrong to think that the removal of carbon-14 from the atmosphere after the bomb tests is any guide to the removal of carbon-12 and carbon-13 emitted by us in admittedly larger and more sustained quantities. But, apart from a dopey paper by Essenhigh, I do not know of anyone who claims that carbon-14 will pass out of the atmosphere any more quickly than carbon-12 or carbon-13. If Mr. Born would like to write to me privately he can educate me on what I have misunderstood; but he may like to read Professor Gosta Pettersson’s three thoughtful papers on the subject, posted here some months ago, before he does.
I like the move to the “gap” concept although “chasm” may become more descriptive. I’m doubtful we will see another El Niño anytime soon. The warming in the summer of 2012 appeared to be heading towards one but it fell apart. This could have taken enough energy out of the system to delay the next event until 2015-16. If that is the case there will be a lot fewer CAGW supporters.
Monckton of Brenchley says: November 20, 2013 at 6:10 pm
“Mr. Stokes says the models “solve the Navier-Stokes equations”. They may try to do so, but these equations have proven notoriously refractory.”
I have spent much of my working life solving the Navier-Stokes equations. CFD is a basic part of engineering. Here is a Boeing presentation on how they design their planes. N-S solution is right up there on p 2.
“He also makes the remarkable assertion that the models do not attempt to quantify feedbacks. Of course they do. See Roe (2009) for an explanation.”
Roe does not say anything about GCMs using feedbacks. Here is a well-documented GCM – CAM 3. It describes everything that goes in. You will not find any reference to sensitivity, feedbacks or the temperature record.
“Briefly, the models begin by determining the Planck or instantaneous or zero-feedback climate-sensitivity parameter….”
I’m sure there are simplified models that do this. But not GCMs.
Er … Hypothermia, I knew that word when I was a boy. But then, in those days we learned words from books and looked them up in the dictionary (Oxford, of course) when we didn’t understand them. Here’s the link.
http://www.oxforddictionaries.com/definition/english/prestidigitation
And here’s the thesaurus, so you can add legerdemain and thaumaturgy to your vocabulary.
http://thesaurus.com/browse/prestidigitation
Unfortunately, AGWs have not done due diligence in listing all the possible causes of temperature trend aside from CO2. We know that oceanic warming due to albedo (an indication of the amount of SW IR that gets through to the ocean surface) can and does eventually affect temperature when all that heat layers itself on the top surface, causing temperature trends up, down, and stable. These trends can be every bit as powerful, in fact more so, than greenhouse warming or cooling. It is also true that releasing this heat can be jarringly disrupted by windy conditions, mixing the warmth again below the surface, holding it away from its ability to heat the air. It is easy to see the result in the herky jerky stair steps up and down in the temperature series.
All scientists should examine all possible causes of data trends. The messy nature of the temperature trend matches the messy nature of oceanic conditions. It does not at all match the even measured rise in CO2. That a not small cabal of scientists jumped on that wagon anyway is food for thought.
Monckton of Brenchley: “Mr. Born says I am wrong to think that the removal of carbon-14 from the atmosphere after the bomb tests is any guide to the removal of carbon-12 and carbon-13 emitted by us in admittedly larger and more sustained quantities.” of CO2 in the atmosphere equals the mass
  of 12CO2 and 13CO2 plus the mass
  of 14CO2:
  , where
  . Let’s also assume that CO2 is being pumped into the atmosphere at a rate
  and sucked out at a rate
  and that the concentration of 14CO2 in the CO2 being pumped in is
  . Then the rate of CO2-mass change is given by:

 exceeds the sink rate, the total mass of atmospheric CO2 will rise until such time, if any, as the sink rate catches up, and, unless the sink rate thereafter exceeds the emission rate, the mass M will remain elevated forever.
 were to remain equal to the sink rate
  and thereby keep the total CO2 concentration constant, the difference
  between the (initially bomb-test-elevated) 14CO2 concentration and the ordinary, cosmogenic 14CO2 concentration–i.e., the “excess” 14CO2 concentration–would still decay with a time constant
  . That time constant therefore tells us nothing about how long the total CO2 concentration would remain at some elevated level to which it may previously have been raised by elevated emissions; in this scenario, for example, the level remains elevated forever even though the excess 14CO2 concentration decays.
It’s not an issue of which carbon isotopes we’re talking about. The issue is the difference between CO2 concentration, on the one hand, and residence time in the atmosphere of a typical CO2 molecule, of whatever isotope, on the other. The bomb tests, which tagged some CO2 molecules, showed us the latter, and I have no reason to believe that the residence time of any other isotope would be much different. But you’re trying to infer the former from the latter, which, as I’ve resorted to math below to explain, can’t be done:
Let’s assume that the total mass
whereas the the rate of 14CO2-mass change is given by:
The first equation says that the total mass, and thus the concentration, of CO2 varies as the difference between source and sink rates. So, for example, if the source and sink rates are equal, the total mass remains the same–even if few individual molecules remain in the atmosphere for very long. Also, if the emission rate
The second equation tells us that, even if the emission rate
In summary, the decay rate of the excess 14CO2 tells us the turnover rate of carbon dioxide in the atmosphere. It does not tell us how fast sink rate will adjust to increased emissions.
@Joe Born
This may be obvious and included and not noted, but does the cosmogenic-sourced 14CO2 production rate increase with an increased atmospheric concentration of target CO2 molecules? If it does, the decrease in 14CO2 concentration will be delayed and give the appearance of a longer turnover time.
And if the sun’s heliosphere has a significant indirect impact on the formation of 14CO2 that influence should first be subtracted lest the accidental or deliberate selection of ‘convenient’ starting and end points influence the calculation. During the coming cooling and the shrinking of the heliosphere we will have a chance to falsify one or more posits on this matter.
Crispin in Waterloo but really, etc.: “[D]oes the cosmogenic-sourced 14CO2 production rate increase with an increased atmospheric concentration of target CO2 molecules?”
Although I have an opinion (i.e., no), you should accord that opinion no more weight than that of the next guy at the bar; I’m a layman.
But in my youth I did take some required math courses (as presumably did most of this site’s other habitues), and you can witness here: http://wattsupwiththat.com/2013/07/01/the-bombtest-curve-and-its-implications-for-atmospheric-carbon-dioxide-residency-time/#comment-1352996 my conversion last July by math alone from Lord Monckton’s position (which I had earlier espoused on that page) regarding theoretical consistency between the bomb-test results and the Bern model to the one I expressed above (in a considerably condensed form so as not to tax Lord M’s patience) .
Again, though, I don’t profess to be knowledgeable about carbon-14 generation, so I have no clue about whether additional information could be gleaned from secondary effects such as those about which you speculate.
Professor Brown,
“There are some lovely examples of this kind of trade-off reasoning in physics — introducing a prior assumption of dark matter/energy (but keeping the same old theory of Newtonian or Einsteinian gravitation) versus modifying the prior assumption of Newtonian gravitation in order to maintain good agreement between certain cosmological observations and a theory of long range forces between massive objects. People favor dark matter because the observations of (nearly) Newtonian gravitation have a huge body of independent support, making that prior relatively immune to change on the basis of new data. But in truth either one — or an as-yet unstated prior assumption — could turn out to be supported by still more observational data, especially from still more distinct kinds of observations and experiments.”
In your amazing silent-assassin way, did you just trash Dark Matter/Energy? I fervently hope so, I hate them both. Sorry to be slightly off-topic, but Professor Brown is so erudite I almost assume that whatever he says, must be true!
Lord Monckton: “[Mr. Donis] wonders whether the models had correctly predicted the rate of increase in CO2 concentration since 2005.”
That’s not quite what I was wondering: as I understand it, the rate of increase of CO2 concentration is an *input* to the models, not a prediction of them. Different models make different assumptions about the rate of CO2 increase, and that difference in input makes some contribution to the difference in output.
What I was wondering was, *how much* contribution? If the Gap is 0.22 degrees looking at all the models, how much larger would it be if we only looked at the models whose assumptions about the rate of CO2 increase matched reality? I agree that difference wouldn’t be much over 8 years, but even a few hundredths of a degree would be a significant fraction of the total Gap.
I also think it’s worth bringing up this issue because when the IPCC draws its spaghetti graphs of model predictions, it *never* mentions the fact that many of those models made assumptions about the rate of CO2 rise that did *not* match reality, so they are irrelevant when comparing predictions to actual data.
M Simon says:
November 20, 2013 at 6:10 am
Well, it could be slight sleight of hand, or it could be profound sleight of hand. I’ll leave that to the reader.
Have commented before but the total sea ice area for year 2013 is going to be above average for a WHOLE YEAR very shortly. This will put a big crimp in any “Kriging” rubbish by Cowtan et al.
With the extent positive any Arctic amplification will be wiped out by Antarctic Deamplification and there will be a Hockey stick spike down in global cooling for 2013. Cannot wait.
Metamorphosis of Climate Change.
The hockey schtick ‘s transformed
into a playing field of ups ‘n downs,
that show the variability we know
is climate change. It’s strange that
climate modellers in cloud towers
never recognised that the complex
inter-actiing ocean-land and atmo-
spheric system that is our whether
does
this.
Beth the serf.
Lewis P Buckingham:
I’m not sure the case of dark matter is really analogous to the case of CO2. In the case of dark matter, we know *something* is there, because there is not enough visible matter in galaxies to account for the motion of stars on the outer edges of those galaxies–in other words, the total mass of the galaxy inferred from its total gravity, which determines the motions of its stars, is larger than the mass we can see. The question is what the extra mass is, since it doesn’t show up in any other observations besides the indirect inference from the galaxy’s total gravity.
In the case of CO2, however, we know what the “dark matter” is–we can directly detect the CO2 in the atmosphere. The question is how much effect that CO2 has on the climate, i.e., how much “gravity” it exerts: the climate is warming *less* than the models say it ought to given how much CO2 concentrations have risen. In other words, rather than seeing an indirect effect but not directly observing the dark matter that causes it, we see the “dark matter”–the CO2–but we don’t see the indirect effect that the models claim should be there.
I disagree. Earth and models both are systems of chaotic weather, for which after a period of time a climate can be discerned. The timing of GCM weather events is not informed by any observations of the timing of Earth events; they are initialized going way back and generate synthetic weather independently. This is true of medium term events like ENSO; if the Earth happens to have a run of La Nina’s (as it has), there is no way a model can be expected to match the timing of that.
The only thing we can expect them to have in common is that long run climate, responding to forcings. If you test models independently, that will take a very long time to emerge with certainty. If you aggregate models, you can accelerate the process.
Sorry it took a day to get back to this, but I do think it is important to respond.
I agree that the climate system is nonlinear and chaotic. I’m not precisely certain what you mean about “after a time a climate can be discerned”, since a glance at the historical record suffices to demonstrate that either climate is discernible after a very short time or the earth has no fixed climate — the climate record is always moving, never stable as one would expect from a nonlinear chaotic system. Was the LIA part of the “climate”? Apparently not, it only lasted a century or so. Was the rise out of the LIA a stable “climate”? Not at all — things warm, things cool. The autocorrelation time of GASTA is what, at most 20 years across the last 160? More likely 10. Noting well that forming the autocorrelation of an anomaly is more than a bit silly — the actual autocorrelation time of the climate e.g. GAST is infinite, and what one is looking at with GASTA is fluctuation-dissipation, of the fluctuation-dissipation theorem, not first order autocorrelation of the global average surface temperature (or any other aspect of “climate”, as they all not only vary, there are clear if transient periodicities and both long term and short term trends).
As for the GCMs not being informed by actual weather, sure. However, they take great pains to do a Monte Carlo sampling of initial conditions for the precise reason that — if they work — the distribution of outcomes should in some sense be representative of the actual distribution of outcomes. It is in precisely this sense that individual GCMs should be rejected. The sampling itself produces a p-value for the actual climate, and ones where nearly all runs spend nearly all of their time consistently above the actual climate — pardon me, “weather” — can form the basis for a perfectly legitimate test of the null hypothesis “this GCM is a quantitatively accurate predictor of the climate”. Otherwise you are in the awkward position of any “believer” whose pet hypothesis isn’t in good correspondance with reality — forced to assert that reality is somehow in an improbable state instead of in the most probable state. Sure, this could always be true — but one shouldn’t bet on it. Literally. Even though you seem to be doing just that.
When you assert that they are failing because there has been e.g. “a run of La Ninas”, you are asserting first and foremost that they are failing and you are grasping for a reason to explain the failure. This is very likely to be one of many reasons for the failure, and the failure to predict GASTA is one of many failures, such as the failure to predict the correct kind of behavior for LTT. So we actually seem to be in agreement that they are failing, or you wouldn’t make excuses. It would be a bit simpler — and arguable a bit more honest — to state “Yes, the GCMs are failing, and here is a possible explanation for why” rather than asserting that they are correct even though they are failing. And even your remark about La Ninas concedes the further point that natural variation is in fact responsible for a lot more of the climate’s total variation than the IPCC seems willing to acknowledge — you can’t have it both ways that natural variation is small and that natural variation (in the form of a run of La Ninas) is responsible for the lack of warming. I could just as easily turn around and — with considerable empirical justification — point out that the 1997-1998 Super El Nino is the only event that has produced visible warming of the climate in the entire e.g. UAH or RSS record or for that matter, in HADCRUT4 in the last 33 years:
http://www.woodfortrees.org/plot/hadcrut4gl/from:1980/to:2013
Then one has to contend with the question of whether or not it is ENSO — by your own asssertion an unpredictable natural cycle that can without any question cause major heating or cooling episodes that are independent of CO_2 — that is the dominant factor in the time evolution of the climate, and obviously, a factor that is neither correctly predicted nor correctly accounted for in GCMs.
All of this is instantly apparent for your apologia for GCMs. However, it is the last assertion that I am writing to be sure to reply to, as it is rather astounding. You assert that aggregating independently conceived and executed GCM results will somehow “speed their convergence” to some sort of long term prediction.
Nick, you know that I respect you and take what you say seriously, but this is an absolutely indefensible assertion not in physics, but in the theory of statistics. It is quite simply incorrect, and badly incorrect at that, empirically incorrect. The GCMs already do Monte Carlo sampling over a phase space of initial conditions. One at a time, this is perfectly legitimate as long as random numbers with some sane distribution are used to produce the sampling. However, the GCMs themselves do not converge to a common prediction on any timescale. Their individual Monte Carlo averages do not converge to a common prediction on any timescale. GCMs are not pulled out of an urn filled with GCMs with some sort of distribution of errors around the “one true GCM” — or rather, they might be but there is no possible way to prove this a priori and it almost certainly is not true, based on the data instead of your religious belief that the models must have all of the physics right in spite of the fact that they don’t even agree with each other, and disagree badly with the actual climate in at least some cases.
If you think that you can prove your assertion, that an arbitrary set of models that individually do not converge to a single behavior and that may well contain shared systematic errors that prevent all of them from converging to the correct behavior at all must necessarily converge to the correct behavior faster when you average them, I’d love to see the proof. I’ve got a pretty good understanding of statistics and modelling — I make money at the game, have a major interest in a company that does this sort of thing for a living, and spent 15 to 20-odd years of my professional career doing large scale Monte Carlo simulations, and the last six or seven writing dieharder, which is basically an extended exercise in computational hypothesis testing using statistics and (supposedly) random numbers.
I would bet a considerable amount of money that you cannot prove, using the axioms and methods of statistics, that a single GCM will ever converge to the correct climate (given that if true, good luck telling me which one since they all go to different places in the long run, which is one of many reasons that the climate sensitivity is such a broad range even for the GCMs, given that they don’t even agree on the internal parametric values of physical quantities that clearly are relevant to their predictions).
I would bet a further considerable amount of money that you cannot prove that either the parametric initialization of different climate models or their internal structure can in any possible sense be asserted to have been drawn out of some sort of urn by a random process, whereby you fail in the first, most elementary requirement of statistics — that samples in some sort of averaging process be independent and identically distributed — where the samples in question are GCMs themselves. Monte Carlo of initialization of a model is precisely this, which is why the distribution of outcomes has some (highly conditional) meaning. But suppose I simply copy one model 100 times (giving its predictions 100x the weight of any other)? Is this going to somehow “accelerate the convergence process”?
Of course not. You can average 1000, 10000, 10^18 incorrect models and no matter how small you make the variance around the mean, you will have absolutely no theoretical basis for asserting that the mean is a necessary predictor for reality for anything but a vanishingly small class of incorrect models — single models that are individually correct (although how you know this a priori is and will continue to be an issue) but that have precisely the sort of “incorrectness” one can associate with e.g. white noise in the initial conditions and can compensate for by sampling. And to be quite honest, for chaotic dynamical systems it isn’t clear that one can compensate, even with this sort of sampling. In fact, the definition of a chaotic dynamical system is that it is one where this does not as a general rule happen, where tiny perturbations of initial conditions leads to wildly different, often phase-space fillingly different, final states.
There is, in other words, at least a possibility that if a butterfly flaps its wings just right, the Earth will plunge into an ice age in spite of increased CO_2 and all the rest. Or, a possibility that even without an increase in CO_2, the Earth would have continued to emerge from the LIA on almost exactly the observed track, or even warmed more than it has warmed. Or anything in between. That’s why the “unprecedented” phrase is so important in the political movement to assert that the science is beyond question. In actual fact, the climate record has ample evidence of variability that is at least as large as everything observed in the last 1000 years, and that even greater variability existed in the previous — fill in the longer interval of your choice — the evidence continues back 600 milllion years with cycles great and small, which the current climate being tied for the coldest climate the planet has ever had over 600 million years.
But climate science is never going to make any real progress until it acknowledges that the GCMs can be, and in some sense probably are, incorrect. Science in general works better when the participants lack certainty and possess the humility to acknowledge that even their most cherished beliefs can be wrong. So much more so when those beliefs are that the most fiendishly difficult computational simulation humans have ever undertaken, one that simulates a naturally nonlinear and chaotic system with clearly evident multistability and instability in its past behavior, is beyond question getting the right answer even as its predictions deviate from observations.
That sounds like rather bad science to me.
rgb
In your amazing silent-assassin way, did you just trash Dark Matter/Energy? I fervently hope so, I hate them both. Sorry to be slightly off-topic, but Professor Brown is so erudite I almost assume that whatever he says, must be true!
No, how can I do that? It’s (so far) an invisible fairy model, but gravitons are also (so far) invisible fairies. So are magnetic monopoles. It’s only VERY recently that the Higgs particle (maybe) stopped being an invisible fairy.
Physics has a number of cases where the existence of particles was inferred indirectly before the particles were directly observed, and a VERY few cases where we believe in them implicitly without being able to in any sense “directly” see them (quarks, for example — so much structure that we cannot disbelieve in them but OTOH we cannot seem to generate an isolated quark and even have theories to account for that). Positrons, neutrinos. But in all cases the physics community hasn’t completely believed in them before some experimentalist put salt on one’s tail (or the indirect evidence became overwhelming and the theory was amazingly predictive).
So I don’t need to “trash” dark matter/energy. It is one of several alternative hypotheses that might explain the data, where the list might not be exhaustive and might not contain the correct explanation (yet). It’s a particularly easy way to explain some aspects of the observations — invisible fairy theories often are, which is part of their appeal — but it is very definitely a “new physics” explanation and hence even proponents of the theory, if they are honest, will admit that it isn’t proven and could be entirely wrong, and the most honest of them could list some criteria for falsifying or verifying the hypothesis (which the most saintly of all would openly acknowledge is and will remain PROVISIONALLY falsifying/verifying, because evidence merely strengthens or weakens the hypothesis, it doesn’t really “prove” or “disprove” it, until we have a complete theory of everything, and Godel makes it a bit unlikely that we will ever have a complete theory of everything and should count ourselves lucky to have a mostly CONSISTENT theory of a lot of stuff SO FAR.
“So far”, or “yet” is the key to real science. We have a set of best beliefs, given the data and a requirement of reasonable consistency, so far. I’m a theorist and love a good theory, but when experimentalists speak, theorists weep. Or sometimes crow and cheer, but often weep. As Anthony is fond of pointing out, the entire CAGW debate between humans is ultimately moot. Nature will settle it. If the GCMs are correct, sooner or later GASTA will jump up to rejoin their predictions. If they are not correct, the emerging gap may — not will but may — continue to widen. Or do something else. They could even be incorrect but GASTA COULD jump up to rejoin them before doing something else. But what nature does is the bottom line, not the theoretical prediction. We (must) use the former to judge the latter, not the other way around.
rgb
“Invisible fairy models,” good enough for me. How about String Theory and Super-String Theory? Is there any way for a human mind to accommodate 11 dimensions? Try as I will, I still only see three…
the 1997-1998 Super El Nino is the only event that has produced visible warming of the climate in the entire e.g. UAH or RSS record or for that matter, in HADCRUT4 in the last 33 years
>>>>>>>>>>>>>>>>>>>>>>>>>>>
wow.
And how do you know (first principles) that they are forcings? Well, they just gots to be” ? Or the most relevant ones? Or that they aren’t counteracted by more muscular feedback loops? Note that NO other “science” refers to forcings. It is a convenient fiction unique to CS. Wonder why?
Kind of backwards, or it seems so. Water vapor is the forcing and carbon dioxide is a feedback in an inverse relationship with the water vapor concentration. When there is high humidity co2 means squat except in the cases of very low humidity then you have an effect from the co2 for it is then the sole player devoid of the h2o state changes. This is only low or mid in the troposphere but co2 always has its place at or above the TOA shedding heat just like the high altitude water vapor.
rgbatduke says: November 22, 2013 at 8:31 am
“the earth has no fixed climate… “
RGB, I didn’t say it did. Climate, for this purpose, can be defined as the timescale on which the response to variation in forcings dominates. There’s a widespread view here that the LIA was a response to a sunspot minimum. I don’t know how sound that is, but it is a typical argument for climate from forcing.
GCMs, with or without forcing variations, produce all kinds of weather, as we are familiar with, on a time scale at least up to ENSO. The timing of this weather is random. It does not synchronize across runs, and there is no reason to expect it to synchronize with Earth. The only thing common between runs, and with Earth, in terms of timing is the forcing. There you can expect that runs and Earth should track each other. It’s on a multi-decadal scale when the effects of random weather (incl ENSO) have averaged out.
I don’t understand your reference to careful Monte Carlo initialization. They may do that as a matter of good practice, but in fact what they really try hard to do is to obliterate the effect of initial conditions. Here is text from a slide from a CMIP overview:
“>Modelers make a long pre-industrial control
>Typically 1850 or 1860 conditions
>Perturbation runs start from control
>Model related to real years only through radiative forcing, solar, volcanoes, human emissions, land use etc
> Each ensemble an equally likely outcome
> Do not expect wiggles to match – model vs obs
“
That summarizes what I’ve been saying. Here is a 2004 paper by the same people summarising the then state of initialization and recommending a change. The then state was basically do your best to get anything right that might have long-term implications – mainly ocean distribution of heat. But of course, in 1850, that’s guesswork. The new idea is to get the present state, wind back to 1850, and then run forward. Obviously none of this is designed to predict from initial conditions.
“When you assert that they are failing because there has been e.g. “a run of La Ninas”, you are asserting first and foremost that they are failing… “
No, they are not failing. They never intended to predict La Ninas. In fact no one can, any more than they can predict volcanoes. That’s why you need to wait for the response to forcing to emerge. That;’s all that GCM’s claim to have in common with Earth. And it’s what they are designed to study.
That’s why asking that models be selected according to whether they agree with decadal trends is futile. It’s like selecting a mutual fund on last years results. You just get the ones that got lucky.
“natural variation is in fact responsible for a lot more of the climate’s total variation than the IPCC seems willing to acknowledge”
Do you have a quote on what the IPCC says? I don’t think they are reluctant to acknowledge natural variation. This comes back to the persistent fallacy that AGW is being deduced from the temperature record, and so natural variation as an alternative has to be denied. It isn’t, and natural variation simply delays the ability to discern the AGW signal. It doesn’t mean it isn’t there. That’s the usual complaint here – that scientists ask for too much patience.
“You assert that aggregating independently conceived and executed GCM results will somehow “speed their convergence” to some sort of long term prediction.”
Yes. This is routine in CFD. If you want to get a proper picture of vortex shedding, aggregate over a number of cycles (which might as well be separate runs), with careful matching. Again, you have a synchronised response to forcing plus random variation. Putting them together has to reinforce the common signal relative to the fluctuations. It may be hard to get population statistics, but the signal will be preferentially selected.
“the models must have all of the physics right in spite of the fact that they don’t even agree with each other”
They have to have a lot of physics right, just to run. They don’t claim to get common weather. And yes, models may not converge to the correct climate. They may indeed have biases. But aggregation of model runs will diminish random fluctuations. You’re right that that doesn’t prove that the combined result is a correct prediction, but it is a more coherent prediction.
Again I recommend this video of SST simulations from GFDL CM2. At about 2 min, it shows the Gulf stream. There are all sorts of wiggles and bends which are peculiar to this run alone, and I think the model may exaggerate them. But the underlying current, which is a response to forcing, is clear enough, and common from year to year, and I’m sure from run to run. Now here the signal is strong, but it would be clearer still if enough runs were superimposed so that the wiggles were damped and the common stream emerged.
“Invisible fairy models,” good enough for me. How about String Theory and Super-String Theory? Is there any way for a human mind to accommodate 11 dimensions? Try as I will, I still only see three…
If you do physics at all, you take linear algebra and several courses on ODEs and PDEs. In the process you learn to manage infinite dimensional linear vector spaces, because Quantum Theory in general is built on top of L^2(R^3) — the set of square-integrable functions on 3d Real space — which is an infinite-dimensional vector space.
There is also a fine line between a multidimensional algebra — the sort of thing you’d used to manipulate functions of five or ten or a hundred variables — and a multidimensional geometry. It’s pretty simple to “geometrize” sucn an algebra by constructing projectors (tensors and tensor operators).
It’s funny you ask about visualizing more than three dimensions. Our brains are evolved to conceptualize SL-R(3+1) because that’s where we apparently live, but I actually spend some time trying to imagine higher dimensional geometries. It would probably be easier if I dropped a bit of acid, but I do what I can without it…;-)
I’m guessing that the human brain is perfectly CAPABLE of “seeing” four-plus spatial dimensions, but we simply lack inputs with data on them that can be interpreted in that way. Our binocular vision and hearing and our spatial sensory input from our skin doesn’t contain the right encoding. But neural networks are pretty amazing, and our brains can adapt and repurpose neural hardware (and often has to, when e.g. we have strokes or accidents. That’s why I try to do the visualization — my brain is also capable (in principle) of synthesizing its own e.g. four dimensional input, and brain exercises help maintain and develop intelligence.
rgb
“You assert that aggregating independently conceived and executed GCM results will somehow “speed their convergence” to some sort of long term prediction.”
Yes. This is routine in CFD. If you want to get a proper picture of vortex shedding, aggregate over a number of cycles (which might as well be separate runs), with careful matching. Again, you have a synchronised response to forcing plus random variation. Putting them together has to reinforce the common signal relative to the fluctuations. It may be hard to get population statistics, but the signal will be preferentially selected.
I think you are still missing the point. One doesn’t aggregate over separately written PROGRAMS — certainly not unless you have direct experience of the programs independently working correctly — you aggregate over separate RUNS of ONE program with introduced randomness in its internals or in its initialization. This is stuff I understand very well indeed — Monte Carlo, Markov chains, and so on. Within one program this is perfectly valid and indeed best practice for any program that produces a non-deterministic result or a result that is basically a sample from a large space of alternatives. Many such samples can give you a statistical picture of the outcomes of the program being used, nothing more. To the extent that that program is reliable — something that is always an a posteriori issue, and I speak as a professional programmer here — this statistical picture may be of use. This is just as true for your CFD code as it is for any other piece of code ever written.
In the specific case of predictive modelling there is precisely one way to validate a predictive model. You use it to make predictions outside of the training data used to build the model, and you compare its predictions to the actually observed result. This is the foundation of physics itself (which is the mother of all predictive models, after all). For particularly complex models, after you validate the model, there is one remaining important step. That is, pray that your training and trial set capture the full range of variability of the system being modeled so that it keeps on working to predict new observational data as it comes in, without any particular bound. Many models — most models in highly multivariate, nonlinear, and especially chaotic systems with their Lyupanov exponents — will fail at some point. The conditions they were tuned for in the training set are themselves slowly varying parameters, or the system isn’t Markovian, or it is butterfly-effect sensitive. The streets are littered with homeless people who thought they could beat the market with a clever model just because they built a model that worked for past data and even predicted new data for a time.
Absolutely none of this is relevant to applying multiple, independently written models to the same problem. The same statistical principles that make it a GOOD idea to sample the space within a single model do not apply between models. Suppose you have two CFD programs that you can use to do your work. You purchased them from two different companies, and you know absolutely nothing about how they were written, their quality, or even whether or not they will “work” for your particular problem. You can probably assume that they went through “some” validation process in the companies that are selling them, but you cannot be certain that the validation process included systems with the level of detail or the particular shapes present in the system you are trying to simulate.
Do you want to assert that your best practice is to run both programs a few dozen times on your problem and average the results, because the average of the two programs — that, it rapidly becomes apparent, lead to completely different answers — is certain to be more accurate than either program by itself?
Of course not. First of all, you have no idea how accurate each program is for your particular problem independently! Second, there isn’t any good reason to think that errors in one program will cancel errors in the other, because the programs were not selected from an “ensemble of correctly written CFD programs” — this begs the question, you do not KNOW if they were correctly written or (more important) if they work, yet. If both programs contain the same error for some error, both will on average produce erroneous results! You cannot eliminate errors or inadequacies or convergence problems by averaging, except by accident.
All you’ve learned from running the programs a few dozen times and observing that they give different results (on average) is that both of your CFD programs cannot be correct. You have no possible way to determine (just from looking at the distributions of their independently obtained results) which one is correct, and of course they could both be incorrect. You cannot assume that errors in one will compensate for errors in the other — for all you know, one of the two is precisely correct, and averaging in the erroneous one will strictly worsen your predictions.
There is only one way for you to determine which program you should use. Apply them independently to problems where you know the answer and compare their results. And in the end, apply them to your problem (with its a priori unknown answer) and see if they work. Since they give different answers, one of them will give better results than the other. You will be off using the one that gives the better answer rather than using them both, once you’ve determined that one of them isn’t doing well.
The point is that neither CFD programs nor GCM programs constitute an ensemble of correctly written programs. There is no such thing as an a priori ensemble of correctly written programs. There is an ensemble of written programs, some of which may be correctly written. Averaging over the set of written programs does not produce a correctly written program, even on average.
Do you have a quote on what the IPCC says? I don’t think they are reluctant to acknowledge natural variation.
You mean the bit where they repeatedly assert that over half of the warming observed from 1950 or thereabouts on is due to increased CO_2? I could look up the exact lines (it occurs more than one time and has occurred repeatedly in all of the ARs) in the AR5 SPM, but why bother? I’m sure you’ve read it. Don’t you remember it? Heck, I can remember it being said in the Senate hearings. I didn’t expect you to disagree with this, I have to admit.
At the moment, BTW, the “natural variation” in question is roughly 0.6 C over 20 years difference between Nature with its natural variation and the worst GCMs with their unnatural variations. You might note that this is a quantity on the same order (only a bit larger than) the entire warming observed over sixty years in e.g. HADCRUT4. It doesn’t even make sense.
I have to ask — have you looked at the performance of some of the individual models compared to reality? Do you seriously think that one of the models that is predicting almost three times as much warming as the “coolest” of the models (which are, in turn, still substantially warmer than observation) is still just a coin flip, just as likely to be correct as any other? If you applied your CFD programs to your real world problems and one of those programs consistently gave results that caused your jets to fall from the sky and was in substantial disagreement with the programs that gave the best empirical results in application to actual problems, would you keep using it and averaging it in because everybody knows that more models is better than fewer ones?
rgb
“Do you seriously think that one of the models that is predicting almost three times as much warming as the “coolest” of the models (which are, in turn, still substantially warmer than observation) is still just a coin flip, just as likely to be correct as any other?”
>>>>>>>>>>>>>>>>>>>>>>>>>>>>>>>>>>>>>>>>>>>>>>>>>>>>>>>>>
Coin flip? Please. Most climate models are mere propaganda. Extreme models are included to skew the bastardized mean and affect public opinion and policy. To exclude failing models (let’s be generous – 85%) would cause warming predictions to crater and negatively affect red/green propaganda and policy. Can’t have that; hence, Nick Stoke’s mendacity.
rgb;
It is said, a man with one watch knows the time. A man with 2 watches is uncertain. 😉
Coin flip? Please. Most climate models are mere propaganda. Extreme models are included to skew the bastardized mean and affect public opinion and policy. To exclude failing models (let’s be generous – 85%) would cause warming predictions to crater and negatively affect red/green propaganda and policy. Can’t have that; hence, Nick Stoke’s mendacity. is positive definite and results in a deviation in the same direction as the correct consideration of exchange, so we can be certain of the sign of the error in theories that neglect or incorrectly treat this term. Yet in the search for the best possible solution to the problem of quantum electronics, physicists are constantly comparing their computations to nature, seeking to improve their theory and computation and thereby their results, and not hesitating to abandon approaches as they prove to be inadequate or systematically in error as better approaches come along. We never have people presenting the results of many of these computations applied to a benchmark atom and asserting that the average of the many computations is more reliable than the models in the best agreement with the actual result for the benchmark atom, nor do we have anyone who would assert that because Hartree-Fock and perturbation theory does a decent job at giving you the energy levels of Helium that we can absolutely rely on it for a computation of Uranium, or for that matter Oxygen, or Silicon, or Iron — let alone for Silicon Dioxide, or for polycrystalline Iron.
Climate models are not “mere propaganda”. I’m quite certain that the people who wrote and who are applying the models to make predictions do so in reasonably good faith. Again, this sort of thing is commonplace in physics and e.g. quantum chemistry, another problem that is almost too difficult for us to compute.
On another thread, long ago, I pointed out how solving the problem of computing the electronic energy levels of atoms and molecules has many similarities to the problem of predicting the climate. In both cases one has to solve an equation of motion that cannot be solved analytically, and where simply representing the exact solution for even a fairly small molecule requires nearly infinite storage (imagine a Slater determinant for the 48 electrons in CO_2, each with two levels of spin — even the ground state is almost impossible to represent). To make anything like a reasonable, computable theory, a single-electron approach has to manage two “corrections” inherited from this non-representable, non-computable physics) — the so-called “exchange energy” associated with the requirement that the final wavefunction be fully antisymmetric in electron exchange (satisfy the Pauli exclusion principle as electrons are Fermions) and the “correlation energy” that is a mixture of everything else left out in the approach — relativistic corrections, and the many body corrections resulting from the fact that electrons as strongly repulsive so that the wavefunction should vanish whenever any two electron coordinates are the same — the so called “correlation hole” in the wavefunction. Single electron solutions cannot represent an actual correlation hole.
Historically, attempts to solve even the problem of atomic states have worked through a progression of models. Perturbation theory was invented, allowing solutions to be represented in a single-electron basis of solutions to a simpler (but related) problem. The Schrodinger equation was generalized into the relativistic Dirac equation (that also accounted for spin). The many-body interaction was first treated using the Hartree approximation — each electron presumed to move in an “average” potential produced by all of the other electrons, basically — then improved with a Slater determinant for small enough problems into Hartree-Fock, which included exchange by making the wavefunction fully antisymmetric by construction. To do larger atoms, results from a free electron gas were turned into a Thomas-Fermi atom, perhaps the first “density functional” approach to the single electron problem. Hohenberg and Kohn proved an important theorem relating the ground state energy of any electronic system to a functional of the density, and Kohn and Sham turned it into a single electron mean field approach — basically a Hartree atom (or molecule) but with a density functional single electron potential. And for at least a decade or a decade and a half now, people have worked on refining the density functional approach semi-empirically to the point where it can do a decent job of computing quite extensive electronic systems.
This is the way theoretical physics is supposed to work for non-computable or difficult to compute problems, problems where we know we cannot precisely represent the answer and where the answer contains short-range singular complexity and long range nonlinearity in the answer. I could run down a partial list of computational methods that implement these general ideas in e.g. quantum chemistry — the “LCAO” (linear combination of atomic orbitals), the use of Gaussians instead of atomic orbitals (easier to compute), self-consistent field methods — but suffice it to say that there are many implementations of the computational methodology for any given approach to the problem, and there are MANY different approaches to all of the quantum electron problems where EVERYBODY KNOWS exactly how to write down the Hamiltonian for the system — it is “well-known physics”. The same is true all the way down to band theory (where I spent a fair bit of time developing my own approach, a nominally exact (formally convergent) solution to the single electron problem in a crystal potential) with is still an extension of the humble hydrogen atom, which is the ONLY quantum electronic atomic problem we can nominally solve exactly.
None of these people are trying to play political games with the results — the ability to do these computations is just plain useful — a key step along the path to reducing the engineering problem to 80% (comparatively cheap) computation and only 20% empirical testing instead of engaging in an endless Edisonian search for useful structures unguided by any sort of idea of what you are looking for. And so it is with climate — it is difficult to deny that being able to predict the weather out far enough that it becomes the “climate” instead would permit long range planning that would be just as useful as Pharaoh’s dream, just as the ability to predict hurricane tracks and intensities and predict the general weather days to weeks in advance is important and valuable now.
There is nothing whatsoever dishonest in the attempt — it is even a noble calling. And I do not believe that Nick Stokes or Joel Shore are in any reasonable sense of the work being dishonest as they express their reasonably well-informed opinions on this list, any more than I am. Two humans can be honest and disagree, especially about the future predictions produced by code solving a problem that is arguably more difficult by a few orders of magnitude than the quantum electronic problem.
However, the quantum electronic problem permits me to indicate to Nick in some detail the failure of his argument by contrasting the way that the results GCMs are presented to the public (and the horrendously poor use of statistics to transform their results into a “projection” that isn’t a prediction and that — apparently — cannot be falsified or compared to reality) and the way quantum electronics has been treated from the beginning by the physics and quantum chemistry communities.
First of all, you can take thirty completely distinct implementations of the Hartree approach, and apply them to (say) the problem of computing the electronic structure of Uranium. If you do, it may well be that you get a range of answers, in spite of the fact that all of the programs implement “the same physics”. They may use different integration programs or ODE solution programs with different algorithms and adaptive granularity. They may be run on machines with different precision, and since the ODEs being solved are stiff, numerical errors can accumulate quite differently. The computations can be run to different tolerances, or summed to different points in a slowly convergent expansion. The computations may use completely different bases. They may well give widely distinct result all while still basically solving a single electron, mean field problem based on known physics and neglecting unknown/non-computable stuff in a similar way! I’d say it would be more than a bit surprising if they all gave the same results.
Of course Uranium has its own, real, electronic structure:
http://education.jlab.org/itselemental/ele092.html
Except that even this picture isn’t correct — most of the energy levels in this list are (or should be) “hybridized” orbitals, which basically means that this list is a set of single electron labels in a basis that does not actually span the space where the solution lives. No single electron approach will give either the correct spectrum or the correct wavefunctions or the correct labelling because the single electron basis spans the wrong (and MUCH smaller) space compared to the one where the true wavefunction lives. But one can nevertheless measure Uranium’s electronic structure and spectrum and compare the results to the collection of computations suggested above.
So, can we assume — as Nick seems to think — that we can average over the many Hartree results and get a better (more accurate) a priori prediction of the electronic structure of Uranium? Of course not. Not only will all of the Hartree results be in error, they will all be in error in the same direction from the true spectrum. The single electron/Hartree approach ignores both the electron correlation hole and Pauli exhange. Both of these increase the effective short range repulsion and result in an atom that is strictly larger and less strongly bound than the Hartree atom. The correlation/exchange interaction, if included, will strictly increase the spectral energies computed by Hartree. Even if you manage to write code that works perfectly and gives you the Hartree energies to six significant digits, even if you fix all of the Hartree computations so that they agree to six significant digits, four or five out of those six significant digits will be wrong, systematically too low.
Now suppose that you consider a collection of codes, some of which are Hartree, some of which are Hartree-Fock (and include exchange more or less exactly, although that is probably still impossible for Uranium), some of which are Thomas-Fermi or Thomas-Fermi-Dirac, some of which are density functional using programs of different ages and lines of research descent). For the record, Hartree will always underestimate energies by quite a bit, Hartree-Fock will (IIRC) always underestimate energies but not by so much as the exchange hole accounts for part of the correlation hole present in Hartree without any density functional piece, and as one inserts various ab initio or semi-empirical Kohn-Sham density functionals, one can get errors of either sign especially from the latter which is retuned to give the right answers in different contexts, more or less recognizing that we cannot a priori derive the “exact” Kohn-Sham density functional that will work for all electronic configurations across all energy ranges and length scales.
Is there any possible way that one “should” average the output from all of the different codes in the expectation that one will get an improved prediction? If you’ve paid any attention at all, you will know that the answer is no. The inclusion of Hartree and Hartree-Fock results will result in a systematic error with a monotonic deviation from the correct (empirical) answers, while using a well-tuned semi-empirical potential will give you answers that are very close to the correct answers and may well make errors of either sign relative to the correct answers.
This counterexample makes it rather clear that there can be no possible theoretical justification for averaging the results of many independently written models as an “improvement” on those models. There are only correct models, that give good results all by themselves, and incorrect models, that don’t. And the only way to tell the difference is to compare the results of those models to experiment. Not to each other. Not to other experiments — e.g. discovering that Hartree works quite well for hydrogen and helium and isn’t too bad (with a small monotonic deviation) for light atoms, so surely it is valid for Uranium too! Again, this is obvious from a simple comparison of the results of fully converged codes — the answers they produce are all different. They cannot possibly all be correct.
In the case of quantum electronics we are fortunate. It is a comparatively simple system, one where I can write down the equation from which the solution must proceed, or link it e.g. here:
http://en.wikipedia.org/wiki/Density_functional_theory#Derivation_and_formalism
It is also one where the sign of
Nick asserts — and again, I’m sure he truly believes — that increasing CO_2 in the atmosphere will result in some measure of average global warming, because there is a simple, intuitive physical argument that supports this conclusion. It is his belief that this mechanism is correctly captured in the GCMs, in spite of the fact that the many different GCMs, which balance the opposing contributions of CO_2, water vapor/cloud albedo feedback, and aerosols all quite differently, lead to different predictions of the amount of warming likely to be produced by 600 ppm CO_2, and in spite of the fact that we cannot quantitatively or qualitatively explain the observed natural variation in global climate over as little as 1000 years, let alone 10,000 or 10,000,000. In other words, we cannot even predict or explain the gross movements of the climate over a time that CO_2 was not — supposedly — varying. Nick has directly stated that perhaps the LIA was caused by a Maunder minimum — and of course he could be right about that, although correlation is not causality.
What he cannot do is explain why the Maunder minimum would have caused a near-ice age at that time. The variation of solar forcing “should” have been far too small to produce such a profound effect (the coldest single stretch in 9000 years, as far as we can tell today) and there isn’t any good reason to think that Maunder type minima don’t happen regularly every few centuries, so why isn’t the Holocene punctuated with recurrent LIAs? This, in turn, leads one to speculation about possible mechanisms, all of which would constitute omitted physics. Because while there is some argument about whether or not the latter 20th century was a Grand Solar Maximum, it was certainly very active, and if global temperatures respond nonlinearly to solar variation, or respond through multiple mechanisms (some of which have been proposed, some of which may exist but not yet been proposed), that constitutes omitted physics in the GCMs that almost by definition is significant physics if it can produce the LIA and perhaps produce the MWP on the flip side of the coin, independent of CO_2.
So while I agree with him that the argument that increasing CO_2 will increase global average temperature is a compelling one, I do not agree that we know how much GAST will increase, or how it will increase, or where it will increases. I do not agree that we know with anything like certainty what the feedbacks are that might augment it or partially cancel it — or even what the collective average sign of those feedbacks are (granted that it might partially augment temperatures in some places and partially reduce them in others, compared to a baseline of only CO_2 based warming). I do not have any confidence at all that the GCMs have the physics right because when I compare them to reality precisely the same way I might compare the results of a quantum structure computation to a set of spectral measurements I find that they seem to be making a systematic error, an error that is in some cases substantial.
Indeed, when I compare the “fully converged” (extensively sampled) predictions of the GCMs to each other I find that they do not agree. They differ substantially in their prediction of total warming at 600 ppm CO_2. Some GCMs produce only around 1.5 C total warming — basically unenhanced CO_2 based warming. Some produce over twice that, down from still earlier models that produced over three and a half times that. As I hope I’ve fairly conclusively shown, all that this shows is that most of the GCMs are definitely wrong simply because they disagree. If I say 3.5 C, and you say 1.5 C, we cannot both be right.
There is precisely one standard for “rightness” in the context of science. It is the same whether or not one is considering the predictions of quantum electronic structure computations or the predictions of the far less likely to be reliable predictions of GCMs. That is to take the predictions and compare them to reality, and use the comparison to rank the models from least likely to be correct (given the evidence so far) to most likely to be correct (given the evidence so far) as well as to identify likely systematic errors in even the most successful models where they systematically deviate from observation.
I really don’t see how anyone could argue with this. A model in CMIP5 that predicts almost 0.6C more warming than has been observed over a mere 20 years (en route to over 3.5 C total warming over the 21st century) has to be less likely to be correct than a model that is in less substantial disagreement with observation, quite independent of what your prior beliefs concerning the models in question were. Including it in a summary for policy makers on an equal footing with models that are in far less substantial disagreement with reality, and without any comment intended to draw that fact to the attention of the policy makers, using that model as part of what amounts to a simple average predicting “most likely” future warming — those aren’t the sins of the GCMs themselves, those are the sins of those who wrote the AR5 SPM, and that without question is highly dishonest.
Or incompetent. It’s difficult to say which.
rgb
co Brian H says:
November 24, 2013 at 12:45 am
rgb;
It is said, a man with one watch knows the time. A man with 2 watches is uncertain. 😉
And a damn good saying it is.
In my physics class, we compute the period of a “Grandfather clock” that uses a long rod with a mass at one end. In fact, we compute it several ways. First, we neglect the mass of the rod and treat the mass at the end (the “pendulum bob”) as a point mass. This gives us a period that we could use to predict the future time as read off that clock. However, this underestimates the moment of inertia of the pendulum bob! The clock will run systematically slow. One has a perfectly good physical model for an estimate of the period, but it made a systematic error by neglecting a piece of physics that turns out to be important, depending on the relative dimensions of the rod and pendulum bob.
But wait! That isn’t right either! We have to include the mass of the rod! That too has a positive contribution to the moment of inertia, but it also makes a contribution to the driving torque! Suddenly, the period of the clock depends on the relative masses of rod and pendulum bob, the length of the rod, and the radius of the pendulum bob, in a nontrivial way! One can end up with a period that is too long or too short, so that a correction made that failed to take the rod into account in detail could have the wrong sign, and indeed particular values for m, M, L and R (as masses and dimensions of rod and a disk-shaped bob centered at L, for example) might lead to the exact same period as the uncorrected simple pendulum.
Now try to correct for the fact that the clock sits in my foyer, and in the afternoon the sun shines in and warms it, lengthening the rod and expanding the pendulum bob, and ever night I turn the thermostat down so that the hall gets cold, but of course on warm nights it doesn’t. Try to correct for the nonlinearity of the spring that restores energy to the pendulum bob against friction and damping. Try to correct for the thermal properties of the spring! All in a predictive model. Eventually it becomes a lot easier to just watch the clock and see what it does, and perhaps try to explain it a posteriori. Physics in many complex systems suffices for us to understand in general what makes the grandfather clock tick, and even helps us to understand the sign and rough contribution of many of the corrections we might layer on beginning with the simplest theory that explains the general behavior, but doesn’t turn out to anticipate the effect of the gradual oxidation of the oil in the gears and the rate that they gum up as ambient dust and metal wear are ground into the clock, or the effect that moving the clock across the room when redecorating has on the assumption of afternoon sunshine, or the effect of tipping it back against the wall with coasters to make sure that it cannot be pulled over onto grandchildren heads. We inevitably idealize in countless ways in physics computations, which is why good engineering starts with the results obtained from as good a model as one can afford, but then builds prototypes and tests them, and refines the design based on ongoing observations rather than betting a billion dollar investment on the prediction of a model program with no intermediate science needed.
The only place I know of where the latter is done is in the engineering of nuclear weapons, post the test-ban treaty. At that point, the US (and USSR, and maybe a few other players) felt that they had enough data to be able to do computational simulations of novel nuclear devices well enough to be able to build them without testing them, and to prevent others who might get the data from being able to do so as well, they made it a federal crime to export a supercomputer capable of doing the computations. Until, of course, ordinary desktop computers got fast enough to do the computations (oops, pesky Moore’s Law:-), first in beowulf clusters and then in single chassis machines. My cell phone could probably do the computations at this point — my kid’s PS3 playstation would have been classified as a munition twenty years ago. But even there, if anyone comes up with a design outside of the range represented by the data they took and the corresponding theory, they run the risk of discovering the hard way that their design, however carefully simulated, is incorrect.
The Bikini test was one example of what happens then. You build what you think is a 5 MT nuclear device and it turns out to be 15 MT and almost kills your observers (and doses all sorts of people with radiation that you didn’t intend to dose). Oops.
rgb
RGB:
I will continue your warning (about clocks, accuracy, and models) with the following “real world” clock problems and “acceptance by recognized Royal Authority and testing” …
Your “real” pendulum must take into effect the friction of the bearings holding that pendulum, metal-metal sliding of the clock “whiskers” and “locks” as they alternately stop and stop motion of the gears, air friction of the pendulum, etc.
What i see happening is that the GCM models do “try” – but they “try” by attacking minutia – such as, in your example, the changing air friction of the pendulum due to changing air density (air density being assumed proportional to air temperature) but not that due to changing air pressure from a cold front coming through or from summer humidity to winter dry cold air changing – not the air density but the wood length and weight of the cabinet and clock foundation alignment! Or taking into account the air density and brass thermal expansion, but ignoring the degradation of grease over time but accounting for laboratory temperature ( but assigning it an assumed constant room temperature at a constant elevation above sea level and thus atmospheric pressure!)
And yet the average of all the GCM’s (Global Clock Models) is claimed more accurate when every Global Clock Model uses a different fudge factor for net clock friction and clock environment.
In our real world, the Royal Astronomer charged by decree by the Royal Navy with approving the first chronometer had a competing – VERY LUCRATIVE! – “theory” of using lunar observations (and their lucrative hundreds of Naval Observatory clerks making lunar observation books and tables for the Royal Navy plus the Royal Navy many thousand pound award itself).
In the real world, this “Royal Astronomer” took apart the first working chronometer, re-assembled it badly and by untrained/uncaring maechanics – not the owner/inventor/builder himself, placed in the chronometer in ever-changing sunshine for months as he mis-used it and mis-wound it and abused it. He tested that chronometer with false conditions and false assumptions, and refused all efforts for an unbiased test with unbiased observers in real world conditions of actual sea voyages being used by real-world but trained navigators. That is, “real” navigators DO take care of their instruments and DO take adequate precautions to avioid deliberate errors and malpractice. On the other hand, they DO make actual errors, but are responsible in noting those errors and making corrections since their lives are actually at stakes. (An impartial observer will see the relationship between – for example – UAH satellite data taking and data tracking and temperature processing corrections being in the open and errors being rapidly acknowledged and corrected, and NASA-GISS/East Anglia/Mann’s data being deliebrately hidden and manipulated!)
The first working chronometer was not really the elaborate first or second model he built (both based on large heavy clockwork assemblies in large boxes and heavy frames) but rather the very, very tiny very. very lightweight “watch” that we know today. Very small means EVERY factor resisting accuracy is made small enough by extreme fabricating every part with enough care and precision that each little factor can be “neglected” in practice. Thus, for example, “grease” and oil isn’t needed because parts are light enough and clean enough that bearings do not need to be lubricated by either. Light weight and very small parts means that friction between restraints and locking parts is also minimized.
Much like the rocket+fuel+structure problem in reverse (a bigger rocket to carry more payload needs a bigger heavier structure to carry more fuel that needs a bigger tank that requires a heavier structural weight that requires more fuel that requires a bigger tank that ….) a smaller, lighter “watch” meant a more accurate chronometer!
Getting that chronometer accepted by the Royal Navy so it could be used also meant that “Royal Authority” and “consensus science” had to be not only ignored, but publicly attacked with publicity and information and accurate knowledge!
rgbatduke says:
November 25, 2013 at 9:21 am [ … ]
Which explains why engineers are every bit as necessary to our current understanding of the world as phycisists and scientists. Maybe even more so.
Empirical knowledge is absolutely necessary in ‘climate studies’. Notice that the alarmist crowd relies primarily on computer models and peer reviewed papers — while skeptics pay attention to what the real world is telling us. They are often not the same thing at all.
The Climate COn is the biggest scam i’ve seen on all my 6 decades, how long do they think they can carry on with this crime, for that is what is truly is.
“….those aren’t the sins of the GCMs themselves, those are the sins of those who wrote the AR5 SPM, and that without question is highly dishonest.”
>>>>>>>>>>>>>>>>>>>>>>>>>>>>>>>>>
You’re an expert and very fair/generous in your explanation and characterization. I’s notable that GCMs are all over estimating warming as far as I can tell. All of them. What’s the probability? What would an Old School pit-boss in Vegas do?
The probability question is backwards. All of them are overestimating the warming, yes. However, predicting the climate isn’t deterministic (as Nick points out above). A perfectly correct model could predict more warming than has been observed, and many of the models do predict as little warming as has been observed when they are run many, many times with small/random perturbations of their initial conditions. The question is, for a given model, how likely is it that the model is correct and we have as little warming as has been observed.
For many of the models, that probability — called the p-value, the probability of getting the data given the null hypothesis “this model is a perfect model of climate” — is very low. In one variation of ordinary hypothesis testing, this motivates rejecting the null hypothesis, that is, concluding that the model is not a perfect model (since one has no choice about the data end of things).
However, statistics per se does not permit you to reject all of the models just because some of the models fail a hypothesis test. On the other hand, common sense tells you that if 30+ models all written with substantial overlap in their underlying physics and solution methodology provide you with 30+ chances to get decent overlap and hence a not completely terrible p-value, you have a good chance of getting a decent result even from a failed model. The possibility of data dredging rears its ugly head, and one has to strengthen the criterion for rejection (reject more aggressively) to account for multiple chances. You also might find grounds to reject the models by examining quantities other than GASTA. A failed model might get e.g. rainfall patterns completely wrong and lower troposphere temperatures completely wrong (wrong enough to soundly reject the null hypothesis “this is a perfectly correct model” for EACH quantity, making the collective p-value even lower) but still (by chance) not get a low enough p-value to warrant rejection considering GASTA alone.
Finally, there is the “Joe the cab driver” correction — which is what you are proposing. This is a term drawn from Nicholas Nassim Taleb’s book The Black Swan, where he has Joe the cab driver and a Ph.D. statistician analyze the (paraphrased) question: “given that 30 flips of a two sided coin have turned up heads, what is the probability that the next flip is heads”. The (frequentist) statistician gives the book answer for Bernoulli trials — each flip is independent, it’s a two sided coin, so 0.5 of the time it should be heads independent of its past history of flips and after ENOUGH flips it will EVENTUALLY balance out.
Joe, however, is an intuitive Bayesian. He doesn’t enter his analysis with overwhelming prior belief in unbiased two-sided coins, so even though he completely understands the Ph.D.’s argument, he uses posterior probability to correct his original prior belief that the coin was unbiased and replies: “It’s a mug’s game. The coin is fixed. You can flip it forever and it will usually come out heads.” Joe, you see, has much sad experience of people who fix supposedly “random” events like coin flips, poker games, dice games, and horse races so that they become mug’s games. In Joe’s experience, the probability of 30 flips coming up heads is 1 in 2^30, call it one in a billion. The probability of encountering a human who wants to play a mug’s game with you is much, much higher — especially if you are approached by a stranger on the street who proposes the game to you (who comes up to you and says things like “given that 30 flips…”?) — maybe as high as 100 to 1. So to Joe, it’s 99.9999% likely that the coin is fixed (you’ve encountered a person who cheats) compared to encountering an unbiased coin just at the end of a 30-head sequence in a long Bernoulli trial.
Is climate currently a mug’s game? Not necessarily. Here you have to balance three things:
a) The climate models are all generally right, but the climate happens to be following a consistent but comparatively unlikely trajectory at the moment, on a run of La Nina-like neutral-to-cooling Bernoulli-trial events (as Nick has proposed).
b) It’s a mug’s game, and the GCMs are written to deliberately overestimate warming so that the nefarious Ph.D.s all keep their funding, so that Al Gore gets rich on climate futures, so that the UN maintains cash flow in a new kind of “tax” to transfer money from the richer nations to the poorer ones (taking graft at all points along the way, why not, no limit to the cynicism you can throw into a mug’s game).
c) The climate models are honestly written by competent Ph.D.s who are trying to do their best and really do believe that their models are correct and the climate is accidentally not cooperating a la a) above, but those scientists are simply wrong, and the best-of-faith models are not correct.
These are not even mutually exclusive alternative hypotheses. Some models could be correct and honestly written, and the climate could be running cooler than it “should” in the sense of somehow averaging over many nearly identically started Earth’s, and it could also be a mug’s game with some of the models written to deliberately exaggerate warming, and the IPCC could well be exploiting those models (and deliberately including them) to line many pockets with carbon taxes even though they are nowhere near as certain of CAGW as they claim, and some of the climate models could be written by honest enough scientists but just happen to do the physics badly — not pursue the computations to a fine enough spatial granularity, for example, or omit a mechanism like the proposed GCR-albedo link that turns out to be crucial all at the same time.
Lots of models, after all, and many people involved in the part that could be a kind of a mug’s game, and not all of them are actual code authors or principle investigators in charge of developing and applying a given GCM.
Accusing people of criminal malfeasance — bad faith, deliberate manipulation of presented information to accomplish an evil purpose (or even a “good” purpose but based on deliberate lies and misrepresentation of the truth) — is serious business. It is something that both sides in this debate do far too freely. Warmists accuse deniers of being stupid and/or in the pay and pockets of the Evil Empire of Energy, where to them “renewable” energy and “green” energy somehow stands for energy that belongs “to the people” instead of being developed, implemented, sold and delivered by exactly the same people they are accusing the deniers of being funded by. Deniers accuse warmists of deliberately cooking up elaborate computer programs designed to show warming for the sole purpose of separating fools from money and at the same time accomplish some sort of green-communist revolution, removing the means of energy production from the rightful hands of the capitalists (instead of nothing that all of the alternative energy sources are being developed, implemented, solid and delivered by exactly the same capitalists that they might think are being shut out). Everybody accuses everybody else of bad faith, lies, coercion, bribery, unelected social revolution, exaggeration, extremism.
This is sadly typical of religious and political disputes, but it has no place in science. That doesn’t mean that scientists need to sit by mute while a mug’s game is played out, but it does mean that scientists need to be very cautious about impugning the motives or honesty of the proponents of a point of view and focus on the objective issues, such as whether or not the point of view is well or poorly supported by the data and our general understanding of science and statistics.
At the moment, one thing that is pretty clear to me is that the current GASTA trajectory is not good empirical support for the correctness of most of the GCMs in CMIP5. One probably cannot reject them all on the basis of
a failed hypothesis test, but one probably should reject some of them, at least unless and until the climate takes a jump back up to where they are not in egregious disagreement by as much as 0.6 C over a mere 20 year baseline. I will even go out on a limb and state clearly that in my opinion, removing the words from the AR5 SPM that more or less implied that and redrawing the figure in such a way as to conceal that and convey the idea that the mean behavior of many GCMs is somehow a valid statistical predictor of future climate was either rank incompetence and misuse of statistics or probable evidence that there is a mug’s game being played here. The latter is absolutely indefensible on the basis of the theory of statistics (and using such things as a “mean of many GCMs” or the “standard deviation of many GCMs” (predicting any given quantity) to compute confidence intervals of a supposed future climate is literally beyond words).
But that doesn’t mean that even one of the GCMs themselves are written in bad faith. It just means that some of them are very probably wrong, and that concealing that fact from policy makers after acknowledging it in an earlier draft is, yes, quite dishonest.
rgb
“But that doesn’t mean that even one of the GCMs themselves are written in bad faith.”
>>>>>>>>>>>>>>>>>>>>>>>>>>>>>>>>>>>>>>>>>>.
Thanks very much for your thoughtful, expert explanation.