 I was recently asked to comment on Stefan Rahmsorf’s post What ocean heating reveals about global warming at RealClimate.
There is a link to a pdf edition of this post at the end.
PRELIMINARY NOTES
As I’ve noted in previous posts, I am not criticizing the efforts by the National Oceanographic Data Center (NODC) to assemble data for its ocean heat content data. It was (and is) a monumental (ongoing) task but there’s simply little source data before the ARGO era. Ocean heat content data is chock full of problems and uncertainties as a result. If the topic of ocean heat content data is new to you, please refer to the very detailed discussions in the post Is Ocean Heat Content Data All It’s Stacked Up to Be? (The WattsUpWithThat cross post is here.) It and other posts are linked throughout this discussion. Also see the heading of Further Reading at the end of the post for additional information.
Stefan occasionally changed topics from ocean heat content to surface temperatures and back again, which is not unusual (I often do it), so when there is a change in the metric being discussed I’ve advised readers.
With that said, let’s examine Stefan’s post about ocean heat content.
IF THE OCEANS ARE WARMING UP…
Stefan writes:
If the oceans are warming up, this implies that the Earth must absorb more solar energy than it emits longwave radiation into space. This is the only possible heat source.
It must be kept in mind that the oceans have their own greenhouse-like effect. (See John L. Daly’s The Deep Blue Sea.) The oceans absorb sunlight (downward shortwave radiation) to depths of about 100 meters, with most of the sunlight being absorbed in the top 10 meters, but the oceans can only release heat at the surface—AND—they release that heat primarily through evaporation. (About 90% of the heat released from the oceans is through evaporation. See the discussion of Figure 3.6 from Chapter 3 of the IPCC’s AR5.) There are also numerous interactions between the atmosphere and ocean that can cause the oceans to warm to depth. Examples: changes in wind patterns (as Stefan later mentions and as discussed later in this post) and periodic decreases in cloud cover (related to naturally occurring coupled ocean-atmosphere processes, like those associated with La Niñas) also cause the oceans to warm to depth. Bottom line: if the oceans are warming (not simply the surface, but to depth), this implies only that the oceans are absorbing more energy (primarily solar energy) than they are releasing (primarily through evaporation). It implies nothing more.
ENERGY IMBALANCE
Stefan continues:
Because we understand the energy balance of our Earth, we also know that global warming is caused by greenhouse gases – which have caused the largest imbalance in the radiative energy budget over the last century.
As we’ve presented and discussed in a couple of posts, an estimate of the radiative imbalance at the surface was recently presented in Stephens et al (2013) An update on Earth’s energy balance in light of the latest global observations. See their Figure 1, which I’ve annotated in my Figure 1. Stephens et al (2013) illustrate an imbalance at the surface of 0.6 watts/meter^2 with an estimated uncertainty of +/- 17 watts/meter^2.

Figure 1
In other words, the imbalance may or may not exist.
THE HIROSHIMA BOMB METRIC
Stefan included the nonsensical “Hiroshima bomb” metric:
The increase in the amount of heat in the oceans amounts to 17 x 1022 Joules over the last 30 years. That is so much energy it is equivalent to exploding a Hiroshima bomb every second in the ocean for thirty years.
But Stefan failed to put it into perspective. As I wrote in Climate Models Fail, based on Stephens et al (2013):
Note: Radiative imbalance is the metric that alarmists like to portray in terms of atomic bombs. What the alarmists fail to tell their readers is that sunlight and natural levels of infrared radiation at the surface are almost 890 times the number of atomic bombs they’re claiming, and that the uncertainties in radiative imbalance are 28 times the radiative imbalance.
9 MILLION TEMPERATURE PROFILES
In an effort to make ocean heat content data sound more credible, Stefan notes the number of temperature profiles in the NODC’s World Ocean Database, which is the source data for ocean heat content.
The data in the graphs comes from the World Ocean Database. Wikipedia has a fine overview of this database. The data set includes nine million measured temperature profiles from all of the world’s oceans.
Stefan forgot to tell his readers a number of things, like, before the ARGO floats were deployed, there are few to no temperature measurements at depths below 1000 meters and most of the measurements at depths of 0-1000 meters were in the Northern Hemisphere. And Stefan has forgotten to advise his readers that ocean heat content data has been adjusted to the point that it no longer resembles the source data. Let’s illustrate those facts:
1. NOAA furnishes graphs of the number of monthly temperature profiles for the global oceans, at various depths, through their “Data Distribution” webpage here. The graphs run from 1979 to 2012. See Figure 2 for the number of profiles at 0-250 meters, 250-500 meters, 500-1000 meters and 1000-5000 meters. Let’s focus on the period before the early-to-mid 2000s, which is the period before the ARGO floats were deployed in quantity. The majority of the samples are at depths of 0-250 and 250-500 meters. There are fewer profiles at depths of 500-1000 meters. And there are comparatively few to no samples at depths of 1000-5000 meters before ARGO.

Figure 2
Ocean heat content source data is confined to the top 1000 meters before ARGO era. Thus, the NODC’s ocean heat content dataset for depths of 0-2000 meters is basically made up of temperature readings from 0-1000 meters, with few readings below 1000 meters.
2. Even the IPCC acknowledges how poorly the ocean temperatures were sampled at depth before ARGO. See their Figure 3.A.2, (my Figure 3). Note that in Figure 3.A.2, the IPCC is not illustrating temperature or ocean heat content. They are illustrating the percentage of the oceans covered by the temperature profiles.

Figure 3
In the Southern Hemisphere (bottom cell), less than 20% of the oceans were sampled at all depths before ARGO era, and at depths greater than 700 meters, the temperature measurements covered only 0 to 5% of the Southern Hemisphere oceans before the early-to-mid 2000s. While in the Northern Hemisphere, the sampling was much better at depths of 0-700 meters.
In other words, the NODC’s ocean heat content data for depths of 0-700 meters is primarily a Northern Hemisphere dataset before the early-to-mid 2000s. Or to phrase it another way, there was basically no coverage of the oceans in the Southern Hemisphere before ARGO.
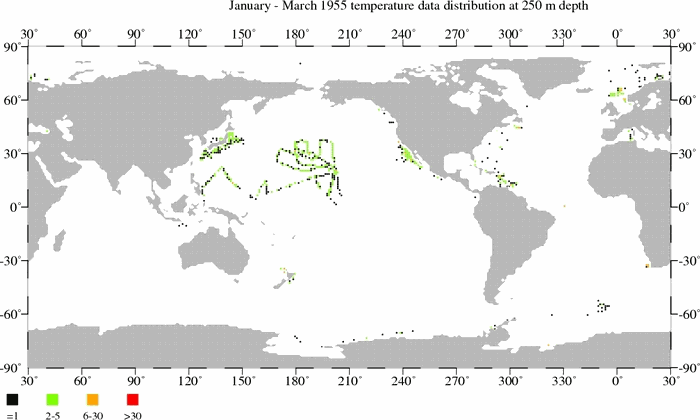
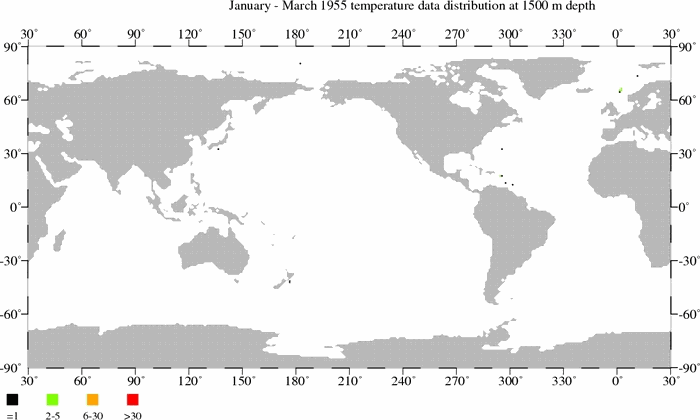
3. Through their webpage here, the NODC publishes maps of the locations of temperature samples, at various depths, for each quarter since January to March 1955. I’ve downloaded them for three depths and created animations so that readers can see how few temperature samples are available for ocean heat content data. The animations are for the depths of 250, 500 and 1500 meters. Each black dot on a map represents one (1) temperature measurement at that depth for a 3-month period. There is also a scale on the maps that explains the number of readings associated with the green, orange, and red dots. Readings at 250 meters and 500 meters, and other depths, are used in the NODC’s data for the depths of 0-700 meters. As you’ll note, global coverage improves with time until the 1990s, but then it worsens until the ARGO floats are released in the early 2000s. You’ll also note that the sampling is better at the 250 meter level than at 500 meters. It’s much, much worse at 1500 meters, which is used for the data for the depths of 0-2000 meters.
The animation files are large, so they may take a few moments to download.
Temperature sample maps at 250 meters (11MB).
Temperature sample maps at 500 meters (9MB).
Temperature sample maps at 1500 meters (6MB).
4. Figure 4 is a graph I prepared for the post UKMO EN3 Ocean Heat Content Anomaly Data Disappeared From The KNMI Climate Explorer As Suddenly As It Appeared. It compares the much-adjusted NODC ocean heat content data for depths of 0-700 meters to the unadjusted UKMO EN3 ocean heat content data. The UKMO EN3 data were only available through the KNMI Climate Explorer for a short time before it was removed. (The NODC ocean heat content data for 0-700 meters are still available through the KNMI Climate Explorer.) The inconvenient rise in the unadjusted ocean heat content in the 1970s could not be explained by climate models (Source of that model-data comparison is here. See page 8.), so the climate science community went in search of reasons (excuses) to delete the unexplainable (by climate models) warming. Note also that the unadjusted ocean heat content during the ARGO era was inconveniently flat and that it too must be adjusted to show warming.

Figure 4
Figure 5 is from the post More on Trenberth’s Missing Heat. It’s similar to the above graph, but in Figure 5 the data are for the depths of 0-2000 meters. The unadjusted UKMO EN3 data to 2000 meters also shows the inconvenient warming during the 1970s, and it also shows the inopportune flattening of the unadjusted data during the ARGO era for the depths of 0-2000 meters.

Figure 5
The 1970s rise in the unadjusted ocean heat content data was inconvenient for the climate science community because it showed that the oceans could warm without being forced to do so by manmade greenhouse gases, or to phrase it another way, it showed that ocean warming to depth was not dependent on anthropogenic forcings. There was another problem the unadjusted data created for global-warming-enthusiast scientists and it was, the global ocean heat was at the same levels in the 1970s as it was in the mid-1990s and as it was in about 2000. See Figures 6 and 7. In other words, ocean heat could remain relatively flat for decades globally, which indicated that increased emissions of manmade greenhouse gases had little impact on ocean warming.

Figure 6
# # #

Figure 7
Notice how highlighting the mid-term flat periods of ocean heat in Figures 6 and 7 also help to bring out the periods of no warming that occurred from the 1950s to about 1970 and later during the ARGO era.
And there were explanations for the early 1970s warming, changes in wind patterns, but more on that later.
THE HEAT CONTENT OF THE OCEANS IS GROWING AND GROWING
Stefan Rahmstorf opens his post at RealClimate with (his boldface):
The heat content of the oceans is growing and growing. That means that the greenhouse effect has not taken a pause and the cold sun is not noticeably slowing global warming.
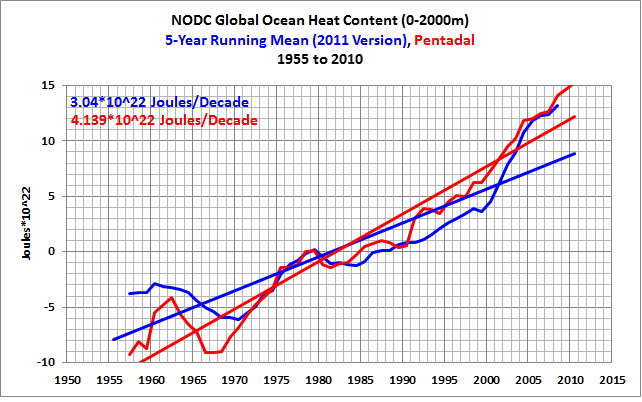
NOAA posts regularly updated measurements of the amount of heat stored in the bulk of the oceans. For the upper 2000 m (deeper than that not much happens) it looks like this:
Change in the heat content in the upper 2000 m of the world’s oceans. Source: NOAA
The amount of heat stored in the oceans is one of the most important diagnostics for global warming, because about 90% of the additional heat is stored there (you can read more about this in the last IPCC report from 2007). The atmosphere stores only about 2% because of its small heat capacity. The surface (including the continental ice masses) can only absorb heat slowly because it is a poor heat conductor. Thus, heat absorbed by the oceans accounts for almost all of the planet’s radiative imbalance.

As illustrated in Figures 6 and 7 above, the unadjusted ocean heat content data for the depths 0-700 meters and 0-2000 meters both show a flattening of ocean warming during the ARGO era. That is, the ocean heat content data for both depths must be adjusted in order for them to show “[t]he heat content of the oceans is growing and growing.”
But let’s look at the much-adjusted NODC ocean heat content, and we’ll focus on the North Atlantic and North Pacific. The following discussion is from the post Ocean Heat Content (0 to 2000 Meters) – Why Aren’t Northern Hemisphere Oceans Warming During the ARGO Era? For that post, I presented data directly from the NODC’s website (NA here is the North Atlantic) and (NP here is the North Pacific). [The figure numbers in the following have been changed for this post.]
NORTH ATLANTIC OCEAN HEAT CONTENT – 0-700 AND 0-2000 METERS
RealClimate recently published a post titled “The Answer is Blowing in the Wind: the Warming Went into the Deep End”. It’s about the Balmaseda et al (2013) paper. There Rasmus Benestad writes about the North Atlantic:
A weakening of the Atlantic meridional overturning circulation (MOC) may have played a role in the deep ocean warming.
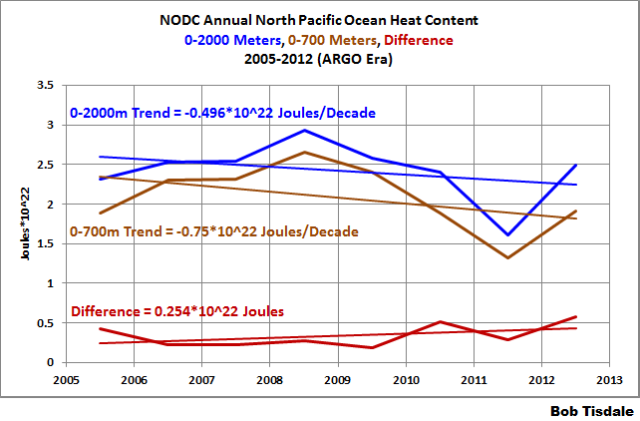
So let’s take a look at the North Atlantic ocean heat content data. Based on the linear trend, the ocean heat content data of the North Atlantic for the depths of 0-2000 meters haven’t warmed from 2005 to 2012. See Figure [8]. And the data for depths of 0-700 meters show cooling in the North Atlantic. The additional warming at the depths of 700-2000 meters (illustrated by the “difference”) was comparable to the cooling at 0-700 meters, inferring there might simply have been an exchange of heat between two depth ranges, but there is no evidence of manmade greenhouse gas-driven warming in the North Atlantic from 2005-2012.
Figure [8]
Also recall that Mauritzen et al (2012) Importance of density-compensated temperature change for deep North Atlantic Ocean heat uptake (paywalled) found that while the upper 2000 meters of the North Atlantic warmed since the 1950s, the deep ocean below 2000 meters cooled, suggesting an exchange of heat between the deep ocean and the depths above 2000 meters. That cooling below 2000 meters is obviously not considered in the NODC ocean heat content data. Mauritzen et al (2012) was discussed in my post Is Ocean Heat Content All It’s Stacked up to Be? under the heading of SPEAKING OF STILL-TO-BE-DISCOVERED SUBSURFACE OCEAN PROCESSES.
NORTH PACIFIC OCEAN HEAT CONTENT – 0-700 AND 0-2000 METERS
There have been a number of blog posts about Balmaseda et al (2013) by proponents of the hypothesis of manmade global warming, including the RealClimate post linked above and at least one post at SkepticalScience. From what I can gather from those posts, Balmaseda et al (2013) are basically saying this: when La Niña events dominate, warm water is forced to depths greater than 300 meters, driven there by the stronger-than-normal trade winds associated with the La Niñas. According to the new and improved Oceanic NINO Index, starting in 2005, there have been 5 La Niña events and only 2 El Niños. Clearly, La Niña events dominated the last 8 years. Therefore, we would expect the ocean heat content of the North Pacific to be showing all sorts of excessive warming.
But the NODC’s annual ocean heat content data for the North Pacific shows cooling, Figure [9], not warming, for the depths of 0-2000 meters. And the depths of 0-700 meters have cooled at an even more drastic rate. If the stronger trade winds associated with the La Niña events have contributed to the warming of the North Pacific ocean heat content from 700-2000 meters (shown as the “difference”), then the only thing those stronger trade winds did was prevent the 0-2000 meter data from cooling as quickly as the 0-700 meter data.
Figure [9]

Bottom line: The much-adjusted NODC ocean heat content data for the North Atlantic and North Pacific do not show, as Stefan wrote, “[t]he heat content of the oceans is growing and growing.” Or in other words, ““[t]he heat content of the oceans is growing and growing”, but only in the Southern Hemisphere oceans. That’s inconvenient for the hypothesis of human-induced global warming, because carbon dioxide is said to be a well-mixed greenhouse gas. If the Northern Hemisphere oceans are not being warmed by manmade greenhouse gases, then there is no reason to assume the warming in the Southern Hemisphere is being caused by manmade greenhouse gases.
HOW TO DENY DATA
Under the heading of “How to deny data”, Rahmstorf writes:
Ideologically motivated “climate skeptics” know that these data contradict their claims, and respond … by rejecting the measurements. Millions of stations are dismissed as “negligible” – the work of generations of oceanographers vanish with a journalist’s stroke of a pen because what should not exist, cannot be. “Climate skeptics’” web sites even claim that the measurement uncertainty in the average of 3000 Argo probes is the same as that from each individual one. Thus not only are the results of climate research called into question, but even the elementary rules of uncertainty calculus that every science student learns in their first semester. Anything goes when you have to deny global warming. Even more bizarre is the Star Trek argument – but let me save that for later.
I’ll let you comment on “Ideologically motivated ‘climate skeptics’”.
The first post Stefan linked (dismissed as “negligible”) was written in German. The Google translation to English is here.
I believe Stefan ignored one of the primary points illustrated in the post at JoNova’s that he linked here. The change in temperature of the oceans to depth IS “negligible”.
I’ve also illustrated this in recent posts. See my post Rough Estimate of the Annual Changes in Ocean Temperatures from 700 to 2000 Meters Based on NODC Data. As shown in Figure 10, for the depths of 0-700 meters, the annual variations are measured in hundredths of a degree C., and when compared to the annual variations in sea surface temperatures, for example, the variations in the temperature of the global oceans to depths of 0-700 meters are “negligible”.

Figure 10
And for the depths of 700-2000 meters, the annual variations are measured in thousandths of a degree C. Those variations are so minute, so minuscule, we have to isolate them from the other data to see the changes. See Figure 11.

Figure 11
We’ve also compared on a time-series basis, Figure 12, the long-term warming of global land plus sea surface temperature anomalies, sea surface temperature anomalies, vertically averaged temperature for the depths of 0-700 meters, and vertically averaged temperature for the depths of 700-2000 meters. Compared to the sea surface temperature and global land plus sea surface temperatures, the long-term warmings at 0-700 meters and 700-2000 meters are “negligible”.

Figure 12
In past posts (here and here), we showed that the NODC increases the warming rate of their ocean heat content data by presenting their data in pentadal form. See the comparison graphs at depths of 0-700 meters (here) and 0-2000 meters (here). But let’s forget for a moment that the NODC’s pentadal data mysteriously exaggerates the warming rate.
Since 1955, the NODC’s pentadal vertically average temperature data show the oceans warmed at a rate of 0.0044 deg C/decade for the depths of 700-2000 meters. See Figure 13. That’s 44 ten-thousandths of a deg C/decade.

Figure 13
44 ten-thousandths of a deg C/decade is of the “who cares?” order of magnitude. It’s not coming back to haunt anyone at any time.
SIDE NOTE: And as I discussed in the post here [Figure number updated for this post]:
THE NODC’S HOCKEY STICK WHEN THEY TRANSITION TO ARGO DATA
Figure [14] presents the vertically averaged temperature anomalies for the global oceans for the depths of 700-2000 meters. They warm at a relatively constant and very slow rate until the ARGO floats begin the have complete coverage of the global oceans around 2003. Then they warm at a rate that’s almost 24 times faster than the rate seen in the 5 decades leading up to it.
Figure [14]
It doesn’t look very realistic, now, does it?

And from the closing of that post:
The vertically averaged temperatures for the depths of 700-2000 meters can be approximated from their data for the depths of 0-700 and 0-2000 meters. It shows a very sudden shift in the rate of warming for depths of 700-2000 meters. The shift coincides with the introduction of the ARGO floats to rarely sampled portions of the global oceans—the mid-to-high latitudes of the oceans of the Southern Hemisphere, for example. This suggests that the warming presented by the data at those depths may result from the more-complete sampling of the global oceans.
ASSOCIATION WITH EL NIÑO
Under the heading of “Association with El Niño”, Stefan Rahmstorf switches to the topic of surface temperatures and begins his discussion:
Completely independently of this oceanographic data, a simple correlation analysis (Foster and Rahmstorf ERL 2011) showed that the flatter warming trend of the last 10 years was mostly a result of natural variability, namely the recently more frequent appearance of cold La Niña events in the tropical Pacific and a small contribution from decreasing solar activity.
We discussed in great detail the flaws in the Foster and Rahmstorf’s “simple correlation analysis” in Revised Post – On Foster and Rahmstorf (2011), and we discussed their follow-up paper in the post Rahmstorf et al (2012) Insist on Prolonging a Myth about El Niño and La Niña. Please refer to those posts for discussions of the long-term impacts of El Niño and La Niña events.
And as we discussed in the post SkepticalScience Now Argues Against Foster & Rahmsorf (2011), even SkepticalScience disagrees with the methods used by Foster and Rahmstorf (2011). See the SkepticalScience post Has the rate of surface warming changed? 16 years revisited. Skeptical Science writes (my boldface):
The video was based on an approach pioneered by Lean and Rind (2008) and Foster and Rahmstorf (2011), by determining the contribution of known influences on global temperature to best explain those temperatures. However this approach can give misleading results if significant influences on temperature are missing from the analysis, or if wrong influences are included.
Even the global warming enthusiasts from SkepticalScience are distancing themselves from Foster and Rahmstorf.
Additonally, there’s something very obviously missing from Rahmstorf’s discussion of El Niño and La Niña in a post about ocean heat content. Stefan Ramstorf failed to illustrate the impacts of La Niñas and El Niños on the portion of the oceans where they take place—the tropical Pacific. (Now we’re switching back to ocean heat content.)
The NODC’s ocean heat content data for the tropical Pacific (24S-24S, 120E-80W), for the depths of 0-700 meters, since 1955, is presented in the left-hand graph of Figure 15. The warming of ocean heat content for the tropical Pacific is dependent on La Niña events, which are fueled by La Niña-caused increases in sunlight. Note that the ocean heat content cools there over the multidecadal periods between the 1954-57 and 1973-76 La Niñas and between the 1973-76 and 1995/96 La Niñas. It’s tough to claim manmade greenhouse gases are causing warming when the ocean heat is cooling for multidecadal periods in the tropical Pacific.
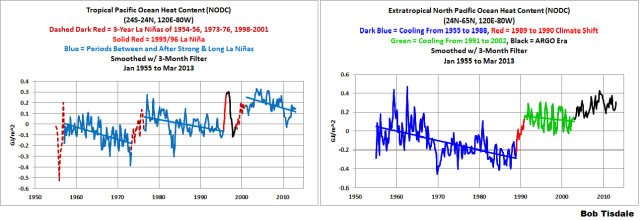
Figure 15
The strong El Niño events of 1972/73, 1982/83, 1997/98 and 2009/10 make their presence known as the sharp drops in tropical Pacific ocean heat content, because El Niño events can release tremendous amounts of heat into the atmosphere, primarily through evaporation. Ocean currents also carry warm water away from the tropical Pacific at the end of an El Niño.
The ocean heat content data for the tropical Pacific helps to confirm that the processes of La Niña and El Niño events combine to act as a chaotic, naturally occurring, sunlight-fueled, recharge (La Niña)-discharge (El Niño) oscillator.
Let’s move on to the adjoining area of the North Pacific. In the right-hand graph of Figure 15 is the NODC ocean heat content data for the extratropical North Pacific (24N-65N, 120E-80W), 0-700 meters, also starting in 1955. From 1955 to 1988, the ocean heat content of the extratropical North Pacific cooled. In other words, there was no warming associated with manmade greenhouse gases from 1955 to 1988. And it’s also blatantly obvious that the warming there depends on the shift that occurred in 1988/89, which corresponds to a shift in wind patterns (and sea level pressure) in the extratropical North Pacific.
NOTE: If the subject of the natural warming of the global oceans is new to you, refer to the illustrated essay “The Manmade Global Warming Challenge” (42MB) for an introductory discussion.
So the data for two portions of the Pacific Ocean show no evidence of human-induced global warming. The locations of those regions are illustrated on a map here. And in the extratropical South Pacific, there is so little source data that they’re not worth plotting in this exercise. Now, here’s the interesting effect. As I noted in the post, Untruths, Falsehoods, Fabrications, Misrepresentations — Part 2:
When we combine the two Pacific subsets (which show no evidence of human-induced global warming) and compare them to global ocean heat content (which is presented by alarmists as proof of human-induced global warming), we find that the long-term warming of the global data mimics the combination of the two Pacific subsets. See Figure [16]. The tropical Pacific and the extratropical Pacific combined cover about 34% of the global oceans. More than one-third of the oceans to depths of 700 meters show no evidence of human-induced global warming since 1955, yet we’re being told that manmade greenhouse gases are responsible for the warming of global ocean heat content.
Figure [16]

Don’t worry. I haven’t forgotten all of the additional long-term warming shown in the ocean heat content data for the North Atlantic. We’ll discuss it later in the post.
TRENBERTH SAYS
Toward the end of the discussions under the heading of “Association with El Niño”, Stefan Rahmstorf refers to Balmaseda et al (2013), of which Kevin Trenberth was co-author, and Stefan refers to Kevin Trenberth’s article for the Royal Meteorological Society Has Global Warming Stalled?:
Kevin Trenberth, who has recently published a paper on this topic, explains the increased heat uptake in the deep ocean…
We discussed Trenberth’s article in the post Open Letter to the Royal Meteorological Society Regarding Dr. Trenberth’s Article “Has Global Warming Stalled?” That post includes a discussion of Balmaseda et al (2013). We also discussed Balmaseda et al (2013) in other posts, including:
· Trenberth Still Searching for Missing Heat
· More on Trenberth’s Missing Heat
· Even More about Trenberth’s Missing Heat – An Eye Opening Comment by Roger Pielke Sr.
Stefan goes on to quote Trenberth’s article for the Royal Meteorological Society:
The reason for the change is a specific change in the winds, especially in the subtropical Pacific, where the trade winds have become noticeably stronger. That altered ocean currents, strengthening the subtropical sea water circulation thus providing a mechanism to transport heat into the deeper ocean. This is related to the decadal weather pattern in the Pacific associated with the La Niña phase of the El Niño phenomenon.
I discussed that quote in great detail in the post Open Letter to the Royal Meteorological Society Regarding Dr. Trenberth’s Article “Has Global Warming Stalled?” so there is no need to do so again here. But two statements from that post are important:
A clarification: What Dr. Trenberth has written may lead some persons to believe that the shift in the trade winds is unusual, when, in fact, variations in trade wind strength are parts of the coupled ocean-atmosphere processes that drive El Niño and La Niña events…
And:
…the warm water created by La Niña processes, released by El Niños, and redistributed by the trailing La Niñas is warmed in response to increases in sunlight during the La Niñas, not by infrared radiation. Changes in cloud cover associated with the coupled ocean-atmosphere processes of El Niño and La Niña are the primary reasons for the variations in sunlight.
In the linked “Open Letter” post, I presented data, scientific studies, and a quote from an earlier paper by Kevin Trenberth to confirm that La Niña-created increases in sunlight are what fuels El Niño events…and any increases in subtropical ocean heat content that may arise during periods of La Niña dominance.
NEW RESULTS FROM CLIMATE MODELLING
For this part of his post, Stefan Rahmstorf has switched once again to surface temperatures. Stefan writes:
A study by Kosaka and Xie recently published in Nature confirms that the slowing rise in global temperatures during recent years has been a result of prevalent La Niña periods in the tropical Pacific. The authors write in the abstract:
Our results show that the current hiatus is part of natural climate variability tied specifically to a La Niña like decadal cooling.
Stefan overlooked what’s indicated by the satellite-enhanced sea surface temperature data (Reynolds OI.v2). I’ve been illustrating this for years. In the left-hand graph of Figure 17, we can see that the sea surface temperatures of the East Pacific have warmed little, if at all, over nearly the past 32 years…since the start of the Reynolds OI.v2 sea surface temperature dataset in November 1981. The East Pacific (90S-90N, 180-80W) covers about 33% of the surface of the global oceans. In the right-hand graph are the sea surface temperature anomalies of the South Atlantic, Indian and West Pacific oceans. The coordinates are listed in the title block. They cover more than 50% of the surface of the global oceans. We can see a number of things in the sea surface temperature data for the South Atlantic, Indian and West Pacific oceans: (1) their long-term warming depends on the El Niño events of 1986/87/88 and 1997/98 (and possibly the El Niño of 2009/10); (2) they do not cool proportionally during the transition to the trailing La Niñas of 1988/89 and 1998-01; but (3) they do cool slightly over the decade-long periods between the El Niño events of 1986/87/88 and 1997/98 and between the 1997/98 and 2009/10 El Niños.

Figure 17
Again, for an introductory discussion of the natural warming of the global oceans refer to the illustrated essay “The Manmade Global Warming Challenge” (42MB).
The sea surface temperatures of the North Atlantic are governed by another mode of natural variability called the Atlantic Multidecadal Oscillation or AMO. It’s the reason why the sea surface temperatures there warmed at a much higher rate than the rest of the global oceans from the mid-1970s to the early-2000s. But the sea surface temperature data for the North Atlantic indicate the AMO may have already peaked. See Figure 18. If history repeats itself, and there is no reason to believe it will not, then the sea surface temperatures of the North Atlantic will show no warming and actually cool for a few more decades, assuming the Atlantic Multidecadal Oscillation has, in fact, peaked.
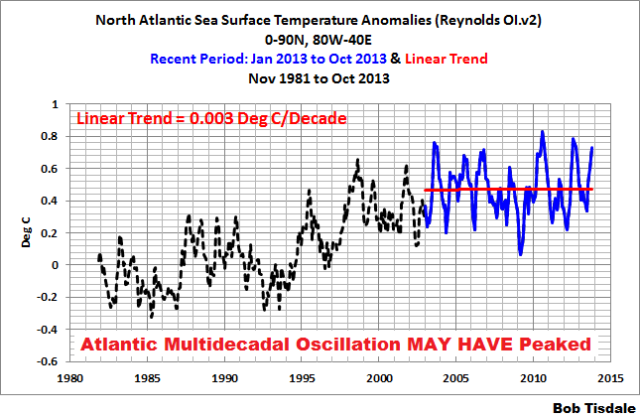
Figure 18
Note: For further information about the Atlantic Multidecadal Oscillation, see NOAA’s AOML (Atlantic Oceanographic and Meteorological Laboratory) Frequently Asked Questions webpage here, and my blog post here and my introduction to the Atlantic Multidecadal Oscillation here.
SEA SURFACE TEMPERATURE DATA INDICATE GLOBAL WARMING WILL CONTINUE WHEN…
The sea surface temperature data indicate that global warming will continue when the next strong El Niño releases sunlight-created warm water from beneath the surface of the West Pacific Warm Pool and ocean currents distribute that warm water into the South Atlantic, Indian and West Pacific oceans at the end of that El Niño. But much will also depend on how the North Atlantic responds to that strong El Niño. If the sea surface temperatures of the North Atlantic are cooling, while those of the South Atlantic, Indian and West Pacific oceans are warming, global sea surface temperatures could remain relatively flat in response to the next strong El Niño.
BEAM ME UP, SCOTTY!
We’re back discussing ocean heat content data again.
Under the heading of “Beam me up Scotty”, Stefan Rahmstorf writes and illustrates:
Second, physically there is absolutely no problem for wind changes to cool the upper ocean at the same time as they warm the deeper layers. The following figure shows a simple example of how this can happen (there are also other possible mechanisms).
The ocean is known to be thermally stratified, with a warm layer, some hundreds of meters thick, lying on top of a cold deep ocean (a). In the real world the transition is more gradual, not a sharp boundary as in the simplified diagram. Panel (b) shows what happens if the wind is turned on. The surface layer (above the dashed depth level) becomes on average colder (less red), the deep layer warmer. The average temperature changes are not the same (because of the different thickness of the layers), but the changes in heat content are – what the upper layer loses in heat, the lower gains. The First Law of Thermodynamics sends greetings.

That’s a great way to introduce the Lozier et al (2008) paper The Spatial Pattern and Mechanisms of Heat-Content Change in the North Atlantic and to the January 2008 article in ScienceDaily about that paper titled North Atlantic Warming Tied to Natural Variability. The ScienceDaily article includes:
“We suggest that the large-scale, decadal changes…associated with the NAO [North Atlantic Oscillation] are primarily responsible for the ocean heat content changes in the North Atlantic over the past 50 years,” the authors concluded.
As I discussed in the post Is Ocean Heat Content Data All It’s Stacked up to Be?, the ScienceDaily article was very clear that something other than manmade greenhouse gases was primarily responsible for all of the warming experienced in the ocean heat content of the North Atlantic. And it was the winds associated with the North Atlantic Oscillation. The ScienceDaily article continued:
By contrast, NOA[sic]-driven winds served to “pile up” sun-warmed waters in parts of the subtropical and tropical North Atlantic south of 45 degrees, Lozier said. That retained and distributed heat at the surface while pushing underlying cooler water further down.
The illustration above provided by Stefan Rahmstorf helps to show this effect.
The best part of Lozier et al (2008) was that they used the older version of the ocean heat content data, the “unadjusted” data with the sharp rise in the 1970s. See Figure 19. Also keep in mind that Lozier et al were not saying that the North Atlantic Oscillation was responsible for the additional warming in the North Atlantic; they were saying it was responsible for ALL of the warming in the North Atlantic.

Figure 19
And as I pointed out in the post Is Ocean Heat Content Data All It’s Stacked up to Be?, the North Pacific Index, which is associated with wind patterns in the North Pacific, also has the sharp change in the early 1970s, like the ocean heat content there did originally, before the climate science community deleted the inconvenient 1970s warming. See Figure 20.

Figure 20
In other words, there were very logical explanations for the sharp rise in global ocean heat content in the early 1970s, yet the climate science community chose to delete the inconvenient data. This was discussed in more detail under the heading of COULD THE 1970s-80s HUMP HAVE BEEN EXPLAINED? in the post Is Ocean Heat Content Data All It’s Stacked up to Be?
Bottom line: Regardless of whether or not the 1970s sharp rise in ocean heat content existed, Stefan Rahmstorf confirmed that changes in wind patterns can cause ocean heat content to warm. He also noted that “there are also other possible mechanisms”, but he elected not to discuss them.
ARGO-ERA OCEAN HEAT CONTENT TRENDS AND UPDATED ANIMATION
Figure 21 is a map that illustrates the warming and cooling rates of global ocean heat content, for depths of 0-700 meters, from 2005 to 2012. As you’ll recall, the NODC uses this as the ARGO era. Note the spatial patterns of warming and cooling, especially in the Pacific and Indian Oceans.

Figure 21
I presented an animation of ARGO-era ocean heat content anomaly maps in the post Is Ocean Heat Content Data All It’s Stacked up to Be? I’ve updated it for this post in Animation 1. The animation starts in 2004 to provide a short lead-in before 2005. You can watch warm water that’s left over from the El Niños being passed from the tropical Pacific into the Indian Ocean during the trailing La Niñas by the current called the Indonesian Throughflow. That leftover warm water counteracts any cooling that would result during the trailing La Niñas due to changes in atmospheric circulation. Note also how the leftover warm water also migrates to the South Pacific Convergence Zone, which is east of Australia and New Zealand.

Animation 1 (You may need to click start it.)
If and when the climate science community can account for the sunlight-created warm waters distributed from the tropical Pacific by ENSO that create the warming and cooling trends shown in Figure 21, they may be able to realistically explain why the oceans warm to depth. Until that time, they are simply assuming, wrongly, that manmade greenhouse gases are the primary cause of the warming of the global oceans.
LOOKS LIKE SUNLIGHT AT THE OCEAN SURFACE HAS ALSO INCREASED SINCE 1979!
We’ve been told numerous times that only infrared radiation from increased emissions of manmade greenhouse gases could be responsible for the warming of the global oceans. Figure 22 is Figure 5 from Pinker et al (2005) Do Satellites Detect Trends in Surface Solar Radiation? They showed solar radiation at the surface of the oceans increasing at a rate of 0.24 watts/m^2 from 1983 to 2001.

Figure 22
I first presented Pinker et al (2005) in the post The Sun Was in My Eyes – Was It More Likely Over the Past 3-Plus Decades? I also presented downward shortwave radiation from the NCEP-DOE Reanalysis-2 for the period of Jan 1979 to Mar 2013. See Figures 23 and 24.

Figure 23
# # #

Figure 24
Now consider that solar radiation penetrates the oceans to about 100 meters, with most solar radiation being absorbed in the top 10 meters, while infrared radiation from manmade greenhouse can only penetrate the top few millimeters. And according to the NOAA Annual Greenhouse Gas Index, infrared radiation from manmade greenhouse gases increased at a rate of 0.34 watts/meter^2 from 1979 to 2012 (Figure 25), so, based on the penetration of sunlight versus infrared radiation into the oceans, the contribution of the increase in sunlight at the surface of the oceans would be many orders of magnitude greater than that of infrared radiation from manmade greenhouse gases.

Figure 25
It’s pretty obvious why Stefan Rahmstorf failed to include this topic in his post at RealClimate.
FURTHER READING
In addition to Is Ocean Heat Content Data All It’s Stacked up to Be?, I’ve linked a number of past posts during this discussion. Just in case you’ve overlooked them (which is easy in a post this large) here are links to recent ocean heat content-related posts, with links to the cross posts at WattsUpWithThat in parentheses.
· NODC’s Pentadal Ocean Heat Content Data (0-2000m) Creates Warming That Doesn’t Exist in the Annual Data – A Lot of Warming (WattsUpWithThat cross post here)
· Trenberth Still Searching for Missing Heat (WattsUpWithThat cross post here)
· More on Trenberth’s Missing Heat (WattsUpWithThat cross post here)
· A Different Perspective on Trenberth’s Missing Heat: The Warming of the Global Oceans (0-2000 Meters) in Deg C (WattsUpWithThat cross post here)
· Ocean Heat Content (0-2000 Meters) – Why Aren’t Northern Hemisphere Oceans Warming During the ARGO Era? (WattsUpWithThat cross post here)
· Even More About Trenberth’s Missing Heat – An Eye Opening Comment by Roger Pielke, Sr. (WattsUpWithThat cross post here)
· Rough Estimate of the Annual Changes in Ocean Temperatures from 700 to 2000 Meters Based on NODC Data (WattsUpWithThat cross post here)
· AMAZING: The IPCC May Have Provided Realistic Presentations of Ocean Heat Content Source Data (WattsUpWithThat cross post here)
Ocean heat content data and satellite-era sea surface temperature data indicate the oceans warmed via natural ocean processes, not from manmade greenhouse gases. This has been addressed in dozens of blog posts here and in cross posts at WattsUpWithThat for almost 5 years. I further discussed this in minute detail in my book Who Turned on the Heat? It is only available in .pdf form. A preview is here. Who Turned on the Heat? is described further in, and is available for sale through, my blog post “Everything You Ever Wanted to Know About El Niño and La Niña”.
The natural warming of the global oceans was also discussed in Section 9 of my more recent ebook Climate Models Fail. See the preview and table of content here.
Sales of my ebooks (and tips) allow me to continue my research into human-induced and natural climate change and to continue to blog here at Climate Observations and at WattsUpWithThat?
CLOSING
There really wasn’t anything new in Stefan Rahmstorf’s post at RealClimate. It was full of the typical propaganda we’ve come to expect from global warming enthusiasts. In fact, we’ve addressed the subjects he’s covered in past posts, so this post was basically a rehashing, with lots of links to past posts that provide more detail.
I’ll close this post with two quotes about ocean heat content data and my comments about them. Both quotes appeared in the post Is Ocean Heat Content Data All It’s Stacked up to Be?
The first:
The Woods Hole Oceanographic Institution webpage The Ocean’s Role in Climate is a transcript of Raymond Schmitt’s testimony before congress, in 2000, when the climate science community was looking for funding for the ARGO program. (Note: when Raymond Schmitt says, “…we have in place a system for monitoring El Niño,” he is referring to NOAA’s Tropical Atmosphere-Ocean (TAO) project. The TAO Project includes a group of moored ocean and atmosphere “weather stations” across the tropical Pacific that NOAA began installing in the late 1980s and completed it in early 1990s. The TOA buoys monitor numerous variables related to El Niño and La Niña events.)
In the following, Raymond Schmitt is obviously discussing ocean heat content data during the period before ARGO. See Figures 2 and 3 above. Here’s the quote (my boldface):
Observing Deficiencies
While we have in place a system for monitoring El Nino, we have no such ability to observe the motions of thermal anomalies in the mid- and high latitude oceans. Nor do we monitor the salt content of ocean currents, to determine the potential for deep convection or to help understand the vast water cycle over the oceans. But new technology, the vertically profiling ARGO float (Figure 4 [not included].), promises to give us the data we need to begin to understand this largest component of the global water cycle. These are like weather balloons for the ocean, drifting at depth for 10 days then rising to the surface to report profiles of temperature and salinity to a satellite. They then resubmerge for another 10 day drift, a cycle to be repeated 150 times or more.
I’ve updated and clarified my comment from the “stacked up to be” post as follows: So, as of 2013, we’ve had in place a “new technology” for about a decade that “promises to give us the data we need to begin to understand this largest component of the global water cycle”. Now consider that there are known ocean climate processes that portray themselves in the sea SURFACE temperatures of the North Atlantic and North Pacific, and that we have reasonably complete sea SURFACE temperature records stretching back to the late 1800s. These ocean climate processes portray themselves as modes of natural variability with patterns in time that last for 50 to 80 years. Can we hope now, with only 10 years of reasonably complete subsurface temperature and salinity data, to understand the impacts of those multidecadal processes on ocean heat content? The realistic answer is no.
The second quote:
It’s from Paul Voosen’s article Provoked scientists try to explain lag in global warming. Paul Voosen included quotes from NCAR’s Kevin Trenberth:
Trenberth questions whether the Argo measurements are mature enough to tell as definite a story as Hansen lays out. He has seen many discrepancies among analyses of the data, and there are still “issues of missing and erroneous data and calibration,” he said. The Argo floats are valuable, he added, but “they’re not there yet.”
And as I noted in the earlier post:
ARGO floats have provided reasonably complete coverage of the global oceans since 2003-04, and the installation was complete in 2007. But as late as 2011, Kevin Trenberth’s opinion was that they provided limited value due to “missing and erroneous data and calibration”.
The bottom line of those two quotes: ocean heat content data before the ARGO floats are of very limited value, and ocean heat content data based on ARGO floats are so riddled with problems they too are questionable.
But even with all of the problems with, and adjustments to, the ocean heat content data, “What ocean heat content data reveal about global warming” (to modify the title of Stefan Rahmstorf’s post) is that the oceans warmed primarily via natural processes and forcings, not via manmade greenhouse gases.
PDF EDITION OF THIS POST
Due to the length of this post, I’ve created a pdf edition here.
“Stefan writes:
If the oceans are warming up, this implies that the Earth must absorb more solar energy than it emits longwave radiation into space. This is the only possible heat source.”
Total nonsense. We’re living on a planet that consists of molten rock, with a core a molten metal.
Consider eg the eruption of 100.000.000 km^3 hot magma into the oceans as another heat source.
http://en.wikipedia.org/wiki/Ontong_Java_Plateau
No wonder the dinosaurs had a nice, warm climate.
Ben,
+10
Climate science has made some progress. At one time they were claiming that El Nino La Nina were the result of forcings and had no net effect on temperatures. Now that temperatures have flat-lined and thrown their predictions of warming under the bus, it is all El Nino La Nina. The oceans ate my lunch.
So, the surface energy imbalance is 0.6 +- 17. Somewhere between -16.4 and 17.6. Doesn’t zero lie in that range? Why even say the value is 0.6 if the error is 30 time larger? Isn’t the more accurate number 0 +- 17? Why even bother with the decimal when the error is so much larger?
How come the energy imbalance calculation doesn’t include a term for the ocean mixing rate? If you increase the ocean mixing rate you will cool the surface. If you reduce the mixing rate you will warm the surface. This effects surface temps and therefore the energy budget. Could it be that an oscillation in the mixing rate on a period of 50-80 years is what drives the repeated cycles of cooling then warming we have seen over the past 100+ years?
Ben Wouters says:
November 13, 2013 at 3:28 am
“Consider eg the eruption of 100.000.000 km^3 hot magma into the oceans as another heat source.
http://en.wikipedia.org/wiki/Ontong_Java_Plateau
”
Thanks, very interesting. I looked at it with Google Earth; go to the Solomon Islands / Santa Isabel and look at the ocean floor profile. It’s gigantic.
The Hiroshima bomb metric is actually a very valuable and reliable indicator. It shows the person invoking it has abandoned accepted scientific measures in favor of advocacy, and that he or she may be ignored. With such a bias, any conclusions they reach will be reliably wrong.
Supporting anything they advocate would be, and has been, dangerous and costly.
Ben Wouters says:
November 13, 2013 at 3:28 am
Total nonsense. We’re living on a planet that consists of molten rock, with a core a molten metal.
==========
Agreed. In scale, the crust of the earth is thinner than the skin of an apple. Under the thin skin, the apple is molten rock.
Most folks think that the oceans rest on top of the earth’s crust, like water in a swimming pool. This is incorrect. The oceans extend well below the bottom of the ocean basins. They saturate the earths crust and descent towards the interior until they reach the boiling point of water under high pressure (600-800C). At which point they can descend no further.
Without the molten core of the earth to hold them in place via steam pressure, earth’s oceans would have long ago drained into the interior and the surface of the planet would be dry.
It is at this boundary layer that limestone (fossilized CO2) and steam are reduced in the presence of iron to produce hydrocarbons. Being lighter than water these percolate upwards toward the surface and are occasionally captured by rock formations. Otherwise the hydrocarbons are released to the atmosphere and digested by bacteria to continue that carbon cycle necessary for life.
Glenn Dixon says:
November 13, 2013 at 4:05 am
The Hiroshima bomb metric is actually a very valuable and reliable indicator. It shows the person invoking it has abandoned accepted scientific measures in favor of advocacy, and that he or she may be ignored.
============
spot on. how many hiroshima bombs does it take to equal the sun. yet billions of people are exposed to it every day.
Let’s remember where this ‘need ‘ for ocean heat came from, the total failure of the models to actual work when it came to prediction. The ‘missing ‘ heat is a function of the ‘the causes ‘ failure. As for Stefan Rahmsorf’s work , it’s a PR exercise with added ‘data’ it is designed to blind people with ‘science’ so they do see how bad the actual facts are for the authors claims
An imbalance of 0.6 +/- 17W/m^2? Coming from an engineering background, I honestly can`t think of an appropriate use for such a wide tolerance. It is almost laughable in its uncertainty.
Is unequivocalness a word? If not, I think we have just found a use for such a word.
There is no greenhouse effect- by definition the earth’s climate is a convection system which means complicated negative and positive feedback loops, cycles, interactions. If it was a greenhouse there would be no life here – period. Venus is a pure greenhouse with the atm. circa 95% Co2 gas by weight. In fact Venus is really ‘the model’ that the eco-mmunists are using as the basis of their fear mongering and non-science. The only problem is that we have 4/100 of 1 % Co2 by atm. gas weight……a rather massive delta.
So…More SW hitting the oceans, I would suspect from reduced cloudiness over the oceans during the la nina and neutral ENSO phases, which heats the ocean a negligible amount. Thanks for the post Bob.
Trenberth- “”The Argo floats are valuable, he added, but “they’re not there yet.””
But isn’t Trenberth relying on Argo deep ocean data to demonstrate the location of his missing heat?
And aren’t the deep ocean temperature anomalies, being a few thousands of a degree C, buried in the uncertainty of the Argo floats, and represent the least reliable portion of the Argo dataset?
And if the heat is being absorbed in the deep oceans, where it changes temperatures by trivial amounts, does it even matter?
In other words, is Trenberth deliberately using what he considers to be unreliable, noisy data to confirm his hypothesis and scare the public about absolutely trivial changes in ocean heat content?
Most problematic for those who insist that the oceans are swallowing the extra heat, is the time scales this hypothesis introduces into the equation. IF the ocean is storing up this heat, how long does it hold it? It would introduce the strong possibility that all the warming from 1970 to 1998 is due to processes that occurred long ago, But “Real” Climate alarmists / rent seekers cannot allow themselves to think in those terms. The propaganda narrative regarding human fossil fuel emissions would need to be given up immediately.
There might be something really fishy about how this “Ocean content” is calculated and made up. It would for sure need some more verification using the raw, unchanged data from the actual captors. By reading between the lines, we already find hints about where the groundings for this indicator gets really oily:
There are other possibilities about where the planet’s radiative imbalance might get even. Had a thought about it between the morning tea and the shower, but didn’t write down these thoughts yet. Well, there are plenty of smarter individuals arround the planet for it, so i’m not really needed in the process anyway.
Galvanize:
At November 13, 2013 at 4:38 am you say
Indeed so.
The only certain statements concerning such an imbalance are
1.
The imbalance is assessed to probably be some value between -16.4 and -17.6 W/m^2
and, very importantly,
2.
The imbalance cannot be discerned to be different from zero.
Richard
Ooops! typo! Sorry.
Of course I intended to write
The imbalance is assessed to probably be some value between -16.4 and +17.6 W/m^2
Richard
Since the imbalance is just 0.6 W/m2 (+/-?), then we can throw all the GHG/Anthro forcing numbers because they are more than 5 times higher and seem to be irrelevant.
If the TOA imbalance/net global energy accumulation is NOW the important metric, then why have they spent all their time taking about GHG forcing. Higher than normal Solar energy in the last 40 years versus the previous centuries could account for this 0.6 W/m2 accumulation. We’ve been talking about the wrong issue for decades now.
So what happens with a 0.6 W/m2 imbalance? Nothing really. Some modest warming which will be very hard to notice and very hard to measure, especially in the deep oceans.
If I had any hope that OHC would be the last stand of the climate kooks, I would find the paper enjoyable. Instead, long after the OHC issue has been dealt with this time, the AGW true believers will simply recycle it later. I am going to be that there will turn out to be rent seeking correlations to the endless reshuffling of AGW propaganda dressed up as ‘proof’. Grant deadlines, AGW promotional events and gab fests, political campaigns, etc.
0.6 +- 17 . That sure is a mighty tolerance
The days of our years are threescore years and ten; and if by reason of strength they be fourscore years; yea, with Rams tolerance , plus or minus 1,960 years
Several quotes from the article about adjustments and problems mostly with the ARGO data:
And Stefan has forgotten to advise his readers that ocean heat content data has been adjusted to the point that it no longer resembles the source data.
Note also that the unadjusted ocean heat content during the ARGO era was inconveniently flat and that it too must be adjusted to show warming.
As illustrated in Figures 6 and 7 above, the unadjusted ocean heat content data for the depths 0-700 meters and 0-2000 meters both show a flattening of ocean warming during the ARGO era.
the ARGO floats are of very limited value, and ocean heat content data based on ARGO floats are so riddled with problems they too are questionable.
Are there links that support these statements?
I think what happens is that fish absorb the solar radiation when they swim near the surface and they carry that solar radiation down with them in their bodies when they swim downwards into the deep ocean. Then that heat radiates out of their bodies and warms up the deep ocean waters.
Got any better ideas?
Glenn Dixon
November 13, 2013 at 4:05 am
‘The Hiroshima bomb metric … and that he or she may be ignored.’
Wow, is that well said. Words of wisdom. Thank you.
To me it would sound like:
Bob
I noted yesterday on CNN ‘s Situation Room , Brian Todd was interviewing the head of the National Weather Service about whether the latest typhoon in the Philippines was caused by global warming. The National Weather Service head claimed that Pacific Ocean SST has been rising for two decades and that the Pacific ocean sea level rise and the increasing SST both may have played a part. This according to him is causing more intense typhoons and sending more water to low lying areas like in the Philippines..
I notice that your latest monthly update of SST OCTOBER] NORTH PACIFIC SST graph shows no increase in North Pacific SST SINCE 1990 except a short spike that occurred further North away from O-20 N during the latter part of this year. The current NORTH PACIFIC SST is back to the 1990 level . Could this latest spike in the North Pacific Ocean SST have affected the typhoons at 0-20 N region?.
Any comment.
Steve Case says: “Are there links that support these statements?”
I provided graphs (Figures 4 & 5) of the unadjusted (UKMO EN-3 data) versus the much-adjusted (NODC) ocean heat content data. They don’t look similar and the unadjusted data flattens during the ARGO era.
Another excellent post, Mr. Tisdale. I wonder how many times you will have to earn a Presidential Medal of Freedom before you are actually awarded one.
So… yeh.
1. We’re covering now, about 60% of the water with thermometers. Where coverage is defined as >=1 thermometer in a 1/60 arc grid. That’s at least one thermometer in a region from 0 square miles to 4,761. At depth, and away from land masses, there are far less concerns about thermometer density and the unmeasured temp variations between measurement points. But this is a wholly ludicrous and uninformative notion of ‘coverage.’
2. Once again, the Victorian era has us whupped. Even the Carter era has us whupped. And modern science is burdened with adjusting new thermometers as engineers have lost, and are losing, the ability to produce reliable thermometers. The options are that we’re in post-measurement science thoroughly (Like Josh’s recent cartoon of Zen-zero samples.) or that we’re in a post-engineering post-measurement era. (Zen-zero samples taken from thermometers we could build if only Carter were still President). No matter the bifurcation on this, it establishes that a home cabinet installer has better grasp of measurement then the best funded science by Top Men.
3. That even while we can no longer build thermometers, we are to take Stalin’s airbrush to measurements from the reliable thermometers of the Carter era. If, and only if, the measurements break the narrative. Such that since we can no longer produce reliable thermometers, we fake it. And when we had reliable thermometers, we fake it.
4. Smurf Theory of Ocean Heat Content: Obviously we need to correct the data for the heat emissions and contribution of fosial burning blue people that live in mushrooms. They were first discovered in 1958, and began well known by 1965. [See the work of Peyo]. And we have continued to detect ever more smurfs over time. From this, we can state that they are hiding in the oceans, and that their populations are increasing. But that we have not detected them properly and directly because both smurfs and water are blue. So we must extrapolate land based reports of smurf populations to the deep blue, and use this to adjust the ocean thermometers. As long as we’re faking thermometer data we may as well. One narrative is another narrative, and Smurfs play well with kids. And they all had fireplaces in their mushrooms.
5. The irradiance charts from Pinker[2005] are interesting. And specifically as the land based trend seems to be going rather the wrong way. It would be interesting to know how much of that is due to increasing industry in India/China versus other regions; and if that accounts for the land-based trend. It would be more interesting to note if this is accounted for in any of the IPCC models, how it correlates to solar variation, and the raw and adjusted global average temps over land, sea, and both.
The Sun puts out 421,000,000 Hiroshima bombs every second on every square metre or a total of 2,566,700,800,000,000,000,000,000,000 Hiroshima bombs every second across the whole surface.
.
herkimer says: “I noted yesterday on CNN ‘s Situation Room , Brian Todd was interviewing the head of the National Weather Service about whether the latest typhoon in the Philippines was caused by global warming. The National Weather Service head claimed that Pacific Ocean SST has been rising for two decades…”
Pacific Ocean sea surface temperatures have NOT warmed in 19+years:
http://bobtisdale.files.wordpress.com/2013/11/figure-7-26.png
herkimer says: “Could this latest spike in the North Pacific Ocean SST have affected the typhoons at 0-20 N region?”
I have no way to answer your question, but I would think the typhoons would be more impacted by the local sea surface temperatures at the time the typhoon was passing above it.
I find it fascinating that even the most rabid Warmists are now talking about natural regularities. Two years ago, Warmists reacted to mention of natural regularities with an arrogant glare. One year ago, they were beginning to think how they might incorporate the idea into their ideology. Today, they would have you believe that their focus has been on natural regularities since day one. Your work, Mr. Tisdale, and the work of many others at WUWT are primarily responsible for this change.
A genuine science begins with the search for natural regularities. Climate science has been forced by skeptics to pursue natural regularities. To be precise, climate science has been forced to pursue natural regularities beyond what is found in radiation theory.
I am very pleased to see that you are informing your readers whenever the topic changes from heat content to temperature. We must never assume that a claim about heat content can be rendered as a claim about temperature or conversely; rather, the physical properties of whatever is measured and the instruments of measurement must be referenced for each such claim.
Bob
I notice that the NINO 4 SST , the region just east of the Philippines shows a 0.6 C warmer water recently according to http://www.bom.gov.au/climate/enso/indices.shtml?bookmark=nino3.4.. . I don’t know if this alone is sufficient to cause the bigger typhoons in the region. With ENSO neutral conditions currently in the Pacific and predicted into spring at least , global warming is not the cause of bigger typhoons in this region in my opinion.
Bob,
First a question. The Pacific had many typhoons/hurricanes this year and the Atlantic did not. How does this affect the ocean heat content in those areas. or is it just surface temps?
Second, just an observation from a layman. I live on the central west coast of Florida and a couple of years ago we had a major cold front pass through. It went down to 26F on my lanai and the Gulf water temps were reported to have fallen to 49F, the lowest I have seen in my 20 years here. Now, when the cold front passed the Gulf water temps went right back up to their more usual winter temp of about 56F, but went no higher. So to me that means that surface air temps and wind can lower the surface temp of the Gulf and that the Sun can only supply enough energy to warm those Gulf temps to a certain maximum temp totally dependent angle of the Sun and the number of hours of sunlight. Of course those two conditions are totally dependent on the day of the year. So as the year moves from winter to summer solstice, the angle of the sunlight hitting my area changes and so does the number of hours of sunlight. As they change the amount of solar energy available to warm the waters increases until we max out at around 90F and the reverse happens as we move back towards winter solstice. I think that shows very clearly that solar energy at the surface (insolation) is the dominant driver of maximum sea temps and that air temps have only limited and temporary influence on sea temps.
It’s hotter than we previously thought!
Head for the hills, the Earth has been warming since the end of the Little Ice Age. They also make claims of extreme weather without pulling out the biscuits i.e. the peer reviewed literature.
http://www.metoffice.gov.uk/media/image/j/l/warmingtrend.gif
A question for someone smarter than me. How can the heat content of the ocean be expressed in GJoules/m^2?
Good gawd Bob. Take a breath now and again.
Can’t one just say that we know the oceans are warming because the sea level is rising?
Stefan writes;
“If the oceans are warming up, this implies that the Earth must absorb more solar energy than it emits longwave radiation into space. This is the only possible heat source.”
It isn’t the only possible heat source. There are underwater volcanos.
http://volcano.oregonstate.edu/deep-sea-volcanoes-and-ocean-warming-reprint
I don’t want to make any sort of claim as to whether their heat source is at all significant, or that sufficient of them are erupting to cause any recent uptick in abyssal temperatures.
However, I was struck by a conversation I had once with a Cambridge University Volcanologist who said there were 10000 times more underwater volcanos than previously thought. Whether they could be having any sort of effect that is more marked today than prior to the (highly imperfect) argo readings is outside of my sphere of climate knowledge. Seems highly unlikely but it needs to be pointed out that in the deep ocean the sun is not the only possible heat source.
tonyb
Bill Illis says:
November 13, 2013 at 6:45 am
The Sun puts out 421,000,000 Hiroshima bombs every second on every square metre or a total of 2,566,700,800,000,000,000,000,000,000 Hiroshima bombs every second across the whole surface.
================
Luckily only 1/2 the sun faces us at any time.
Once upon a time, when the best temperature monitoring data we had showed that the Earth’s atmospheric temperature was warming, it was claimed by some that this was proof of “global warming” and it must be because of anthropogenic CO2 since it didn’t appear to them to be caused by anything else.
Then the atmosphere stopped warming – where was the hidden heat? – and pretty much remained statistically constant over a 17 year span, and those same people said we should look in the deep oceans where we would find that the temperature would be increasing and this then must be because of anthropogenic CO2 since it didn’t appear to them to be caused by anything else.
As this also is being shown to not be the way they claim – the heat was still hiding somewhere – they next said that we should look at the real, undeniable, global warmth – the Earth’s core? (Ha, you thought I would say the Sun, didn’t you?)
It is really warm there, as much as “millions of degrees”, one of their leaders has said. Clearly, they have found the hidden heat.
And they lived warmly ever after.
Thanks, Bob. Very deep article!
These days remind me of Carl Sagan’s “The Demon-Haunted World (1995): Science as a Candle in the Dark”.
Galvanize says:
November 13, 2013 at 4:38 am
An imbalance of 0.6 +/- 17W/m^2? Coming from an engineering background, I honestly can`t think of an appropriate use for such a wide tolerance. It is almost laughable in its uncertainty.
Is unequivocalness a word? If not, I think we have just found a use for such a word.
___________________________
Can’t think of a use for such a glorious tolerance? Over at RC, it’s called “proof”.
climatereason says:
November 13, 2013 at 7:34 am
… it needs to be pointed out that in the deep ocean the sun is not the only possible heat source.
tonyb
Could one argue that in the deep ocean, the sun is not the primary heat source?
ferd berple says:
November 13, 2013 at 4:12 am
“Without the molten core of the earth to hold them in place via steam pressure, earth’s oceans would have long ago drained into the interior and the surface of the planet would be dry. ”
———–
OT but Mars?
JohnWho
It is difficult to see at the abyssal level of say 4000 metres, how the sun could have any measurable impact. Perhaps we may yet discover there are great columns of warm water down welling from mid ocean levels.
If not, I do not think the word ‘primary’ can be applied for solar energy, but for it be ‘secondary’ there needs to be a greater heat source and I can think of no other candidate than volcanos. The heat input from either source at this abyssal level would still seem to be barely measurable.
Perhaps Bob Tisdale may have studied this?
tonyb
HankHenry says: “Can’t one just say that we know the oceans are warming because the sea level is rising?”
Nope. Sea levels rise for other reasons, such as mass contribution from glacier melt and ground water pumping. Neither are proof that surface temperatures are warming.
climatereason says: “Perhaps Bob Tisdale may have studied this [subsurface volcano contribution to warming oceans]?”
Nope. Sorry.
Bob
Bearing in mind the great depths involved, quite how this could be studied in any meaningful manner is anyone’s guess. In effect its more remote than Mars.
Great post by the way.
tonyb
Goodness.
I would very much like to see the executive summary. Plowing through this would take days, even just to be able to remember all the acronyms would be quite a task.
Bullet points? Please? The adjustments to the ARGO floats in particular?
climatereason says:
November 13, 2013 at 8:11 am
JohnWho
It is difficult to see at the abyssal level of say 4000 metres, how the sun could have any measurable impact. Perhaps we may yet discover there are great columns of warm water down welling from mid ocean levels.
If not, I do not think the word ‘primary’ can be applied for solar energy, but for it be ‘secondary’ there needs to be a greater heat source and I can think of no other candidate than volcanos. The heat input from either source at this abyssal level would still seem to be barely measurable.
Perhaps Bob Tisdale may have studied this?
tonyb
Interesting.
Before we can make any sort of definitive conclusions then, would we not need ocean floor surface (about 1 meter above the surface) temperature monitoring stations similar to what we have with the ground surface stations? Maybe even the actual temperature of the ocean floor as well?
Exhaustive treatment of the information. Thank you!
Even if we assume that the radiative forcing value of 0.6W/sq m is correct and being sequestered in the oceans then what is happening to the remaining near 2.4W/sq m that the supposed GHG induced radiative forcing demands? Have aerosols suddenly become much more potent? Has the sun energy output declined appropriately? How does Rahmsdorf justify the discrepancy?
Am I missing something here?
@Ray, DirkH,ferd berple and others
I have pretty much a complete new base for our climate, that explains WHY the average surface temperature on Earth is ~90K higher than the Moons average surface temperature, why we are in a period with alternating ice ages while dinosaurs were roaming Antarctica, that was covered with forests. It also solves the Faint Young Sun paradox.
The only role for the atmosphere in warming the surface would be if it turns out that the sun is not able to warm the oceans surface from ~277K to ~290K, a mere 13K.
I need some feedback, possibly also from a geologist, to test my ideas, and get this whole GHE idea out of the way.
I have a gmail account: bawouters99 at ……
climatereason-
“I was struck by a conversation I had once with a Cambridge University Volcanologist who said there were 10000 times more underwater volcanos than previously thought.”
I’m not making any claims to the significance of earth’s heat either, but as an interesting aside I recently read someone pointing out that the mid oceanic ridges are ridges because of heat at the ridges rather than a buildup of material erupting from the ridges.
It surprises me how cold the depths of the ocean are. The surface of the earth is colder than we think since the weight of the atmosphere only amounts to the weight of water 33 feet deep.
Good post Bob, The upper 300 meters has cooled slightly since 2003 and the there is much better data for those depths. I certainly doubt they have data to accurately evaluate heat at that depth, but even if their estimates are right, observations would once again contradict their models as not one climate model predicted this type of warming. CO2-caused warming is supposed to make heat sit on the surface and stratify the upper layer. Dr. von Storch recently admitted our models had failed to predict the lack of warming in surface temperatures but reaffirmed his CO2 belief by referencing models results that oceans were warming below 700 m but admitted the models and thus climate science had failed to understand the mechanism and thus predict this. Failed models all around and this reminds me of the desperate attempts to keep the earth centric model of the solar system by adding imaginary epicycles that explained away observed contradictions.
von Storch wrote “there is evidence that the oceans have absorbed more heat than we initially calculated. Temperatures at depths greater than 700 meters (2,300 feet) appear to have increased more than ever before. The only unfortunate thing is that our simulations failed to predict this effect.”
An excellent reasoned reply to the Rahmstorf post!
The Hiroshima bomb metric already unmasks him (S.R.) as what he is, and others, (sceptics), names:
simply a PIK ideologue ! (PIK: Potsdam Institut für Klimafolgenforschung) Search: Die Große Transformation (The Grand Transformation)
A bit OT but the Guardian has posted this:
“This year is the seventh warmest since records began in 1850, with a trend of extreme weather events and the impact of storms such as Typhoon Haiyan in the Philippines aggravated by rising sea levels, the World Meteorological Organisation (WMO) said on Wednesday.”
It looks more like spin than science to me.
The Carbonistas lost the battle of the tropical troposphere and recently the battle of the surface. Given their institutional power, however, Bob Tisdale’s pursuit of them into the murky depths of the ocean remains vital in the war against ignorance and exploitation.
DirkH says:
November 13, 2013 at 4:00 am
Thanks, very interesting. I looked at it with Google Earth; go to the Solomon Islands / Santa Isabel and look at the ocean floor profile. It’s gigantic.
And the plateaus that probably belonged to the same eruption (Manihiki and Hikurangi) moved some 1500 km away already since their creation 😉
@Schrodinger’s Cat,
That Guardian quote is so full of deception as to boggle, except that we know it is par for the course in AGW corrupted media.
Who made 1850 a magic date?
Do please show us any accurate information regarding temps from 1850, compared to temp records of today. Surely the WMO is aware that typhoons have hit this storm basin since before their 1850 date, and with much worse impacts?
What ‘rising sea levels’ crisis?
AGW belief results, apparently, in diminsihed reasoning capacity in its victims.
“Because we understand the energy balance of our Earth, we also know that global warming is caused by greenhouse gases – which have caused the largest imbalance in the radiative energy budget over the last century.”
i.e. Global warming, because global warming.
If we could just get these clowns into a paper bag, we’d have them.
HankHenry says:
November 13, 2013 at 7:32 am
Can’t one just say that we know the oceans are warming because the sea level is rising?
>>>>>>>>>>>>>>>>
No.
We do not even really know if the sea level is rising because in some cases the land is rising due to the recovery from the Wisconsin Ice Age. In other places the coast lines are sinking because the tectonic plates are shifting. As Bob mentioned the solidified “skin” of the earth is equivalent to the skin on an apple. That skin is floating on a molten core.
Vukcevic has some comments on the movement of the GEO MAGNETIC FIELD: http://www.vukcevic.talktalk.net/MF.htm
Also the glaciers are growing over the long term.
http://theinconvenientskeptic.com/2012/04/norway-experiencing-greatest-glacial-activity-in-the-past-1000-year/
http://theinconvenientskeptic.com/2012/04/himalaya-glaciers-are-growing/
Anybody who acepts Fig 1 as being correct is nuts. How can the earth’s surface be receiving more energy from above than is provided by the sun? (PS I assume that’s an energy diagram, it would help to have units given).
We have all of this talk about huge numbers of Hiroshima bombs and about all of the 10^22 Joules the oceans are taking up. But when converting to degrees C, there seems to be almost nothing left as was pointed out in this article. I will illustrate the facts in another way.
I will use Figure 5 and assume it is true.
According to this diagram, the total heat increase is about 25 x 10^22 J over about 55 years.
The total mass of the ocean above 2000 m is 48% of the total mass of the ocean.
The total mass of the ocean is 1.37 x 10^21 kg.
The specific heat capacity of ocean water is 4000 J/kgK.
Applying H = mct, I get a change in t of
25 x 10^22 J/(0.48 x 1.37 x 10^21 kg x 4000 J/kgK) = 0.1 K. Is that correct? If so, it would take over 100 years for the top 2000 m to go up by 0.2 C. Is that supposed to be a problem for us?
Rahmstorff is an epoxologist. That is someone who has mastered the art of sticking to untenable positions.
Rhamstorf’s illustration of a wind-induced tilt in the thermocline does not have any dimensions. If memory serves, the tropical thermocline teeters around 100 to 300 meters. The shallow thermocline is why the eastern Pacific can cool so dramatically during La Nina.
For heated water to sink below 700 meters requires greater relative densities. As waters are piled up in the tropical warm pools it is possible for the dense salty water to sink to greater depths, but crossections of the tropical thermocline does not show heated surface waters sinking below 700 m as seen here
http://i33.tinypic.com/160wwmd.jpg
Other than warm pools, the main place I would expect to see warmth sinking to greater depths would be in the Arctic. The evaporation from heated tropical waters increases its salinity and when those warm saline waters are transported to the poles they sink below the fresher cooler waters. Yet in the Arctic pulses of warm water do not seem to extend below the hypothesized 700 meters. In Polyakov, I., et al. (2011), Fate of early 2000s Arctic warm water pulse, Bull. Am. Meteorol. Soc., vol. 92, p. 561–566, doi:10.1175/2010BAMS2921.1 As seen by red colored waters, most of the warm water intrusions are limited to the 100 to 500 meter range.
http://landscapesandcycles.net/image/77660217.jpg
No models predicted this 700 m and below warming and observations do not reveal where the heat is being carried to such depths suggesting deep ocean warming is more model magic than reality. Where is heat being carried below 700 m?
Whoa – massive post, lots of great data.
Party-line following Clisenkoist climate scientists tend to frame hypotheses and research looking at the last century only. It does not occur to them to ask if what they propose, makes sense in the context of the longer history of the earth and climate.
For instance, Rahmsdork says that warming ocean now can only mean radiative imbalance. Fair enough. The unspoken but central implication is of course that its CO2 wot dunnit, its all about CO2 only.
OK again. But take a look back 100,000 years or so to the end of the Eemian interglacial. Ocean temperatures sharply fell for several thousand years, while CO2, lagging temperature as always, CONTINUED TO RISE at the same time that OHC was cratering. How exactly does Rahmsdork’s hypothesis deal with this scenario? Any suggestions?
Since “climate scientists” seem constitutionally immune from the scientific concept known as “falsification” they need to find the place where all the “missing heat” has gone since the turn of the century when temperatures in the atmosphere stopped increasing. “THE OCEANS”, yeah, that’s it. Back in 2000 something told those dastardly CO2 molecules in our atmosphere that it was time to stop re-radiating the Sun’s energy back into the air around us and instead to channel the excess directly into the deep ocean where it can’t be found so easily.
Now think about that process – the amazing property of CO2 to either HEAT the AIR if it wants, or instead, to COOL the air and HEAT the OCEAN at the flip of some unknown switch back around 2000. We need our best engineers to figure out that COOLING capability of CO2 right now. Can you imagine the possibilities? Merely by directing the CO2 in the atmosphere over Houston, TX. to cool the air and heat some faraway ocean instead, bingo, instant city-wide air conditioning for Houston… wow. That CO2 is great stuff. No wonder plants are craving it. I just wonder how those few molecules (only 1 of every 2,500 molecules in the atmosphere is CO2) can even make it from, say, central Kansas to the nearest ocean without encountering some famished tree or other plant so it can deliver its extra heat underwater. Must be pretty slick molecules all right.
Here’s my guess – its Santa. Yep, THAT’S what he does the other 364 days of the year now – taking all that extra heat from Kansas directly to the North Pole and depositing it into the ocean at the behest of Mother Nature. It’s all clear to me now.
Bob
Excellent discussion of the issues and uncertainties.
Thanks for your very informative Fig. 21 visualization.
From watching it, there seems to be a Equator to Polar “sloshing” corresponding to the East/West sloshing. e.g., the Equator to Polar sloshing looks like a third harmonic compared to the East/West first harmonic.
This may be a driver for Wyatt and Curry’s “Stadium Wave”.
PS As you, Fred, Galvanize, Richard and others point out the amazing statistic: “an imbalance at the surface of 0.6 watts/meter^2 with an estimated uncertainty of +/- 17 watts/meter^2”. I.e.,
“We know with 95% confidence, that the radiative imbalance at the ocean surface may be positive or negative!”
@Phillip Pratley: “How can the earth’s surface be receiving more energy from above than is provided by the sun?”
It’s a graph. You’re supposed to appreciate the color and font choices; not think about the content.
@phlogiston: “How exactly does Rahmsdork’s hypothesis deal with this scenario? Any suggestions?”
Magister magicum. Man is the measure of all things. IR is the measure of all men. Therefore IR is the measure of all things. After all we can convert all mass to energy, and all energy to quantifications of a given frequency of a photon. So surely we can convert men into IR counts, or IR counts into men. Which proves that a larger family not only produces IR but CO2 with every breath. For a double whammy of man’s pestilence.
For the lulz it might be interesting to look at the self-greenhousing of an average IR family of differing socioecnomic strata. Following all normalcy, it will implicate the poor for global warming. So the solution would be clear: To save the planet, and cure the food deficiencies of ethanoal prodution: We need only eat the poor.
Bob Tisdale,
The pdf is good. I thank you again.
Stephan Rahmstorf’s ‘rising sea level’ papers are based on models that use output from climate models as input. It doesn’t get any more “Garbage-In, Garbage-Out” than that. And how sad is it that a climatololgist with a Ph.D apparently can’t tell or doesn’t know the difference between actual sea level rise and land subsidence?
This latest paper appears to be another Rahmstorf classic: conclusions based on garbage ocean temperature data and faulty assumptions. His former professors must cringe when they read this stuff. If anyone can point me to a paper by Stephan Rahmstorf that makes sense, please do so. I no longer waste my time reading his drivel.
The main thing that this latest bit of AGW promotion tells us about the climate is that the problem is trivial, incredibly hard to distinguish from typical climate behavior, and mostly an artifact of the climate obsessed.
RCV – Remote controlled vehicles. ALL this incredible $$$ for all the worthless studies.
Wouldn’t a set of Underwater RCV’s, doing 18,000′ deep, ocean bottom surveys, sonar visible, IR, and temp. doing a grid say…1 mile apart…yield invaluable info? Couldn’t we FIND all the underwater volcanoes? Get a good BASELINE for deep temps? Even get some fantastic current measurements? How much? $100,000,000? Peanuts to the AWG budget. But then again, to DANGEROUS to have reality brought in.
Max Hugoson says: November 13, 2013 at 10:21 am
RCV – Remote controlled vehicles. ALL this incredible $$$ for all the worthless studies.
Wouldn’t a set of Underwater RCV’s, doing 18,000′ deep, ocean bottom surveys, sonar visible, IR, and temp. doing a grid say…1 mile apart…yield invaluable info?
Not really. The geothermal processes that warm the deep oceans create warming rates like 1k every 3 million years.
Cooling roughly about the same: 1K every 2-8 million years.
Fred Berple says at 7:42 AM:
“Luckily only 1/2 the sun faces us at any time.”
Yeah. And only during the daytime, too.
The ocean quahog – a type of deep-sea clam- was dredged alive from the bottom of the North Atlantic near Iceland in 2006, it was 507 years old; btw inadvertently killed by the researchers by freezing it.
Its ‘tree ring’ like shell’s annual striations should contain information relevant to deep oceanography ( temperature or currents strength-nutrition rate of flow) for this area of the North Atlantic going back to 1500.
Have not read all or the comments yet ……….. were you asked to comment on it AT RealClimate, or just in general? If so, is there a link to the thread at RC?
Bill Illis says:
November 13, 2013 at 6:45 am
Bill, the Sun only puts out about 0.8 Hiroshima bombs every second on every square kilometer of surface (not square meter), or a total of about 10,000,000,000,000 Hiroshima bombs every second across the whole surface. This is a lot, but we need to be reasonably accurate. While the interior is about 27 million degrees K, the surface is only about 5800 K, and radiates as a near black body.
Gavin from RealClimate admits the sea temps increased by crazy 0.04ºC. We will all die !!!
Could someone translate 10^23 joules into degrees, for those of us afraid to slip a digit figuring the volume of the ocean?
[Response: 10^23 J in the ocean = 2.8 x 10^8 J/m2 = 1.4 x 10^5 J/m2 over 2000 m depth ~= 1.4 x 10^2 J/kg ~= 0.04ºC (averaged over the whole depth). Much bigger changes are near the top though. – gavin]
I have been noticing lately that it is what the warmers are saying, it is what they aren’t saying.
If the ocean is heated by SW radiation and cools via evaporation, then warmer temps and higher winds from Global warming will cause increased evaporation and more cooling. GHG’s do not increase SW radiation into the ocean.
Also notice that we don’t hear any more about increasing temperatures driving higher CO2 levels? “Positive feedback between global warming and atmospheric CO2 concentration inferred from past climate change
Marten Scheffer1, Victor Brovkin2 and Peter Cox3”
Oceans can only release heat at the surface? I’d use boundary layer since it could also lose heat against rock, if cooler, not just the atmosphere. It’s also not true that solar irradiation is the only heat source considering submerged volcanos and eruption zones between tectonic plates in the oceans. That contribution might be small in comparison but of particular relevance to deep sea temperature observations.
damik says:
………
A single CME is estimated to contain between 10^24 and 10^30 Joules, but only a small fraction is absorbed by the Earth’s magnetosphere.
Edit – it is what the warmers aren’t saying that is important.
Bob
Very interesting post, thank you for doing this research and sharing the results. I do have one question, on Fig. 14, which says it uses NODC data. You write:
“Figure [14] presents the vertically averaged temperature anomalies for the global oceans for the depths of 700-2000 meters. They warm at a relatively constant and very slow rate until the ARGO floats begin the have complete coverage of the global oceans around 2003. Then they warm at a rate that’s almost 24 times faster than the rate seen in the 5 decades leading up to it.”
I’ve plotted the NODC 700-2000 OHC data, derived as the difference between their pentadal data for 0-2000 m and for 0-700 m, and get a very different result. The trend accelerates around 1990, maybe earlier, and doesn’t increase much after 1990 except perhaps in the last year or two. That accords with what is shown in Figure 3.2.b) and Box 3.1, Figure 1 of AR5 WG1 – which also uses NODC data. Do you have an explanation for the different shape of the 700-2000 m OHC curve in your Fig.14? Thanks.
Bob Tisdale,
That compendium is sooooooooo much more than just ‘comments’. That was a ‘de-pants ’em, bend ’em over the teachers desk, and paddle ’em ’till they are bright red’ tour de force!
Thank You!
MtK
alacran says:
November 13, 2013 at 8:40 am
An excellent reasoned reply to the Rahmstorf post!
The Hiroshima bomb metric already unmasks him (S.R.) as what he is, and others, (sceptics), names:
simply a PIK ideologue ! (PIK: Potsdam Institut für Klimafolgenforschung) Search: Die Große Transformation (The Grand Transformation)
========================
“…Normatively, the carbon-based economic model is also an unsustainable situation, as it endangers the climate system‘s stability, and therefore the natural life-support system for future generations. The transformation towards a low-carbon society is therefore as much an ethical imperative as the abolition of slavery and the condemnation of child labour.
For quite some time now, the fossil economic system has been changing all over the world. The WBGU views this structural transition as the start of a ‘Great Transformation’ into a sustainable society, which must inevitably proceed within the planetary guard rails of sustainability. Long-term studies show clearly that worldwide, an ever-increasing number of people desire this move towards sustainability and a long-term approach. Moreover, the nuclear disaster in Japan makes it clear that we must choose the fast lane towards a low-carbon future without nuclear energy.
Now, it is first and foremost a political task to overcome the barriers of such a transformation, and to accelerate the change. In the WBGU‘s view, a long-term oriented regulatory framework must be developed for this to ensure that prosperity, democracy and security are achieved with the natural boundaries of the Earth system in mind. Above all, development paths must be pursued which are compatible with the 2°C climate protection guard rail agreed upon by the global community at Cancún in 2010. This drastic change in direction must be accomplished before the end of the current decade in order to reduce global greenhouse gas emissions to a minimum by 2050, and thereby to maintain the possibility of avoiding dangerous climate change. Hence, time is of the essence here…”
Summary for Policy-Makers
World in Transition: A Social Contract for Sustainability
2011 German Advisory Council on Global Change (WBGU)
Dr. Stefan Rahmstorf, Council Member
http://www.wbgu.de/fileadmin/templates/dateien/veroeffentlichungen/hauptgutachten/jg2011/wbgu_jg2011_kurz_en.pdf
This publication is saturated with globalism. Rahmstorf’s science is likely inseparable from– and subservient to– his politics.
lurker, passing through laughing says:
November 13, 2013 at 8:56 am
Who made 1850 a magic date?
_____________________
Don’t forget, 1850 is generally acknowledged as the beginning of reasonably accurate thermometer/instrument- based temperature records.
Thanks Bob. Well done.
~~~
In a 4 line quote from Science Daily, above Fig. 19, there is “NOA” —
“By contrast, NOA-driven winds served to “pile up”. . . ”
Most folks will (& have) read right through this but perhaps it should have (sic after it. I haven’t checked the original, so can’t be sure.
Those interested in sub-ocean heat should spend a few hours reading about hydrothermal vents; maybe start with the wiki page at ‘physical properties’.
http://en.wikipedia.org/wiki/Hydrothermal_vent#Physical_properties
and also,
http://en.wikipedia.org/wiki/Geothermal_gradient#Heat_flow
Where are the geologists that specialize in this topic?
Nic Lewis says: “I’ve plotted the NODC 700-2000 OHC data, derived as the difference between their pentadal data for 0-2000 m and for 0-700 m, and get a very different result.”
First: The pentadal data would tend to “smooth” out any sudden shift.
Second: You used OHC data and I presented temperature. They are different metrics.
TomR,Worc,MA says: “Have not read all or the comments yet ……….. were you asked to comment on it AT RealClimate, or just in general?”
I was asked in a comment at my blog.
John F. Hultquist says: “Most folks will (& have) read right through this but perhaps it should have (sic after it. I haven’t checked the original, so can’t be sure.”
Added a [sic] in the “NOA-driven”. I read right past it in the original and in my multiple re-uses of it.
Thanks.
Am I the only one who finds a concensus on WUWT more compelling than a concensus at the IPCC ?
“Because we understand the energy balance of our Earth”
We do?
That’s news to me.
. . . and from the deposition of river-borne sediment.
“Rahmstorff is an epoxologist” (Bones at 9:13am) LOL. And if you sniff too much of what emanates from him, you will suffer brain damage. (shaking head) It’s too late for Stefan…… too late.
*********************************
WAY TO GO, BOB TISDALE!
*********************************
“Under the heading of “Beam me up Scotty”, Stefan Rahmstorf writes and illustrates:
(emphasis mine)
LAUGH OUT LOUD.
Wahl, aaaahhlll, beee. So THIS is how the atmosphere heats the deep oceans without warming the upper layer first. GORE blimey! (coined by Gary Pearse):
Build Your Own Ocean Heat Transporter! (including the carbon based “Alka Seltzer Spinning in Warm Water” mechanism!)
(oh, by the way….. it’s all just a computer simulation but, as Alan Robertson pointed out above that’s data!)
rogerknights says: “. . . and from the deposition of river-borne sediment.”
I was discussing sea level with a couple from Norway a few weeks ago. There, sea levels with respect to land are dropping due to post-glacial rebound. They jokingly said that their rising land was pushing the water over to the east coast of the U.S. So I blamed them for the Sandy flooding, and they laughed some more.
And there are comparatively few to no samples at depths of 1000-5000 meters before ARGO.
And there are virtually NO Samples at depths of 1000-5000 meters AFTER ARGO.
ARGO only provides 0 to 2000m. So Argo is the only significant source for 1000-2000 meters. There is almost NOTHING below 2000 meters. It is highly deceptive to count ARGO for 1000-5000 meters when it measures only the upper 1/4 of that depth range.
Relabel the 1000-5000 meter plot to be 1000 – 2000 meters. The curve doesn’t change.
Make a new plot from 2000 meters to 5000 meters. This one has only experimental trace blips hugging the zero line.
Looks like this has been superseded by
http://www.realclimate.org/index.php/archives/2013/11/global-warming-since-1997-underestimated-by-half/
Guess the warming was hidden in the data after all.
James Cross: The Cowtan and Way infilled global temperature data has an even higher trend than GISTEMP from 1997 to 2012. Oy vey! I suspect they also mask sea surface temperature data in the Arctic and Southern Oceans and extend land surface temperature (or TLT data) out over the oceans.
Stephen Rasey: Good point. But I presented the 1000-5000 meter observations as NOAA provides it. I can’t redo those graphs.
Bob,
Looking forward the analysis.
Figs 8 and 9 are extremely important. The red depth-difference curve indicates downward movement of heat resulting from deep vertical mixing.
On account of the strong vertical temperature stratification in the ocean (very cold deep water) I have this proto-hypothesis that one single process parameter only – that of deep vertical mixing, globally integrated – determines climate temperature ternds. More of it = climate cooling, less = warming.
phlogiston says:
November 13, 2013 at 9:45 pm
Leary as I am of one big explanations, your proto-hypothesis is attractive & may well have merit. But then perhaps the question becomes what drives the variations in deep vertical mixing?
“The ocean quahog – a type of deep-sea clam- was dredged alive from the bottom of the North Atlantic near Iceland in 2006, it was 507 years old; btw inadvertently killed by the researchers by freezing it.
Its ‘tree ring’ like shell’s annual striations should contain information relevant to deep oceanography ( temperature or currents strength-nutrition rate of flow) for this area of the North Atlantic going back to 1500.”
I am deeply sceptical about this. How would a creature living that deep under water even be aware of seasons and have growth cycles in accordance? Annual striations? Why? Responding to which variables? Sounds very unlikely to me…. Does anyone have any ideas?
Did not make my point clear.. at such depth surely changes in in conditions would not react fast enough to be in synch with annual seasons but responding to more long-term variation. Annual? I don’t think so.
Ferdinand. @ 4-54am.
But Venus has evaporated its oceans, lost (most of?) its water and now has an atmosphere generating ~100Bar at the the surface and 95% of which, as you say, is C02.
So what makes you, et al it seems, believe that Earth, with an average aqua/atmosphere of ~ 300bar pressure at the relevant surfaces has so much less available Co2 than its sister when taking into account that it liquidizes at a mere ~80Bar and turns to gas above 31C
James Cross says:
November 13, 2013 at 3:50 pm
Looks like this has been superseded by
http://www.realclimate.org/index.php/archives/2013/11/global-warming-since-1997-underestimated-by-half/
Guess the warming was hidden in the data after all.
——————————————
This is how the authors have revised the temperature trends in the Arctic.
http://s13.postimg.org/y084mabo7/Cowtan_2013_Warming.png
A lot of high fives at realclimate until they figure out that this is not physically possible. The sea ice would have completely melted out years ago with this type of temperature rise. Generally the SSTs in the Arctic are assumed to be just below freezing temperature for most of the year. I guess ice itself can get colder than this (and thus warm up by more and still stay frozen) but we generally think of frozen sea surface temperatures as -1.8C to -2.0C and warm up to -1.0C or so in the summer if the ice melts out.
So there cannot be 1.5C of warming in the Arctic since 1980.
Stefan Rahmstorf won’t be pleased to know that this post made the WordPress Top Ten list yesterday:
http://bobtisdale.files.wordpress.com/2013/11/wordpress-top-10-rahmstorf.png
And it was still there this morning:
http://bobtisdale.files.wordpress.com/2013/11/wordpress-top-ten-rahmstorf-this-morning.png
“Applying H = mct, I get a change in t of
25 x 10^22 J/(0.48 x 1.37 x 10^21 kg x 4000 J/kgK) = 0.1 K. Is that correct? If so, it would take over 100 years for the top 2000 m to go up by 0.2 C. Is that supposed to be a problem for us?”
I doubt it. This is the second law of thermodynamics at work – the entropy is increasing. Useful heat is being degraded into a more diffuse, low grade form.
It’s like taking a red hot poker and dropping it in a bath of cold water. The heat of the original red hot poker can be used to do some work, but once the heat is transferred to the bath, the temperature becomes that of the bath, whose temperature has risen by only a tiny amount.
The important point is that the heat, once diffused to a lower temperature, can never result in a subsequent rise in temperature, which would be contrary to the first law. Therefore, any heat, once sequestered by the oceans, can never reverse its thermodynamic pathway, and reheat the atmosphere to the temperatures that caused it to be absorbed in the first place.
It is an admission that the problem (if it ever existed), is being solved by nature once and for all.
milodonharlani says:
November 13, 2013 at 9:58 pm
phlogiston says:
November 13, 2013 at 9:45 pm
Leary as I am of one big explanations, your proto-hypothesis is attractive & may well have merit. But then perhaps the question becomes what drives the variations in deep vertical mixing?
That is indeed the 64kUSD question. The variations in question would be over a range of timescales including century-millennial scales. There is quite a lot published on modeling of ocean circulation which seems to be on firmer ground than modeling of the atmosphere, due to less variables and heat movement primarily by convective movement alone. For instance if you google-scholar something like “bipolar seesaw” you can find a lot of quite credible results of millennial scale ocean circulation modeling which can reproduce features like the Younger Dryas, Antarctic reversal, bipolar seesawing etc. (Its also less politicized modeling since on these timescales it’s real science about historical climates not just 20th century AGW, and thus a brief genuflection to CO2 and AGW seems sufficient to allow publication.)
Generally the locations of the majority of downwelling are well known such as the Norwegian sea and around Antarctica, these must be balanced by upwelling eg. along western equatorial continental margins. The AMOC and other local vertical circulation systems will also play a role by speeding up or slowing down. But as to what causes this – it seems to have primarily been researched in the context of what drives the glacial-interglacial cycles (ice rafting etc.). Very little has been done to try to relate climatic trends with how global deep vertical mixing and in particular upwelling varies with time and what drives these variations.
I believe this will be key to understanding long term climate. Weather comes from the atmosphere, climate from the ocean.
GabrielHBay says:
November 13, 2013 at 10:31 pm
“The ocean quahog – a type of deep-sea clam- was dredged alive from the bottom of the North Atlantic near Iceland in 2006, it was 507 years old; btw inadvertently killed by the researchers by freezing it.
Its ‘tree ring’ like shell’s annual striations should contain information relevant to deep oceanography ( temperature or currents strength-nutrition rate of flow) for this area of the North Atlantic going back to 1500.”
I am deeply sceptical about this. How would a creature living that deep under water even be aware of seasons and have growth cycles in accordance? Annual striations? Why? Responding to which variables? Sounds very unlikely to me…. Does anyone have any ideas?
Responding to variability in deep ocean circulation. For reasons outlined in my previous post, we do definitely need to know time-resolved information about what is happening and varying at the bottom of the ocean if we are to understand long term climate variation. So yes, this unfortunately clam would have important data to contribute, albeit posthumously.
***
Vince Causey says:
November 14, 2013 at 12:41 pm
The important point is that the heat, once diffused to a lower temperature, can never result in a subsequent rise in temperature, which would be contrary to the first law. Therefore, any heat, once sequestered by the oceans, can never reverse its thermodynamic pathway, and reheat the atmosphere to the temperatures that caused it to be absorbed in the first place.
***
Agree.
Using DMI Arctic temperatures (80N+) comparing 1980 with 2013, no warming can be found in summer.
http://ocean.dmi.dk/arctic/plots/meanTarchive/meanT_1980.png
http://ocean.dmi.dk/arctic/plots/meanTarchive/meanT_2013.png
If anything 2013 during the summer has been cooler than 1980. There is no 1.5c increase in Arctic temperatures found here over the seasons.
Very busy article, but well worth the read. Remarkable that these people call themselves scientists. Thanks Bob!