Fixing the Facts – By Steve McIntyre
Figure 1.4 of the Second Order Draft clearly showed the discrepancy between models and observations, though IPCC’s covering text reported otherwise. I discussed this in a post leading up to the IPCC Report, citing Ross McKitrick’s article in National Post and Reiner Grundmann’s post at Klimazweiberl. Needless to say, this diagram did not survive. Instead, IPCC replaced the damning (but accurate) diagram with a new diagram in which the inconsistency has been disappeared.
Here is Figure 1.4 of the Second Order Draft, showing post-AR4 observations outside the envelope of projections from the earlier IPCC assessment reports (see previous discussion here).

Figure 1. Second Order Draft Figure 1.4. Yellow arrows show digitization of cited Figure 10.26 of AR4.
Now here is the replacement graphic in the Approved Draft: this time, observed values are no longer outside the projection envelopes from the earlier reports. IPCC described it as follows:
Even though the projections from the models were never intended to be predictions over such a short time scale, the observations through 2012 generally fall within the projections made in all past assessments.
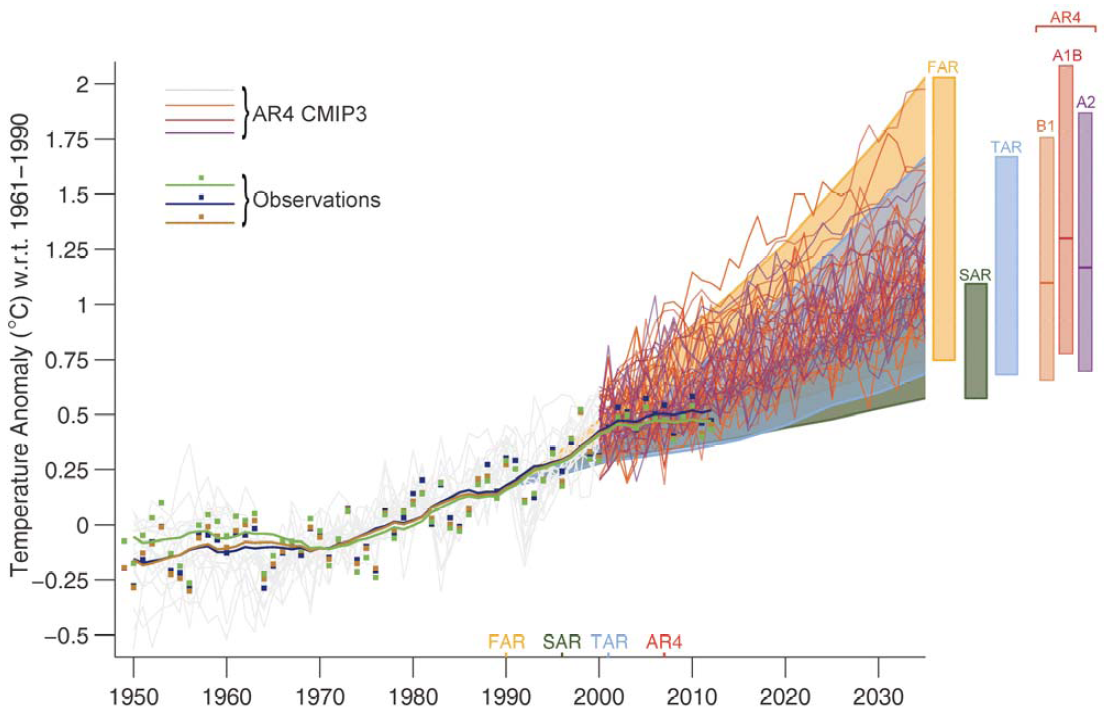
Figure 2. Approved Version Figure 1.4
So how’d the observations move from outside the envelope to insider the envelope? It will take a little time to reconstruct the movements of the pea.
Read more: http://climateaudit.org/2013/09/30/ipcc-disappears-the-discrepancy/
“Pay no attention to [that] man behind the curtain!” – The Wizard of Oz
(Darn typos…)
“1984” all over again.
Consider that if the ‘observations falling within the range of the model outputs’ is to be deemed a measure of goodness of fit, all one would need to do to ensure a better fit would be to add more instability to the models (or remove negative feedbacks that limit excursions) to guarantee to enclose the observations.
In other words, make the models worse in order to be able to claim an improvement.
That does seem a stereotypical approach for the CAGW paradigm, though.
I knew it! The IPCC must have hired John Cook to do their graphs.
Never mess with McIntyre. He will tear this thing apart line by line.
The IPCC doesn’t have a chance.
The draft Figure 1.4 appears to have been incorrectly baselined – set to the 1990 peak rather than the actual trend at that time.
However, the actual caption for the draft figure (as per the leaked document) states: “The 90% uncertainty estimate due to observational uncertainty and 16 internal variability based on the HadCRUT4 temperature data for 1951-1980 is depicted by the grey shading.” In other words, the grey area shows the range of variability around model projection means, which are shown by the colored bands. Observations fall well within the range of projections – something McIntyre somehow… failed to mention.
The IPCC has throen the gppd name of science into disrepute.
Are they so stupid that they think that nobody would notice or are they so sure of themselves that they are certain that they will get away with this?
“Even though the projections from the models were never intended to be predictions over such a short time scale, the observations through 2012 generally fall within the projections made in all past assessments.”
The sentence implies that it’s easier to make a long range forecast than a short range one.
And that, while they also tell us that there’s positive water vapor feedback. Systems with positive feedbacks tend to go off the rails at some point; the climate scientists used to postulate the existence of a tipping point. Now, this rather unstable system is EASIER to predict the farther one goes into the future?
The remaining scientists at the IPCC must be total whores.
Interesting article at Yahoo news by Mikey Mann; I commented on that one and a previous one, and almost immediately the comment(s) and the article(s) both disappeared.
It was also interesting that the majority of comments at Yahoo were in line with WUWT and JoNova et al. The general public is not drinking the Kool-Aid anymore! (and, isn’t “Kool” – Aid antithetical to the IPCC and Mikey-baby?)
Mark H.
Sorry, the last should read “thrown the good” name…..
Look at 1990 in the second graph.
In the first graph all the projections start from the 1990 observed value. In the second graph the projections start from below the 1990 observed value, because they are correctly plotted as anomalies with respect to the 1961-1990 mean.
Something of a simple error in the production of the first graph – possibly because someone did not have all the data to hand when they were creating it, or made a mistake as they were in a hurry.
DirkH says:
October 1, 2013 at 8:47 am
Your presume too much, Dirk.
There are no “whores” at the IPCC because there are no scientists. Had there been, there would be (whores, that is).
🙂
@Jim Stevens at 8:26 am
I knew it! The IPCC must have hired John Cook to do their graphs.
You may be right. They are a bit cartoonish and SkS seems to be leading their defense.
Dyrewulf says:
October 1, 2013 at 8:15 am
“Pay no attention to [that] man behind the curtain!” – The Wizard of Oz
<<<<<<<<<<<<<<<<<<<<<<>>>>>>>>>>>>>>>>>>>>>>>
As long as the IPCC cranks out the propaganda, officials like Kerry can refer to its findings to justify policy.
To Alistair Ahs:
Your comment is perfectly reasonable, but there is some important extra content here:
http://xkcd.com/882/
Somehow I don’t think that’s the last we’re gonna see of slight of hand here. As good old Vladimir Illych Ulianov, said way back when, “if you tell a lie often enough, it becomes the truth!” Adolf Hitler in Mein Kampf, “the mass of the people are more likely to believe a big, than a small one!” 😉
Looking at the replacement graph, I guess the Pea has been replaced by a Mexican Jumping Bean.
If they supply the “pulled out of thin air” data for the “98% certainty” figure of “human induced climate catastrophe” for Steve McIntyre to analyse, the pea will turn into an Elephant.
This appears to be scientific fraud on a massive scale. It appears to be an example of post hoc alteration of results to acheive a desired result.
Anyone who did this in Medicine or Pharma would be dimissed and disgraced. It makes Climategate look very tame.
I suspect that there are respectable scientists around the World who are sickened by the antics of these climate “scientists”.
I can only suggest that every scientist writes to their national academy and points out World policy is being made on the basis of scientific fraud and that they should perform an investigation. Since the IAC’s recommendations were ignored by the IPCC, this seems a good place to start.
Alistair Ahs:
Your entire post at October 1, 2013 at 8:49 am says
I am curious to know if you really are called Alistair Ahs because I find it hard to believe anybody would put their own name to so stupid and pathetic an excuse as you have written.
Anomalies can be normalised to any reference value. The correct reference value for a projection is from the empirically observed value at the time of the start of the projection.
Richard
I released my own detailed analysis of those two graphs many will find very, VERY interesting:
http://informthepundits.wordpress.com/2013/10/01/ipcc-wg1-leaked-graph-conspiracy/
It adds details from The Guardian’s article today that McIntye does not cover.
@DirkH at 8:47 am
The sentence implies that it’s easier to make a long range forecast than a short range one.
It is true on several accounts.
First, Las Vegas casino managers should be able to make better monthly take estimates than the take on any one day. That said, overestimating the take day after day doesn’t look good for the casino’s (and the manager’s) long range outlook.
Secondly, it is easier to make long range forecasts (right or wrong) if you don’t plan to be around on the day of reckoning. Conversely, short term forecasts where you will be personally held accountable are really hard!
Steve is onto something big. The chart that Dr. John Christy of UAH presented to Congress on the pause in testimony on 9/20/12,, and that he and Dr. Spencer later put up in their website, used 38 CMIP5 models for total TAS, and 73 CMIP5 models for the tropical mid troposphere (20n to 20s) respectively, and both methods clearly show the divergence. That archive is frozen, and publicly available. Worse, the AR1-AR4 prediction bands are a matter of written IPCC record, and have somehow been stretched here compared to what was previously published. Did the IPCC really think no one would remember, or check?
This will become their Waterloo.
As this decade proceeds the IPCC’S climate projections will become worse and worse.
KR:
Your post at October 1, 2013 at 8:34 am says
The draft Figure 1.4 appears to have been incorrectly baselined – set to the 1990 peak rather than the actual trend at that time.
However, the actual caption for the draft figure (as per the leaked document) states: “The 90% uncertainty estimate due to observational uncertainty and 16 internal variability based on the HadCRUT4 temperature data for 1951-1980 is depicted by the grey shading.” In other words, the grey area shows the range of variability around model projection means, which are shown by the colored bands. Observations fall well within the range of projections – something McIntyre somehow… failed to mention.
The draft Figure 1.4 was CORRECTLY baselined to the empirically observed value at the time of the first projection (i.e. in IPCC AR1 labelled as FAR). The new spaghetti graph is baselined wrongly such that observations fall well within the range of projections – something you somehow… managed to misrepresent.
Richard
Sorry for getting the blockquote formatting wrong in my post to KR. Richard
Mark Hladik says: @ October 1, 2013 at 8:48 am
….. The general public is not drinking the Kool-Aid anymore!
>>>>>>>>>>>>>>>>>>
I have noticed that too. I was at a three day festival this weekend and all the people I talked to snickered when I asked them how they liked the “Global Warming’ and then I got an earful.
@richard
“Anomalies can be normalised to any reference value. The correct reference value for a projection is from the empirically observed value at the time of the start of the projection.”
So if they had referenced it to 1992, the observations would have been above the projected range! That doesn’t make any more sense than using 1990 and finding the observations low. The most reasonable reference has to be an average for the period, surely?
It was a simple mistake, subsequently corrected.
John
Rud Istvan
“This will become their Waterloo.”
The serpent has many heads, cut off one and two grow in its place. I am sure many climate “scientists” will be prepared to defend this.
KR — “Observations fall well within the range of projections ”
You’re misunderstanding this. Observational certainty = 3 in, damnit. Obersvational uncertainty = 3 in. give or take a 1/16 of an inch. The grey area represents the assumed error range of the ‘true’ value of the observation, regardless of the measurement received; the little black dots.
So it’s correct to say that the measured value was outside the envelopes. But it is also correct to say that the envelopes are wholly within the estimated ‘true’ value range. The only problem with even paying attention to this is that the measured value lies closer to the cold side of the range. And then trends even colder to the cold side of the error range as it goes on. eg. It’s a confession of a systemic warming bias in the measurement apparatus.
No clue how or if that’s justified, that’s just what the grey and black bits are telling you.
– – – – – – – – –
Good skeptics abound.
Thanks Steve McIntyre, you one of the great skeptics.
In the intellectual discourse on the future of the IPCC based on AR5, a great skeptic needs to be where their pea is going to be by January 2014 when the report is formally final.
I maintain they will use a post-modern redefinition of science where it is: not necessary to have non-contradiction; not important to have precise concepts; necessary to have higher ideals over observed data to inform science.
Academia will flock to the intellectual support of that view as January approaches.
For skeptics to capture their pea and take it away from them, it just takes simple reasoning open to the public. Venues exist to do that.
It is fun.
John
richardscourtney – If you are showing a graph of observations versus trends, you should show those observations against the actual trendline. 1990 was a relatively warm year, perhaps 0.1C over the 1975-1990 or 1975-present trends; the observations should therefore be shifted ~0.1C higher in that figure.
However, that’s a relatively small issue compared to McIntyre ignoring the model variation around the mean projections. That means his claim of observations exceeding model bounds is simply false – observations are well within the 2-sigma variation range, as the original figure captioning clearly states. An issue which you have not addressed.
JohnB:
At October 1, 2013 at 9:21 am you quote my having said
then you say
No, it was not a “mistake” and I can see no reason for anybody to claim it was.
The projections are of the projected time period which starts at 1990 when the AR1 (i.e. FAR) was published. Any other date is a ‘cherry pick’.
And if the projections are for the future then “an average for the period” is not “the most reasonable reference”. That reference would be imaginary if it is the average of what will transpire in future reality. Altenatively, that reference is a function of the projected time period if it is the average of the projected values.
The only “reasonable” reference is the empirical value at the start of the projected time period. With that reference, as time passes any divergence of the projection from reality will then be observed.
The draft Figure used the only “reasonable” reference.
Richard
KR says [emphasis in original]:
October 1, 2013 at 8:34 am
Your nasty snark at Steven just reveals that you haven’t been following the story. Not only that, but you’ve been suckered by the IPCC. As McIntyre stated:
So the grey area was specially put in by the IPCC to sucker the fools who weren’t paying attention. Hey, I wasn’t either, I didn’t notice that bit of sneakiness … but then I didn’t attack McIntyre based on my gullibility and ignorance, either.
That would be you … and no, the observations do not fall well within the range of projections, they fall within the bogus grey area.
w.
Let’s call the current IPCC graphic the Spaghetti Monster chart.
@richard,
Imagine for a second that there had been an AR1.5 in 1992, and they had referenced using the 1992 value. It would show that observations were lower that the range of projections. Are you saying you would NOT be accusing them of cherry-picking?
Come on, 1990 is an outlier in a noisy data set (as is 1992). They corrected the graph to reference against the trend line at the time they created it. Perfectly reasonable!
John
A few commenters here, KR, JohnB, Alistair Ahs, seem to be missing one basic point. Establishing “settled science” requires a string of successful predictions. When the published version of your prediction fails, you can go back and argue that you made a mistake, and your prediction should have been different. If everyone agrees that you meant something different than what you showed, you may get credit for a successful prediction. If you instead argue post hoc that you can display the data in such a way that makes your prediction look right, don’t expect credit for making a correct prediction!
AGW Cotwology
So if I can use an analogy to see if I’m understanding the justification correctly.
I predict/project at 7AM the temperature will rise 10 degrees from 20C to 30C at noon. Then at noon the temperature is 25C so I say my prediction was incorrectly baselined and the correct baseline would be an average of the temperature between midnight and 7AM. Lets say the respective temps were 10C and 20C for an average of 15. I can then claim my prediction was correct because it was for a 10C rise and there was a 10C rise from the average of a certain period. Is this their justification?
KR: Think about this for a minute. The model ranges already include the 95% certainty range. The gray area cannot be the two sigma range for the model output that already has the 2 sigma range. This makes no statistical sense.
The gray area is simply a gray area (pun intended) inserted by the authors to imply that the measured temps are still inside model ranges. The gray area has no statistical meaning, and no provenance.
JohnB:
Your post at October 1, 2013 at 9:56 am begins by saying to me
No, I will not join you in imagining anything. I am discussing reality and not your dreams.
I would not be accusing them of cherry-picking if they were not doing it.
Richard
shenanigans24:
re your post at October 1, 2013 at 10:06 am.
http://wattsupwiththat.com/2013/10/01/mcintyre-on-ipccs-switching-the-pea-under-the-thimble/#comment-1432996
No, they merely adjusted the baseline to give a false impression.
However, your description is the excuse for the adjustment that John B has attempted to use on their behalf.
Richard
An interesting overlay (as an animated .gif) has been assembled here:
http://climateaudit.org/2013/09/30/ipcc-disappears-the-discrepancy/#comment-441622
WHAT LYSENKO SPAWNED.
A clear case of “Lowering the Bar”
The OLD graph indicates the Base predicted Temperature Anomoly for the TAR @ + 0.46 by 2015
The NEW graph indicates the Base predicted Temperature Anomoly for the TAR @ +0.36 by 2015
They made the uncooperative imperical data fit the modeled projections by hiding the decline through lowering the boundries of the predicted trend lines
richardscourtney says:
October 1, 2013 at 9:40 am
“No, it was not a “mistake” and I can see no reason for anybody to claim it was.
The projections are of the projected time period which starts at 1990 when the AR1 (i.e. FAR) was published. Any other date is a ‘cherry pick’.”
Bazinga! Double Bazinga on “Any other date is a ‘cherry pick’.”
“And if the projections are for the future then “an average for the period” is not “the most reasonable reference”. That reference would be imaginary if it is the average of what will transpire in future reality. Altenatively, that reference is a function of the projected time period if it is the average of the projected values.”.
Bazinga! Double Bazinga on “That reference would be imaginary.”
“The only “reasonable” reference is the empirical value at the start of the projected time period. With that reference, as time passes any divergence of the projection from reality will then be observed.”
Bazinga! The alternative is that, in the case of models, the IPCC gets to just make up stuff.
Wonderful work, Richard.
I continue to find RSC unbecomingly rude to strangers, but at least correct.
The forward-projected error window must be referenced to the point selected at initial publication (and they could have picked any reasonable value they wanted to at that time). Adjusting the old prediction based on new information constitutes a new prediction. They have thrown out their old work because it embarrassed them.
If the counter argument boils down to “academic nitpicking”, then why change the figure at all? Let it stand, then claim vindication later when the truth wins out.
Willis Eschenbach says:
October 1, 2013 at 9:44 am
“Your nasty snark at Steven just reveals that you haven’t been following the story. Not only that, but you’ve been suckered by the IPCC. As McIntyre stated:
‘Observed values have been outside the AR4 envelope for all but one year since publication of AR4. IPCC authors added a grey envelope around the AR4 envelope, presumably to give rhetorical support for their false claim about models and observations; however, this envelope did not occur in AR4 or any peer reviewed literature.’ ”
The IPCC has a set of rules. In the quotation above, Mcintyre points out that the IPCC violated its own rules by publishing a chart that did not occur in AR4 or any peer reviewed literature. I will add that they presented the chart as if it had occurred in AR4. In the world of peer review, you do not get to change items that have been published.
KevinM:
I find your personal remark at October 1, 2013 at 11:06 am extremely rude and not correct in any way. But so what?
Richard
KevinM says:
October 1, 2013 at 11:06 am
“The forward-projected error window must be referenced to the point selected at initial publication (and they could have picked any reasonable value they wanted to at that time). Adjusting the old prediction based on new information constitutes a new prediction. They have thrown out their old work because it embarrassed them.”
Absolutely, both in terms of the reality and in terms of the IPCC’s rules. The IPCC’s rules do not permit substituting a “corrected” chart for an earlier published chart. This is in accordance with standard practice of peer review.
http://news.yahoo.com/meteorologist-vows-never-to-fly-again-after-seeing-latest-climate-report-134014509.html
Eric Holthaus, meteorologist tweets:
“I realized, just now: This has to be the last flight I ever take. I’m committing right now to stop flying. It’s not worth the climate.”
— Eric Holthaus (@EricHolthaus) September 27, 2013
And http://news.yahoo.com/climate-refugee-fighting-stay-zealand-081320424.html
WELLINGTON, New Zealand (AP) — A man from one of the lowest-lying nations on Earth is trying to convince New Zealand judges that he’s a refugee — suffering not from persecution, but from climate change.
===
ONE nutcase meteo guy and THE climate refugee in New Zealand… that should fall well into the range of UN UNEP IPCC estimates on millions of climate refugees by 2012…/sarc
rogerknights says: October 1, 2013 at 9:55 am
Let’s call the current IPCC graphic the Spaghetti Monster chart.
____________________________
All hail to the Flying Spaghetti Monster, the new IPCC deity.
I’ve heard he can improve your exam grades and make your poorly grandma better too, if you genuflect enough times.
Tom Rude,
From the article:
“Legal experts consider the man’s case a long shot…”
No kidding.
The guy went to New Zealand to escape the climate??
He should have gone to Nepal, instead. With runaway global warming the Himalayas should be as balmy as he is, and the altitude should protect him from those fast-rising oceans.
Mickey Mann is BAAAAACK…
http://news.yahoo.com/michael-mann-climate-change-deniers-must-stop-distorting-150312836.html;_ylt=A2KJjahQEUtSdDUAmbnQtDMD
“An urban legend seems to be circulating around the echo chamber of climate-change denial, including contrarian blogs and fringe right-wing news sites. The claim is that the IPCC has “dropped” or “trashed” the Hockey Stick conclusion regarding the unprecedented nature of recent warmth.”
“Conclusions about unprecedented recent warmth apply to the average temperature over the Northern Hemisphere. Individual regions typically depart substantially from the average. Thus, while most regions were cooler than present during the medieval era, some were as warm, or potentially even warmer, than the late-20th-century average. These regional anomalies result from changes in atmospheric wind patterns associated with phenomena such as El Niño and the so-called North Atlantic Oscillation”
[Now climate change does not include wind patterns… LOL]
“Don’t be fooled by the smoke and mirrors and the Rube Goldberg contraptions. The true take-home message of the latest IPCC report is crystal clear: Climate change is real and caused by humans, and it continues unabated. We will see far more dangerous and potentially irreversible impacts in the decades ahead if we do not choose to reduce global carbon emissions. There has never been a greater urgency to act than there is now.
The latest IPCC report is simply an exclamation mark on that already-clear conclusion.”
Mickey is looking for another fight… and his carbon footprint might look like someone’s shoeprint on his rear!
KR @October 1, 2013 at 9:37 am
You earlier wrote (@October 1, 2013 at 8:34 am):
I have not seen as many wrongheaded statements in a single comment in a long time. The purported “uncertainty estimate” is 90% not 95%, so the multiplier for the sd would be 1.645 not 2. As well, the gray area is supposed to account for “observational uncertainty and internal variability based on the HadCRUT4 temperature data”. The “model projection means” are not the “colored bands” as you state, but single curves centrally located within the bands (which are supposed to account for model variation). Willis (@October 1, 2013 at 9:44 am)has already pointed out that Steve did not “fail to mention” the presence of the gray patch and why it was there.
The individual who came up with the plot itself demonstrates a singular lack of statistical skills as well.
First, if the gray bands are to be scientifically meaningful, they should be applied to the four colored bands individually and not simply to the outside boundary of the overall colored figure. Notice how much wider the lower gray band is than the upper band around 1991 to accommodate the SAR projections. This incorrectly gives a free ride to the other scenarios whose correct outer gray portion would be much higher. There is no way to make a proper evaluation of the models and the observed temperatures and the graph is useless for that purpose.
Secondly, the width of the gray bands on either side of the color portions is approximately 0.25 C. Simple calculations using the annual crutem4 data shows that for the range of years 1990 to 2012, a 90% bound for the individual annual global temperatures (including ALL sources of error) is in the range +/- 0.103 to +/- 0.122 – less than half of what the gray region indicates.
Finally, uncertainty contributions from two independent sources are not additive, but combine as the square root of the sum of the squares of each source. This would imply that for this situation, the visible gray portion should start out at a width of the observed temperature uncertainty at the common starting point and decrease as the colored region increases. This does not seem to be the case in the plot itself.
You will also note that there are three observed temperature series plotted on the graph. These are enhanced by vertical bars extending above and below the set of points. What do you think the interpretation of those bars might be? Are the gray bands even necessary for the use claimed by the author of the report?
Who is telling us what to think? Who were the delegates meeting behind closed doors in Stockholm on the tax payers tab to work out the latest IPCC findings?
RomanM,
Thank you. KR comes here regularly trying to convince people that Down is Up, Black is White, War is Peace, Ignorance is Strength, and “carbon” will cause runaway global warming. Good to see you set him straight.
I will listen to you and Steve McIntyre any day over the alarmist crowd, which has no measurable, testable facts; only assertions and conjectures. That nonsense has gone on for too long.
You can get the multi-model means from IPCC AR5 here.
http://climexp.knmi.nl/cmip5_indices.cgi?id=someone@somewhere
For example, here are the RCP 6.0 scenario (the most realistic) and RCP 4.5 (a low scenario) using the same baseline as Hadcrut4 is today. RCP 6.0 is at +0.79C in August 2013 and RCP 4.5 is also at +0.76C (they diverge later)
http://climexp.knmi.nl/data/iglobal_tas_Amon_modmean_rcp60_00019611990a.txt
http://climexp.knmi.nl/data/iglobal_tas_Amon_modmean_rcp45_00019611990a.txt
You can also get the multi-model means for IPCC AR4 from the IPCC here (they are in the 1980-1999 baseline so just add 0.184C to put it on the same baseline as HadCrut4 is today). Scenario A1B has an average of 0.69C in 2013.
http://www.ipcc-data.org/data/ar4_multimodel_globalmean_tas.txt
If I understand the techniques used in the graph.
Take your old predictions and scale them to the mean of the actual data.
Plot the predictions with an increased confidence interval.
The future predictions will be then safely within the confidence limits.
Climate science at its best.
It is also disingenuous for them to include all of the model outputs for all the different CO2 scenarios.
We know that the rate of increase in CO2 is close to the scenario for the A2 or A1B curves, having run unabated despite all the billions of dollars and euros squandered on the panic-stricken carbon strangulation schemes.
http://www.ipcc.ch/graphics/ar4-wg1/jpg/fig-10-4.jpg
The low end range of the model outputs, though, is applicable only to the ‘constant composition’ scenario, and has no business even being on the chart given what we know about CO2 concentrations.
Just noticed another alteration that affects the measured data and how it fits into the projected model graph. In the OLD GRAPH, all of the observed data points after the Super El Nino of 1998 do not top the El Nino Temp spike. In the new Spaghetti Graph, All the measured data points (observations) have been adjusted up so that the majority of the peaks that are post 1998 fall above the level of the 1998 el nino peak giving the appearance of a still gradual increase
Don’t let them get away with it!
Thanks GlynnMhor. So the models that fail least badly are not even applicable. Brilliant.
@RC Saumarez — Apparently you haven’t been paying attention to Pharma and Medicine, they do that stuff all the time. P > 0.05 is about all they need to make a statement. Science isn’t on the ropes just in climate science. Science is losing in lots of places. Gamesmanship plays a more important role in science than does falsifiability.
Deming’s guest post hits it pretty close. The warmists reading it won’t get it though.
I have the top 10,000 Stations plotted from BEST (top being defined as having the most observations) and available on line for anyone curious. http://www.bestkepttemps.com. BEST told me that 2 in 3 stations showed increasing temperatures. Port au Prince is definitely increasing. I can’t really say that about many others though.
Yes Bryan,
It certainly looks like they have adjusted the post 2002 numbers (I refuse to call it data)
They have created an upward slope in the observed points, and have coloured the upper ones black so they can easily be seen, The lower values are lighter in colour and hide quite well.
This upward trend after 2002 does NOT exist in the Hadcrud4 numbers, in fact it is negative.
http://www.woodfortrees.org/plot/hadcrut4gl/from:2002/to:2013/plot/hadcrut4gl/from:2002/to:2013/trend
Someone is creating a falsehood. !!!!!
Glynn, They aren’t really including the “no-increase” model results are they?.. seriously ????
That’s just a BLATANT LIE if they are !!
So they are fudging the numbers.
They are changing the graphs to give the impression that the models are correct.
What is new?
The MSM won’t report it.
They just slavishly publish the press releases of the UN, the IPCC, Greenpeace, the WWF and activists like Mann. Investigative journalism in the MSM has been dead for some time.
In the end Joe (and Joanne) average will only hear the message;
“See, we were right and it is even worse than we thought.”
Rud Istvan,
The graph that Spencer used showed satellite data compared to projections for the troposphere I believe whereas these are HADCRUT 4 compared to land/sea projections??
This presentation could be challenged as fraudulent, seriously criminally so. I’m not a climate scientist but have a technical high school engineering background with further work in implementing tax systems, law and accounting.
I’ve just discovered the AR4 grey bands are a presentation item only without any statistical significance. The preparers of these report have a duty of care that would be enforceable across most jurisdictions. One cannot write such high grade dense obscure technical material without implicitly claiming knowledge. Its hard at that level to say that they accidentally got it wrong or were misrepresented or careless. They must have put their minds to it and knowing that others were to act on it they had a duty to present it in way that was clear and without bias. Gross carelessness takes negligence into fraud so deliberative acts cannot find an excuse.
The grey bands gave a false significance (not a statistical one) that the data was within purported boundaries: without the grey there were no boundaries. The morphing of the grey now into a mess of spaghetti has to be taken as a deliberate endeavor to hide the fact that data doesn’t meet ‘projections’, whatever validity they may have. If the baseline of projections has shifted to overlap the data this is also a deliberate act.
The preparers of the report i.e. those named in it may in time be accountable personally in the criminal courts: their UN blanket may not be adequate covering.
Hmmmn.
Subtle, very subtle. Look again at the “positions” on the “X” (time, or year) axis presented in the AR5 graphic – You can’t really even call it a “graph” sinec that would imply it contains scientific data!
Notice that ALL of the AR4 “predictions” are “over-estimated” – well over top of the actual temperatures in the data between AR4 and AR5.
(No, they DON’T tell us what “date” those predictin are supposed to be valid against, BUT they DO place the prediction bands out above the apparent 2050, 2070, 2100 years of the “X” axis. So, a “failed” prediction that is too high by an order of magnitude is “placed” on the graph as if it were an accurate projection to the eye of a 2100 year’s prediction that draws the reader’s attention even further to the right so even the present spaghetti graphics look more accurate!
Oops, I copied this. I’m not referring to this post here bu the the latest AR5 installment. Apologies, Kev.
IPCC claims it ‘does not do science’ but I think that is unfair they do ‘science ‘ just very, very bad science .
Actually i am a bit disappointed with SM, Judith, Lucia etc because they always believed in AGW to some extent or did not want to discuss it much as a subject whether it existed or not. Now it seems they are really realizing how they have been had by actually paying attention to the alarmists. It seems now that they are actually getting angry (re JC IPCC needs to be terminated) ect. I am proud of the fact that for years we deniers have been shouting from the roof that this is a complete scam. Anyway none of the HADCRUT, GISS etc data is valid it has all been manipulated i dont know why they keep using it. Its just another IPCC trap. It vexes me as Marcus Aureliuse’s son Domitian said in the film GLADIATOR hahahaha
Bottom line is lukewarmers are now becoming skeptical even of lukewarming .
Does this apply to graphics?
Discrepancy is still there. Looks like they are buying some time by making the disconnect difficult to see for a few more years. The model failures will be impossible to hide in a few more years.
The IPCC spaghetti graph reminds me of that old Bob Marley track.
Jimbo:
At October 1, 2013 at 2:53 pm
http://wattsupwiththat.com/2013/10/01/mcintyre-on-ipccs-switching-the-pea-under-the-thimble/#comment-1433256
you quote part of the “Role” of the IPCC and this
then ask you ask
If you had quoted the entire “Role” of the IPCC then you would see that the answer to your question is ‘Yes’. I explain this as follows.
The IPCC is only permitted to say AGW is a significant problem because they are tasked to accept that there is a “risk of human-induced climate change” which requires “options for adaptation and mitigation” that can be selected as political polices and the IPCC is tasked to provide those “options”.
This is clearly stated in the “Principles” which govern the work of the IPCC. These are stated at
http://www.ipcc.ch/pdf/ipcc-principles/ipcc-principles.pdf
Near its beginning that document says
So, the IPCC does NOT exist to summarise climate science.
The IPCC exists to provide
(a) “information relevant to understanding the scientific basis of risk of human-induced climate change”
and
(b) “and options for adaptation and mitigation” which pertain to “the application of particular policies”.
Hence, its “Role” demands that the IPCC accepts as a given that there is a “risk of human-induced climate change” which requires “options for adaptation and mitigation” which pertain to “the application of particular policies”.
The change to the graph fulfils that Role.
The IPCC is pure pseudoscience intended to provide information to justify political actions; i.e.Lysenkoism.
Richard
Looks like MSM is onto this
http://www.thenewamerican.com/tech/environment/item/16643-top-scientists-slam-and-ridicule-un-ipcc-climate-report
They need to add SM latest assessment
Willis Eschenbach says:
October 1, 2013 at 9:44 am
KR says [emphasis in original]:
October 1, 2013 at 8:34 am
———————————————–
Willis, KR is referring to a post by Tamino who explains why this is necessary. Funny thing is, even with the shift the predictions don’t line up that well. I can’t track Tamino’s post but it would be worth a link (about 2 weeks ago). I’m in northern China with a crappy internet link.
Once again, the IPCC attempts to show global warming by lowering temperatures.
In the first instance, it was lower historical temperatures while leaving current temps where they are.
Second: Reduce all model predictions by 0.15C to show that current temps have risen as predicted.
This is deliberate fraud.
Since when did the climate modellers not know what 1990 temperatures were. Even the IPCC First Assessment Report forecasts were not produced until 1992 so they would have had the 1990 numbers.
Its a scam.
And I don’t know how we argue against 2,000 scientists and 100 million followers and 50 different governments around the world and 90% of the media who are perfectly willing to go along with a scam.
I do know that the media was not happy with the IPCC not addressing the temperature hiatus. If we can get them to start reporting the latest scam, maybe enough people will take notice and let their common sense take over.
In the first graph of this post, fig.1.4 of the 2nd. AR4 draft, what exactly are those wide grey bands supposed to be? They appear to have been dropped in the final AR4 but this is evidence that they were clearly experimenting with the best way to hide the decline.
The chart from Chapter 11 (unadjusted) seems to have got the baseline in 1990 close enough. Why do the predictions from the (low) scenario RCP 4.5 need to be adjusted lower.
http://s11.postimg.org/631eqngcj/IPCC_Chap_11_11_9.jpg
Bill, notice the name Stott on the third chart.
I’m guessing this is the guy who massively adjusted the Australia past temperature records.
One of Phil Jones’ students or something . Been taught the black art of temperature adjustment !
RE:KR says:
October 1, 2013 at 9:37 am
“. . . the observations should therefore be shifted ~0.1C higher in that figure.”
And there ya go, problem solved. It’s like you’re some kind of RealClimatologist. You crack me up.
It doesn’t matter… they can tell endless lies. The media won’t report it, the pols will pound their fists on the document claiming its fact, no investigative reporters will prod for the truth and the big corps will lobby the lies into their advantage. Those of us who live by the truth will be driven mad,
No matter how much you push the envelope, it is still stationery.
“…the earlier projections have been shifted downwards relative to observations”. From http://climateaudit.org/2013/09/30/ipcc-disappears-the-discrepancy/
Good find. If you missed the goal, simply move the goalpost afterwards to where your kick went. An enviable device for any NFL team.
@Mark Hladik –
I’ve been following the comments by readers on Yahoo News’s numerous alarmist stories for some time, and I’d estimate that 95 percent of them are from skeptics – and the alarmies who do comment can usually only resort to ad hominem name calling and insults, ad verecundiam appeals to authority, and citing of “facts” that are so ridiculous as to be laughable (as an example, one mollusk claimed that all the ice has melted on the Arctic Ocean – this in the face of the NASA photographs showing its greatest extent in many years).
It does offer hope that we’re winning the war through the Internet ands having some real success getting around the mainstream media’s (translate: der Fuehrer’s Ministry of Truth, a la Orwell’s 1984) censorship. So many of Yahoo News’s stories betray their ignorance and bias at every turn
you know I just love visiting this site, because it’s one giant own fest on the real climateers. Oh boo hoo, we had to change the baseline period of the graph, and that of course happened to change the graph in our favor. This graph that’s causing all the commotion has been out for months, the real climateers didn’t like how it was being vetted in the media, so they changed the whole thing. I’m no climate scientist, but it is easy to see who is right and who is wrong, when one side just constantly cheats. And the models really are stupid. When you have to factor something like cloud growth and formation, to think that you can predict it 100 years from now is idiotic.
And I believe I can speak for all the skeptics and deniers (I prefer denier…but I always clarify that I am a denier of the 300% positive feedback theory) when I say the skeptics have formed a consensus. We have formed a consensus that your consensus is nuts.
Their credibility is just absolutely shot.
That’s what I keep saying–only its not only them who use the corrupted data–we keep using it too, to make points. I wish we put the nosh on that and all use raw data–or pick some year when it may have made sense to adjust and only use that data and refuse to use the “updated” data. It makes my blood boil every time i see a graph that puts 1934 as slightly cooler than 1998–we all know that is not so. Now tell me why we continue to go along?
Frank, they are impossible to hide now! but like others say the media goes along and few call them out on it.
True true Mad Max.
Indeed. I have always thought they ceded far too much, and had no care for the rhetorical public consequences thereof.
There is NO real world data demonstrating atmospheric CO2 warming the surface.
They have also adopted the standard alarmist ploy of going back to the coldest point in the much adjusted Giss/HadCrud record.
ALL the data is from the upward arm of the natural climate cycle, and ALL has been adjusted to greatly increase the trend.
We are sooooo lucky the satellite record came along, otherwise, by now we would all be roasting (according to Giss/hadCrut)
Cooking the numbers, hiding the decline, falsifying the graphs. IPCC: the International Pushers of Climate Cheating.
Alternatively: The International Providers of Climate Cheats.
Lars,
its “Intergovernmental”
Please don’t leave the role of governments out !
Day by Day said…
“It makes my blood boil every time i see a graph that puts 1934 as slightly cooler than 1998”
SLIGHTLY ? They squashed the begeesus out of it !!
1934 to 1940 no longer exists !!
– – – – – – – – – –
That SOD figure 1.4 was abandoned and replaced in the final report with a different figure 1.4. It is unclear to me whether the the final figure 1.4 also has content that is not in the peer reviewed literature.
Is the IPCC being consistent in both draft and final figure wrt including non-peer reviewed content?
John
The IPCC has left itself open to a deadly counterpunch. A (Republican) House committee on the environment could invite critics and supporters of the chart to testify. Witnesses should be asked to remain in town to be available for second and third rounds of questioning, to respond to the testimony of other witnesses. In addition, experts on statistics and chartology should be asked to testify.
This event could decisively turn things around, by authoritatively discrediting the objectivity and trustworthiness of the IPCC, and by enhancing the credibility and newsworthiness of climate contrarians.
In addition, there are thin vertical bars to the right of the old chart that show the range of the spread for each of the ARs. These do not include the gray shaded patch.
Say, someone with chart skills should create a chart that shows only the IPCC’s Business-As-Usual projections. This would be more realistic–and more damning to alarmism. Witnesses at the Congressional hearing (that I suggested above) should present such chart and all other witnesses should be asked to comment on it.
As a necessary (?) prelude to getting this hearing scheduled, our side should start calling for one, organizing, petitioning, demonstrating, publishing a large ad in MSM papers signed by a lot of scientists, etc. Someone with a good talent for summing things up like Monckton should write a first draft of an appeal to congress for an inquiry and post it here.
Warmists have been blinded by the easy ride they’ve had so far and by their own hubris into failing to foresee the trap they’ve laid for themselves.
John Whitman:
You ask at October 2, 2013 at 12:53 am
The IPCC has no reason and no desire to be consistent “wrt including non-peer reviewed content”.
The IPCC only needs to be consistent with the decisions made by politicians when amending and approving the SPM. This is explained with quotations, references and links to official IPCC document in my above post at October 1, 2013 at 3:18 pm
http://wattsupwiththat.com/2013/10/01/mcintyre-on-ipccs-switching-the-pea-under-the-thimble/#comment-1433281
However, your posts on other WUWT posts demonstrate that you refuse to accept the reality that the IPCC is a political organisation. You repeatedly proclaim the IPCC is a scientific organisation which has done bad science. So, I will spell out the fact that IPCC Reports are required – and only required – to agree with the political decisions.
When John Houghton was IPCC Chairman. He then decreed,
“We can rely on the Authors to ensure the Report agrees with the Summary.”
This was done and has been the normal IPCC procedure since then. So, IPCC custom and practice dictate that the AR5 report will be edited to match the SPM. This custom and practice enabled the infamous ‘Chapter 8′ scandal so perhaps it should – at long last – be changed.
Such adjustment of Reports to agree with the SPM is stated in Appendix A of the AR5. It says
I would be grateful if anybody were able to explain why some people want to think the IPCC is a scientific organisation when the purely political nature of the IPCC is declared by its name, its nature, its governing principles and its official procedures as stated in its own words in its own documents.
Richard
RE: RC Saumarez says:
October 1, 2013 at 9:10 am
“…I can only suggest that every scientist writes to their national academy and points out World policy is being made on the basis of scientific fraud and that they should perform an investigation…”
I agree. Until scientists themselves revolt, there are some policy-makers who think they can lie with impunity.
AndyG55 says: @ October 1, 2013 at 7:03 pm
Bill, notice the name Stott on the third chart.
I’m guessing this is the guy who massively adjusted the Australia past temperature records….
>>>>>>>>>>>>>>>>
Googling Stott turns up this interesting tidbit from The Official blog of Australia’s (AEC registered) NO CARBON TAX Climate Sceptics party (NCTCS)
– – – – – – – – –
richardscourtney,
Appreciate your comment. Thanks.
When I asked that question about whether the IPCC also used non-peer reviewed literature in the final figure 1.4, I was well aware of Donna Laframboise’s two books on the IPCC ( ‘Dustbin’ and ‘Teenager’ ) which showed, with numerous extensively documented instances, that the IPCC uses a significant amount of literature that is not peer reviewed (grey literature). She importantly then emphasizes their PR often intentionally misleads the public to think that they use only peer reviewed literature in their assessments.
I still would very much appreciate help to get an answer to my question.. I am asking it so I can assess where their ‘puck***’ (‘pea’ in McIntyre’s words) is going to be come January 2014 when AR5 is formally final.
As to the part of your comment (quoted above) I have put in bold emphasis, here is my response. My concepts of the IPCC is as follows in italics. {Note it does not reflect your view of my concepts. Also, another note of thanks to you, richardscourtney, because you have given another fine opportunity to again express my concepts on this subject.}
While one of the necessary causes of the irrational basis of the IPCC behavior is political affiliation, it is not a sufficient cause; there are more fundamental causes that determine their irrational behavior that exist that are worthwhile for me to analyze. I have the concept that a sufficient cause of its irrationalism is the manifold epistemological theories in post modern philosophy that inform all aspects of the IPCC; including but not limited to its ‘scientific’ behavior and processes. Their political behavior is also formed by post modern philosophy as well. Premise detection 101.
As to your appeal for helping you to understand in your concluding paragraph in your comment, I think the books of Donna Laframboise can help you. She proves that what the IPCC and the UN body that founded it actually says and does, in all vital aspects, has little resemblance to what it officially says and does; including what its charter says or what the UN says about their child the IPCC.
John
**** A good hockey player plays where the puck is. A great hockey player plays where the puck is going to be. Wayne Gretzky
John Whitman says: @ October 2, 2013 at 6:16 am ….
>>>>>>>>>>>>>>
You might be interested in what Pascal Lamy has said by way of recent international political history in Whither Globalization?
Lamy is Director-General of the World Trade Organization and before that “..former European Commissioner for Trade. Lamy is currently the Honorary President of Paris-based think tank Notre Europe….
When Delors became President of the European Commission in 1984, he took Lamy with him to serve as chef de cabinet, which he did until the end of Delors’ term in 1994. During his time there, Lamy became known as the Beast of the Berlaymont, the Gendarme and Exocet due to his habit of ordering civil servants, even Directors-General (head of departments) “precisely what to do – or else.” He was seen as ruling Delor’s office with a “rod of iron”, with no-one able to bypass or manipulate him and those who tried being “banished to one of the less pleasant European postings”” (WIKI)
Since CAGW is intertwined with international politics you need at least a smidgen of understanding of where the international politicians stand.
Approved Draft Fig. 1.4 is a “Hide the Hindcast”. feat of prestidigitation.
I am reading between the lines, but all this talk of the earlier projections have been shifted downwards relative to observations leads me to the jaw dropping conclusion that to make the models better fit the 1990-2000 observations, they have dispensed with model fit to 1970-1990 by separate DC shifts applied to each models output.
This is another “hide in plain sight” caper. Instead of erasing one inconvenient temperature decline, IPCC authors minimize the color saturation of all 39 models in the calibration interval. It is now impossible to track any one model through the calibration interval.
Very clever — while the eye is trying to trace out lines in the 1990-2050 with a deliberate obfuscating color map, the eye pays no attention to the training interval prior to 1990. We are meant to focus on the wrong area of the chart. Pure magic. Sleight of hand and line.
We are left to assume that they have been honest with the best fit of each model with the calibration interval of 1970-1990. However, if the fit of models to observations in 1990-2010 improves between SOD and Approved because of “shifted downwards” adjustments, then the fit to the training period must get worse. They are hiding the increase in hindcast error. They are hiding their abandonment of the model calibrations.
It is time to demand the R^2s of Each of the Models to the 1970-1990 observations, before and after the shifts made to create the Approved Draft Fig. 1.4. Each model should be plotted separately with before-shift (SOD) and after-shift (Approved) and watch what happens to fit in the 1970-1990 training interval. There is a smoking gun here — with 39 shell casings.
(This is an expansion of a cross-posting at judithcurry Spinning… model-observation comparison)
– – – – – – – – –
Gail Combs,
Thanks for the reference and I appreciate your comment.
I went through the linked article.
A SERIES OF RELATED QUESTIONS => Do you think, as I do:
1. That a person’s political views (political world view / political philosophy) are either explicitly or implicitly derived from their ethical views (ethical world view / ethical philosophy)?
2. That their ethical views are either explicitly or implicitly derived from both their views on the nature of reality (which includes mankind’s nature) and also their views on the nature of man’s knowing mind? Respectively, those are views related to metaphysics and epistemology in the field of philosophy.
I consider a person’s political views as end products which are derived from those other fundamental views in my above stated hierarchical order.
Therefore the political aspects of the IPCC Bureau’s intellects are not the most fundamental & sufficient causes of their irrational behavior. Their metaphysical and epistemological views are. : ) Likewise, the views of the IPCC Bureau’s intellects on scientific processes and behaviors are a derived from their metaphysical and epistemological views.
So I am looking at the post modern philosophy in total as a candidate for the basis of their irrational ‘scientific’ processes and behavior. NOTE => It could explain the IPCC Bureau intellect’s political views as well, which I think many on this thread are more interested in than I.
John
John Whitman:
At October 2, 2013 at 10:08 am you write.
No! Employees do what they are employed to do.
Civil servants are employed to operate the systems decided by the politicians who employ them. They get sacked by their employers if they allow their own opinions to decide their actions.
The IPCC is a purely political organisation run by politicians for politicians and operated by their employees (both directly and indirectly employed employees). I have repeatedly explained this to you and also in this thread at October 1, 2013 at 3:18 pm
http://wattsupwiththat.com/2013/10/01/mcintyre-on-ipccs-switching-the-pea-under-the-thimble/#comment-1433281
But in this and other WUWT threads you persistently ignore reality and pretend the IPCC is a scientific organisation that has somehow gone wrong. Contrary to your propaganda, the IPCC is a purely political organisation which is doing exactly what the politicians have specified it should do.
Richard
@richardscourtney 10:25 am, @John Whitman 10:08 am
You are both right. Employees are paid to do what they are told by their employers. However, an employee could not long serve an employers if the employee’s ethical and epistemological foundations were incompatible with those of the employers.
Sorry if this has been mentioned before, but in my opinion they shouldn´t have used HadCRUT4 data since this data set was not available when the models were run.
Stephen Rasey:
Your post at October 2, 2013 at 10:41 am says
I agree the pedantic point you make.
However, if those employees left because they were morally challenged by the activity then other people would take their places. It is a pointless and trivial side-track to discuss what may or may not be “the employee’s ethical and epistemological foundations”. That side-track obfuscates the fact that the employees are fulfilling political and NOT scientific duties.
All that matters is that the IPCC is a political organisation run by politicians for politicians who employ people to fulfill the required functions.
Richard
and
– – – – – – – –
Stephen Rasey & richardscourtney,
Hey, Stephen Rasey, nice to hear from you. Thanks for commenting. And also a pleasure to engage richardscourtney, thanks .
I think we should consider that an organization, whether government owned or privately owned, pays a certain type of person(s) in their organization to be a fully empowered functional owner of a certain part of the organization and to have a kind of intellectually influencing leader of other members of the organization. These line managers or directors or bureau members, call them what you will, are paid specifically to not have a classic employee mentality. They are paid as leadership professionals as owners of an entire self contained area and of its employees.
It is those kinds of people I was talking about in my quote used by richardscourtney. They are paid by the owners of the org to act as owners of parts of the org and their performance is measured that way ; they are the leadership brains or org intellectuals if you will.
Among the many nuanced perks of those kind of people is to influence the org’s process of evaluating / hiring / firing the rest of the org’s personal; they by their choices decide what org values and what supporting org philosophy is predominate.
Also, in the development and interpretation of the org’s plan and in decisions that involve situations that no plan can anticipate, there is much opportunity for significant intellectual type discretion of those roles.
I hope this helps to further an interesting discussion.
NOTE: I was somewhat in one of those types of roles in a Fortune 500 company (I may be wrong, but I think it is the only one of the original Fortune 500 companies to still be on the list today) for a significant part of the 30 years I was paid by them. Most of the customers I dealt with were huge government owned and government operated utilities and institutes and agencies, so am somewhat familiar with management dynamics of public bureaucracies. I could pretty much fundamentally influence the org by who I hired, indeed the company looked for that kind of intellectual ownership in further promoting leaders. It was a blast!
John
PS to richardscourtney => as to your comment about my ‘persistence’, well we are rather identical in that regard. N’est ce pas? : )
PSS to richardscourtney => again remember what the IPCC is supposed to be and what it says it is, per Donna Laframboise’s two books, has little conformity to what it actually is and does. Likewise what other UN bodies say the IPCC is and has the same problem.
John Whitman:
re your post at October 2, 2013 at 12:13 pm.
Yes, I am “persistent” in condemning obscurantist trivia intended to deflect from subjects under discussion.
As I concluded in my post at October 2, 2013 at 11:00 am in reply to Stephen Rasey
I have repeatedly explained that to you with quotations, links, and references to the IPCC’s own documents which explicitly state it. But you repeatedly ignore it and persist in your propaganda claiming the IPCC is a scientific organisation that has – and has made – a few mistakes.
I will persist in refuting your propaganda if you keep promoting it.
Richard
@John Whitman 12:13 pm
These line managers … are paid specifically to not have a classic employee mentality. They are paid as leadership professionals as owners of an entire self contained area and of its employees.
I’ll agree, with the proviso that the owners are concerned with what is most valued on the “balance sheet” and “P&L statements” of the organization.
If it is a retail organization, it is what sells and cost of goods sold.
If it is an engineering firm, it is risk and reward with nature itself keeping everyone honest.
If it is a political organization, it is ‘Yessir, yessir, three bags full, sir!” It is whatever it takes to keep the contract services renewed, to keep the position of power, ultimately decided by another political animal.
I reject the notion of a “classic employee mentality.” The population of employees in any organizaiton is not static. The organization self-filters for employees with ethical and epistimollogical foundations compatible with the owners and filters out those with conflicts.
richardscourtney on October 2, 2013 at 12:51 pm
@John Whitman on October 2, 2013 at 12:13 pm.
Yes, I am “persistent” in condemning obscurantist trivia intended to deflect from subjects under discussion.
As I concluded in my post at October 2, 2013 at 11:00 am in reply to Stephen Rasey
All that matters is that the IPCC is a political organisation run by politicians for politicians who employ people to fulfill the required functions.
I have repeatedly explained that to you with quotations, links, and references to the IPCC’s own documents which explicitly state it. But you repeatedly ignore it and persist in your propaganda claiming the IPCC is a scientific organisation that has – and has made – a few mistakes.
I will persist in refuting your propaganda if you keep promoting it.
Richard
– – – – – – – –
richardscourtney,
Appreciate sincerely your comment development as it often does.
As to your last comment ‘s claim that you are “‘persistent’ in condemning [my-John Whitman’s] obscurantist trivia intended to deflect from subjects under discussion”, I think you should reconsider that claim because you were the very first person on this thread to introduce that very subject in your comment addressed to me (richardscourtney on October 2, 2013 at 3:33 am). I had not previously discussed it on this thread.
Please reconsider your logic. You are introducing a topic addressed to a specific person then after that person engages with you on your initiated topic you claim that person is “deflecting from subjects under discussion” on this thread.
Finally, as to your last comment to me quoted above, please consider that I am personally somewhat hurt by your non-benevolent initiation of pejoratives in response to my sincere and civil comments to you.
John
@urederra October 2, 2013 at 10:46 am
I can’t see a problem in using a newer temperature data set for evaluation purposes if that data set is an improvement for describing the state of the real world and/or the previous version of the data is no longer available. However, choosing a specific data set solely for the purpose of improving your results would be a no-no.
John Whitman:
In your post at October 2, 2013 at 2:01 pm you say to me
That is a lie. You introduced it.
This link jumps to my post at October 2, 2013 at 3:33 am
http://wattsupwiththat.com/2013/10/01/mcintyre-on-ipccs-switching-the-pea-under-the-thimble/#comment-1433671
That post answered your question; i.e.
I there explained
You then tried to switch back to your assertions of the IPCC being a scientific organisation, and you introduced discussion of what you called “metaphysical and epistemological views” of IPCC employees. No way did I or would I introduce such nonsensical and irrelevant trivia.
You are trolling. Stop it.
Richard
Not sure this will post properly but …
These are the multi-model means from IPCC AR5 RCP 4.5 scenario for 2013.
2013 0.744629
2013.083 0.759308
2013.167 0.729889
2013.25 0.697327
2013.333 0.675629
2013.417 0.69928
2013.5 0.707489
2013.583 0.736572
2013.667 0.761047
2013.75 0.812653
2013.833 0.823792
2013.917 0.827026
And the numbers from IPCC AR4.
year Hadcrut4 20C3M commit B1 A1B A2
1990 0.291 0.291 -999.999 -999.999 -999.999 -999.999
1991 0.253 0.211 -999.999 -999.999 -999.999 -999.999
1992 0.102 0.055 -999.999 -999.999 -999.999 -999.999
1993 0.143 0.168 -999.999 -999.999 -999.999 -999.999
1994 0.203 0.22 -999.999 -999.999 -999.999 -999.999
1995 0.324 0.253 -999.999 -999.999 -999.999 -999.999
1996 0.179 0.308 -999.999 -999.999 -999.999 -999.999
1997 0.392 0.326 -999.999 -999.999 -999.999 -999.999
1998 0.531 0.347 -999.999 -999.999 -999.999 -999.999
1999 0.301 0.383 -999.999 -999.999 -999.999 -999.999
2000 0.294 -999.999 0.4 0.424 0.429 0.445
2001 0.437 -999.999 0.43 0.418 0.423 0.455
2002 0.492 -999.999 0.444 0.443 0.461 0.451
2003 0.503 -999.999 0.425 0.481 0.505 0.446
2004 0.445 -999.999 0.445 0.522 0.513 0.494
2005 0.539 -999.999 0.454 0.509 0.528 0.538
2006 0.495 -999.999 0.484 0.512 0.551 0.561
2007 0.483 -999.999 0.498 0.552 0.59 0.562
2008 0.388 -999.999 0.534 0.56 0.624 0.576
2009 0.494 -999.999 0.535 0.548 0.603 0.565
2010 0.547 -999.999 0.519 0.602 0.597 0.612
2011 0.406 -999.999 0.533 0.689 0.628 0.645
2012 0.448 -999.999 0.517 0.678 0.705 0.65
2013 0.468 -999.999 0.486 0.659 0.694 0.649
The problem isn’t that either the prediction is falsified or the prediction is trivial. With that kind of error range, there is nothing inconsistent with the party line. Of course, since nothing can disprove it, nothing proves it either.
So which is it? False, Trivial, or both?
– – – – – – – –
richardscourtney,
Here we are again, it is an opportunity for stimulating ideas. Thanks for your comment.
On this thread you introduced us to your political view of the IPCC in a comment to me (richardscourtney on October 2, 2013 at 3:33 am). Prior to that in your comment ‘richardscourtney on October 1, 2013 at 3:18 pm’ you also introduced us to your political view of the IPCC.
Up until your unilateral initiation into this thread of your political view of the IPCC, the thread and McIntyre’s lead post was rather consistently about the content of AR5 and the scientific concepts of the IPCC’s processes and possible philosophy of science basis it has used or will use. Prior to your interjection of political views of the IPCC, the thread had a non-political flavor and focus.
After your initiation of political views on this thread, I responded in an active dialog with you that was critical of your political views of the IPCC by expressing my non-political views of the IPCC . . . now you call me a troll. Nah.
As to your accusation of lying. Nah.
Persistently, I remain benevolently inclined to be civil with you.
John