Plus notes on the ARCUS sea ice forecasting contest
As I pointed out on September 16th in Sea Ice News Volume 4 Number 5: No ice free Arctic this year – it appears that Arctic sea ice has turned the corner sea ice has most definitely turned the corner now.
 Japan Aerospace Exploration Agency (JAXA) – International Arctic Research Center (IARC) – Click the pic to view at source
Details and raw data on this graph product here
From NSIDC, who finally made the call yesterday:
====================================================================
Arctic sea ice reaches lowest extent for 2013
On September 13, Arctic sea ice reached its likely minimum extent for 2013. The minimum ice extent was the sixth lowest* in the satellite record, and reinforces the long-term downward trend in Arctic ice extent. Sea ice extent will now begin its seasonal increase through autumn and winter. Meanwhile, in the Antarctic, sea ice extent reached a record high on September 18, tied with last year’s maximum.
Please note that this is a preliminary announcement. Changing winds could still push ice floes together, reducing ice extent further. NSIDC scientists will release a full analysis of the melt season in early October, once monthly data are available for September.
Overview of conditions

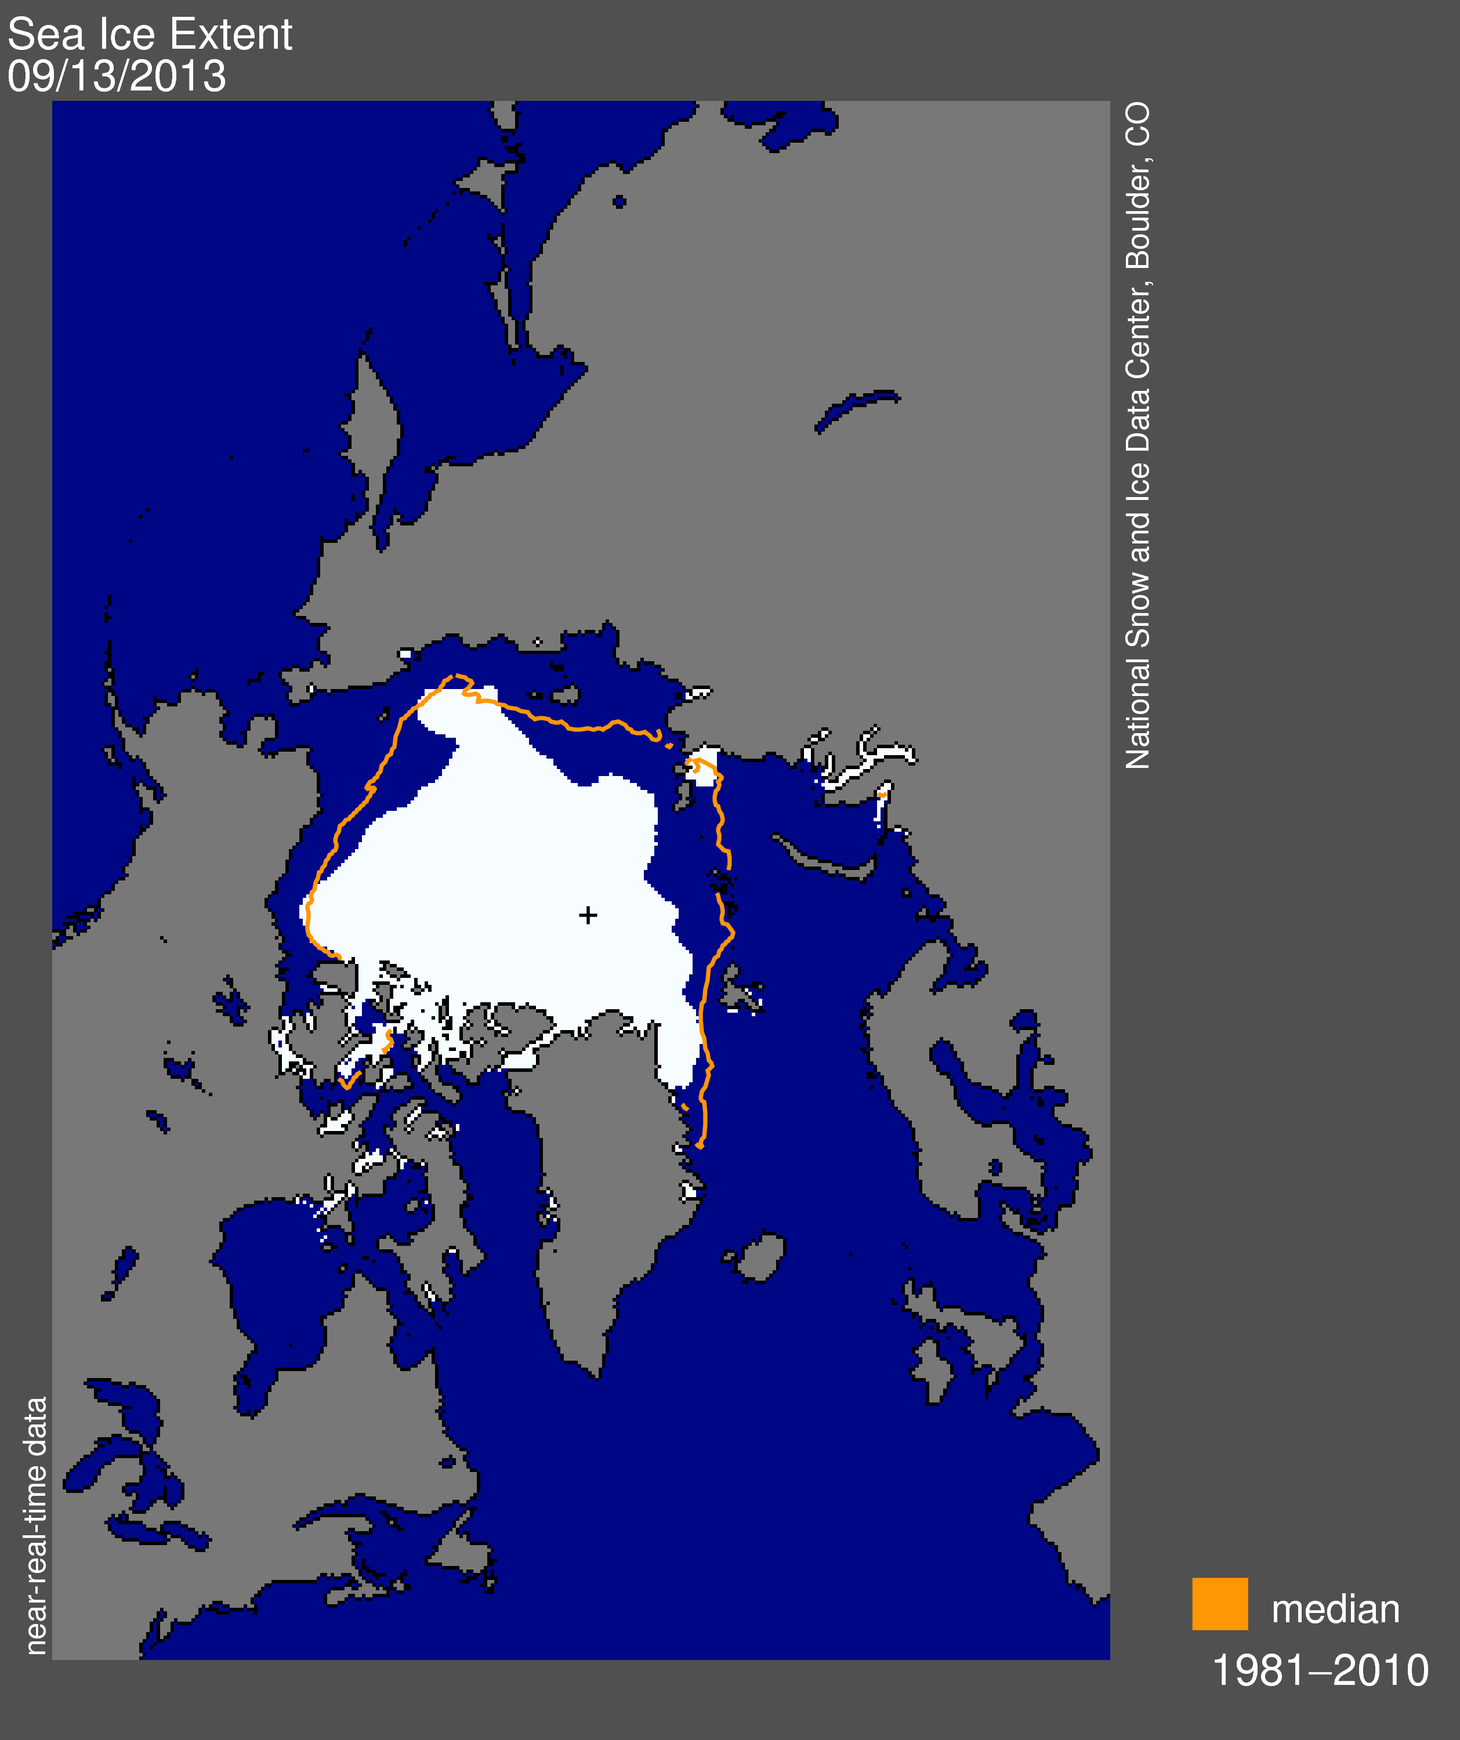
Figure 1. Arctic sea ice extent for September 13, 2013 was 5.10 million square kilometers (1.97 million square miles). The orange line shows the 1981 to 2010 median extent for that day. The black cross indicates the geographic North Pole. Sea Ice Index data. About the data
Credit: National Snow and Ice Data Center
On September 13, 2013, sea ice extent dropped to 5.10 million square kilometers (1.97 million square miles). This appears to have been the lowest extent of the year. In response to the setting sun and falling temperatures, ice extent will now climb through autumn and winter. However, a shift in wind patterns or a period of late season melt could still push the ice extent lower. The minimum extent was reached two days earlier than the 1981 to 2010 average minimum date of September 15.
Conditions in context

Figure 2. The graph above shows Arctic sea ice extent as of September 19, 2013, along with daily ice extent data for five previous years. 2013 is shown in blue, 2012 in green, 2011 in orange, 2010 in pink, 2009 in navy, and 2008 in purple. The 1981 to 2010 average is in dark gray. Sea Ice Index data.
Credit: National Snow and Ice Data Center
This year’s minimum was 1.69 million square kilometers (653,000 square miles) above the record minimum extent in the satellite era, which occurred on September 16, 2012, and 1.12 million square kilometers (432,000 square miles) below the 1981 to 2010 average minimum.
Varying distribution of ice in 2013 versus 2012

Figure 3. This image compares differences in ice-covered areas between September 13, 2013, the date of this year’s minimum, and September 16, 2012, the record low minimum extent. Light gray shading indicates the region where ice occurred in both 2013 and 2012, while white and dark gray areas show ice cover unique to 2013 and to 2012, respectively. Sea Ice Index data. About the data
Credit: National Snow and Ice Data Center
Comparing this year’s minimum extent to 2012, while extent was higher on average this year, there were variations from region to region. There was considerably higher sea ice extent in the Beaufort, Chukchi, and East Siberian sea regions, with the ice edge several hundred kilometers farther south compared to last year. This year the Canadian Archipelago also retained much more ice, keeping the Northwest Passage closed. The most notable area of less ice this year compared to last was off the east coast of Greenland, south of Fram Strait. Other small areas of decreased extent were found north of the Kara and Laptev seas.
See an animation of this summer’s sea ice extent produced by the NASA Scientific Visualization Studio at http://svs.gsfc.nasa.gov/goto?4104.
Previous minimum Arctic sea ice extents**
| YEAR | MINIMUM ICE EXTENT | DATE | |
|---|---|---|---|
| IN MILLIONS OF SQUARE KILOMETERS | IN MILLIONS OF SQUARE MILES | ||
| 2007 | 4.17 | 1.61 | September 18 |
| 2008 | 4.59 | 1.77 | September 20 |
| 2009 | 5.13 | 1.98 | September 13 |
| 2010 | 4.63 | 1.79 | September 21 |
| 2011 | 4.33 | 1.67 | September 11 |
| 2012 | 3.41 | 1.32 | September 16 |
| 2013 | 5.10 | 1.97 | September 13 |
| 1979 to 2000 average | 6.70 | 2.59 | September 13 |
| 1981 to 2010 average | 6.22 | 2.40 | September 15 |
* According to near-real-time data, this year’s minimum extent is slightly lower than 2009. However, the ranking between 2009 and 2013 is close, and may change once the final version of the data are processed. See our Frequently Asked Questions: Do your data undergo quality control? for more information about near-real-time data.
** Note that the dates and extents of the minimums have been re-calculated from what we posted in previous years; see our Frequently Asked Questions for more information.
====================================================================
The ARCUS sea ice forecasting contest
WUWT’s ARCUS Arctic sea ice forecast wasn’t far off the mark in June 2013, we actually did better than most with 4.8 million sqkm:
 for September 2013 sea ice extent (values are rounded to the tenths).")
Download High Resolution Version of Figure 1.
I had to laugh at the Met Office forecast. So much for supercomputer driven model skill.
WUWT didn’t participate in July due to scheduling conflicts with 4th of July holiday I had in making the deadline, but here are the entries:
 for September 2013 mean sea ice extent (values are rounded to the tenths).")
Download High Resolution Version of Figure 1.
The gloom and doom forecast of the Met Office didn’t change at 3.4, but it was bested by ultra-gloomer “Neven” at the Arctic Sea Ice Blog who said 3.2 would be the value.
WUWT did participate in August, essentially no change for the averaged top 5 vote.
Since ARCUS didn’t plot them, I’ve plotted all the participant forecasts below.

Figure 5: plot of September Arctic Sea Ice Extent Mean forecasts submitted to ARCUS in August 2013.
WUWT’s value is based on a weighted calculation of the top five vote getters in our poll here: http://wattsupwiththat.com/2013/08/11/sea-ice-news-volume-4-3-2013-sea-ice-forecast-contest/
The most popular value picked by WUWT readers was 5.0 msq/km 8.9% (94 votes), though it wasn’t a runaway vote, hence I opted for a weighted average of the top 5 vote getters.
The Met Office seems to have bowed out, and even at the late date, “Neven” was firmly in the gloom category again with 3.6.
The NCAR model ensemble guess didn’t do much better.
It should be noted that ARCUS has not made the final report yet, and that their forecast contest is based on the NSIDC September extent average, which has yet to be recorded. I’ll report that when it is available. Overall though, I’d say WUWT readers did better than gloomers, modelers, and of course, Wieslaw Maslowski.
Most certainly, even though the counter on the sidebar has not reached the Autumnal equinox indicating the end of summer, clearly Maslowski is falsified for 2013:
BBC – 12 December 2007
“Our projection of 2013 for the removal of ice in summer is not accounting for the last two minima, in 2005 and 2007,”…….”So given that fact, you can argue that may be our projection of 2013 is already too conservative.”
[Professor Wieslaw Maslowski]

Maslowski joins NASA’s Jay Zwally in the Hall of Lame:
National Geographic – 12 December 2007
“NASA climate scientist Jay Zwally said: “At this rate, the Arctic Ocean could be nearly ice-free at the end of summer by 2012, much faster than previous predictions.” ”
[Dr. Jay Zwally – NASA]
And of course, let’s not forget the Sierra Club:
Sierra Club – March 23, 2013
“For the record—I do not think that any sea ice will survive this summer. An event unprecedented in human history is today, this very moment, transpiring in the Arctic Ocean….”
[Paul Beckwith – PhD student paleoclimatology and climatology – part-time professor]

Source: http://www.sierraclub.ca/en/AdultDiscussionPlease
Read more on the ARCUS forecast here: http://www.arcus.org/search/seaiceoutlook
And of course, the WUWT sea ice reference page: http://wattsupwiththat.com/reference-pages/sea-ice-page/
This would be a good time to remember the GRL paper from Tietsch et al in 2011 showing how uncovered and uninsulated arctic creates a strong negative feedback that promotes ice recovery. I think this is in large part responsible for the wild swings in the Arctic sea ice anomaly since 2007, which was at the time a record low for the satellite era. The 2007 low was the initial shock that has been ringing a low-frequency bell ever since, as positive and negative feedbacks compete. (see: http://arctic.atmos.uiuc.edu/cryosphere/IMAGES/seaice.anomaly.arctic.png )
Tietsch et al write:
(emphasis added)
In a single picture
this is what is most likely going to happen in the arctic, based on the last 30 years
alternatively, take the first picture above and then average the red, orange and blue lines for the first 1/3 of the 2010’s average and compare it with the dotted grey lines above.
and please understand that the average ice thickness during this period has gone down by 50% since 1980
[No. Future readers are alerted to the first “link” which is to “download attachments” Most readers do NOT want to load other’s files into their PC’s. Mod]
Antarctic ice very close to 2012s extent….
One can only hope that Beckwith has spouted his prediction long and loud on campus, and that any students he happens to have academic contact with will see this as a reason to question everything they are being taught.
Why has the countdown stopped? One day to go, not two.
Or is this a dastardly plot to win by stopping the clock for as long as it takes (thousand years or so) to find an ice-free arctic sea?
and reinforces the long-term downward trend in Arctic ice extent
=========
if my bank account is going down, and then it goes up, how does this upward amount reinforce the downward trend? only in climate science, where belief conquers all.
Might be worth showing the IPCC prediction as well. 10-13b is the one most relevant:
http://ipcc.ch/publications_and_data/ar4/wg1/en/figure-10-13.html
RE: UnfrozenCavemanMD says:
September 21, 2013 at 10:44 am
I agree that the open water on the Eurasian side of the Pole will create a strong negative feedback. Among other things, a different dynamic kicks in when sub-zero wind blows over open water. Rather than the ice on the surface acting as starter-crystals, and a sort of top-down cooling occurring, instead the surface water simply sinks and is replaced by rising warmer water, the result being that the water is chilled down to the pycnocline 300-450 feet down. No longer do have a layer of ice with warmer currents moving under it. Also you no longer have summer storms sucking up warmer water from below, for the entire column of water is colder. I think that is why it was colder during the warmest part of the summer up at the pole this year, and also why the summer gales didn’t break up the ice as much.
I also thought the colder water meant the refreeze would start earlier, but I was wrong there. My vote was for a minimum extent of 6 million km2. While casting my vote in Anthony’s poll I must have clicked the wrong link. All of a sudden I was confronted by a lengthy form to fill out. I wondered why Anthony was asking all these questions, but just shrugged and filled out the form. You can imagine my chagrin when I saw my name on the graph. Yes, I’m the Bozo who submitted the prediction of 6 million. But you have to give me this: I beat the heck out of the UK Met Office.
By the way, the North Pole Camera is showing an ice breaker stopped in the distance. WUWT?
See bottom of post at: http://sunriseswansong.wordpress.com/2013/09/19/arctic-sea-ice-minimum-the-darkness-decends/
I missed it…..but was close…..I guessed 5 million
Beckwith apparently doesn’t know that the Arctic has often been virtually ice free in Holocene summers, as it was during much of the Eemian Interglacial. In both these interglacials, modern humans existed, so he’s as wrong on the anthropology as the climate.
We have heard it all before, no doubt there will be much grinding of teeth and the usual non-scientific excuses like “the heat has gone into the oceans”. An apology would be nice, but it will not happen, I think the general public are sick and tired of hearing this b******t, because I certainly am.
and reinforces the long-term downward trend in Arctic ice extent
=========
this bit of mathematical nonsense shows the NSIDS statement is political not scientific.
Why do government science agencies feel the need to take a position one way or the other? why do they not simply publish the facts without adding the spin?
Is it because government science agencies are first and foremost political organizations, and only secondarily science organizations?
Even with a range of 100% the UK Met of Betts and clowns still couldn’t get near it.
This is of no surprise, and just like they are wrong about arctic sea ice, they will be wrong on global warming.
“Serious stuff: Adult discussion time…”
One can find these and similar words all around the web. Original thinking is like a far away planet for those people and they all fancy themselves as astronauts.
Is Paul Beckwith related to Harold Camping? The underlying ‘the world is coming to an end’ – ‘change your ways’ – ‘all but a few of the human race will survive’ – ‘on it will come to pass’ etc etc/… And of course the other major point they have in common is being totally wrong. But that doesn’t seem to prevent mindless followers supporting them.
It should be noted that being mindless doesn’t mean lack of academic qualifications..or as Stephen Vizinczey put it: “Strange as it seems, no amount of learning can cure stupidity, and higher education positively fortifies it.
.
sounds like Mr. Mann has lots of ice to use his stick on .
[Check your user_id please. Mod]
You might as well re-set your countdown widget on the top right of the WUWT page to point to our next gloomer: Professor Peter Wadhams. Here is what he has said in the past.
Just 2 years to go!
Wadhams has also said:
Guardian – 17 September 2012
“This collapse, I predicted would occur in 2015-16 at which time the summer Arctic (August to September) would become ice-free. The final collapse towards that state is now happening and will probably be complete by those dates“.
[Professor Peter Wadhams – Cambridge University]
Wadhams has also said:
This is an update chart now that September 15th has past by. This same chart was included in one of Anthony’s SeaIce articles about the same date last year.
Don’t know what caused me to create this chart, just a question in my mind, but i thought other’s might find this statistical curiosity, well… curious, since it gives a different view to what the says from the Arctic, in reverse being a look at the water, not ice.
Remember, this is showing the daily mean of OPEN Arctic Ocean area, not ice extent, and this is an anomaly (differences) from the mean, daily, then averaged for the year.
http://i39.tinypic.com/2nuhfnp.png
One, I found it curious how this chart forms segments of rather straight lines. And I do remember why I started this, even though 2012 had a huge storm right at the end of the melt season last year most of the time into late spring showed a high amount of ice on a daily basis… I wondered what if you took every day into account.
If you see any mistakes, let me know. Don’t know if the logic of winters holds true and don’t put any weight on the polynomial fit, no predictive power there, just to show the general smooth curve.
Looks like the met office just looked at last years minimum extent and took a bit off, assuming/believing that it just had to be less.
” and reinforces the long-term downward trend in Arctic ice extent. ”
Jeez, what would have to have happened to _not_ reinforce it in their minds. Anything short of an instant return 1979 ice coverage, I guess.
Beckwith didn’t get the memo.
A one year data point cannot reinforce or disprove a “long-term downward trend “. The statement is meaningless , yet tries to give the impression it is saying something.
If it “confirmed” anything it confirmed the current rate of ice loss is about half what it was between 1997 and 2007.
http://judithcurry.com/2013/09/16/inter-decadal-variation-in-northern-hemisphere-sea-ice/
Now we have to wait for the official alarmist comments of either: i) this is exactly what the models had been forecasting, or ii) “extremely unusual conditions prevailed in the Arctic this summer and so this is no more than an aberration…..”
So will Professor Peter Wadhams receive his P45 (dismissal notice) in September 2015 if his prediction fails (as it almost certainly will)? Fat chance that. They can clearly say what they like and stay in position. Maybe he will even get a bonus as a reward for failure.
Viking artifacts have been found on Baffin and Ellesmere Islands. In fact, the artifacts on Baffin Island suggest a small settlement with a trading post. This begs the question as to how extensive was Arctic sea ice 1,000 years ago during the Medieval Warming Period, not to mention the overall temperature for the area.
Interestingly they talk about the global temperature but never seem to mention global sea ice that is now about the same as it was in 1990.
To me, the most relevant thing here is that the 2013 line is within the 2sd area. This means “move along, nothing to see here”. We’re back to normal.
Peter gives the epitome of head meeting nail.
Could the bias, hopes and intent to mislead the public be any more obvious to even the most casual observer than that reflected in NSIDC’s tortured announcement of the 2013 Arctic sea ice summer minimum extent?
It’s great news that arctic ice has turned the corner for 2013, as well, that the low was 5.1M. However, it’s not a time for gloating, as the result could easily have been very different. The two graphs that I’ve been watching this melt season are ice thickness and ice drift. Considering how little multi-year ice there is and the high drift rates that have observed this season, had the prevailing winds and/or ocean currents not been so favourable, a lot of that thin loose ice could have been swept out to warmer seas where it would have melted, rather than circulated around the polar region where a lot it thankfully remained intact. I hope it freezes with a vengeance and we go into the next melting season with a more solid ice pack than we started this season with.
It may have looked like this work from Lamb in 1965.
H.H. Lamb – 1965
The early medieval warm epoch and its sequel
The Arctic Warm Periods I’m aware of since then is the 15th century Arctic warming and the 1920s to the 1940s Warm Period.
quotes from Jimbo:
Financial Times Magazine – 2 August 2013
“It could even be this year or next year but not later than 2015 there won’t be any ice in the Arctic in the summer,”
[Professor Peter Wadhams – Cambridge University]
__________________
The Scotsman – 29 August 2012
“The entire ice cover is now on the point of collapse.
…….It is truly the case that it will be all gone by 2015. The consequences are enormous and represent a huge boost to global warming.”
[Professor Peter Wadhams – Cambridge University]
This same Professor Peter Wadhams from the illustrious Cambridge University wants us to let him play God with global climate “engineering” – aka tinkering with something you don’t understand.
Since Prof Wadhams is far left field on the outrageous predictions scale and has an unbelievably poor grasp on what is happening, I think he has made it clear to all that he [is] last person on Earth to be trusted with messing about with climate.
He hopes to at the forefront of the God-Complex Team, yet does a great job showing everyone why this must never happen.
http://1.bp.blogspot.com/-bbQ4vIdJyvE/ULQ-HPk-flI/AAAAAAAAG88/NXa5Dz0q3pw/s1600/FIGURE11.JPG
Greg Goodman says:
September 21, 2013 at 11:39 am
” and reinforces the long-term downward trend in Arctic ice extent. ”
Jeez, what would have to have happened to _not_ reinforce it in their minds. Anything short of an instant return 1979 ice coverage, I guess.
Not to defend the NSIDC (because I’m not a alarmist / warmist), but If you look at the long-term trend line, the extent for this year is right on the line. I believe that is what is meant by “reinforces the long-term downward trend”, and like it or not, it is a “reasonable” statement. Had the extent been higher by enough that it was above the trend line, or even better, above the variation along the trend, they would not have been able to make that claim.
To quote the NSIDC: “The minimum ice extent was the sixth lowest* in the satellite record, and reinforces the long-term downward trend in Arctic ice extent.”
Umm – sure. And 2014 will be the seventh lowest, and 2015 will be the eighth lowest, and and 2016 will be the ninth lowest in the satellite record, and will further reinforce the long-term downward trend in Arctic ice extent aso, aso, aso…
The quote of the NSIDC could be funny if it wasn’t so utterly ridiculous.
It must be something in the water. Here is a Letter to Nature published in 1993.
Some of us have noted that 2013 has shown record cold north of the 80th paralel going back to 1958. It does make you wonder about air temperature and thermometers in airports around the Arctic.
http://ocean.dmi.dk/arctic/meant80n.uk.php
Whatever happened to that “green” fleet of sailboats caught in the North-West Passage this summer and reportedly awaiting rescue? I suggest naming that shivering band of adventurers, “The Wadhams Expedition”.
why do all current sea ice graphs start at 1979 when the 1990 IPCC report showed a NOAA sea ice chart going back to 1973 (when the anomaly was almost -1 million sq km)?
Let’s not get carried away here.
The long-term trend in Arctic Ice is till, most definitely, down.
Personally, I don’t think that means a thing… but it will not surprise me if the Arctic is ice-free in my lifetime.
It is worth noting that the date of the end of the seasons melt, and beginning of the cold season expansion continues to change very little if at all. See, see the discussion at
Temporal Trends In Arctic and Antarctic Sea Ice Maximum and Minimum Areal Extents. http://pielkeclimatesci.wordpress.com/2009/09/09/temporal-trends-in-arctic-and-antarctic-sea-ice-maximum-and-minimum-areal-extents/
The reason this is important is that the added CO2 and other greenhouse gases does not yet (if it ever does) alter the dominance of the seasonal solar cooling with respect to when the sea ice recommences to freeze.
The IPCC had an Arctic sea ice anomaly graph in its 1990 report. It showed 1974 lower than the years between 1979 to 1990. Since then I don’t think this graph has appeared in any of their other reports since.
http://stevengoddard.wordpress.com/2013/06/15/ignoring-inconvenient-arctic-data/
http://www.ipcc.ch/ipccreports/far/wg_I/ipcc_far_wg_I_full_report.pdf
Roger, always able to zero in on the meat of the matter. If you’re married, do you have a brother?
M Courtney says:
September 21, 2013 at 12:39 pm
Let’s not get carried away here.
The long-term trend in Arctic Ice is till, most definitely, down.
Personally, I don’t think that means a thing… but it will not surprise me if the Arctic is ice-free in my lifetime.
_________________________
Really? All 5+ million square kilometers, gone?
Did you also point at the low- ice result of ‘the Great Arctic Cyclone of 2012″ as being a significant indicator of sea ice loss?
How long is your lifetime? Have any more meaningless and unverifiable statements?
They predict this cr*p. People get worked up. It doesn’t happen. All people remember is that they are worked up. Keep chipping away to take the shine off the sh*t. The sheepeople aren’t stupid. Just uninformed.
Ultra alarmist V alarmist – Professor Peter Wadhams V Professor Julia Slingo
Here is Wadhams who appears to be defending his 2015 projection in the UK parliament.
” and reinforces the long-term downward trend in Arctic ice extent. ”
The Earth is 4.5bn years old.
The current interglacial has lasted 12,000 years
They have 34 years worth of data.
How the [self snip] do you determine long-term trends from 34 years worth of data?
The 2012-2013 gain is roughly half of the difference between 2013 and the 1979-2000 average. I don’t really want to hope for colder weather, but wouldn’t it be fun if the 2014 gain would be equal to the 2013 gain? Also notable is that the gain is close to the whole 2009-2012 loss.
It doesn’t reinforce it; it’s “not inconsistent with.” That’s how scientists would have phrased it.
Booker chimes in.
http://www.telegraph.co.uk/earth/environment/globalwarming/10324738/The-ice-is-not-melting-yet-still-the-scaremongers-blunder-on.html
“The Met Office seems to have bowed out, and even at the late date, “Neven” was firmly in the gloom category again with 3.6.”
Maybe he thought he ‘voting’ on ice _area_ LOL.
So much for the uban myth : Neven the ice expert. He’s so busy trying to talk down the ice extent so that he can say he’s right about CAGW, he’s totally lost the plot.
*sigh* In previous WUWT polls, I was too optimistic & voted 5.0 M sq. km. This year, anticipating another storm like in 2012, I voted more conservatively, 4.0 M sq.km. I’m doing about as well as an IPCC computer model….maybe I could rent my brain out?
” and reinforces the long-term downward trend in Arctic ice extent. ”
On what planet? This years extent goes against a downward trend.
Whoever wrote and authorized this press release should be fired..
and funding for the agency should be cut till they act responsibly.
@Anthony, I keep asking how good the satellites are doing at measuring ice, and, *crickets*.
So, here’s an odd coincidence; the SST frozen listed by the DMI (http://ocean.dmi.dk/arctic/satellite/plots/satsst.arc.d-00.png) is a much larger area that the ice listed by anyone and looks remarkably like the anamaly line in NSIDC’s sea ice extent (http://nsidc.org/data/seaice_index/images/daily_images/N_bm_extent.png) How does anyone know that the old 1970s era satellites were actually good a differentiating an ice signal from a freezing point signal? In other words, could we already be back at a 1970s type polar ice area if the old satellites gave more credit for ice than the current ones?
Whadams in an interview.
The 2013 extent is 60% higher than 2012. Did it return? You decide.
One thing that happened this year is the Beaufort Sea “clockwise” Gyre restarted after not being very prominent in the last few years.
This moved more multi-year ice to the western Beaufort where it has more chance to survive the melt season rather than getting moved to the Eastern Arctic where it just gets flushed out the Fram Strait by the prevailing ocean currents and melts in warmer water.
Two very good animations which make this quite clear. The second being the early March 2013 “Crackopalyspe” which had the warmers all excited but was merely restarting what is the normal circulation pattern of Arctic sea ice.
http://www.youtube.com/watch?v=9YWX7ChjtxY
RE: Daryl M says:
September 21, 2013 at 12:14 pm
I was watching those two maps as well, and agree they made the ice look very thin, especially at the start of the ice season. I started to scratch my head as summer crawled by and the thin ice just swirled about and never got thinner. WUWT? It is one reason I think the water is colder, especially down at 200-400 feet. Even when we had a couple of midsummer gales right atop the pole, the thin ice didn’t melt away, as it seemingly did during the storm the summer before.
Now we are facing several more months where there will be an above normal area of open water on the Eurasian side of the Pole. All that water is getting a double dose of cooling-to-depth. Therefore I expect air temperatures to again be cooler than normal up there, next summer.
I noticed, like you, that far less ice got flushed out through Fram Strait. Instead the ice has been pushed over to the Beaufort Gyre, which looks to be rebuilding its ice mass, as long as the PDO stays cold and doesn’t inject warm water from the Aleutian side of the Bering Strait.
What we may be seeing is the second half of a sixty year cycle starting to manifest. For the thirty years the ice dwindled, and now for thirty years it may well increase. The cool thing is that, while I am a rank amateur next to the scientists who have deeply studied the dwindling of ice, they don’t know so much about the dynamics of how ice grows, for back when it last happened there were no satellites, people tended to use sled dogs and dirigibles more, and anyway, there was a small matter called World War Two and its aftermath to attend to. In other words, we are seeing something never truly seen before, in the amazing ways we are now able to see.
We are standing at a new frontier. I think that is awesome, and refuse to allow anyone to spoil my pleasure with their numskull politics.
As agent Smart puts it “chief, miss by this much” ( showing an inch or so with his finger). May be that is how the MetOffice should put it even if the miss were millions of sq km.
Last year the North Pacific was very cold, but in the Chukchi sea part of the Arctic ocean – the part nearest the Pacific, there was record ice melt.
This year North Pacific temperatures are quite high, but we get dramatic recovery of Chukchi sea ice in summer.
I’m confused – Bob Tisdale, any comment?
rogerknights says:
September 21, 2013 at 1:28 pm
” and reinforces the long-term downward trend in Arctic ice extent. ”
It doesn’t reinforce it; it’s “not inconsistent with.” That’s how scientists would have phrased it.
You’re being pedantic, but I prefer your wording over that of the NSIDC. People can debate the merits of the words “long-term”, but if you consider the context of the “trend”, you can’t argue that for the duration of the satellite record, the arctic ice extent has been decreasing. Until it turns for enough years to cause the trend line to change direction, the NSIDC will be able to continue making their claim whether anyone likes it or not.
Warmist: “The Arctic sea ice will all be gone in 2013.”
Reality: The sea ice is above minimums of 3 years since 2000.
Warmist: “Well, the TOTAL polar ice is declining”.
Reality: Antarctic ice is near record levels since satellites began tracking.
Warmist: “Well, sea ice is not an indicator anyway!”
Reality: There are some folks that do not seek TRUTH.
From Sierra Club: “This is abrupt climate change in real-time.”
What? Climate is real-time?
Who pays this twit?
I see the Ice Desk (http://pafc.arh.noaa.gov/ice.php) states that Chukchi sea temperatures are up to 4C warmer than usual this year, so they are expecting slow ice formation. However, careful inspection of the Sea Surface Temperature & Anomaly charts (replicated on the Sea Ice page here) shows that the temperature equals the anomaly for all Arctic waters cooler than 6C. Evidently their tack for those waters is that the baseline shall be ice at 0C. That’ll teach those deniers!
Jimbo says on September 21, 2013 at 11:28 am
Just 2 years to go!
That’s always how it goes with those in the prognostication and divination business.
If you perform daily rain dances, eventually it will rain. Presto! You, clever shaman, created the rain!
geran says perceptively at September 21, 2013 at 3:18 pm
There are some folks that do not seek TRUTH.
Correct. Those in public office are called POLITICIANS, those in academia are called LYSENKOIST.
If ANYONE needs confirmation that PIOMAS lies with charts, check out the bogus graph posted by jai mitchell. That is the kind of scary chart that frightens weak-kneed folks like jai mitchell above.
Keep in mind that Arctic ice has increased by 60% since last year — and that Antarctic ice cover is still increasing, continuing its multi-decadal, non-stop rise.
The ONLY way the alarmist contingent can argue is by outright lying, and the PIOMAS graph posed by jai mitchell proves it.
When you have to lie to win your argument… you lose.
I predict Paul Beckwith will rake in record funding this year.
Seriously.
Peter Ward says:
September 21, 2013 at 12:01 pm
To me, the most relevant thing here is that the 2013 line is within the 2sd area. This means “move along, nothing to see here”. We’re back to normal.
>>>>>>>>>>>>>>>>>>
That is the comment I have been posting lately on Alarmist news stories with writers that wouldn’t know statistics if it took a good chunk out of their ….
Anything is possible says:
September 21, 2013 at 1:23 pm
… The current interglacial has lasted 12,000 years
They have 34 years worth of data.
How the [self snip] do you determine long-term trends from 34 years worth of data?
>>>>>>>>>>>>
By ignoring the past which shows there are cycles.
Long term we are cooling down from the Holocene Optimum. Graph
I wasn’t really being pedantic, because the distinction in wording is a distinction with a difference. (A one-year increase in extent doesn’t (and can’t) reinforce a downward trend in extent–especially not such a sharp increase as the one seen this year.)
Marcos @ 12.36
I believe 1979 was the start of the satellite age of measuring the artic ice. What is also interesting is that 1979 also was one of the years with the most ice ever measured. It has been all down hill from then. It would be interesting if they used the chart you mentioned from 1973. There would be much less panic by certain misguided people.
Magic Gais,
Ya’w!
====
jai mitchell says:
September 21, 2013 at 10:51 am
In a single picture
This statement jumped out at me, as obviously it did for others.
In fact, this year reinforces the theory that there is no straight line decline, only that we have passed a low part of the long-term climate cycle that everyone who knows anything about climate is already aware of.
I enjoy seeing people get publicity on these ridiculous and ignorant statements, it will make it easier for them to choose to fade into the woodwork once the fraud is exposed for all to see.
geran “Reality: Antarctic ice is near record levels since satellites began tracking.”
All time record was set September 14th and it may get broken again.
http://sunshinehours.wordpress.com/2013/09/16/antarctica-sea-ice-extent-all-time-record-maximum-on-sept-14-2013/
http://sunshinehours.wordpress.com/2013/09/21/52nd-daily-record-of-year-for-antarctic-sea-ice-extent-on-sept-20th/
dbstealey
you can say it is a lie but the PIOMAS model has been verified by satellite data (cryostat-2)
you can call it a lie because you don’t agree with it, but the real lie is to say that sea ice in the arctic has “recovered” because it is tied with levels seen only 4 years ago (but still 1/5th of the average values seen between 1979 and 2000)
Remember, the average curve that you see today includes dates through 2010 which has the 2007 value added in.
btw, thanks for adding a picture, the one that I tried to link (which is perfectly safe by the way, use your virus checker) has a gompertz trend line that lets it drag out a bit at the trailing end.
correction: *1/2 of the 1979-2000 average*
but remember, the extent is 1/2 the average but the thickness of that ice is also 1/2 of the thickness of 1979-2000
so 1/4 of the total ice compared to the minimums found in the 1980s.
Gail Combs
in your graph it shows, “years before present” at the bottom.
by convention, “present” is 1950 so your graph doesn’t show modern temperatures which are over .7 degrees C higher than your graph shows.
Jai.. You need to understand that people here now just by-pass your posts as meaningless rants,
as they have always been.
You are wasting your time and the blog’s space.
Nobody reads or follows your posts or links.
“Release The Kraken.”
😉
RE: M Courtney says:
September 21, 2013 at 12:39 pm
——————
Let’s not get carried away here.
The long-term trend in Arctic Ice is till, most definitely, down.
Personally, I don’t think that means a thing… but it will not surprise me if the Arctic is ice-free in my lifetime.
———————————
You are noting a short term trend, not a long term. That is since 1979, which is half a cycle. The cycles are 60-70 years for Arctic Ice. as was noted, IPCC had levels before 1979 which were lower, but they have now chosen to cherry pick from 1979.
“Until it turns for enough years to cause the trend line to change direction, the NSIDC will be able to continue making their claim whether anyone likes it or not.”
Well it has changes “direction”, though it has not yet changed sign.
http://judithcurry.com/2013/09/16/inter-decadal-variation-in-northern-hemisphere-sea-ice/
The NSIDC statement is misleading because this years ice is above the straight line long term trend therefore, even though one year can make little difference either way, factually it REDUCES the long term trend and does NOT reinforce it.
Their statement is factually incorrect.
AndyG55,
You are exactly right: jai mitchell must be living on a different planet, because his emotional, fear-based rants have nothing to do with the real world we live in.
For example, his PIOMAS chart shows a ridiculous, exponentially declining Arctic ice cover — when in fact, satellite data shows a 60% increase in Arctic ice in just the past year alone. That is known as ‘natural climate variability’. The climate is never static. If it was, then there would never be declines or rises in polar ice.
But there is no reasoning with True Believers like jai mitchell. His mind is made up, and closed tighter than a drumskin. His belief is based on visceral emotion; never on facts, or data, or logic, or the Scientific Method, or the Null hypothesis, or Occam’s Razor, or anything else quantified and measured in the real world. His Belief is based only on fear. He is a frightened individual. He is simply a scaredy-cat. jai mitchell is afraid of things that don’t exist.
Empirical evidence always trumps computer ‘models’. The empirical [real world] evidence shows conclusively that the catastrophic global warming scare is complete nonsense. But try telling that to deluded AGW cultists like jai mitchell. Their beliefs are emotion-based, and as such, reason cannot cause them to change their minds. They Believe, and that is enough for them. There is no room for thinking when emotion-based Belief is involved.
People used to be burned at the stake for expressing any doubts that the witch doctors stated. I used to think those days were far behind us. But I am beginning to think I may have been wrong. People like jai mitchell would gladly execute unBelievers like scientific skeptics, in order to keep their version of reality unchallenged. My own fear is that scoundrels like mitchell might get into positions of power. There is no telling how insanely, murderously destructive they could be. Fortunately, there is the internet. But there are now people with an agenda, who want to eliminate even this last bastion of free speech…
…how would you like jai mitchell calling the [literal] shots? Scary, eh?
Why did you take an average of top five vote getters for the contest? Why not the average of ALL votes? It would have made for a better forecast…
dbstealey says…
“For example, his PIOMAS chart shows a ridiculous, exponentially declining Arctic ice cover”
That chart does not show ice cover at all.
AndyG55 (to jai) “Nobody reads or follows your posts or links.”
Not only do you read them you reply to them. That makes your statement totally self-contradictory and patently untrue.
I’m sure jai will be reassured that not only do you read his comments you think they are important enough to reply to. LOL
I’ve read papers suggesting a lack of correlation between PDO/AMO warm cycles and Arctic ice loss, however, I find it interesting that when the PDO entered its 30-yr cool cycle in 2008, Arctic Ice Extents on the Pacific side of the Arctic starting setting record highs, and when the AMO entered its 30-yr warm cycle in 1995, that’s when the Arctic started losing ice.
I know that correlation doesn’t equate to causation, but intuitively, it would seem that warm PDOs/AMOs would dump more heat in the Arctic under the 2nd Law of Thermodynamics and less heat during PDO/AMO cool cycles, as we now seem to be seeing on the Pacific side of the Arctic.
I’d greatly appreciate any cryogenic expert to explain why 30-yr PDO/AMO cool cycles don’t necessarily lead to more Arctic Ice.
BTW, my guess for the Arctic Ice Minumum was 4.9 million KM^2. Not too shabby..
Cheers!
Richard Vada says:
September 21, 2013 at 5:59 pm
Magic Gais,
Ya’w!
====
jai mitchell says:
September 21, 2013 at 10:51 am
In a single picture
__________________________
Richard, your accent- isn’t that Texas hill country, while Jai- well, don’t you wonder if he’ll ever catch on?
Gerald Machnee: “You are noting a short term trend, not a long term. That is since 1979, which is half a cycle. The cycles are 60-70 years for Arctic Ice. as was noted, IPCC had levels before 1979 which were lower, but they have now chosen to cherry pick from 1979.
”
Yes this is yet another manifestation of fitting linear models to snippets of data from a system that anything but linear, and pretending it is representative of longer term behaviour. This fallacy has sadly become standard practice in the anti-science of climatology.
It is pretty obvious that detailed observations started almost exactly at the recent maximum of arctic ice cover, we are now approaching the minimum:
http://climategrog.wordpress.com/?attachment_id=521
Bill,Caleb , re. Beaufort gyre.
Someone using the moniker AK made a similar comment on my Curry article. Maybe more attention should be given to the regional displacement of the ice mass. I identified what looks like a rectified circa 11y cycle in ice area data:
http://climategrog.files.wordpress.com/2013/09/art_nh_ice_area_short_anom_2007_wkg.png
Perhaps this is related to regular variations in the flow of water in and out of the Arctic Ocean principally via the Fram Straight.
Although there was a skip between 1997-2007, that pattern reappears with the same frequency and phase by 2007. The regularity and form would seem to suggest a celestial origin rather than internal oscillation.
Is this evidence of a long term tidal phenomenon?
No Greg, I read his name. and skipped the rest.
The density difference at the thermocline is about three orders smaller than that of the air/water interface. That would lead us to expect tidal “waves” (not tsunami sense) on a scale of years to be present in the thermocline.
Despite the fact that we tend to observe the vertical displacement, tides are longitudinal waves involving huge horizontal movement of water mass…. and with it heat energy.
LOL, Andy and Greg — Jai is FUN!
Here’s to you, Magic Jai …
(someday, get off the bus and join us in mind as well as body!)
Magic Jai’s Bus
I’m amazed that the UK Met Office forecast was a miss even though they gave an estimate with +/- 1.5 million sq. km. So even with a 3.0 million sq. km range they didn’t get it right. Of course they were too low.
It’s not as bad as they thought.
What should the Arctic Ice look like today? Higher, lower, or the same as the 1960’s-1970’s cold period.
We’re now just over 30 years out of that era. You might want to get a coat and prepare for the inevitable ride back down the sine wave..
Dear D. B.,
I see your point about Envirostalinists (at 8:21pm). (shudder) Nevertheless, take heart, O Valiant Mo-d-e-r-ator. There is still electability… . Hm. There is such a thing as stealing votes (in JM’s home town, Seattle, esp. bad), too… . Well, anyway, cheer up! With the bowing wooden-headed puppet who’s been to all 57 states (not counting Alaska and Hawaii and 2 or 3 more)
teleprompter-reading community organizer in the White House…………. WE HAVE NOWHERE TO GO, BUT UP! #(:))
Thanks again for making WUWT a great place (and a much more pleasant place!) to learn,
Janice
Samaurai: “I’ve read papers suggesting a lack of correlation between PDO/AMO warm cycles and Arctic ice loss..”
Since it is REAL actual temperatures that melt ice I’m not too surprised that these ‘detrended’ and mixed up indices do not correlate with ice coverage.
http://climategrog.wordpress.com/?attachment_id=521
I looked at the additive effect of SST and extra-tropical N. Atlantic fitted very closely to ice area. N.Pacific and the region between Norway and Greenland fitted notably less well, with recent similarity but also significant divergence.
Since the major opening of the of the Arctic Ocean is to the Atlantic, this would suggest oceanic link is more important than atmospheric, Also the deviations form SST in the immediate vicinity may indicate deeper water (which is warmer in the Arctic) maybe more of a factor that SST.
See above comments on tidal variations in the thermocline.
I had the right idea with my first thought. I had said that 2013 would follow the 2009 trajectory. Then I had the bright thought that the record cool summer up there might leave more ice, so I voted for 5.3 mil/sq km. So much for bright thoughts on that one, but I did learn a bit watching how it changed.
Hey, Goldminor — how are you doing? I hope all is well. I learned much by reading about the Arctic (current and past) on the threads here on WUWT, also.
And I just learned what an excellent memory you have — WOW! I voted, but, have only the vaguest memory of the exact number. Congratulations on a wonderful gift.
Old newspaper reports often provide an insight or a good laugh when it comes to Arctic temperatures and ice extent.
e.g. a few Australian press reports …
http://trove.nla.gov.au/ndp/del/article/74081229 – Adelaide Advertiser April 1923:
Is the North Pole going to melt entirely? Are the Arctic regions warming up, with prospect of a great climatic change in that part of the world?
Science (says ‘Popular Science’) is asking these questions. Reports from fishermen, seal hunters, and explorers who sail the seas around Spitzbergen and the eastern Arctic all point to a radical change in climatic conditions, with hitherto unheard-of high temperatures on that part of the earth’s surface. Observations to that effect have covered the last five years during which the warmth has been steadily increasing. etc ….
http://trove.nla.gov.au/ndp/del/article/69638689 – Wodonga and Towong Sentinel September 1939:
Scientists have confirmed the fact that the Arctic regions around Spitzbergen are warming up at the rate of approximately one degree in every two years. Since 1910, when observations first started in those regions, the cumulative rise of winter temperature has amounted to nearly 16 degrees. etc …
http://trove.nla.gov.au/ndp/del/article/126972551 – Canberra Times January 1993:
Temperatures over the Arctic Ocean over the past 40 years have not shown the increase predicted by computer simulations that forecast global warming, according to a study.
The lack of an overall warming trend appeared in analysis of more than 27,000 recordings of temperature at the surface and various altitudes, made between 1950 and 1990. etc …
http://trove.nla.gov.au/ndp/del/article/127231000 – Canberra Times June 1993:
A layer of haze which appeared and thickened over the Arctic during the late 1970s and early 1960s appears to be thinning due to decreased industrial pollution. According to a report published in Geophysical Research Letters, scientists earlier had feared that the deepening layer of haze would store solar heat and lead to a rise in Arctic temperatures, worsening global warming. Virtually all the haze came from industrial smokestacks in Europe and the former Soviet Union.
The problem appears to have improved both because the former Soviet Union switched from coal and oil to cleaner-burning natural gas during the 1980s, and because western European nations clamped down on sulfur dioxide emissions to reduce acid rain.
Claude Harvey says:
September 21, 2013 at 12:33 pm
Whatever happened to that “green” fleet of sailboats caught in the North-West Passage this summer and reportedly awaiting rescue? I suggest naming that shivering band of adventurers, “The Wadhams Expedition”.
———————————–
Many of them made it through due to a break in conditions for exiting to the west. There some some who made it recently through on the east side, but that was probably with the help of an icebreaker.
Janice Moore says:
September 21, 2013 at 11:21 pm
——————————————
I still have some memories back to 1953 at 3 years of age.
So now that this is over in the Arctic for the moment, what is the latest date for the Antarctic peak sea ice? Can it grow into October?
Is this a downslope of a cycle or a real decline?
I don’t know. But the measurements we have only show the decline. They may not be long measurement’s but they are all we have.
Again, this doesn’t mean a thing – global sea ice would be the relevant statistic for global warming – but that is why the sea ice decline should be addressed as real instead of having to backtrack if the decline does continue.
Remember, there is a growth of urban settlements on rivers throughout Canada and Siberia. This change in the Arctic may well be manmade and permanent.
the great difference in ice extent between 2012 and 2013 suggests to me that the weather (temperature and storms) has a huge impact.
Hope somebody is doing a proper study of the two years along these lines.
tonyb
It’d be cool if someone could track all these failed predictions (including future predictions). Maybe have a link to it in Climate Failed Files or somewhere accessible.
Anthony, you are a hero. You clearly work very hard at this wonderful website of yours. You manage to triage an enormous volume of news and data for us, your grateful public. Having filtered it you then create articles with clarity, integrity and wit. I do hope that your wonderful work is rewarding. Future historians will celebrate you as a bastion of Reason at a time when Pseudoreligion was enjoying great success.
According to the following graph from the Sea ice Page –
http://www7320.nrlssc.navy.mil/hycomARC/navo/arcticictnowcast.gif
– we are expected to believe that around the North Pole Sea Ice, which was still over 2 meters – 7 feet – thick only two weeks ago, has melted down from one meter to almost nil by now.
How’s that?
Regarding the vast area concerned – at least 40,000 square kilometers – the alledged loss of ice roughly amounts to 20 to 30 cubic-KILOMETERS of ice being lost over mere 14 days – while the temps up there are well below freezing again, already.
I rather suspect that the satellites are measuring not loss of sea ice there, but melting ponts on top of still-existing sea ice.
Hey Jai, noticed your Piomas death spiral chart doesn’t include 2013. Might want to add it.
PIOMAS September 2013
Personally I think it’s too soon to declare a recovery. One year doesn’t make a trend. By 2016 we should have enough data to know if Ice volume is still declining or if it is stabilizing at this new area. The fact that Arctic sea ice MAXIMUM has been fairly stable for years would seem to indicate the latter.
What I have been wondering about is why it seems like Arctic sea ice area has become so much more Variable since about 2007.
NH Sea Ice Area Anomaly
Before 2007 it looks like yearly variability averaged about 1M sq km. Since 2007 it looks like about 2M sq km.
Alright, so we can’t model arctic sea ice a few months in advance worth a damn; but trust us, we can model the entire world’s climate decades out.
M Courtney says:
Is this a downslope of a cycle or a real decline?
I don’t know. But the measurements we have only show the decline. They may not be long measurement’s but they are all we have.
===
Indeed, it’s all we have but it is very high time resolution so we ought to be doing something a bit more relevant that drawing a bloody straight line through it all.
We are told that “global warming” is melting the ice. surface temps have been in ‘hiatus’ since circa y2k, so this should be reflected in the ice data, though it may take more than one year to play out. And guess what …
http://climategrog.wordpress.com/?attachment_id=521
I’m working on a more rigorous derivation but indications so far are a time const of 9y seems likely. There’s more to it than that and I’ll comment in more detail later, but it’s a first shot at getting beyond fitting physically meaningless linear regressions to every dataset and extrapolating 100 years beyond 30 years worth of actual data.
Yes , medium scale rate of change is negative and remains negative. But is has not been _constant_ for the last 34 years. It sped up , now it’s slowing down. One explanation would be a significant cyclic component. There are others. One thing the certainly does not fit the observational data is the idea of continued acceleration that would be the result of ‘tipping points’ , run-away warming or catastrophic collapse of arctic ice cover.
Once a dominant positive feedback is set in motion, it does not back off.
Roger A. Pielke Sr. says: September 21, 2013 at 12:43 pm
It is worth noting that the date of the end of the seasons melt, and beginning of the cold season expansion continues to change very little if at all. The reason this is important is that the added CO2 and other greenhouse gases does not yet (if it ever does) alter the dominance of the seasonal solar cooling with respect to when the sea ice recommences to freeze.
__________________________
Translation:
It’s the Sun, stupid…..
😉
jai mitchell says: @ September 21, 2013 at 7:27 pm
Gail Combs
in your graph it shows, “years before present” at the bottom.
by convention, “present” is 1950 so your graph doesn’t show modern temperatures which are over .7 degrees C higher than your graph shows.
>>>>>>>>>>>>>
No they are not!
Quantifying The Size Of The USHCN Adjustment Fraud This shows 0.6 degrees C in recent “Adjustments” to the Temperature Data. And this shows the same for GISS GRAPH
This set ofGRAPHS showing the continuing data manipulations by GISS to get rid of the 1930’s high temperature record.
Köppen climate classification (using plants) The map also showing that 1900 to 1949 was higher compared to the 1975 to 1990 and that 1900 decade and the 1930 decade was as high or higher as the 1990 decade.
The CAGW crowd can only ‘WIN’ by the use of cheating and propaganda. When asked for the adjustments so they can be validated we get The Dog Ate My Homework and (Alternate link) and The Goat Ate My Data excuses. So by part of the scientific method, validate and verify, adjustments are invalid because they are not vetted by outsiders.
None of this is problem of course , because they still have the the old stand by , ‘will happen’ so if its not happened now it will some time in the future . Which of course is most useful because as it offers no time frame it cannot be disproved. Of course it also scientifically worthless but this is not an issue of science in the first place but of religions like certainty in ‘the punishment of evil doers’ .
Meanwhile, the Greenpeace boat is being towed to Murmansk, where a bus is waiting to take the crew to a very pleasant gulag. A court case has already been scheduled for 2019, and the Russians have agreed to make the judicial process as swift as possible.
http://www.theglobeandmail.com/news/national/russian-coast-guard-towing-greenpeace-ship-with-two-canadians/article14431977/
/sarc
Greg Goodman says: @ September 21, 2013 at 9:06 pm
….this is yet another manifestation of fitting linear models to snippets of data from a system that anything but linear, and pretending it is representative of longer term behaviour. This fallacy has sadly become standard practice in the anti-science of climatology.
>>>>>>>>>>>>>>>>
BINGO!
As Doctor R.G. Brown has been at pains to point out we are looking at a chaotic system with ‘Strange Attractors’
More on Strange Attractors
http://www.stsci.edu/~lbradley/seminar/attractors.html
If you look at the NH Summer Energy: The Leading Indicator Graph from engineer, John Kehr (link to article) you see the Holocene is continuing at a relatively high temperature. That is clinging to one of the Strange Attractors despite a major but gradual fall in solar insolation.
As far as I can tell from the geologic evidence we have been darn lucky the temperature has been as mild as it has been for centuries since ‘Abrupt Climate Change’ is part of the geologic history of the earth and persistence at a higher temperature for long geologic periods rather rare during this current Ice Age. Vostok Graph Presently the earth is in a temporary warm period called an interglacial during a continuing Ice Age. (See WIKI – Greenhouse and Icehouse Earth)
The “tendencies of abrupt onset and great persistence” sure sounds like the Dr. Brown’s Strange Attractors in action doesn’t it?
M Courtney says: @ September 22, 2013 at 1:01 am
….Remember, there is a growth of urban settlements on rivers throughout Canada and Siberia. This change in the Arctic may well be manmade and permanent.
>>>>>>>>>>>>>>>>>
Nothing is really permanent. Climate changes and people move. Think Anasazi and the Alexander Tytler Cycle.
Perhaps you would like to send a weblink of this article, highlighting the performance of the UK Met Office, to Will Hutton, heavyweight socialist journalist at the Guardian Newsaper (Will.hutton@guardian.co.uk), since he has written an article stating ‘we must trust scientific truth’ today (well, what he actually tries to mean is that we must trust that the IPCC is telling the truth, since he is doom-mongering as usual).
Perhaps you could cc it to the Editor Alan.rusbridger@guardian.co.uk as well? Not to mention the Prime Minister (camerond@parliament.uk), the Leader of Her Majesty’s Opposition (milibande@parliament.uk) and the Deputy Prime Minister and leader of the Liberal Democrats (cleggn@parliament.uk)?
In fact, it might be good to organise a blitz of these global warming coconspirators, fellow travellers or head-in-the-sand ostriches every time the scientists’ predictions are so far from measured reality??
Whatever it takes, 2000 emails over 10 years, if that’s what it takes.
After all, if the scientists end up being right, then WUWT will no doubt be acknowledging that, won’t they?
“This change in the Arctic may well be manmade and permanent” –
One wonders if that is a theory or just a guess. I do believe that it has already been soundly demonstrated that the weather just does whatever it damn well pleases. We are but an insignificance in comparison. There has yet to be demonstrated beyond doubt that we can have any effect at all apart from just taking up space.
You talk of lies jai mitchell. I have some simple questions:
Did the Arctic recover after the 1920s to 1940s Arctic Warm Period?
Was Man to blame?
If man was to blame then how come it recovered?
Sometimes the key to the future can be found in the past. Arctic feedback look went missing back then. What a con job.
Silver Ralph says: @ September 22, 2013 at 3:26 am
Meanwhile, the Greenpeace boat is being towed to Murmansk, where a bus is waiting to take the crew to a very pleasant gulag. A court case has already been scheduled for 2019…
>>>>>>>>>>>>>>>>>>>
Continually kicking the Russian Bear in the rear and not expecting a reaction just goes to show how really stupid Greenpeace is. Especially when the Russians are in saber rattling mode due to Syria. I doubt other countries really want to get involved in trying to save a bunch of idiots who are trying for a Darwin Award but we will see.
Once they climbed onto that Russian oil rig they were OUT of international waters and onto Russian property. That the Russians previously escorted Greenpeace out of the area peacefully, AND that Greenpeace had applied three times for permission to enter the area and were refused, kinda kills the ‘International Waters’ defense since they already acknowledged that they were entering Russian controlled waters.
Greenpeace has been getting a ‘Free Pass’ for their
terrorist activitiessabotage for years. I think reality just bit them. Its about time.I am sure these members of Greenpeace will enjoy that nice warm Russian winter that will shortly be upon them. Perhaps they will join Mikhail Khodorkovsky who was sent to Murmansk Oblast “…Mikhail Khodorkovsky and his companion Platon Lebedev, convicted of fraud and tax evasion in a first trial in 2005, were found guilty of theft and money laundering over Yukos’ operations in a second trial on 30 December 2010….”
There is also this tidbit from the article.
Some how I do not see any dignitaries bothering to actually travel to the Arctic to argue the case if those members of Greenpeace are incarcerated in the nearest jail.
Correction:
….Sometimes the key to the future can be found in the past. Arctic feedback loop went missing back then. What a con job…..
rtj1211, has anyone started a blog about how woeful and inept the Met Office is? They should be hammered for their performance over the past 10 years or more. I think I heard last week that they just got a pay rise!
Has the good Professor Wieslaw Maslowski been contacted for comment? Or any of the others?
If you extrapolate that rate of recovery, we’ll be in a full glacial in a decade or two.
So yesterday, Sept. 21, the sun went below the horizon in the Arctic, and ice will build up from here on. NIC reports the annual minimum of 5.511 M was reached on Sept. 14, though Sept. 20 was close at 5.514 M. Packed ice is at 4.9 M.
Since 2006 only 2009 and 2010 exceeded this year at the equinox, the most typical date for the minimum.
M Courtney says:
September 21, 2013 at 12:39 pm
Let’s not get carried away here.
The long-term trend in Arctic Ice is till, most definitely, down.
==============
…and the long term trend in global temps is also down
as Gail had pointed out to you
Well, fall is here…and when i shovel snow out of my driveway this winter ,will that mean less snow cover for my driveway and just anomalys for the grass areas just to the sides,with the general trend being down…?
“This change in the ______ may well be manmade and permanent” –
Thanks for the interesting articles and comments.
A lot has been made of the PIOMAS chart of average ice thickness being half what it was. Keep in mind that averages often aren’t useful metrics. In this case the average is heavily reduced because of the significant increase in ice extent — thin first year ice.
Nevan’s blog sure spends a lot of time talking about….us. I didn’t know his blog existed till Anthony mentioned it in the post above. So I wandered over there to take a look. Seems a lot of posts deal with closeups of this and that (the hole, etc), with an occasional view of regional weather pattern variations related to semi-permanent atmospheric pressure systems, some of which are well done.
It seems to me that worry is a key atmosphere in many AGWing blogs, while here we attempt to understand Earth’s intrinsic weather pattern variation random walk first and foremost before getting our knickers in a twist over the Sun, impending ice ages, etc. (though some here do engage in that sort of worry).
I am reminded of the fact that global circulation models set to pre-industrial conditions don’t work worth beans. So maybe the climate science community oughta spend more time on that before worrying over projected anthropogenic CO2 warming scenarios hooked up to GCM that don’t work? Can you imagine where we would be if Henry Ford tried to get his assembly line to work assbackwards?
Why is anyone surprised that the ice pattern is following the ~60 year cycle? Scientific amnesia?Lowest average for the cycle would have been in the 1970s if the NSIDC had been taking measurements then. The 30 years of warming are over.
Jimbo
I have some simple questions:
Did the Arctic recover after the 1920s to 1940s Arctic Warm Period?
you mean this arctic recovery?
note: red dots are “boots on the ice” physical observations of the arctic ice pack.
If you look at august ice values since 2000 you will see that ice levels have been much lower than the peak of your supposed arctic warming event.
I think it is very interesting that you would contest the statement regarding lies with an obvious exaggeration. I was talking about somebody I heard recently stating that the Sea Ice is at levels not seen since 1980 (because it went into the 2-sigma range of the 1980-2010 average–obviously doesn’t know how to read a graph) and another time when someone said that this year’s 60% increase (from zero) compared to last year is a “recovery” even though it is about half of the actual average that was found in the 1980’s.
a “recovery” to 1/2 of the average that we have had up there for the last two thousand years isn’t a real recovery.
Gail Combs
You said,
No they are not!
Quantifying The Size Of The USHCN Adjustment Fraud This shows 0.6 degrees C
we are talking apples and oranges here.
What I was saying is that the time series you posted in your graph that supposedly shows us “cooling” from the Holocene optimum only goes to 0 years “before present”
in paleoclimate studies the convention of “before present” is from the carbon-14 dating science:
http://www.elsevier.com/journals/quaternary-research/0033-5894/guide-for-authors
Guide for Authors
Calibrated (‘calendar’) radiocarbon dates are preferred to uncalibrated (‘raw’) dates. Raw 14C dates should be expressed as 14C yr BP (or 14C ka BP). “BP” (“before present”) should only be used in reporting 14C dates, for which “present” refers to AD 1950.
your argument that the temperatures have been adjusted doesn’t fly when you compare the surface temperatures to the satellite temperatures.
http://www.woodfortrees.org/plot/hadcrut4gl/last:500/mean:13/plot/hadcrut4gl/last:500/trend/plot/uah/last:500/mean:13/plot/uah/last:500/trend
Both show a large temperature increase, since they track closely, it is confirmed that their temperatures are “close enough” and certainly more accurate than saying that a graph that ends in 1950 (before present) is actually going into 2000 (cutting off 50 years of warming)
I mean, you DO concede that the planet has warmed over the last 50 years, right?
I mean, Dr. Roy Spencer certainly believes it, his own graph from his senate testimony shows a warming of .8C since 2050.
http://www.drroyspencer.com/wp-content/uploads/2000-yr-temperature-variations.png
Another ‘barbecue summer’ for the UKMO?
They are so bad you can almost guarantee that whatever they say will happen, won’t.
I can’t wait for November 30 to see how their ‘above average’ Atlantic hurricane season forecast turns out – only 7 more hurricanes to go!
http://en.wikipedia.org/wiki/2013_Atlantic_hurricane_season#Pre-season_forecasts
When will they notice that the tree they’re barking up isn’t the right one?
You have to wonder about Professor Peter Wadhams. Big Oil shill for 16 years:
He received continuous support from British Petroleum Co. from 1976 until 1992 …
http://www.damtp.cam.ac.uk/user/pw11/
He has spent a lifetime researching the Arctic and the Antarctic from above, below and on the surface. How can he be so spectacularly wrong about the changes we are seeing?
Perhaps the alarmism is simply theatre to achieve high levels of funding from sympathetic politicians and organisations – he certainly seems to have a thriving relationship with Greenpeace.
Who doesn’t believe the Arctic sea ice is melting all away? Just look at this image from a Yahoo! Canada slideshow “The Arctic Ocean’s shrinking ice”, and see how a walrus bravely defies gravity on a thin ice platform whittled down from an iceberg:
http://ca.news.yahoo.com/photos/the-arctic-ocean-slideshow/the-arctic-ocean-photo-1379704539196.html
That caught my eye as a photoshopping candidate, as otherwise it’d likely have to be a concealed structural steel construct to hold that weight. Physics alone says that whole piece would need to be resting on the bottom or connected underwater to a much larger chunk of ice, it should clearly be tipping over.
The photo credit to Greenpeace did not allay my suspicions.
Well, the picture is not showing the current ice, nor any recent ice. The caption honestly says it’s at least 14 years old: “…released by the environmental organization Wednesday 5th August 1999”. Was it altered?
Google Images got me closer to the original. It was used in a December 5, 2003 Greenpeace piece, What is the cryosphere, and why should we care? Iceworld melting into Waterworld?
They’re hyping some alarming CAGW book:
I haven’t heard of the authors before, not surprising, their conclusions are far from catastrophasizing enough for modern propaganda purposes:
You can click on the little pic. I found a direct link to the archive copy. Embedded info reveals it’s the Chukchi Sea, taken on July 13 in 1999, and the Greenpeace ship in the background is the “Arctic Sunrise”.
http://www.greenpeace.org/international/en/multimedia/photos/walrus-on-ice-floe-greenpeace/
Notice the manipulations of the version used by Yahoo! and many other sites. First one, it was cropped. They whacked off the right side which shows much more ice, and also the obvious Greenpeace watermark.
The other is more subtle. They made it blue. In the original, the ice looks dirty. The lighting is closer to sunrise/sunset, more reddish. But the word is spreading, Arctic sea ice is melting due to black carbon (soot) emissions. Dirty ice melts faster with or without CAGW.
Some magical photo tweaks later as the reddish-brown tones are muted, the ice is virtually pristine, of a bluish natural perfection well known from freshly-calved glaciers and swimming pools.
The bluing apparently comes from Greenpeace, as an uncropped blued version credited to them without the obvious Greenpeace watermark was used in a September 29, 2005 Sydney Morning Herald piece, Arctic melting: greenhouse effect blamed. The Yahoo! slideshow also said their blued version was released by Greenpeace in 1999. Then why did Greenpeace place the un-blued version in their own archive and use it in 2003? So far Greenpeace has established plausible deniability.
Fourteen year old photo showing a normal Arctic scene, catastrophasized to a poignant reminder of the imminent Arctic Apocalypse. With incontrovertible evidence like this, how can you not accept the inevitable absolute demise of the summer sea ice?
From Billy Liar on September 22, 2013 at 11:28 am:
The Met Office is hard at work establishing a scientifically proven negative correlation between their climate models and reality. Once completed, all they have to do is establish the parameters for inverting the outputs and their projections will be absolute perfection.
From jai mitchell on September 22, 2013 at 11:05 am:
Rookie mistake, all data sources do not report at the same time, “last 500” can lead to a mismatch. Call out “From” times, and “To” times as well to lock-in results like trends.
Sure enough, the Raw Data shows UAH is up to 2013.67, HADCRUT4 only to 2013.58. A call-out like this is better:
http://www.woodfortrees.org/plot/hadcrut4gl/from:1979/to:2013/plot/hadcrut4gl/from:1979/to:2013/trend/plot/uah/from:1979/to:2013/plot/uah/from:1979/to:2013/trend
You should also note WFT is still using UAH v5.5, UAH moved on to v5.6.
It’s also good to do a comparison like this, splitting the examined section. I used 2000 since, well, it is the millennium.
http://www.woodfortrees.org/plot/hadcrut4gl/from:1979/to:2000/plot/hadcrut4gl/from:1979/to:2000/trend/plot/uah/from:1979/to:2000/plot/uah/from:1979/to:2000/trend/plot/hadcrut4gl/from:2000/to:2013/plot/hadcrut4gl/from:2000/to:2013/trend/plot/uah/from:2000/to:2013/plot/uah/from:2000/to:2013/trend
Looks like HADCRUT4 warmed faster in the past, but to even out with UAH they slowed down recently.
Of course HADCRUT4 is a new shiny thing, for a more properly historical match you should use the older HADCRUT3.
http://www.woodfortrees.org/plot/hadcrut3vgl/from:1979/to:2000/plot/hadcrut3vgl/from:1979/to:2000/trend/plot/uah/from:1979/to:2000/plot/uah/from:1979/to:2000/trend/plot/hadcrut3vgl/from:2000/to:2013/plot/hadcrut3vgl/from:2000/to:2013/trend/plot/uah/from:2000/to:2013/plot/uah/from:2000/to:2013/trend
Ye-ouch! No wonder they changed versions, HADCRUT3 was showing so much more warming the most-recent rate had to slow to virtually nothing to match up!
Data manipulation is so much easier when you can just declare a new version and cover up the previous misdeeds.
NSIDC’s September ice extent average is coming in at 5.24M km^2. So, it will be higher than the WUWT poll for the Arcus Sea Ice Outlook prediction game and higher than all but 1 other guess.
The ice extent has very closely followed the historic climatology since mid-July. This is quite a bit different than the last few years which showed much more melt late in the season compared to the average.
http://s21.postimg.org/kwvgcknd3/NSIDC_Sept_Min_Proj_Sept21_2013.png
Kadaka,
I agree with you that Greenpeace have been photoshopping the walrus pic.
I’ll try to find the original for comparison. One attempt led me to an alarmist poem here: http://allpoetry.com/poem/1733988-Sleeping-Giant-by-Mark_Rickerby
Apparently you and I – and the poet (correction not poet but “”poet””) – are a cancer:
She will surely survive us
And begin to heal
After the cancer is destroyed. How very rude!
kadaka (KD Knoebel) says:
September 22, 2013 at 12:00 pm
That’s definitely grounded ice with a little wave-cut platform. I would guess that there isn’t much tidal range there either.
The largest known tidal range at Point Barrow is 0.17m 0.6 feet.
http://www.tide-forecast.com/locations/Point-Barrow-Alaska/tides/latest
… and another thing; that walrus didn’t jump up there, the lazy beast has been there for hours – since the last high tide.
I think Al Gore also asserted ice free artic in 2013 back in 2008. “5 years!” was his catchphrase.
At this seasonal turning point, since 2013’s Arctic sea-ice minimum is above those of previous years, winter 2014’s maximum should also be commensurately higher. Any bets on that one?
jai mitchell says:
September 22, 2013 at 10:40 am
a “recovery” to 1/2 of the average that we have had up there for the last two thousand years isn’t a real recovery.
=============================================================
You are quite well known for posting tendentious rubbish, but this one takes the biscuit. Are you seriously trying to con us into believing that you have the data which demonstrates clearly the amount of ice in the Arctic since the year 13 CE (or AD depending on your world view)? You’ll need that in order to back up your statement, otherwise we might think that you’re spouting complete [self snip – but it starts with ‘bo’ ends in ‘ocks’ and has the letter ‘l’ repeated in the middle of it].
Or is it maybe, in light of your comment above the above extract [even though it is about half of the actual average that was found in the 1980′s], that you believe that the 1980’s (sic) lasted for 2000 years?
As Private Eye might put it, “I think we should be told.”
jai mitchell says:
September 22, 2013 at 11:05 am
Gail Combs
You said,
No they are not!
Quantifying The Size Of The USHCN Adjustment Fraud This shows 0.6 degrees C
we are talking apples and oranges here…..
>>>>>>>>>>>>>>>>>>>>>>
Nice try at changing the subject.
You know darn well I was addressing your claim at September 21, 2013 at 7:27 pm that I highlighted:
As the Köppen Map as well as the raw data shows the last half of the 20th century is no different than the first half.
The ‘dramatic’ increase in temperatures is caused by man alright. A Mann with a very heavy thumb on the scale. The fact that the Climate Catastrophe Crowd has to ‘Adjust’ historic and current data AND all adjustments ADD to current ‘High’ temperatures is enough to make any true scientist into a skeptic.
When it became rather obvious they were making those type of ‘Adjustments’ because the surface temperature measurements were diverging more and more from the satellite measurements they had to stop making their ‘Adjustments’ and so we now have “The Pause’
There is plenty of information on the data manipulation shennanigans at WUWT, Diggingintheclay and Chiefio. (See sidebar)
Oh no, man fails again to get it right…..my 12 year old even see’s through this fraud.
Gail Combs, Greg Goodman and Latitude.
Latitude: Agreed, the global temperatures are going down. I don’t see what that necessarily has to do with Arctic ice. And Arctic Ice is in decline.
Greg Goodman: Agreed, the Arctic Ice is not dropping linearly. I don’t see why it would be expected to fall in a straight line. But Arctic Ice is in decline.
Gail Combs: Perhaps or perhaps not. There have been changes in the Arctic regions related to occupation that have not been seen before. There needs evidence to rule them out as potential causes for the decline in Arctic Ice. I do not assert that these changes are the cause in the decline in Arctic Ice but they may be as Arctic Ice is in decline.
Newcomers reading this thread may think me an alarmist. But actually I am sceptical of the impact of CO2 on global temperatures. That does not mean that I think the Arctic Ice is eternal.
Arctic Ice is in decline.
So why hold the end of the decline in Arctic Ice as the proof of the weakness in AGW theory?
It isn’t proof related to AGW and it wouldn’t be a strong suit for sceptics if it were.
On that chart you linked to I also see “The chart from August 1932”. Thank you for the one month sample from one year. I also read: “both direct observations (marked in red) and the presumed but not observed ice edge (the white edge).”
jai mitchel,
from the link you gave me I had a look around at their ftp page and found this map showing a significant reduction in sea ice extent also from August in the year 1938. So, where did the Arctic feedback loop go after 1938? It’s a simple question.
Anybody else notice the ice breaker in the north pole web cam #2 ?
http://psc.apl.washington.edu/northpole/NPEO2013/18.jpg
The lens is too ice covered to tell the Flag of the ship, but it’s definitely an Ice Breaker.
I wonder if there is a correlation between the onset of new snow cover in Arctic land areas and the annual onset of sea ice growth? Change of subject … the pole cam is still providing images (after again thawing / having ice sublimate). Ship’s ahoy! An icebreaker entered the field of view today. Not sure whose it is.
RE: Tom Olsen says:
September 23, 2013 at 12:19 pm
THE SHIP’S SILHOUETTE RESEMBLES THAT OF THE NORWEGAN ICEBREAKER “H V SVALBARD” http://forsvaret.no/om-forsvaret/utstyrsfakta/sjo/Sider/Kystvaktens-fartoy-KV-Svalbard.aspx (The blogger “Billy Liar” pointed this out.)
That picture was the last. It was taken 0535z Saturday morning and there have been no pictures since. Usually it takes a picture every six hours.
I was hoping they were up there to fix the camera that got knocked over by the polar bear, but I now guess they picked up the cameras to use again next year. Those camera’s must cost a pretty penny, if it is worth hiring an ice breaker. Also the cameras the O-Buoy project uses across the pole are much better, and include time-laps films you can watch. You’d think they’d want their old camera sunk, and have to get a new one. I speculate money is running short, and they have to use the battered, old camera over again. (If they want to nip speculation in the bud, they ought to issue a statement on their site.)
Here’s the last picture: http://sunriseswansong.files.wordpress.com/2013/09/np-sep-21-c-18.jpg
Yep, looks like the pole cam is done for this year.
RE:James at 48 says:
September 24, 2013 at 3:13 pm
At least they left the barometer, thermometer and GPS in place, and that is giving us some interesting information about the Camera-site. It is about to cross 84 degrees north latitude for the eleventh time, since last April.
It took decades of hard work to identify the Transpolar Drift, and all that work, I think, is now being falsified. The Transpolar Drift only occurs for around half of a cycle which may or may not be sixty years long. Then, just as certain equatorial currents revert to counter-currents, the Transpolar Drift could change to a drift which I humbly suggest ought be named the “Caleb Counter Current.” (After all, all three words begin with the letter “C,” and the phrase does have a nice ring to it.)
I show the backward-motion of nearby buoys on drift-maps, at the bottom of my post at:
http://sunriseswansong.wordpress.com/2013/09/19/arctic-sea-ice-minimum-the-darkness-decends/ Or check out the “Navy drift map” on Anthony’s Sea Ice Page. It shows the Caleb Counter Current quite clearly, today (Tuesday, September 24.)
The Arctic is looking very chilly. Much of the Russian side of the coast has temps ranging from 23F to 5F, with large land areas inland also below 23F. The sea ice extent is growing at a good pace. In the last 4 days growth, the ice grew by 0.125 million sq km.