
Here’s an interesting Q&A on issues with trying to determine the SAT of the Earth that I have not seen before. There’s a surprise at the end as to who wrote it.
Q. What exactly do we mean by SAT ?
A. I doubt that there is a general agreement how to answer this question. Even at the same location, the temperature near the ground may be very different from the temperature 5 ft above the ground and different again from 10 ft or 50 ft above the ground. Particularly in the presence of vegetation (say in a rain forest), the temperature above the vegetation may be very different from the temperature below the top of the vegetation. A reasonable suggestion might be to use the average temperature of the first 50 ft of air either above ground or above the top of the vegetation. To measure SAT we have to agree on what it is and, as far as I know, no such standard has been suggested or generally adopted. Even if the 50 ft standard were adopted, I cannot imagine that a weather station would build a 50 ft stack of thermometers to be able to find the true SAT at its location.
Q. What do we mean by daily mean SAT ?
A. Again, there is no universally accepted correct answer. Should we note the temperature every 6 hours and report the mean, should we do it every 2 hours, hourly, have a machine record it every second, or simply take the average of the highest and lowest temperature of the day ? On some days the various methods may lead to drastically different results.
Q. What SAT do the local media report ?
A. The media report the reading of 1 particular thermometer of a nearby weather station. This temperature may be very different from the true SAT even at that location and has certainly nothing to do with the true regional SAT. To measure the true regional SAT, we would have to use many 50 ft stacks of thermometers distributed evenly over the whole region, an obvious practical impossibility.
Q. If the reported SATs are not the true SATs, why are they still useful ?
A. The reported temperature is truly meaningful only to a person who happens to visit the weather station at the precise moment when the reported temperature is measured, in other words, to nobody. However, in addition to the SAT the reports usually also mention whether the current temperature is unusually high or unusually low, how much it differs from the normal temperature, and that information (the anomaly) is meaningful for the whole region. Also, if we hear a temperature (say 70°F), we instinctively translate it into hot or cold, but our translation key depends on the season and region, the same temperature may be ‘hot’ in winter and ‘cold’ in July, since by ‘hot’ we always mean ‘hotter than normal’, i.e. we all translate absolute temperatures automatically into anomalies whether we are aware of it or not.
Q. If SATs cannot be measured, how are SAT maps created ?
A. This can only be done with the help of computer models, the same models that are used to create the daily weather forecasts. We may start out the model with the few observed data that are available and fill in the rest with guesses (also called extrapolations) and then let the model run long enough so that the initial guesses no longer matter, but not too long in order to avoid that the inaccuracies of the model become relevant. This may be done starting from conditions from many years, so that the average (called a ‘climatology’) hopefully represents a typical map for the particular month or day of the year.
Q. What do I do if I need absolute SATs, not anomalies ?
A. In 99.9% of the cases you’ll find that anomalies are exactly what you need, not absolute temperatures. In the remaining cases, you have to pick one of the available climatologies and add the anomalies (with respect to the proper base period) to it. For the global mean, the most trusted models produce a value of roughly 14°C, i.e. 57.2°F, but it may easily be anywhere between 56 and 58°F and regionally, let alone locally, the situation is even worse.
Source is here
h/t to: Nick Boyce
I’ve always had a sneaking suspicion that Gavin is the token Real Scientist on the alarmist side.
Is this a new page?
If so, it might suggest Reto has had a hand in it, now Homer’s gone.
One way of getting at a climate-significant temperature is to measure from a satellite far away in space the amount of radiation [Earth Total Irradiance if you will] received from the Earth [by ‘staring at the Earth’]. From that, an ‘effective’ temperature can be calculated and its variation monitored. There have been such proposals, but they have come to naught.
So a few tenth’s of a degree are not remotely important and we’ve added only ~0.7 since the 19th Century
With all the uncertainties, it certainly makes a case for satellite based data collection – at least it is an objective way to collect data that is more easily standardized.
…. maybe that’s why NASA GISS is the source – satellites would be right up their alley
According to Vincent Gray, at least the first few question/answers are due to James Hansen. Yes, that James Hansen.
this should not be news to anyone who understands what we mean by SAT
Gary Pearse says:
August 14, 2013 at 11:13 am
So a few tenth’s of a degree are not remotely important
############
settled that science huh?
selective skepticism is funny
selective skepticism is funny
bedwetting is even funnier
Don’t tell me there’s a chance they might actually return to doing science.
It appears to me that the only absolute temperature that would have any relevance would be from the temperature readings at Mauna Loa, since this seems to be the only relevant place on the earth that CO2 readings are taken. This, of course, begs the question: Why do not weather forecasts include local CO2 readings if levels of atmospheric CO2 have an impact upon climate? What impacts weather also impacts climate. Right?
Great article Anthony – in real life we all know walking around you hit warmer and cooler patches everyday even on level ground. I have said the same forever – there is no common temperature for anyplace at anytime. Land height, wind direction, moisture content, cloud cover, sun, shade, buildings, rock, sand, vegetation, etc. all play a part with so many temperatures at any given location no computer program is capable of duplicating.
After all the discussion about the impossibility of measuring or even defining the SAT, the last paragraph says it is 57.2 +- 1 degree F. Which translates to 287 K +- 0.55 K, an error of about 0.2%! Would that other climate parameters could be measured so precisely.
“For the global mean, the most trusted models produce a value of roughly 14°C, i.e. 57.2°F, but it may easily be anywhere between 56 and 58°F…”
–
The difference between 57.2 and 56 is 1.2 degrees F. Isn’t that about how much the planet has supposedly warmed over the past century? So, basically this is an admission that the estimated amount of modern global warming falls within the margin of error for measuring global mean temperature. Doesn’t that make it statistically indistinguishable from zero? If so, that’s quite an admission.
One of my criticisms of climate models is that they produce very different values for global temperature when expressed as absolute values rather than anomalies. Typically a ‘warm’ model simulates temperatures that are 1.5 °C higher than a ‘cool’ model.
http://www.climatedata.info/Temperature/Temperature/simulations.html
Steven Mosher says:
August 14, 2013 at 11:23 am
this should not be news to anyone who understands what we mean by SAT
Gavin says:
Q. What exactly do we mean by SAT ?
A. I doubt that there is a general agreement how to answer this question.
Perhaps Mosher could fill us all in (including Gavin) on “what we mean by SAT”
“For the global mean, the most trusted models produce a value of roughly 14°C, i.e. 57.2°F, but it may easily be anywhere between 56 and 58°F and regionally, let alone locally, the situation is even worse.”
Wow. The slow, dissembling backing away from alarmism?
Leif Svalgaard says:
August 14, 2013 at 11:10 am
…There have been such proposals, but they have come to naught.
Ummm…they don’t want actual measurements…empirical data would ruin their scam!
“…let the model run long enough so that the initial guesses no longer matter,…”
I think a little detail is omitted in this statement…if the initial guess no longer matter, then you should not need them at all, and I’m sure that’s not what they meant to say.
Lance Wallace
“What we mean by SAT” is a vague attempt to define a nearly meaningless concept. Does that help any?
Louis says:
August 14, 2013 at 11:47 am
=======
yep
“Q. What do I do if I need absolute SATs, not anomalies ?
A. In 99.9% of the cases you’ll find that anomalies are exactly what you need, not absolute temperatures.”
Number one: the question was not answered.
Number two: “exactly what you need” for what? For time series analysis? Can we never escape the church of time series analysis and travel to the land of actual physical science? Anomalies are faux data produced through human contrivance to make time series analysis easier. No actual physical theory takes such human contrivance as data. Actual thermometer readings will serve as the only data for climate science once it becomes a genuine physical science.
Gary Pearse, I always have to remind myself that we are talking a range of less than a degree Celsius between the warmest and coldest year on record… Its a grand debate of tenths,
JimS says:
August 14, 2013 at 11:32 am
Part of the gospel of Alarmism is that CO2 is well mixed in the atmosphere. Ask them how it gets from its major sources to Mauna Loa and you will get no answer. Apparently, they believe that all of it travels straight up for 20 miles or so and then travels laterally and sinks.
Oh, how I would like to find everyone warmist I’ve ever “debated” and put this in front of them. Something I’ve been arguing with them for years.
“What is the temperature of the earth right now”?, I would ask, knowing that there is no answer.
“Scientists say…” they would begin.
“No, some scientists say X, some say Y, some say Z”, I would correct.
“You’re an uneducated turnip”, they would parry.
“You don’t know the temperature of the earth now, you can’t tell me what the temperature of the earth was yesterday, last year or 10,000 years ago, and can’t tell with any reasonable degree of certainty what it will be like in years, decades or centuries because the scientists don’t know themselves”, I would counter.
“You’re just regurgitating oil-industry propaganda from an un-peer reviewed source” would be the reply.
“NASA isn’t a good source?”, I would inquire, nicely.
“This blog says…” would come the retort.
“Did you just quote an un-peer reviewed blog to counter a NASA statement?”, I pointed out, helpfully.
“Your grandchildren will hate you!!!!”, or words to that effect.
Or, worse, they would counter with another NASA webpage that contradicted the one I posted, the irony of their proving my point for me not even slowing them down…
Thank you, Anthony.
There is no easy way to measure the temperature in that it is measured in a consistent manner through out time.
Gavin:
“Q. What exactly do we mean by SAT ?
A. I doubt that there is a general agreement how to answer this question.”
I’ll help out. Whatever we can feed the journalists so that they can write a piece of propaganda as ordered by GLOBE.
Unfortunately, starting in September, nobody will listen anymore to what the propaganda apparatus of the Western World says; as the West is broke and corrupt. (G20 meeting in Russia)
Any measure of “surface air temperature” can’t be done without defining the surface to air interface. The ocean surface has a thermal heat capacity thousands of times higher than the air above it. Seawater is 800 times the density, and has 4 times the specific heat capacity.
Just study http://www.eoearth.org/view/article/152458/
Or just put a thermometer on the ground and read the temp.
If you want to know the global temperature trend, just put a thermometer in every 100 meter square around the Earth and read them all at the same time. If you can’t do that, then just a few around Antarctica for a few decades. No heat islands there. By the way, those Antarctic thermometers at Amundsen-Scott, Halley, Davis and Vostoc science stations all show zero warming since 1958
Gavin Schmidt, BTW, is a criminal. He continues the perversion of the temperature record.
http://suyts.wordpress.com/2013/07/23/really-giss-dishonesty-continues-in-post-hansen-era/
Probably he hopes to get prices by European royalty and book sales like Hansen.
Yes. The ever changing GISS data is as about as useful as a fur lined syrup pitcher. If the dolts ever got to where they quit playing computer games and left the historical temps alone, they could move on to some thing else like energy calculations without the ever changing base. Then, they just may come to realize exactly how useless a global temperature average is.
Temps from different base temps, put in anomaly form are averaging unlike values. The hotter the base temp is, the more energy it takes to raise it X amount degrees. The cooler the temps, the less energy to warm the same space with same content the same X amount of degrees. A global average temp anomaly is a nonsensical metric. It’s like averaging stamp prices with the rpm of your fan.
More than that, even if they ever got to the point of actually measuring temps, it says nothing about the direction. SSTs are my fav!!! Is that measuring energy change going up or down?
If anyone is interested, I just finished a comparison to once was the GISS iteration of the first 30 years of our temp record to what it is today. It’s kinda funny all by itself.
Cool – this looks a lot like what I’ve been saying all along… there is no actual SAT, and the definition of same is fluid and depending on the person and purpose.
Now, let’s hear a sane discussion about the usefulness of Arctic sea ice extent, where people start to admit that it’s essentially meaningless as well…
Ohhh No…. You mean I’ve been under the assumption that they knew what the SATs were?
The ever changing GISS data is as about as useful as a fur lined syrup pitcher.
================
roaring laughing………………
“the usefulness of Arctic sea ice extent”
dumbest thing I’ve ever seen………..
Folks: We have here a WA Guesstimate. But trust us!
If I was a modeler…I’d be pissed as hell!
Jiggle the past temps that I’m trying to tune to…..it’ll never be right
“””””……Leif Svalgaard says:
August 14, 2013 at 11:10 am
One way of getting at a climate-significant temperature is to measure from a satellite far away in space the amount of radiation [Earth Total Irradiance if you will] received from the Earth [by ‘staring at the Earth’]. From that, an ‘effective’ temperature can be calculated and its variation monitored. There have been such proposals, but they have come to naught…….””””””
Well the earth as seen from space, would have radiating areas, with (surface) Temperatures ranging from near -90 deg C up to at least + 60 deg C all at the same time in northern summers. Then there would be the various radiating atmospheric strata; not to mention simple and not so simple scattering of solar spectrum energy by clouds et al.
So there is no way that such an energy source would have a Planck spectrum like a single Temperature near black body source.
Well you could always define the Temperature as being that Temperature of a single Temperature BB source emitting the same total spectral radiance, as the real earth.
But does even that have any valuable physical meaning ?
Mother Gaia knows the correct Temperature of the earth; but she ain’t telling us what it is.
The Q&A is useful and surprisingly scientific, given its authorship.
It’s not as useful, say, as Essex and McKitrick’s dissection of the very idea of global mean temperature, but it is nice to read nonetheless.
I’m increasingly amazed that temperature, of any kind — local, regional, or “global” — has been allowed to stand in for heat/energy in the analysis of the multi-layered, interdependent, chaotic ocean-atmosphere system. Whether the whole vast entity is gaining in energy would require long-term measurements, a century and a half, say, of the following:
all ocean currents
all river systems’ flow
all glacier systems
air chemistry at all locations
ocean chemistry at all points
lightning frequency
potential electric energy in the atmosphere, at all points
wind, at all locations
relative humidity, at all locations
and, oh yeah, temperature, at all locations
Some very immature minds were so intoxicated that the system could be “known” via a single variable, a mishmash b.s. one at that, that they bastardized science in a way that was not necessarily likely at this stage in the game. Bear in mind that objective understanding of the oceans and atmosphere was actually increasing half a century ago. Things did not have to turn out this way.
Q: If SATs cannot be measured, how are SAT maps created?
Ruh roh – somebody left the model running too long – climate predictions don’t follow observed and never have.
there are data and then there is the real world
theories that hold are somewhere in between I guess…
The difference between 57.2 and 56 is 1.2 degrees F. Isn’t that about how much the planet has supposedly warmed over the past century? So, basically this is an admission that the estimated amount of modern global warming falls within the margin of error for measuring global mean temperature. Doesn’t that make it statistically indistinguishable from zero? If so, that’s quite an admission.
It is only one of many horrendous features of climate claims. The venerable book How to Lie with Statistics lists reporting an anomaly, especially an anomaly that cannot be normalized withing error bars greater than the anomaly itself, as a classic method. It works best, of course, if you cherrypick your interval so that it shows whatever you want it to show, and downplay any intervals that don’t show what you want it to show.
Another serious problem with this is that it says “climate models” at all. In other words, when discussing global warming one is comparing the output of one series of models to the output of another! There is literally no way to test either set of models against reality — one takes reality in and returns a synthesized product that is some sort of transformation of the actual data. It extrapolates and infills, takes numbers from a single location and smears it out over an area many times its size whether or not it is representative of that area. It is almost certain that the error resulting from this process is several times larger than the spread in the model means, especially since the model means are, no doubt, adjusted by means of one or more variable parameters to be within range of some value that is believed to be the mean global temperature. The GCMs then turn around and produce values that temporally extrapolate fits not to the actual data but to the extrapolated infilled data. They are literally fitting one model with another model. The error bars associated with such a double fit are, obviously, larger than the error bars associated with each model individually.
Finally, the mean of many models is a mean-ingLESS quantity. The variance of many models around their mutual mean is also a meaningless quantity. The central limit theorem does not apply to the means of multiple, supposedly independent models, it applies to independent and identically distributed samples drawn from a single model. In no possible sense are model parameters and design features random variates drawn from an iid distribution of model parameters and design features.
But the real tragedy, the truly annoying feature of the entire debate, is that not one word of the Q/A session above will make it into the AR5 Summary for Policy Makers, no matter who wrote them. We wouldn’t want to confuse the policy makers that might vote to take our money and other drastic measures designed to save us from a disaster predicted by models of models by telling them explicitly that we have no idea what the surface air temperature produced by the models mentioned above really is, but that WHATEVER it is it cannot be meaningfully be compared to thermometric readings from a century again where we don’t even have the bare possibility of normalizing the “anomalies” of the day to the “anomalies” of the present given that to do so requires begging the question — a prior knowledge of what the mean temperature then versus now really was. We also would not want them to have any chance of noticing that the spread in the model means is as great as the entire warming “anomaly” supposedly observed in the last 140 years.
After all, one of them MIGHT have read the book How to Lie with Statistics, and that person might ask some difficult questions, publicly, and then where would we be? Honestly reporting our lack of “settled science” at a level so fundamental that it leaves the entire debate as:
“We might have warmed a full degree since 1870, give or take pretty much a full degree. Some fraction of that warming — if it warmed at all — might have been our fault. Or, since at least half of that warming preceded any significant increase in atmospheric CO_2, maybe not. But we are certain that we are in enormous danger of an anthropogenic climate catastrophe, because our models, fit to other models for the SAT and repeatedly adjusted (on both sides) until they both produced the same anomalies around mean temperatures that substantially differed between the models, predict catastrophic warming if certain parameters, that we can only guess at because they cannot be measured given that the entire functional process that we claim is going to lead to the warming cannot be measured and they are part of that process, are in fact correct, and we ignore the fact that in SPITE of fitting the models of models so that they worked great during the fit interval, they have essentially no predictive value whatsoever in the 16+ years since they were fit, even predictive value of the models they were designed to fit, even when those models themselves are tweaked as much as we can possibly stand to tweak them.”
I seriously think that AR5 needs to be openly called on the errors of AR4 BEFORE they finally release it, in such a way that it is made clear that they will not get away with them again. It also needs to be pointed out that climate sensitivity is in what amounts to free fall as it becomes more and more constrained by the pesky lack of warming. 2013 sounds like it might well shake down as a year where it substantially cools, especially if the arctic cooling persists. North Carolina had the coolest summer I can remember since back in the late 70s or early 80s — it has rained almost every day over much of the state. Today the high temperature in Durham is going to end up being maybe 77 F. In mid August! I cannot tell you how unusual that is. The high temperature PREDICTED for the rest of the week is 79 F. The low temperature is dropping down to the low 60’s. The Atlantic and Gulf of Mexico are comparatively cool — warm enough for hurricanes, to be sure, but cooler than one might expect in August, and the waters off of the coast of Africa have barely hit 80 F.
This is OCTOBER weather, not August weather. It absolutely could warm up to seasonal norms, but every day spent cool still lowers the averages.
Interesting times. We’ll see if the IPCC AR folks have the pills to release yet another doom and gloom report and yet another deliberately misleading Summary for Policy Makers into the teeth of what could easily end up one of the coolest years in the last 30, a year where Arctic Sea Ice actually recovers fairly substantially towards its “norm”, whatever that might be.
rgb
It is generally assumed that the AMO cycle is 60years long, but I found it varies between 54 – 66 years. It is often said by sceptics that two bursts of the global temperature rise in the 20th century are associated with the AMO.
Here is a test.
I searched for two sections of the 20th century GT with same trend line slope and found them with no trouble each 33 years long (as it happens half of the longest AMO) and 54 years apart (this time the shortest AMO).
http://www.vukcevic.talktalk.net/GT-AMOsx.htm
Common sense is not much good here, so possible alternatives are:
– coincidence (neutral view)
– CO2 sensitivity law of some kind or another (warmists’ view)
– AMO in action (sceptics view)
I have no idea, but I would think probability of a coincidence is not very high.
Some very immature minds were so intoxicated that the system could be “known” via a single variable, a mishmash b.s. one at that, that they bastardized science in a way that was not necessarily likely at this stage in the game. Bear in mind that objective understanding of the oceans and atmosphere was actually increasing half a century ago. Things did not have to turn out this way.

 is some suitable coarse-grain averaging interval and
  is the area of the Earth, that is, the fourth root of the spatiotemporal average of
  . This quantity, times
  , is arguably the outgoing radiative energy flux at the surface (or proportional to that flux in some reasonable way) and one might actually learn something about what the Earth is doing radiatively from this quantity that is completely hidden in:
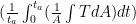
 itself. The second thing that we could do is take Lief’s excellent suggestion and position enough satellites (perhaps at Lagrange points) that we can measure the Earth’s total (full spectrum!) luminosity on both the illuminated side and the dark side, all of the time. It would have to be done with frightful precision, and would have to be matched with real-time measurements of TOA incoming insolation levels to equal (but easier) precision, but one could then at the very least START to study whether the Earth is indeed in a state of energy imbalance. As it is now, they are looking for “missing heat” when they don’t even know (on the basis of ANY sort of measurement) if there is any missing heat to be found.
Remarkably well said, actually. I agree.
If they were GOING to try to publish a global mean temperature that is ARGUABLY meaningful, they might try publishing:
where
which has literally nothing to do with radiation rates in the specific sense that there is a huge range of positive power (gain) and negative power (loss) consistent with any given value of the latter, depending on the DISTRIBUTION of the former.
But as you say, this would still not be a gold standard of meaning, only better than the mean of
rgb
Meta-comment for Anthony:
I tried the preview button for the math text above. It did let me verify that the latex code was correct, but the previews I’m seeing suck pretty badly — they don’t really look at all like the posted article. This includes the paragraph layout, the fonts, the scaling. It’s like a dim, distorted preview so far.
I totally appreciate the improvement, and the amazing thing about dancing bears is that they can dance at all (not how gracefully they dance) etc, but if in fact this CAN be tweaked until the preview looks exactly like the posted article, that would be fabulous.
A second feature one has on at least some uber-blog websites (such as Goodreads) is the ability to edit one’s posts after they are made. On a site like this one you might or might not want to permit this, but it is really useful in civilized conversations…
rgb
rgb
@RBG Yes this is just one I’m trying out with the new Enterprise service…-Anthony
Oops, I meant the average of , not the fourth root of the average of
  , is proportional to the outgoing term in the Stefan-Boltzmann equation. Sorry.
rgb
george e. smith says:
August 14, 2013 at 1:24 pm
But does even that have any valuable physical meaning ?
Yes it is a measure of what goes out. If we compare with what goes in [TSI] we can do the energy balance. And that is valuable. And meaningful. To wring hands and say that the temperature cannot be measured, or is nonsense, or is useless, etc, is ostrich-science.
rgb writes:
“we don’t even have the bare possibility of normalizing the “anomalies” of the day to the “anomalies” of the present given that to do so requires begging the question — a prior knowledge of what the mean temperature then versus now really was.”
Yep. Their argument is one tight little circle.
Perhaps Mosher could fill us all in (including Gavin) on “what we mean by SAT”
Simple, I’ve explained it a number of times here.
the ‘average’ is the estimate derived from known measurements which minimizes the error.
For example we have 39000 stations. we dont actually compute an average of these.
what we do is compute a field . (x,y,z,t)
now you can integrate this field say at time t. jan 2012. and you get a number
15.2356547654C.
Pick a spot that hasnt been sampled. your best estimate for the temperature at an unobserved location is 15.2356547654C
if you tell me the x,y,z, as well as the t, that estimate will be sensitive to the location.
Think of it this way
you have a pool. the thermometer at one end reads 74F. the other end reads 76F
Estimate the temperature at the center of the pool. ypu decide to average 74 and 76 and get 75.
While you may use averaging to arrive at this estimate, its more accurate to describe ’75F’ as the estimate of temperature at unsampled places which minimizes the error rather than describing it as “the average pool temp” . you might USE averaging to get this number, but the number actually represents your best estimate of the temperature at un sampled places.Folks often get sloppy in their descriptions and call this “the average temperature” but that’s not really what it represents. Its the estimate of measurements at unsampled places.
The nice thing about this formulation ( the way we do it ) is that we avoid averaging over stations, we integrate the field and we can actually test the hypothesis as we get new data. So, for example, I’ve identified a pristine series of data stations that are fully calibrated,
these were not used in the construction of the field.
Now I can test: My field says the temperature value at x,y.z,t should be 12.C
then look and see. is it?
You can actually do this with Giss and Cru as well.
In the grand scheme of global warming what you want is what leif suggests. That’s what you really want. but life is not burger king and you cant have it your way.
Since we dont have that we are left with diagnosing a complex system by looking at a thin slice at 2meters. and a few other slices in the ocean and atmosphere. woefully inadequate, but not uninformative.
also the 2 meter slice is not very robust when it comes to total system characteristics, but that slice is meaningful to the creatures who live there.
deciding whether one can use the data for policy or safely ignore it, is not of much interest to me. it just is what it is. A number that give us a glimpse into a complex system.
Global temperature makes sense only as an imaginary variable of no particular practical value.
Here are two regions of the globe, barely 1000km apart (2.5% of the circumference) with long and relatively accurate temperature recording:
Central England and Central Europe
http://www.vukcevic.talktalk.net/2CETs.htm
Make of it what you may.
Measuring temperature on Earths surface is only relevant during sunlight hours (clouds or not). If the Earth did not rotate the dark side would be -473K and the other side who knows 2000C? or more? The warmness during night is due to the days exposure to the Sun. Or you could say what would happen to the Earths temperature if the Sun dissappeared? The whole surface would be -473K (temperature of Space) stand to be corrected on the exact K figure there. Of course as you dig deeper the temperature will increase due to gravity. This is assuming no atmosphere of course.
So if they know that there are so many uncertainties, then why are they still pushing alarmism?
Eliza says:
August 14, 2013 at 2:52 pm
……
you ment to say – 273.15 + 2C of background radiation
Let’s try again
(-273.15 +2.7) C
Jarryd Beck says:
August 14, 2013 at 2:54 pm
So if they know that there are so many uncertainties, then why are they still pushing alarmism?
===========================================================
Because the discussion is ideological and theological and not scientific. They believe, and they want to believe because it fits their world view.
That’s what you really want. but life is not burger king and you cant have it your way.
Nor do we have to forced to eat your shit sandwich
. . . . . and at very few of the data points in any of the whole grid are relative humidity or any other variables measured and or used to provide a true indication of actual energy content . . . . This post has finally spelled out just how utterly INSANE the whole debate about global warm. . . er, I mean global climate change has been!! And to think that the whole debate eventually boils down to a question of what to do about a 0.1 degree C change on a mishmashed guestimate of a variable that doesn’t come close to representing average energy (as though that would even mean anything) for a global system that is completely self regulating anyways, and always has been!
.
I’m sure he wrote this as a way to puff up just how herculean his job is, but instead, I’m left astounded that Gavin would publish this frank admission of just how utterly meaningless the whole exercise is! I hate the fact that we are paying millions in tax money to keep this !@#*&$*#& charade they have the audacity to call “science” going. This is not the NASA I grew up respecting! Shut it all down! It serves absolutely NO USEFUL PURPOSE.
To be sure, GAT is not particularly meaningful as a scientific measure of the state of the global climate system. Temperature is, after all, an intensive, nonconservative metric that is highly volatile near the Earth’s surface. Nevertheless, it’s there that humanity lives and experiences its impact. And GAT, obtained as an areal average of air measurements at the WMO standard height of 1.5m, is nowhere near as arbitrary as GISS portrays it. The convergence to a distinct time-history of variation during the 20th century is remarkably rapid when only properly vetted, intact station records are employed. The practical (and propaganda) value is unmistakable!
Satellite measurements, on the other hand, can establish in principle the TOA balance between incoming and outgoing radiation. There are formidable obstacles in practice, however, with discrepancies between satellites often far exceeding in their magnitude the sought-after signal of planetary power flux. The latter, alas, is not uniquely related to GAT. Thus the surface integral of the fourth power of T would not yield the information about climate chnage that is sought. As spectrography clearly shows, what is emitted by the Earth to space is not a simple Planck curve; the OLR spectrum diverges very strongly in many bands. The Stefan-Boltzman equation, relating the fourth power of temperature to radiation, cannot be realistically applied universally.
sky
I meant to say “far exceeding in their magnitude the … NET power flux.”
Leif Svalgaard;
There have been such proposals, but they have come to naught.
>>>>>>>>>>>>>>>>
Aw c’mon Leif. Can’t you turn yours around every so often and take a snap of the earth? Do you have to be looking at the sun all the time?
“”””””…..Eliza says:
August 14, 2013 at 2:52 pm
Measuring temperature on Earths surface is only relevant during sunlight hours (clouds or not). If the Earth did not rotate the dark side would be -473K and the other side who knows 2000C? or more? The warmness during night is due to the days exposure to the Sun. Or you could say what would happen to the Earths temperature if the Sun dissappeared? The whole surface would be -473K (temperature of Space) stand to be corrected on the exact K figure there. Of course as you dig deeper the temperature will increase due to gravity. This is assuming no atmosphere of course……”””””
One thing we know for certain Eliza, is that there is NO – *****.***** K anywhere in the universe; or anywhere NOT in the universe, for that matter.
Zero K is as cold as it gets. Maybe by itself, it never gets below about 2.7 K .
Latitude, I assume by “dumbest thing I’ve ever seen” you mean the panic and worry over sea ice extent, right?
Perhaps they are just distancing themselves from the current mess that shows no warming, maybe a little cooling depending on how you look at it. This way they can just claim that the heat energy is hidden in some region that no one is actually measuring. Its convenient that if they don’t like what they find they can just say its meaningless and convince us all to go the Italian way and install solar till were broke. Just a thought, perhaps I am too suspicious.
Steven Mosher says:
August 14, 2013 at 2:45 pm: “…but life is not burger king and you cant have it your way…” Sure we can. We quit funding GISS, CRU and all the other modeling/manipulating psuedo-scientists, and put NASA back to building and (hopefully) launching the IR monitoring satellites (and incoming irradiation) and see what our black body or grey body planet says its energy balance and temperature is.
This SAT is sort of a perverted take on estimating the mineral grade of, say, a porphyry copper deposit. With enough drill holes and assays, a geostatistician can estimate the tenor of the copper mineralization quite well. If he doesn’t, he gets fired, and the mining enterprise built on his estimations possibly fails. Not so, unfortunately, with the lying weasels who are “estimating” the earth’s “temperature”.
Well, I find myself in the curious position of defending Gavin Schmidt against some of the accusations. Let me say that I think Gavin’s science is generally strong, but he’s drunk the koolaid and believes that global temperature is a linear function of the forcing. My main objection is to his censorious ways over at RealClimate, where inconvenient posts never see the light of day.
However, I think he’s getting a bum rap here.
First, there is an assumption that this is a new posting, which is somehow “backing away” from previous certainty. In fact, this is a very old posting, one that I would guess has been there for pushing a decade. I’m sure some genius lurker could tell us when it was first posted, but I assure you it’s been some years.
So everyone ascribing this to bad faith on Gavin’s, or to a climbdown, sorry, you’re wrong. In addition, it highlights the impropriety of ascribing motive in a scientific discussion.
And yes, the concept has been elusive for that long, and remains elusive, for a simple reason.
Temperature is an intensive property of matter.
This means it’s not a function of the amount of matter involved. Mass, on the other hand, is an extensive property of matter. If I have ten one-cm steel ball bearings, and add ten more identical bearings, I’ve doubled the mass … but the temperature hasn’t doubled, has it? Mass is extensive. Temperature is intensive.
Now, in theory you can get a meaningful average of an intensive property, but you’re wandering into uncharted territory. Color, for example, is an intensive property. We can define the pure color by frequency … so what meaning should we assign to the average of 3 blue balls, 2 yellow balls, and 1 red ball? Should we average light, or average pigment? Immediately, we have options.
The problem with averaging intensive measurements is that there are no rules, no “right way” to do it. Suppose we want the average temperature of the globe. We can take all the temperature records and average them … but how do we average them? A huge problem is that the Northern Hemisphere is way over-represented with many more stations, and there are few stations in the Southern Hemisphere.
The way the HadCRUT folks handle it to avoid over-weighting the NH is by first averaging the two hemispheres separately, and subsequently averaging the two hemispheres to give a global value. Is this the right way?
That’s the bad news. There is no “right way” to average an intensive property, particularly in the face of inadequate observations. Determining an extensive property is easy—weigh it, you’ve got the mass. But an intensive property? More observations help, but nothing is final. Some small unmeasured area might be really cold, and there goes your “average” …
There is a deeper problem, which is in the concept of “average” itself. There is a physical meaning to an average of an extensive property. Suppose we have four people who have 2, 3, 6, and 9 pennies respectively. The value of the coins is an extensive property—as the number of coins increases, the value increases proportionately.
Figuring out the average takes two steps. First, we add up the individual contributions to give us the total of the variable, which in this case is 16 pennies. This total has a real physical meaning, it is the count of actual pennies. We can see this by having them pile up all their pennies in the middle.
Then we divide that physical pile by the number of people, four, to give us an average of five cents per person. That has a real physical average.
Now, replace the coins with glasses of water at 2°C, 3°C, 6°C, and 9°C. What is the average temperature of the water? Well, first we add up the temperatures, and we say that the total temperature of the four glasses is 20°C … wait, “total temperature”? Say what?
“Total mass” has a real physical meaning. As a result, “average mass” also has a real physical meaning.
However, “total temperature” has no real physical meaning. It is an artificial construct. As a result, “average temperature” also has no real physical meaning.
There is a final issue, that of “radiation temperature”. For many climate questions the relevant metric is not the temperature, but the corresponding Stefan-Boltzmann energy radiated at that temperature. The issue there is that temperature is not conserved, but energy is. So at times, averaging temperature gives an incorrect answer for the purposes at hand, and what should be averaged is watts per square metre of radiated energy. Once that is averaged, of course, the same equations can transform that amount of radiated energy to the corresponding temperature.
So is that the right way to average temperature? See the answer above. There is no right way, there are different ways. Each one has advantages and disadvantages. None can be said to be the “true” absolute average temperature of the globe.
Which is why Gavin was right to describe the absolute air temperature as being “elusive” … and sadly, while using the temperature anomaly helps, it has its costs as well as benefits. I’m not saying we can’t use it.
I’m just saying that temperature is a difficult metric, that there are judgement calls at every turn, there is no “right way” to do it, and that solidity is elusive on all sides.
There are things you can bust Gavin for. This isn’t one of them.
All the best to everyone, including Gavin,
w.
The Earth abounds with meaningful climate measurements. Coral mounts show sea level was almost 9.5 meters higher 125,000 years ago during the Eemian interglacial; global temperature would be about 6 degrees Celsius higher. Coral mounts dated to 1600 to 8000 years ago indicate sea level three meters higher; roughly 2 to 3 degrees Celsius warmer. Similarly, tree lines were farther north and at higher altitudes during these previous warmer periods, and glaciers had retreated more than present. These natural signs of climate change have import that make the current attempts to measure and extrapolate temperature trends resemble reading the entrails of rabbits to foresee the future. However, in the latter instance you could at least be sure you would have rabbit for dinner; with the current methodology using instruments concentrated in portions of the 30% of the Earth’s surface, and massaged to achieve “homogeneity”, covering a very short time period, all you can be assured of is what you think you are having is not what you get. But that won’t stop the enthusiasts from telling everyone how meaningful whatever it was is, and what it means. At a 95% confidence level.
@rgbatduke
Shouldn’t the emissivity of a particular area, at a particular time be within the inner integral?
Emissivity is a surface property that varies over time, especially in vegetated areas. Doing so, provides for (changing) land use as well as natural effects like seasonal vegetation change, erosion, droughts, …
OMG a proper scientific discussion in the comments … lets keep it up.
Leif Svalgaard says:
August 14, 2013 at 11:10 am
One way of getting at a climate-significant temperature is to measure from a satellite far away in space the amount of radiation [Earth Total Irradiance if you will] received from the Earth [by ‘staring at the Earth’]. From that, an ‘effective’ temperature can be calculated and its variation monitored. There have been such proposals, but they have come to naught.
I agree that is the obvious point to measure and you can baseline it against solar irradiance hitting the satellite … the cost of such a satellite is hardly massive why has no one done it surely can’t be a cost basis given how much is being spent on climate science?
CodeTech says:
August 14, 2013 at 5:14 pm
Latitude, I assume by “dumbest thing I’ve ever seen” you mean the panic and worry over sea ice extent, right?
======
yep you’re spot on as usual…..who decided floating ice was an indication of anything but wind
Willis says:
“First, there is an assumption that this is a new posting, which is somehow “backing away” from previous certainty. In fact, this is a very old posting, one that I would guess has been there for pushing a decade. I’m sure some genius lurker could tell us when it was first posted, but I assure you it’s been some years.”
Indeed so. It’s a page that I have frequently cited over the years here as a reason why it is essential to use anomalies. Here, for example, in 2010.
The NOAA has a similar page.
“I think Gavin’s science is generally strong”
Really? now then i have to ask what you think is science… if someone knows how to count 10 ants and says the result is an elephant that is strong science?
“why it is essential to use anomalies.”
The only reason to use anomalies is to be able to manipulate the results. Nothing more.
Nick Stokes;
Indeed so. It’s a page that I have frequently cited over the years here as a reason why it is essential to use anomalies.
>>>>>>>>>>>>
And, as I have pointed out repeatedly, there is absolutely no physical justification for the use of anomalies, and plenty of reason NOT to. An anomaly of 1.0 at -40C is equal to 2.9 w/m2. An anomaly of 1.0 at +40C is equal to 7.0 w/m2. The notion of anomalies in cold regimes being averaged with anomalies from warm regimes is absurd.
majormike1 says:
August 14, 2013 at 6:15 pm
“The Earth abounds with meaningful climate measurements. Coral mounts show sea level was almost 9.5 meters higher 125,000 years ago during the Eemian interglacial; global temperature would be about 6 degrees Celsius higher. Coral mounts dated to 1600 to 8000 years ago indicate sea level three meters higher; roughly 2 to 3 degrees Celsius warmer.”
A very nice point. I remarked on a sea level discussion associated with Greenland melt not long ago and made the point that along the N shore of Dominican Republic there is coral off shore and the shore itself is pretty much all coral rock (I estimated IIRC it to rise about 6-7m) and the most startling feature was a flat bench cut in the coral all along the coast that is (I thought) 2m above present sea level indicating a former level. You have filled in the blanks for me. It turns my thinking to the idea that sea level alone is about the best we can hope for as a measure of where we are in the climate range. Recent spin papers that dispute the higher temp of the Eemian and optima of the Holocene on the basis of badly designed surveys of calcareous fossils and their oxygen isotope ratios tend to ignore the hard evidence that is sticking in their faces. On the subject of oxygen isotopes in limestones and shells. It is well known by geologists that calcareous deposits tend to become dolomitized and this means that MgO (which abounds in seawater replaces CaO in CaCO3. Are the oxygen isotopes unchanged? In the process is there a preference for which isotopes might stay and which might go with a sea of a different temperature and isotopic composition than the earlier seawater? Is their a biochemist in the house? Anyway, the error bars on their stuff makes for a lot of controversy but solid sealevel changes are pretty good global sentinels of prehistoric climate.
I guessed Gavin Schmidt had written what I thought a well constructed and well balanced piece. When I found it had originated at GISS I wondered if Gavin really had written it. Does anyone know?
Mosher writes:
“Think of it this way
you have a pool. the thermometer at one end reads 74F. the other end reads 76F”
Really, Mosher, your analogy to the earth’s temperature is the temperature of a pool? Do you not realize that using a pool begs all the questions? Your analogy assumes that everything is quite stable, uniform, and, most important of all, all factors are knowable.
How about you try the same explanation with an example that has a little life in it, as the earth does? Take a good sized marsh of the sort that you might drive through on some interstate in Florida. It would be maybe five miles by five miles. How well does your technique work for water temperature in such a marsh?
Steven Mosher says: August 14, 2013 at 2:45 pm
“…it just is what it is. A number that give us a glimpse into a complex system….”
A glimpse it is, but that glimpse is not unimportant in this debate.
In fact, surely it is that ‘glimpse’ and opinion as to its significance, or not, that is behind the formation of the IPCC, climate policies and the ‘green push’ for power and influence, publication of thousands of papers and the creation of thousands of blogs…
….. and the main reason we discuss these issues here with such feeling.
As Willis writes, temperature is an intensive property.
Thus there exists no such thing as an average temperature in a heterogeneous system such as the earth’s atmosphere. It’s already difficult to measure it accurately in a well agitated vessel.
This is why the concept of temperature anomalies was developed: accuracy is no more needed, but reproducibility over time must be given.
In the GISS Q&A I’m missing the question about altitude of the land stations: it cannot be that an average surface temperature will be calculated between measurements made e.g. in Miami and Denver; that value will be meaningless.
Michel:
You end your post at August 15, 2013 at 12:48 am
http://wattsupwiththat.com/2013/08/14/the-elusive-absolute-surface-air-temperature-sat/#comment-1390577
saying
Actually, it is worse than that. All the indications of average global temperature are meaningless.
There are different teams (e.g. GISS and HadCRU) who compute “average global temperature” data sets. Each of the teams uses a different method (i.e. different selection of measurement sites, different weightings to measurements from individual sites, different interpolation methods for values between sites, etc.).
So, the indicated “average global temperature” provided by each team is a unique parameter.
The data sets provided by the various teams are often presented on the same graph (e.g. by IPCC) under the same heading, and there has been no public objection to this by any of these teams. This suggests the teams agree “average global temperature” is a physical parameter that indicates a unique value for the average temperature of the air near the surface of the Earth for each year.
However, the data sets provided by the teams differ such that it is clear they are not indicating the same thing.
The data sets have significantly different trends, and in each of several pairs of years the annual change to “average global temperature” differs between the data sets by more than double the calculated 95% confidence limits of each data set. So, whatever the data sets are indicating, it is apparent that they are not indicating the same thing.
In itself this is not a problem because any data set can have several averages; e.g. its mean, its median, its mode, etc.. However, each of those averages has a specific and defined meaning.
But the “average global temperature” provided by each team is not defined and the method of its calculation is frequently changed; see
http://jonova.s3.amazonaws.com/graphs/giss/hansen-giss-1940-1980.gif
If the teams are each monitoring different climate effects then each should provide a unique title for their data set that is indicative of what is being monitored. Also, each team should state explicitly what its data set of “average global temperature” purports to be monitoring. In the absence of such statements all the indications of “average global temperature” are – both literally and practically – meaningless.
A more full explanation of these issues is provided by Appendix B of the item at
http://www.publications.parliament.uk/pa/cm200910/cmselect/cmsctech/memo/climatedata/uc0102.htm
Richard
“richardscourtney says:
August 15, 2013 at 1:32 am
You are absolutely correct. However, its even worse than that. Given the fact that 7/10’s of the surface does not have a thermometer anywhere near it so a “global average” is even more meaningless than you state. Here in Australia, the BoM/CSIRO developed a new way to calculate a nationwide average and similarly with GISS and HadCRU, don’t identify their data, sites, measurements, adjustments nor their methods. Of course, the average generated is splashed across newscasts on TV, in “angry” red, as being the highest evah!
Put it simply – it’s a mess. But what a surprise who said it!
<bReply to richardscourtney, August 15, 2013 at 1:32 am
Richard,
You are right!
But these days to be right is not enough: when climate issues are reduced to only one parameter – temperature – we are stuck with this physical and societal nonsense.
And everyone has an opinion on temperature…
According to GISTEMP’s version 3 of station data
http://data.giss.nasa.gov/gistemp/station_data/
there are two weather stations at Amundsen-Scott at the south pole. They have a continuous record since 1957, apart from a gap of one year for one of them. Taking into account this break, the average temperature, 1957 to 2012, at one of them was -48.4°C, and -49.4°C at the other. So even after GISTEMP’s “homgenisation” (whatever that may mean), there’s still a difference of 1°C for two weather stations at virtually the same location. Both are at 90.0°S, 0.0°E. Presumably, because of the prestigious location, both stations are properly equipped and well maintained. I’m just an old fool who knows knows ****** about ****** all, but it seems to me that if we know the temperature at Amundsen-Scott to no better than (+/-(0.5))°C, the margin of error is bound to be greater than that for an estimate of global surface temperatures, even if we employ temperature anomalies. Temperature anomalies are inferred from absolute temperatures, or they’re inferred from nothing at all. As it happens, I have a deep loathing for temperature anomalies. They conceal at least as much as they reveal. They are a degraded form of information. From absolute temperatures you can infer as many temperature anomalies as you please until the cows come home. But it doesn’t work the other way about
The major thing that Gavin and the other “climatologists” don’t seem to realize, is that if you have a meaningless, undefined quantity, then the anomoly calculated from that meaningless undefined quantity is still MEANINGLESS and UNDEFINED.
davidmhoffer writes “The notion of anomalies in cold regimes being averaged with anomalies from warm regimes is absurd.”
Which is why estimations of energy content, specifically the ocean heat content, are much better measures of global warming. Gavin may be correct and candid about SAT but when it comes to comparing the OHC from the models to the measured OHC he shows his true “team” colours.
For years now he has refused to make a true comparison in his annual “comparison of models vs reality” that happens early in the year. Instead he extrapolates what the models might have done rather than simply working out what they did do. Apparently understanding this measure isn’t worthy of his time.
Steven Mosher says: August 14, 2013 at 2:45 pm
“For example we have 39000 stations.”
No, you don’t. Show me your list of 3900 stations for 1880.
A few points of interest as a follow on from the Q&A.
1. The convention for surface temperature is to use 1.5m temperature, as this is at a height where the thermometer is easy to read without stooping down or climbing a ladder.
There are some oddities with this. I’ve seen 2m temperature quoted in a few places, though I’m not sure where that comes from. Also, for the global temperature averages the 1.5m temperature over land is often combined with the sea surface temperature (SST), which is generally the temperature of the top layer of the ocean water, rather than the air 1.5m above it.
Finally, most models do not have a level at 1.5m above the surface – the lowest level will be typically somewhere like 5-20m above the surface. Obviously some sort of algorithm is used to convert the lowest level temperature in the model to the 1.5m temperature.
2. The Q&A is absolutely right to say that calculating a daily mean is fraught with complications, but this is the sort of thing that averages out in a global mean. I did a comparison with model data between a daily mean over all timesteps and a daily mean = (max + min) / 2 and locally the differences could be very large. In the global mean, nothing.
The only potential pitfall here is if you compare observational data calculated in one way with model data calculated in another.
Alistair Ahs:
You conclude your post at August 15, 2013 at 9:02 am
http://wattsupwiththat.com/2013/08/14/the-elusive-absolute-surface-air-temperature-sat/#comment-1390845
saying
NO! You are plain wrong.
If the so-called “observational data” is meaningless then it cannot be modeled by a true model of the Earth’s real climate. And it is meaningless.
Please read my above post at August 15, 2013 at 1:32 am
http://wattsupwiththat.com/2013/08/14/the-elusive-absolute-surface-air-temperature-sat/#comment-1390605
and all of its link which I copy to here
http://www.publications.parliament.uk/pa/cm200910/cmselect/cmsctech/memo/climatedata/uc0102.htm
Richard
How does one average a temperature?
What is the average temp of a cup of nearly boiling hot water next to a glass of ice cubes?
Does said average say anything important about the system?
If so, what?
If not, why take it at all?
Max™ :
re your post at August 16, 2013 at 2:48 am.
As you say, ‘average global temperature’ is a meaningless metric.
But it can be compiled in any way one wants, so it can show whatever one wants to be shown.
This meaningless and undefined nature of ‘average global temperature’ makes it politically useful. I explain the usefulness as follows.
Governments need to raise taxes, but people do not want to pay taxes.
So, politicians desire a tax that people want to pay. The UK has one such tax. i.e. the National Lottery.
Failing to obtain sufficient taxes people want to pay, then politicians desire a tax that nobody would object to paying. And who could object to a tax (e.g. a Carbon Tax) intended to save the planet for our children and our children’s children?
Hence, governments pay so-called “scientists” to determine ‘average global temperature’.
I hope this is sufficient answer to your questions.
Richard
Hey Mosher, where are those 39,000 weather stations for 1880?
“Sleepalot says:
August 16, 2013 at 5:56 am”
No! It’s worse than that. It’s X number of stations that have “measured” global land AND sea “average” temps since 1880.
Well yes, it’s both: if you change the particular stations, and/or change the number of stations used you make yearly averages incomparable, and the “series” is a work of fiction.
Where’s Mosher? Did he run away?
Sleepalot says: @ August 15, 2013 at 8:49 am
Steven Mosher says: August 14, 2013 at 2:45 pm
“For example we have 39000 stations.”
No, you don’t. Show me your list of 39000 stations for 1880.
>>>>>>>>>>>>>>>>>>>>>>>
Actually it is much worse than that.
Jo Nova, May 21, 2010 The Great Dying of Thermometers
ChiefIO, Febuary 2, 2010 Zombie Thermometers – Return of The Un-Dead: In looking for what thermometers died in 2010, I discovered that there are Zombie Thermometers. They appear to be alive in some years, but sometimes are unresponsive and give no data.
On top of that the actual sample size is ONE since you are measuring a unique location at a unique time without duplication.
This means the error bars are at least +/- 0.5 to 1°C link