Temperature above 80 degrees north drops below freezing early, and continues to drop.
Many people have been watching the remarkable early drop in air temperature at the DMI plot here:
![meanT_2013[1]](http://wattsupwiththat.files.wordpress.com/2013/08/meant_20131.png?resize=600%2C400)
This drop looks to be about two weeks early. As this next analysis of sea surface temperature shows, much of the area is below freezing. Of course in seawater, ice doesn’t form until temperatures get below 28.4°F (-2°C), so it is close, but not quite there yet. [Note: due to lower salinity in the Arctic seawater freezes at -1.8C according to this essay at NOAA by Peter Wadhams]
 National Centers for Environmental Prediction (NCEP) Marine Modeling and Analysis Branch (MMAB) – Click the pic to view at source
The DMI sea ice plot looks to be slowing significantly, but has not made a turn yet.
![icecover_current_new[1]](http://wattsupwiththat.files.wordpress.com/2013/08/icecover_current_new11.png?resize=640%2C480)
The JAXA plot isn’t quite so different from previous years, but does show some slowing:

- Japan Aerospace Exploration Agency (JAXA) – International Arctic Research Center (IARC) – Click the pic to view at source

With this slowdown becoming evident, and temperature dropping early, the possibility exists that a turn in ice melt may start earlier than usual. If it does, we might see a turn begin in about two to three weeks if there’s any linkage between 80N temperature and sea ice extent. Typically, we see a turn in Arctic sea ice melt around September 15th to the 25th.
Of interest is this plot done by the blog “sunshine hours” which shows the difference between Arctic sea ice in 2012 and 2013.
He writes:
The difference is quite dramatic if you graph the anomaly % from the 30 year mean.
Until day 175 or so, the anomaly was only around -5% or so (note that the anomaly actually went positive for a few days in 2012).
While 2013 was later, both started drifting down. 2013 has stabilized at -15%. At this time last year 2012 was -30%.
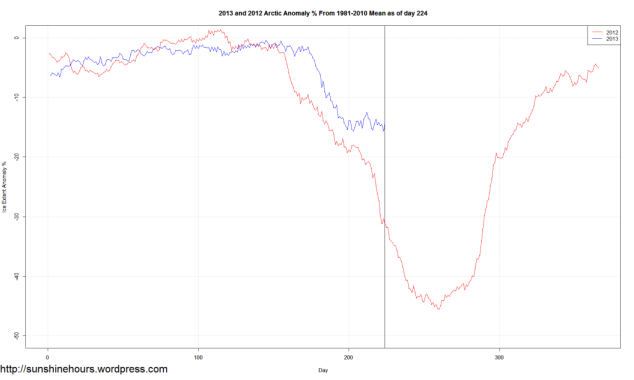
Click image to enlarge.
Check out all of the data at the WUWT Sea Ice reference page
UPDATE:
Some commenters have noticed a large drop in today’s most recent plot.
First, regarding this graph:
![icecover_current[1]](http://wattsupwiththat.files.wordpress.com/2013/08/icecover_current1.png?resize=600%2C400)
That’s the old DMI plot, which DMI says we should now use this one on this page:
http://ocean.dmi.dk/arctic/icecover.uk.php
They write:
The plot above replaces an earlier sea ice extent plot, that was based on data with the coastal zones masked out. This coastal mask implied that the previous sea ice extent estimates were underestimated. The new plot displays absolute sea ice extent estimates. The old plot can still be viewed here for a while.
And, that could be either an instrument failure or a processing failure. We’ve seen spikes like that before. It might also be real data, we won’t know until the next update.
I tend to favor loss of data, as reader “DJ” points out in comments, see this image:
![satcon.arc.d-00[1]](http://wattsupwiththat.files.wordpress.com/2013/08/satcon-arc-d-001.png?resize=578%2C675)
But yes, this post was edited last night at about 11PM PDT, and DMI updated the graph a few hours later.
The temperature scale only goes down to -1.5 and below.
Presumably it could already be below -2C?
Interesting. There was a report on the BBC recently of someone trying to swim from Cornwall to Dublin. There was some problem with the cold sea. They said the temperature along the Irish coast was 13C.
It is being called among other things ‘a dead cat bounce’ in the Guardian comments, while the paper is running with various stories saying ‘it’s a disaster!’, all predicated on last years’ data.
I’ll laugh my head off if Arctic ice rebounds this year and continues into the next, what will they say then?
RE: Paul Homewood says:
August 14, 2013 at 3:10 am
The core of the cold is just north of Greenland, and the thermometer attached to the North Pole Camera has recorded temperatures as low as minus 4.7 Celsius.
It’s been a great summer for sitting around watching ice melt, the only problem being it stopped melting right after they made all that hoopla about “Lake North Pole.” Perhaps Al Gore visited by helicopter and jinxed the melt. (They did see some large tracks made by a heavy creature up there.) http://sunriseswansong.wordpress.com/2013/08/06/north-pole-camera-one-pictures-polar-bear-tracks/
You can see a map of arctic air temperatures by going to Anthony’s Sea Ice Page, clicking on the DMI graph (also pictured at the top of this post,) and then going from that graph to the “Arctic Front Page,” (by clicking the link under the box with all the dates in it on the left hand side.)
I should add that, once on the DMI “Arctic Front Page,” you click the link “Arctic weather north of 60N” in the box to the upper right. That gives you their map of pressure and another map of 2m temps. I prefer DMI as Denmark has more at stake in arctic seas. I find it odd how other maps and graphs can differ.
We should not forget that earlier the UK Met. Office and the AGU both made a big deal about the decrease of Arctic sea ice. Both used it as a prop to claim that CAGW was real. I hope the UK Met. Office loses what little credibility it has left when, and hopefully not if, the Arctic sea ice decline stops and then reverses.
What we are likely seeing here is a gradual recovery in Arctic ice levels since the PDO went negative. Once the inertia in the system is overcome and the amount of multi year ice increases, the upward trend could be quite rapid. When the Atlantic goes cold, then things could get really interesting. Now where did I put my fur-lined walking stick?
DMI don’t seems the same if you look for today graph 😉
The DMI sea ice plot took a major “dump” today (8/14)
It was also 2 wks late in getting to the thawing mark.
I credit it entirely to my contest prediction that ice melt would continue on trend (for decreasing total ice).
Your welcome?
Gerry
Going to be a winter to remember in the NH…
One thing that seems odd and different can be seen in the DMI 14-day-loop of ice concentration. Take a look: http://ocean.dmi.dk/arctic/icedrift_anim/index.uk.php
While ice shrank away from the coasts of Alaska and Siberia, as is typical this time of year, the concentration of ice stopped decreasing towards the middle and towards Greenland (stopped turning from white to grey, in their color-code,) and instead concentration increased, (turned from grey back to white, in their color-code.) My guess is that this is partly due to the gale they had up their piling up the ice, but also due to sub-freezing temperatures and freshly fallen snow.
If you turn the animation of the above link up to top speed, you really get a sense the ice is circling around and around the pole, rather than being flushed out through Fram Strait.
@MattN (August 14, 2013 at 4:24 am)
I think you may be right.
So, my woodshed is full, I have plenty of kindling and the Land Rover has been fully serviced. Since the electricity to my village comes over fields on poles, I even have an inverter on the Land Rover to give me some mains power.
Bring it on …
Adventure Canada is scheduled to have a cruise ship make two transists of the NW Passage unaccompanied by icebreakers; the first from east to west, and then back again. They have been reporting progress on Facebook, though the last entry is August 12th. From what I can make out, they should be meeting fairly heavy ice conditions around Friday 16th August. It will be interesting to see what happens.
https://www.facebook.com/adventurecanada
The US Navy’s Arctic Cap Nowcast/Forecast System (ACNFS), often incorrectly called HYCOM (HYCOM and CICE are parts of ACNFS), data page:
http://www7320.nrlssc.navy.mil/hycomARC/arctic.html
The current (nowcast) HYCOM Sea Surface Temperature map:
http://www7320.nrlssc.navy.mil/hycomARC/navo/arcticsst/nowcast/sst2013081318_2013081400_035_arcticsst.001.gif
Looks like about 70% of the Arctic Ocean is at the lowest chart temperature, -1.8°C.
Now consider the CICE ice thickness chart:
http://www7320.nrlssc.navy.mil/hycomARC/navo/arcticictn/nowcast/ictn2013081318_2013081400_035_arcticictn.001.gif
There’s a lot of ice under 1m thick, and under 1/2m. But the SST’s are very cold.
There may still be enough heat in the water under the ice for significant melting, and the sea ice largely melts from the bottom up.
But the major threat appears to be a strong storm breaking up the ice and dispersing the chunks and slush, before it starts freezing up into stronger hunks and slabs.
Anyone seeing another extent-wrecking major storm coming soon? Mosher? R. Gates?
It is about time for the cyclical impending Ice Age scare – CAGC anyone?
short fast down tic today from the storm…..also a result of their new algorithm
exposing a little more water surface to wind and freezing temps….heat loss
making MYI
storm was too short and confined to blow much ice out….just put the hole back in the center again…and moved more ice out to the perimeter
Should start freezing over fast…making an even bigger area and extent
storms over……..
http://www7320.nrlssc.navy.mil/hycomARC/navo/arcticicespddrf_nowcast_anim30d.gif
The sea-ice and solar pages are daily habits for me, and probably secret addictions for many carbonistas.
By the way, you have to wonder when the fine organizations that produce the graphs will use 1989-2010 as the standard, instead of 1979-2000. It would really change the perspective on the Arctic.
>The DMI sea ice plot took a major “dump” today (8/14)
That always happens when the temperatures drop below freezing. A whole bunch of ice melts. But seriously, this is the 15% or greater ice, perhaps the cyclone blew some around.
For those of you wondering about that huge drop on the 13th:
The 12th: http://saf.met.no/p/ice/nh/edge/imgs/OSI_HL_SAF_201308121200_pal.jpg
The 13th: http://saf.met.no/p/ice/nh/edge/imgs/OSI_HL_SAF_201308131200_pal.jpg
Tomorrow will probably see an “amazing” recovery.
On average from this time of year, Jaxa’s algorithm loses 900,000 sq kms in sea ice until the minimum on September 12th, while the NSIDC’s methodology loses 1.1 million sq kms. There is still 30 days to go to the minimum.
Based on the historical averages, Jaxa will reach minimum at 5.25 million sq kms versus 3.49 million sq kms in last year’s record low.
http://s22.postimg.org/5tszkdibl/Jaxa_Min_Projected_Aug13_2013.png
The NSIDC’s September average (used in the ARCUS Sea Ice Outlook) will be 5.28 million versus 3.63 million last year going by the historical trends.
http://s11.postimg.org/lgrk274b7/NSIDC_Sept_Min_Proj_Aug13_2013.png
In the last several years, there has been greater-than-average melt in this last 30 day period. 2011, however, did not show this and now the Arctic temps are quite low. The buoys are recording below zero atmosphere temps and low-enough-to-stop-the-melt sea surface temps. I don’t see a reason to expect anything less than the historical climatology to prevail this year, unlike 2007 and 2012.
The ice is still below average but if you go back to 1972, it doesn’t look like that much change has ocurred.
http://s15.postimg.org/yny4x9nzf/NH_Sea_Ice_1972_2013_Aug13.png
Is there source data available for the chart of temperature above 80 North?
Much of the most recent melting will still be primarily fresh water as will the melt ponds. As such I don’t think the temperature needs to be much below freezing for that ice to reform. We won’t see any ice gains at the edges but the overall downward trend could slow down and stabilize sooner than we’ve seen in recent years. Light winds would also help this along.
Don Allen says:
August 14, 2013 at 3:53 am
The DMI sea ice plot took a major “dump” today (8/14)
Allen here comes the reason:
http://ocean.dmi.dk/arctic/icedrift_anim/index.uk.php
There is a gigantic drop in DMI ice cover this morning.
http://ocean.dmi.dk/arctic/plots/icecover/icecover_current.png
Instrument failure?
Any insight?
This DMI extent chart, seen on the last Sea Ice News, currently shows an amazing large drop, about 700,000 km²:
http://ocean.dmi.dk/arctic/plots/icecover/icecover_current.png
But this one I just found on DMI’s site isn’t anywhere near as alarming, drop is much smaller:
http://ocean.dmi.dk/arctic/plots/icecover/icecover_current_new.png
The alarming one is the old-type chart discussed and found here, which used 30% concentration. This product has been replaced, at some point they’ll stop making the old-type charts.
The new and current type of chart, discussed and found here, use 15% concentration. So DMI is now more compatible with the other 15% concentration extent records, such as IARC-JAXA. BTW, JAXA, as seen above, currently does not have a large drop on the chart dated August 13 2013. No drop at all, actually.
Looks like DMI will most likely be correcting their chart later.
From tommoriarty on August 14, 2013 at 6:03 am:
A few paragraphs worth, currently awaiting moderation.
Since “moderation” became the new spam bucket, hopefully you can read what’s up in less than an hour.
@tommoriarty and others regarding this graph:
http://ocean.dmi.dk/arctic/plots/icecover/icecover_current.png
That’s the old DMI plot, which DMI says we should now use this one on this page:
http://ocean.dmi.dk/arctic/icecover.uk.php
They write:
And, that could be either an instrument failure or a processing failure. We’ve seen spikes like that before. It might also be real data, we won’t know until the next update. I tend to favor loss of data, as DJ points out above, see this image:
http://ocean.dmi.dk/arctic/icedrift_anim/plots/satcon.arc.d-00.png
But yes, this post was edited last night at about 11PM PDT, and DMI updated the graph a few hours later.
DJ, They can’t have based their number on that image for the 13th? Isn’t it obvious there is a sensor error in that image? Nature doesn’t take perfect pie slices out of the arctic overnight.
Above 80 degrees? How about below 49 degrees? The growing season in Northern Minnesota is officially over as northern Minnesota has logged it’s first freezing temperatures of the fal, er, make that summer. At least I think it’s summer.
Actually, the surface water in the Arctic Ocean freezes at -1.7 C due to the somewhat lower salinity there.
(salinity varies in the oceans)
REPLY: Good to know, thanks. here they say -1.9C
http://eesc.columbia.edu/courses/ees/climate/lectures/o_strat.html
Anthony
What happened to the building polar sea cyclone that was being discussed here as recently as a week ago???
Means nothing , such is the wondrous ‘power ‘ of CO2 it can both make ice grow and shrink , both of which are of course ‘poof ‘ of climate doom .
Awaiting a giant party thrown by the Warmist movement. Thermogeddon avoided; Polar Bears saved; CO2 reductions not necessary. Yay!
Make a bonfire of the CO2AGW papers and stacks of Nature Climate Change issues.
Marco says:
August 14, 2013 at 5:34 am
“For those of you wondering about that huge drop on the 13th:”
Looks like a continent sized triangular spaceship has landed with the tip at the pole.
RE: John Silver says:
August 14, 2013 at 6:36 am
Arctic Ocean water is weird. When a lot of freezing is going on, the new ice is exuding salt, and the brine briefly increases the salinity of the surface water, (as it sinks through it,) and that lowers the freezing point of the surface water. However, the ice becomes mostly fresh, (with a few embedded pockets of brine,) and when that fresh-water-ice later melts it lowers the salinity of the surface water, which raises the freezing point of the surface water. Right now it is easier to freeze the surface water, (by a tenth of a degree or two tenths,) than it will be once freezing gets underway in earnest.
Watching ice melt is not as easy as it looks.
RE: wws says:
August 14, 2013 at 6:39 am
“What happened to the building polar sea cyclone that was being discussed here as recently as a week ago???”
All over and done with. Didn’t break up the ice as much as last year’s, likely because it was colder, and also swirled winds around the pole rather than across the pole.
For a while the gale stood nearly atop the pole, and thus became a storm with no north side. Alarmist media blew a big chance for a sensational headline: “Global Warming Creates Storm With 360 Degrees Of South Side!!!”
@kadaka
“Anyone seeing another extent-wrecking major storm coming soon?”
Did you miss the storm that started a week ago Tuesday and ended yesterday? That is what caused the temperature to drop north of 80 and brought the anomalously warm temperatures over the Beaufort, CAA and ESS.
http://www.wetterzentrale.de/archive/2012/avn/Rhavn00120120807.png
The latest ECMWF has another storm forming over the CAB in ten days, but that is so far away it may likely change.
http://www.meteociel.fr/modeles/ecmwf/runs/2013081400/ECH1-240.GIF?14-12
There seems to be a seasonal shift this year in southern Canada. We are currently experiencing mid-September temperatures and have been for several weeks. This reminds me of the summer of 1959 when a person needed to wear a jacket to go outside in mid-August. We survived then and we will survive now. I have been reading predictions made this year for my region in the Farmers Almanac – it seems spot on – and the Alamanac uses in large part, projections based upon solar activity.
REPLY: Good to know, thanks. here they say -1.9C
====
first you get melt…..which makes it a little less salty
“By the way, you have to wonder when the fine organizations that produce the graphs will use 1989-2010 as the standard, instead of 1979-2000. It would really change the perspective on the Arctic.”
I’ve wondered about this myself. However, since this is new instrumental data, why not provide both. Why not also calculate since-the-beginning averages that update constantly. These aren’t physical cherries, we can pick em and munch em more then once.
at this time of the season the ice is significantly melted from below, not above.
I’m going to give a theory of why this is happening. So jump on.
1) Solar UV is down, lowering the temperature in the 60-80 km range.
2) Ice crystals form in the 60-80 km range called Noctilucent Clouds.
3) The ice crystals reflect low angle Solar energy into space reducing the energy reaching the North/South Poles.
4) A positive feedback loop is created until Solar UV ramps backup.
5) This weak Solar cycle will produce less UV for the next 8 years.
6) If the next Solar cycle is also low, expect the world cooling to continue at an increased rate.
The easy way to monitor the total Solar output reaching the Earth is by using the 10.7cm Flux readings:
1) 70-100 -> cooling.
2) 100-130 -> stay the same.
3) 130-up -> warming
Remember that the energy reaching the Earth is the area under the Flux curve throughout recorded history [1600 until now]. The almost 2 years [2006-7] of zero Sun spots gave average Flux readings of 65.
MODIS Satellite images caught tantalizing peeks through the clouds today that show large areas of open water near the North Pole.
Terra: http://tinyurl.com/oe648ks
Aqua: http://tinyurl.com/ndw5u7q
Need to keep an eye on when snow starts falling in Siberia. The sooner the snow, the colder the NH winter. That’s where cold air is manufactured and exported.
On the anomaly graph, the arrival of the August 2012 storm is plainly visible, yet CACCAists have tried to deny the effect of that egregious cyclone.
Isn’t jai mitchell’s alarmism amusing? Like Chicken Little, he is running around in circles shouting, “The sky is falling!!”
But it was only an acorn.
show large areas of open water near the North Pole…..
90% is called open water?
The Warmunists just can’t seem to catch a break these days. These must be trying times indeed for even the most stalwart of True Believers. They need a miracle, perhaps another Sandy-type event. Who knows, maybe their “missing heat” deep in the ocean will suddenly decide to show itself. If they Believe hard enough, maybe it will happen. Reality is a beach.
@ dbstealey
What jai mitchell stated about bottom melt is correct, the largest percentage of melt at this time of year is bottom melt. In extreme cases the bottom melt will continue well into winter, albeit at a very slow rate. Here is an example.
http://imb.crrel.usace.army.mil/2012L.htm
Now here is a graph showing thickness
http://imb.crrel.usace.army.mil/irid_data/2012L_thick.png
If you don’t let the “smoke” get in your eyes, it’s obvious that bottom growth on that particular piece of ice did not start until February.
@Latitude
Not according to concentration maps.
http://www.iup.uni-bremen.de:8084/amsr2/arctic_AMSR2_nic.png
http://www7320.nrlssc.navy.mil/hycomARC/navo/arcticicen/nowcast/icen2013081318_2013081400_035_arcticicen.001.gif
Sept 1st the start of the great 2013/14 ice recovery? living in hope. all the storms this year are associated with ice area improvement.
whoopee…..>50% is open water
You still claimed it was large areas of “open water”…………
Master,
[I see what you did there.☺]
Anyway, the factoid may be correct, but it is just an example of reaching for something, anything, which might possibly salvage the endlessly wrong predictions of continuing Arctic ice decline, which in turn are only hopeful [but wrong] predictions of runaway global warming.
Looking at the big picture, the climate Null Hypothesis has never been falsified. What is being observed now has happened repeatedly in the past — and when CO2 levels were much lower than they are now. Nothing we are seeing is either unusual or unprecedented. Current parameters have all been exceeded in the past, and to a much greater degree.
In fact, there is solid evidence that the Arctic was entirely ice-free at times during the current Holocene. The current routine natural fluctuation in Arctic ice is nothing to get alarmed about. It is well within the parameters of natural climate variability.
@Latitude
In the fact based version of reality, 50 percent is significant, especially when compared to concentrations in past years
Winter is coming…
dbstealey says:
“I see what you did there.☺”
Don’t worry, your secret is safe, mums the word.
Master of Space and Thyme says:
August 14, 2013 at 8:30 am
“In the fact based version of reality”
…the CO2AGW theory has been falsified on every account. I take it you will defend it though until the funding runs dry. Given the insolvency of Europe that might be any day now. Thanks for helping in ruining the continent.
Paul Homewood says:
August 14, 2013 at 3:10 am
The temperature scale only goes down to -1.5 and below.
Presumably it could already be below -2C?
###
The plot is of sea surface temps. Water has a lower temperature bound below which it turns to ice, at which point it is no longer part of the sea surface water.
Between Day 120 and Day 135 it appears some sort of new mode kicked in. The whole curve shifted down a notch, at that juncture. Temps ran low in general from that point on.
Master of Space and Thyme says:
August 14, 2013 at 8:30 am
@Latitude
In the fact based version of reality, 50 percent is significant, especially when compared to concentrations in past years
===
I agree 100%…..especially when it’s wind and nothing to do with melt or temps
From Master of Space and Thyme on August 14, 2013 at 7:19 am:
Nope. How did you completely miss that I said ANOTHER, as in ANOTHER extent-wrecking major storm?
(Damn ignorant young punks, too much in a hurry to blog their gold-plated earth-shattering opinions of incalculable worth to actually READ what they’re commenting about beforehand.)
So, your domain is Space and Thyme. Are you really the Master of that?
@Latitude
This map of SST anomalies seems to indicate otherwise.
http://tinyurl.com/og33w9h
The ice certainly appears to be melting in this thickness map
http://www7320.nrlssc.navy.mil/hycomARC/navo/arcticictn/nowcast/ictn2013081318_2013081400_035_arcticictn.001.gif
why did you post a link to the anomalies…..
http://polar.ncep.noaa.gov/sst/ophi/color_sst_NPS_ophi0.png
the thickness map has not changed in weeks
Suggest you change the first sentence from “Temperature above 80 degrees north…” to “Temperature above 80 degrees north latitude…”, otherwise someone or other will run with the story that the arctic is now above 80 degrees (temperature)!
Caleb says:
August 14, 2013 at 7:06 am
“Watching ice melt is not as easy as it looks.”
Josh! Calling Josh? What a great line!
~~~~~
But we could make a bullets list
Things not as easy as they look:
– watching ice melt
– measuring air temperature
– tracking heat
–
–
– counting sun spots
– closing the Ozone hole
From Master of Space and Thyme on August 14, 2013 at 9:04 am:
Why mess around with an anomaly map which doesn’t tell you the temperatures so you can gauge the possibilities of melting and freezing, which is the implied reason for looking at a SST-type map?
I already gave the link above to the US Navy map with actual temperatures, not anomalies:
http://www7320.nrlssc.navy.mil/hycomARC/navo/arcticsst/nowcast/sst2013081318_2013081400_035_arcticsst.001.gif
You sourced your very next link, the thickness map, from that same US Navy source for the SST map.
So why not just use the US Navy SST map?
Because it shows about 70% of the Arctic Ocean is at the lowest chart temperature, -1.8°C.
Your next self-designation, Master of “Hide the Decline”.
I saw a video recently (cannot recall where) of snow falling onto sea water just below 0C.
The snow didn’t melt, despite the salt water not being frozen – it just sat there, and accumulated.
Perhaps this mechanism is partly responsible to the ice growth.
Latitude says:
“the thickness map has not changed in weeks”
Reality disagrees with your assertion.
August 1st
http://www7320.nrlssc.navy.mil/hycomARC/navo/arcticictn/nowcast/ictn2013080118_2013080100_035_arcticictn.001.gif
August 13th
http://www7320.nrlssc.navy.mil/hycomARC/navo/arcticictn/nowcast/ictn2013081318_2013081400_035_arcticictn.001.gif
I am not sure I understand your problem with the temperature anomaly map.
John Silver says:
August 14, 2013 at 6:36 am
Actually, the surface water in the Arctic Ocean freezes at -1.7 C due to the somewhat lower salinity there.
(salinity varies in the oceans)
###
Catostomus catostomus, the Longnose Sucker, is found in many rivers of North America AND in the Arctic Ocean. Pretty amazing considering that the entire order that this species belongs to, Cypriniformes, is decidedly fresh water.
I am not sure I understand your problem with the temperature anomaly map.
===
anomalies don’t freeze water
=====
Reality disagrees with your assertion.
======
really hard to get a drum beat going when no one really cares….isn’t it?
This year humbled a lot of self-proclaimed ice experts. I don’t think many saw this slow of a season coming right on the heels of 2012 when the ice was in the worst shape it has been in since we had accurate records.
The following is from Dr Wadham’s essay on the freezing of water:
“Cooling the water down
Consider a fresh water body being cooled from above, for instance a lake at the end of summer experiencing subzero air temperatures. As the water cools the density increases so the surface water sinks, to be replaced by warmer water from below, which is in its turn cooled. This creates a pattern of convection through which the whole water body gradually cools. When the temperature reaches 4°C, the lake reaches its maximum density. Further cooling results in the colder water becoming less dense and staying at the surface. This thin cold layer can then be rapidly cooled down to the freezing point, and ice can form on the surface even though the temperature of the underlying water may still be close to 4°C. Thus a lake can experience ice formation while considerable heat still remains in the deeper parts.
This does not apply to sea water. The addition of salt to the water lowers the temperature of maximum density, and once the salinity exceeds 24.7 parts per thousand (most Arctic surface water is 30-35), the temperature of maximum density disappears. Cooling of the ocean surface by a cold atmosphere will therefore always make the surface water more dense and will continue to cause convection right down to the freezing point – which itself is depressed by the addition of salt to about -1.8°C for typical sea water. It may seem, then, that the whole water column in an ocean has to be cooled to the freezing point before freezing can begin at the surface, but in fact the Arctic Ocean is composed of layers of water with different properties, and at the base of the surface layer there is a big jump in density (known as a pycnocline), so convection only involves the surface layer down to that level (about 100-150 metres). Even so, it takes some time to cool a heated summer water mass down to the freezing point, and so new sea ice forms on a sea surface later in the autumn than does lake ice in similar climatic conditions.”
The reason that I posted this paragraph is there is a point that Dr Wadham did not make that I feel is significant. Going back to high school chemistry there is an experiment where you have a thermometer in a beaker of water and add salt. The temperature of the solution goes down as seen on the thermometer. When salt, sodium chloride, is dissolved the process is know as hydration and energy is required to make the new bonds. The hydration energy for one mole of sodium chloride is 4 kilojoules. This is not a lot of energy, but it is significant. For salt water to freeze, this energy must be removed to break the bonds between the water molecules and the sodium and chlorine ions. The temperature must be lowered sufficiently to remove all this energy. The ions and their water molecules play a game of musical chairs, moving from one ion to another until all the energy is removed. When all the energy is removed the water can freeze. In salt water the process of removal of the hydration energy starts at 4C and is completed at the freezing temperature. This transition zone is the reason that much of the ocean is at 3-4C. As water temperatures are lowered, additional energy removal is required to pass through the transition zone.
The thing is that the ice is in such a terrible state after the 2012 ice loss and even though the air temperatures have shifted in the arctic (increasing cloud cover due to the abnormally high number of storms) that the temperatures are lower than ever recorded at the COI http://ocean.dmi.dk/arctic/meant80n.uk.php (I mean, you will not find a curve of historic temperature trends even close to what we are seeing this year)
does that mean that the world is no longer warming? no, it means that the world is changing, air currents are shifting, the jet stream is weakening, more moisture is moving from the mid latitudes into the arctic, the Hadley cell is collapsing into the Ferrell cell and the polar cell is soon to follow. (meaning that storms are moving farther northward and tropical moisture is also moving farther northward as well as desert in the southwest).
This isn’t an end to the warming cycle, it isn’t a “recovery” in sea ice.
after this intensely cold season in the arctic with unprecedented cloud cover, it is still very likely that we will exceed the ice lost in 2007, though beating the 2012 record is now becoming more and more unlikely.
ice melting from below in the late season is simply what happens in the arctic, there is no opinion about it.
What you will all have to reconcile someday is the following:
Why is the ice going away when the warming has stopped?
remember, the warming has stopped since 1998?
then why has the ice gone away???
http://igloo.atmos.uiuc.edu/cgi-bin/test/print.sh?fm=09&fd=12&fy=1998&sm=09&sd=12&sy=2012
JM, the reason the ice has melted is because the oceans were bringing in warmer water than had happened previously. The PDO had some effect and the AMO the most effect given the open path to the Arctic. The PDO has switched and the AMO will slowly start to fall from it’s likely peak last year. It’s called natural variation.
If GHGs were the cause we should have seen a similar decrease in Antarctica. Instead, we’ve seen a constant increase which just happens to correlate with a cold Southern Ocean.
The bouys are not really showing a decline in ice thickness this year. So the musings about bottom melt etc are just that.
http://imb.crrel.usace.army.mil/newdata.htm
http://www.whoi.edu/page.do?pid=20781
Swiss Bob says: @ August 14, 2013 at 3:23 am
I’ll laugh my head off if Arctic ice rebounds this year and continues into the next, what will they say then?
>>>>>>>>>>>>>>>>>>>>>
It’s Climate CHANGE, its caused by CO2 pollution AND IT IS ALL YOUR FAULT!
Why do you think they changed names a while a go?
NCEP shows a large plunge in extent today. (8/14)
According to the NPEO website, temperatures (at least around the locations of the floating webcams are alreadt -3deg F and dropping
http://psc.apl.washington.edu/northpole/index.html
With the Antarctic sea ice quickly approaching historic highs and the early drop at the Arctic spawning a potentially early refreeze, I wonder how the CAGW croud will try to spin this turn of events in light of still increasing CO2 (DOH, It’s weather not climate (cold = weather & Hot = Climate) what was I thinking)
Richard M, why do you think the AMO peaked last year? Seems to me it could have another 5-10 years before peaking. And is there any evidence linking AMO to sea ice?
Jim Cripwell says:
August 14, 2013 at 4:42 am
Adventure Canada is scheduled to have a cruise ship make two transists of the NW Passage unaccompanied by icebreakers… the last entry is August 12th. From what I can make out, they should be meeting fairly heavy ice conditions around Friday 16th August…..
>>>>>>>>>>>>>>>>>>>>>
If they are lucky they will meet up with one of the monster Russian Ice breakers and get bailed out of their stupidity.
@jai
This year isn’t going to come close to 2007. We’ll be lucky to finish lower than 2010.
OSISAF reported a Satellite outage.
On 2013-05-22
GOES-East Outage
http://www.osi-saf.org/news/voir_evt.php?eid=81&safosi_session_id=4d0bce43161ae70e1bfe3c7c5e86afdb
“Due to an anomaly which occurred approx. 0340TU on GOES-13 22/05/2013, GOES-East data are unavailable.
GOES SST, DLI and SSI are impacted.
We have been informed by NOAA today (2013-05-25) that GOES-13 will remain in storage mode while the anomaly is being investigated.
NOAA have given no estimate on return to operations at this time.”
Is this the same type of anomaly that happened around that time with the DMI plot?
” Of course in seawater, ice doesn’t form until temperatures get below 28.4°F (-2°C), so it is close, but not quite there yet. ”
Melt ponds freeze a zero. One of the problems for satellites is telling the difference between melt ponds and open sea.
Melt ponds are also “thought” to be a positive feedback to enhance melting, though I think this is model speculation rather than science.
We can see a circa 14d cycle clearly established in the plot it will probably be flat for another week at current levels before temps get serious about dropping.
Looking at the last 12 years with a short filter to remove “weather” and these short term variations, 2013 is looking a lot like 2008/2009 :
http://climategrog.wordpress.com/?attachment_id=439
See the link at the bottom of that page for an interactive version where you can click each year on and off to pick you own best match.
In a previous post I referred to the freezing point of sea water being -1.96°C which is the FP in Antarctic waters that I am familiar with. As mentioned above the salinity is lower in the Arctic and consequently the FP will be higher. However, there seems to be some misunderstanding as to how freezing of sea water occurs. Firstly the sea surface temperature must be virtually at freezing for the atmosphere above it to have any effect and once a thin skin of ice has formed the atmospheric temperature has very little effect other than to prevent surface melting. Freezing thereafter (and ice accumulation) occurs from below due to radiation of heat through the ice. Snow falling on new ice reduces this radiation and slows ice formation as does rough weather that smashes the ice up. While the atmospheric temperature is interesting, it is the sea surface temperature just below the ice that is critical to further ice formation.
Irrelevant to the Arctic but perhaps of interest.
In Antarctica, preparations for the ice runway start immediately the sea ice is thick enough to support vehicles. The aim is to keep the ice as transparent as possible to aid the heat loss from the ocean below, so any new snow is immediately brushed away. Their rules state that no more than 25 mm of snow cover is allowed on the runway. Given the length of the runway (3 km by 67m) that is no mean feat. The process continues throughout the winter to get the ice a thick as possible before the flights south. They have this down to a fine art and can now land the Lockhead C5 Galaxy on the ice runway at McMurdo. Ice is about 2.2m thick at that stage.
Brian says:
Richard M, why do you think the AMO peaked last year? Seems to me it could have another 5-10 years before peaking. And is there any evidence linking AMO to sea ice?
===
Judge for yourself:
http://climategrog.wordpress.com/?attachment_id=123
AMO (sea surface temperature) would more logically be linked to rate of change of ice area: warmer water melts ice _faster_ .
What I’ve plotted there is non-detrended AMO ie actual N. Atl SST.
Bill Illis says:
“The bouys are not really showing a decline in ice thickness this year.”
Facts say otherwise….
L: 5 feet of melt
H: 2 feet of melt
C: 2 feet of melt and started moving down the Narses which could lead to complete melt.
M: 3 feet of melt
B: 3 feet of melt and it is on its way to a total melt once it passes trough the Fram Strait.
J; unknown, the bottom thermistors have not worked since June.
E: unknown, the bottom thermistor have not worked since June and soon to pass through Fram and complete melt out.
If anyone is interested in seeing how bad the ice is at the H buoy is, check out the movie from the webcam. The cam was removed last week after the ice collapsed. The significant melt starts at about 6 minutes in to the video.
http://obuoy.datatransport.org/monitor#buoy8/movie
R,E. John: “In salt water the process of removal of the hydration energy starts at 4C and is completed at the freezing temperature. This transition zone is the reason that much of the ocean is at 3-4C. As water temperatures are lowered, additional energy removal is required to pass through the transition zone.”
Good explanation.
This exchange of latent heat plus that of the phase change in the water itself accounts for the flat top in the headline graph in this post.
Just for a real example, here is the temperature and salinity profile of ice-tethered buoy ITP41 which has survived since 2010 in the western Beaufort Sea. It looks like it has now reached the melt-out point but for whatever reason, the ice it was on has (almost) made it through 3 seasons now.
The surface salinity falls from 29 psu or mg/L throughout the year (lower than the global ocean average) to close to 25 at the height of the melt season and the temp rises to about -1.6C (which wasn’t enough to melt-out the ice). It has warmed now to 0.0C with salinity at 25 so the ice is probably gone.
http://www.whoi.edu/page.do?pid=49795
If temperature will continue to fall I will be very worried what will happen to polar bears.
jai mitchell says: Why is the ice going away when the warming has stopped?
remember, the warming has stopped since 1998?
then why has the ice gone away???
Take deep breath, exhale slowly and try to calm down.
Now, let me try to explain. The WARMING stopped around 1998, that leaves us WARM. Warm water melts ice, geddit? That is why there was a dramatic decline in ice coverage from 1997-2007 as seen by looking at the rate of change plot:
http://climategrog.wordpress.com/?attachment_id=123
Also ‘warming stopped in 1998’ is a global average not arctic or N. Atl SST. As the graph also shows SST continued to rise until around 2005. That almost perfectly matches when then the “catastrophically” increasing rate of change of ice coverage started to back off.
What is interesting is that the water is still WARM but the rate of melting has reduced. That either means something else is driving the melting / lack of melting or that there is a negative feedback in operation.
Rather than all the talk of “tipping points” the observational evidence would suggest open seas in the Arctic act as a NEGATIVE feedback , not a positive one.
The much talked about “albedo” works both ways. Water has a huge emissivity in the IR and emits IR to space 12 months per year. Snow and ice emit little. That is one way in which open water acts as a neg. feedback. Then there is evaporation.
The evidence is that these effects are winning and stabilise ice coverage. UNLESS there is another driver that has not been considered yet.
how bad the ice is at the H buoy is…
says ~60% where the bouy drifted to… ~70% south of it…..and >80% to the north
http://www7320.nrlssc.navy.mil/hycomARC/navo/arcticicennowcast.gif
salvatore del prete says:
July 13, 2013 at 12:35 PM
I think the start of the temperature decline will commence within six months of the end of solar cycle 24 maximum and should last for at least 30+ years.
My question is how does the decline take shape, is it slow and gradual or in jagged movements as thresholds are met. I think some jagged movements then a leveling off then another jerk etc etc. Will thresholds be met?
I KNOW THEY ARE OUT THERE.
I think the maximum of solar cycle 24 ends within 6 months, and once the sun winds down from this maximum it is going to be extremely quiet.
Solar flux sub 72, although sub 90 is probably low enough.
Solar Wind sub 350 km/sec.
AP INDEX 5.0 or lower 98+ % of the time.
Solar Irradiance off .2% or greater.
UV light off upwards of 50% in the extreme short wavelengths.
This condition was largely acheived in years 2008-2010 but the number of sub- solar years of activity proceeding these readings back then was only 3 or 4 years, this time it will be over 8+ years of sub- solar activity, and no weak solar maximum will be forthcoming.
Lag times come into play mostly due to the oceans.
It is clear that the greenhouse effect ,how effective it is ,is a result of energy coming into and leaving the earth climatic system. The warmer the oceans the more effective the greenhouse effect and vice versa.
With oceans cooling in response to a decrease in solar visible light the amounts of co2/water vapor will be on the decrease thus making the greenhouse effect less effective going forward. At the same time the albedo of earth will be on the increase due to more low clouds,ice and snow cover.
ROUTE CAUSE OF THE CLIMATE TO CHANGE
Very weak solar magnetic fields, and a declining weak unstable geomagnetic field, and all the secondary feedbacks associated with this condition.
SOME SECONDARY EFFECTS WITH WEAK MAGNETIC FIELDS
weaker solar irradiance
weaker solar wind
increase in cosmic rays
increase in volcanic activity
decrease in ocean heat content
a more meridional atmospheric circulation
more La Ninas ,less El Ninos
cold Pdo /Amo
I say the start of a significant cooling period is on our doorstep, it is months away. Once solar cycle 24 maximum ends it starts.
This has happened 18 times in the past 7500 years(little ice ages and or cooling periods ) ,number 19 is going to take place now.
Two of the most recent ones are the Maunder Minimum(1645-1700) and the Dalton Minimum(1790-1830).
I say this one 2014- 2050??
Reply
dr. lurtz I think we our thinking alike.
We’ve had record snow-layer this winter here in Slovenia. Should I be worried? I really hoped that Al Gore was right. He promised us winters without snow in 2013. Why then I destroyed two shovels cleaning snow round my house. Oh. Never trust a socialist 🙁
@Latitude
Did you watch the video?
..did you see where the H bouy was?
@Latitude
Are you implying that the video is not real?
when did you stop beating your dog…..
Greg Goodman
you said, “What is interesting is that the water is still WARM but the rate of melting has reduced.”
and I say, well, you can make up stuff but (as master says,) your assertions do not fit with reality.
As is clear from the above exchanges, MoSaT’s “facts” are selective revelations. Hey MoSaT, the local ice melted off in Mid-March. All objects on top of the ice ended up in the bottom of the lake. Someone may have videoed it. I don’t care, since it was near the latest melt-off in the last 18 years. If the “H bouy” has drifted far enough south, I’m surprised it didn’t melt out sooner.
I.e. facts are facts only with full disclosure…
Do a keyword search for “piomass” and you will see that they are not credible.
@Latitude
The Beaufort Sea has lost over 100,000 square kilometers of ice area in the past week.
http://arctic.atmos.uiuc.edu/cryosphere/IMAGES/recent365.anom.region.11.html
Swiss Bob says: @ August 14, 2013 at 3:23 am
“I’ll laugh my head off if Arctic ice rebounds this year and continues into the next, what will they say then?”
The 30 year trend is still down.
Master of Space and Thyme says:
August 14, 2013 at 12:21 pm
Why are you surprised that the ice is melting? We are still 4-5 WEEKS away from the AVERAGE minimum sea Ice area data! The ice SHOULD BE melting now, and continuing to melt between now and late September. Losing 18 inches, 2 feet, 1 meter, or 48 inches or 5 feet of ice from an average depth of 2 meters of ice is EXPECTED – depending on latitude, as Latitude corectly pointed out, but which you ignored. ALL of the Arctic ice between today’s limits and 85 north SHOULD be expected to melt EVERY year.
Oh, by the way, the more Arctic sea ice that melts from now until later September, the cooler the planet gets.
The more that the Antarctic sea ice expands between now and its new record-setting maximum in late September, the more the planet cools You are ignoring, in your enthusiasm to save your CAGW belief system, the several very different heat transfer physics relationships that are is going on in the Arctic and in the Antarctic.
jai mitchell says:
Greg Goodman
you said, “What is interesting is that the water is still WARM but the rate of melting has reduced.”
and I say, well, you can make up stuff but (as master says,) your assertions do not fit with reality.
LOL, I present you with real data, and you reply with a model. What I show with real observational data you call “assertions” and what you show with model output is “reality”.
Sums up CAGW in a nutshell.
A comment was raised above about melt water pond albedo and the resulting melt rate: The freshwater/saltwater ratio in each melt pond plays a role, as pointed out already. But, rember, MOST of the melt-water-pond measurements are (quite properly!) taken during the summer melting season. (Obviously!) And, in almost every summer when the sea ice melt water ponds occur, the air temperature is not only above -2.0 C, but actually well above even the DMI’s 3-5 degrees C. (Many ponds are further south of the DMI’s 80 degree north latitude display band.) Thus, the fresh water that IS in those ponds, generally won’t fre under any condition. Drain away? Sometimes. Ger covered by new snow? Sometimes. Not too often. Refreeze? Again, sometimes.
But, in today’s actual conditions of “weather” at -3 degrees, the probability of re-freezing is much, much higher than normal, so many of the old estimates for albedo and heat transfer are simply irrelevant. Even if you assume that those estimates and assumptions are correct for “normal year” of +3-5 degrees C, today? They are worse than irrelevant: They are dead wrong.
Curry has measured the “clean” the “new” and the “snow-covered” Arctic sea ice several times: This “clean ice” albedo of October through late May albedo is significantly higher than the AVERAGE mid-summer (June-July-August-mid-September) sea ice albedo. Her measured values, as I recall, are 0.85 for new sea ice (or clean, pre-melt season sea ice); and right at 0.65 to 0.73 for melt season sea ice. Other measurements are a little bit lower: some have found sea ice albedos a slow as 0.54
mods, why did that last post hit moderation?
Your comment is awaiting moderation.
August 14, 2013 at 12:51 pm
Are we supposed to use lower case letters for acronyms now ? Please say what trip-wire I’ve triggered and I’ll attempt to avoid breaking the “rules” in the future.
[Reply: Sometimes we don’t know the reason a comment ends up in spam. WordPress has their own rules. Anyway, your comment is posted now. — mod.]
@dbstealey
It appears you haven’t heard about this paper which validated PIOMAS. In fact when compared to CryoSat-2, PIOMAS actually underestimates summer and fall ice volume.
CryoSat-2 estimates of Arctic sea ice thickness and volume (Laxon et al., GRL, doi:10.1002/grl.50193)
. Results from the Pan-Arctic Ice-Ocean Modelling and Assimilation system (PIOMAS) suggest that the decline in extent has been accompanied by a decline in volume, but this has not been confirmed by data. Using new data from the European Space Agency CryoSat-2 (CS-2) mission, validated with in situ data, we generate estimates of ice volume for the winters of 2010/11 and 2011/12. We compare these data with current estimates from PIOMAS and earlier (2003–8) estimates from the National Aeronautics and Space Administration ICESat mission. Between the ICESat and CryoSat-2 periods, the autumn volume declined by 4291 km3 and the winter volume by 1479 km3. This exceeds the decline in ice volume in the central Arctic from the PIOMAS model of 2644 km3 in the autumn, but is less than the 2091 km3 in winter, between the two time periods.
http://onlinelibrary.wiley.com/doi/10.1002/grl.50193/abstract
The Beaufort Sea has lost over 100,000 square kilometers of ice area in the past week.
====
Well then there you go….that’s 1/10th the size of Egypt
..did you not notice which way the wind was blowing
and the sea of Okhotsk is slightly above normal
Tom says:
August 14, 2013 at 12:39 pm responding to
Swiss Bob says: @ August 14, 2013 at 3:23 am
“I’ll laugh my head off if Arctic ice rebounds this year and continues into the next, what will they say then?”
And, what will happen if another 2,000,000 sq km’s of Arctic sea [ice] area go away in mid-September?
On the other hand, what will happen if another EXTRA 1,000,000 sq km’s of Antarctic Sea Ice remain after ITS melt season this March? As what happened last March?
RACookPE1978 says:
August 14, 2013 at 12:40 pm
“ALL of the Arctic ice between today’s limits and 85 north SHOULD be expected to melt EVERY year.”
Please explain this ridiculous statement.
Meanwhile, Antarctic sea ice is going to set a satellite era record extent. Beating last year’s record extent.
I expect the usual silence from climatologists, the complicit media, etc on this inconvenient truth.
Look at your globe please.
The average Arctic minimum sea ice area is 2,000,000 sq km.
That is an area corresponding to the area between 85 north latitude and the Pole.
If you demand we use 3,000,000 sq km as the “required” Arctic sea ice minimum for some reason, then the area is a spherical “cap” between 83 north latitude and the pole. But you’d have to justify why you think 3,000,00 km sq is “required” as a correct minimum sea ice area. (Sea ice extents are larger at 3.5 to 4.0 million km sq.)
Philip I echo your sediments.
[Was that a quick and dirty answer? Or your bottom line feelings based on sonar results? 8<) Mod]
RACookPE1978 says:
A comment was raised above about melt water pond albedo and the resulting melt rate:
Actually my comment was about sea water albedo vs ice albedo. But similar arguments apply to melt ponds but are much less in area.
Thanks for the extra detail.
@Latitude
“the sea of Okhotsk is slightly above normal”
http://arctic.atmos.uiuc.edu/cryosphere/IMAGES/recent365.anom.region.14.html
If above normal means the Sea of Okhotsk has completely melted out, then you are correct.
I think you are just here just to argue and you’re not the least bit interested in facts or science.
..you do know that’s normal…..right?
Next you’ll be claiming that since I use a handle and not my real name…………
@MoST
Have you entered a minimum arctic sea ice extent prediction in the survey? Tell us what it is. Then we can see who is right and who is dead. (Obligatory Princess Bride reference)
@Latitude
You’re wasting your talent here, you should be singing in the illiterati choir at Steven Goddard’s science fiction blog.
why?…did you get banned again
Why would anyone go to Steve Goddard’s blog?
I spend most of my online times at blogs where there is a reasonable chance that I will learn something new. I made a exception and came here last week because the situation regarding the cyclone in the Arctic was being misrepresented and I wanted to set the record straight.
I’ve never even heard of Steve Goddard……….I have no idea what you’re talking about
Ahhh, I can just hear Connie Francis singing “Where the buoys are”…..
Master of Space and Thyme says:
@dbstealey
It appears you haven’t heard about this paper which validated PIOMAS.
The paper says “estimates” not “validates” , put your glasses on and try reading again.
Results for PIOMAS suggest…. we generate estimates ….compare these data with current estimates from PIOMAS and earlier (2003–8) estimates …..
Nowhere do they claim to have “validated” PIOMAS output so you are just making that up yourself.
Last CyroSat-2 graph that I saw had just 14 points over two years for total volume that was not even enough to establish the annual variation. The “estimates” from the earlier period were even more uncertain and were just ballpark guesses.
We are years away from even being able to test how close PIOMAS is to reality, since we cannot measure that particular “reality”. It’s output is not validated and does not represent “reality”.
Total ice volume will be interesting as a polar calorimeter but what matters much more for all the feedbacks and interactions with the rest of climate is what we can reasonably measure now. Area and extent.
That is what I used in my graph.
http://climategrog.wordpress.com/wp-admin/post.php?post=123&action=edit&message=1
RACookPE1978 says:
August 14, 2013 at 1:00 pm
“The average Arctic minimum sea ice area is 2,000,000 sq km.
That is an area corresponding to the area between 85 north latitude and the Pole.”
Average for what, one day last summer? The satellite era average is 6,000,000 sq km. Your previous statement “ALL of the Arctic ice between today’s limits and 85 north SHOULD be expected to melt EVERY year” refers to extent anyway, and the average minimum extent is closer to 7,000,000 sq km. Either way, not once has the arctic ocean been close ice free everywhere outside of 85 north latitude.
Philip Bradley says:
August 14, 2013 at 12:58 pm
I expect the usual silence from climatologists, the complicit media, etc on this inconvenient truth.
————————————————————————————————————————
Give them some time to create their most reasonable story. I can picture them rereading Orwell,s ‘1984’ to get in the proper mood.
@Jim Stevens
There seems to be a seasonal shift this year in southern Canada. We are currently experiencing mid-September temperatures and have been for several weeks. This reminds me of the summer of 1959 when a person needed to wear a jacket to go outside in mid-August. We survived then and we will survive now. I have been reading predictions made this year for my region in the Farmers Almanac – it seems spot on – and the Alamanac uses in large part, projections based upon solar activity.
+++++++++++++
I was wondering which Almanac you are getting because a couple of years ago the regular Farmer’s Almanac switched from their long term method to ‘computer modeling’ and introduced as their main forecaster a guy who strongly supported the idea that CO2 was the driving factor in temperature and GCM’s based on that idea. The predictions that year were useless. I stopped buying the book and haven’t picked up one since assuming they were a lost cause.
The old formula is secret of course but does include the position of Jupiter (barycenteric things) and solar data and something else they would not reveal. They are (or were) able to predict major snowstorms 11 months in advance including ‘snowmaggedon’ and its sequel. Pretty impressive. Is their capacity back?
M of S&T,
You couldn’t possibly have read the keyword search I provided for Piomass, between the time I posted it, and when you started arguing about it.
That means your mind is made up, and any new information is unwanted.
FYI, the Piomass charts are naked alarmism, specifically designed to instill fear in people who don’t know any better. Read the info I helpfully provided, and you will see.
But most of us here do know better, and we know that all the arm-waving over the current natural Arctic ice fluctuation is the result of the very last failed prediction of the alarmist cult. All the other alarmist predictions have been debunked, and the Arctic ice scare is now swirling down the bowl.
@Greg Goodman
You almost but not quite completely got it wrong.
“Using NEW DATA from the European Space Agency CryoSat-2 (CS-2) mission, validated with IN SITU DATA, we generate estimates of ice volume”
They used actual data from satellites and data from sensors to generate their estimates. They didn’t use models like PIOMAS. Since their summer and fall estimates were slightly higher than PIOMAS, you can no longer claim that PIOMAS is over estimating ice volume.
RACookPE1978 says:
“The average Arctic minimum sea ice area is 2,000,000 sq km.
If you filter out wiggles of weather and the pseudo periodic oscillations of about 14d that can push the minimum either up or down dependant on their timing relative to the equinox there’s been nothing like 2M sq km in any year.
http://climategrog.wordpress.com/?attachment_id=439
http://piments.com/svg/arctic_ice_annual_smoothed.svg
Cherry-picking one day out of 365 and trying to make a media story is par for the course in MSM, it has nothing to do with science though.
The SVG is interactive by clicking on the year numbers in the legend. You’ll find that 2013 looks like it’s going to be close to 2008 or 2009, so far. The years I picked out for the png format graph.
@dbstealey
I am card carrying member of JREF, and like all true skeptics, I assumed that you were using that keyword as a smokescreen. I did the search and lo and behold, the top results were for here and Goddard’s fake science blog.
Regardless, as someone who has been studying ice dynamics for years, I was already familiar with the paper validating PIOMAS.
Nice try, I will give you an E for effort. It is a lot tougher to fool a true skeptic than it is to fool the average reader at WUWT.
dbstealey says:
August 14, 2013 at 1:45 pm
“That means your mind is made up, and any new information is unwanted.”
Ha! I guess that means you have read just as many articles that are supportive of PIOMAS with an open mind? Confirmation bias goes both ways.
Master of Space and Thyme:
re your comment at August 14, 2013 at 1:55 pm.
You omitted the /sarc when you implied you are a “true skeptic”.
I enjoyed the joke but your omission may have caused some others to miss it.
Richard
Master of Space and Thyme says: “Since their summer and fall estimates were slightly higher than PIOMAS, you can no longer claim that PIOMAS is over estimating ice volume.”
Which of course I never did claim. Nice straw man attempt.
You almost distracted me enough that I forgot the main point of my comment that you failed to reply to: Nowhere do they claim to have “validated” PIOMAS output so you are just making that up yourself.
Nice try, Waster of Space and Thyme,
@Greg Goodman
How did the paper not validate PIOMAS?
It confirmed that their model was a very close approximation of the volume that was achieved by using actual data.
Master of Space and Thyme says:
August 14, 2013 at 2:32 pm
It confirmed that their model was a very close approximation of the volume that was achieved by using actual data.
If I correctly remember they had to re-adjust relative recently their model as the real data was diverging from the model “The long term trend is reduced to about -2.8 103 km3/decade from -3.6 km3 103/decade in the last version”
That was a significant correction of about 33% of the actual modelled trend.
As the model still exagerates, the trend that shows straight down, will be really funny to watch how they continue to adjust and correct.
They have now one of the classical options: start changing the past to make it fitting to the current situation or admid the model is wrong and correct.
@Larry Plume
I googled the quote and it comes back to a comment you made here earlier this year.
Do you have a reputable source for what you claim?
Here’s the Cryosat-2 results.
I could not find a still and don’t intend to spend all night looking but the graph is shown in the video.
http://www.katgiles.co.uk/blog/2013/02/ice-volume-from-cryosat-2-seymours-paper/
As I recalled 14 dots over two years. but not even enough to define the min and max of any year.
If the best CS2 can do in seven dots spanning six months per year we can’t even see the min and max. Envisat did not measure thickness so estimations on that end are ever cruder.
Nothing can be validated until we have enough data to tell whether it’s correct. And we’re a long way off yet.
Greg Goodman says:
“Waster of Space and Thyme…”
Ouch!
…But deserved, for someone who arbitrarily refers to the writer at another site as a “fake science blog”. Ad hominems like that are the lifeblood of the alarmist religion. They take the place of facts and evidence.
Who designated you as the arbiter of what is real, or fake? And it cuts both ways, doesn’t it? You preposterously label yourself a skeptic — yet you reject out of hand whatever doesn’t fit your belief system. As I commented above, you could not possibly have read the keyword search I provided for Piomass, between the time I posted it and when you started arguing about it. That’s because your mind is already made up. Note that a real scientific skeptic’s mind is never completely made up. We are always open to new facts and information.
It is obvious that Piomass goes out of its way to create alarming-looking charts and graphs. I’ve linked to ample evidence of that fact. It is also a fact that there is no scientific evidence showing that the Arctic is going through anything except entirely natural variability. Arctic ice decline has happened before, repeatedly, and to a much greater degree — and during times when CO2 was much lower.
The consternation on the alarmist side comes from the fact that none of their many doom & gloom forecasts and predictions have come to pass. Not one of them. Eventually, they all get debunked.
Feel free to continue arguing with everyone, but unless/until you can post testable, verifiable empirical evidence showing that human emissions are the cause of rising global temperatures, all you are doing is hand-waving. But that’s not good enough here at the internet’s “Best Science & Technology” site. And as we have seen, there are no such facts and evidence available. Alarmism is all opinion-based conjecture.
Carry on with your assertions…
@Larry Plume
Those dots appear to be during the winter and confirm what Laxon et al found in their paper, PIOMAS overestimates winter volume. But for some unknown reason the video doesn’t compare CroSat and PIOMAS during melt season, where Laxon et all found PIOMAS slightly underestimating volume.
There you go again. Click here and read quotes from climate scientists who say there is a temperature standstill, hiatus if you like.
Master of Space and Thyme says:
August 14, 2013 at 3:21 pm
Do you have a reputable source for what you claim?
I was looking here:
http://psc.apl.washington.edu/wordpress/research/projects/arctic-sea-ice-volume-anomaly/
“This time series of ice volume is generated with an updated version of PIOMAS (June-15,2011). This updated version improves on prior versions by assimilating sea surface temperatures (SST) for ice-free areas and by using a different parameterization for the strength of the ice. Comparisons of PIOMAS estimates with ice thickness observations show reduced errors over the prior version. The long term trend is reduced to about -2.8 103 km3/decade from -3.6 km3 103/decade in the last version.”
Most of the inter-annual variation in arctic ice area can be modelled by the internal 2 year oscillation being modulated by a 12.8 year forcing extracted by spectral analysis.
http://climategrog.wordpress.com/?attachment_id=216
It matches almost perfectly the “catastrophic” melting of 2007 as well as the reduced variability of the 1997-2007 melting period.
The match from 1990 – 2000 is particularly good.
There are longer periods too , notably 5.42 years. None of this is captured by PIOMAS.
You got soot in your eyes. That’s a tip. Last year it was a terrible storm. By the way the ice was going away in the 1920s and 1930s, it came back though and it will come back again despite the terrible soot. Just be patient.
You may have missed this study reported from yesterday.
http://wattsupwiththat.com/2013/08/13/in-the-arctic-nearby-soot-may-be-a-larger-forcing-than-co2/
You may have missed this study published 2003 by Dr. James Hansen then of NASA.
http://www.pnas.org/content/101/2/423.short
@dbstealey
[OK, enough. ~mod.]
Where have I ever made a single claim regarding global warming? Get your facts straight, everything I have ever posted on this blog has been in regards to weather and current ice conditions…..things that are factual.
Isn’t Goddard the blogger who claimed it snowed dry ice at the South Pole? I seem to remember individuals on real science blogs laughing about that and the claim that Venus wasn’t hot because of greenhouse gases, but rather because of atmospheric pressure. I was under the impression that those and a few other weird posts are why he’s no longer is a contributor at this blog.
Master of Space and Thyme
I have been looking for reasons as to the cause of this event which began in the Arctic in the 1920s and lasted for 2 decades. Do you have any ideas? Thanks in advance.
@Larry Plume
Uncertainty in Modeled Arctic Sea Ice Volume
Axel Schweiger, Ron Lindsay, Jinlun Zhang, Mike Steele, Harry Stern,and Ron Kwok
“PIOMAS ice thickness estimates agree well with ICESat ice thickness retrievals (<0.1 m mean difference) for the area for which submarine data are available, while difference outside this area are larger. PIOMAS spatial thickness patterns agree well with ICESat thickness estimates with pattern correlations of above 0.8. PIOMAS appears to overestimate thin ice thickness and underestimate thick ice, yielding a SMALLER DOWNWARD TREND than apparent in reconstructions from observations"
http://onlinelibrary.wiley.com/doi/10.1029/2011JC007084/abstract
MS&T says:
“Isn’t Goddard the blogger who claimed it snowed dry ice at the South Pole?”
I wouldn’t know. Got a link?
And re: Venus, here is an interesting site that addresses that question.
Now, in order to have my facts straight, tell me: do you believe that global warming is caused by humans? I wouldn’t want to misrepresent your position.
Back up your position with verifiable, testable facts and empirical evidence.
@dbstealey
[Snip. Once more and your entire comment will disappear. ~mod.] you know where the dry ice post was made, did Anthony happen to delete it. I will have to ask around because I know I won’t get an honest answer from you.
Let’s keep the discussion on topic, I didn’t come here to argue about climate change, that is a hopeless case at this venue.
@dbstealey
I told you I am a genuine skeptic, so I did a little search for Harry Dale Huffman’s publications. I can’t take him serious because he wrote a book that claims that Plate Tectonics isn’t real.
When someone makes claims like that, it makes all their other work suspect.
The most important study to look at regarding the loss of ice in previous years is already done and the history is absolutely clear, our present state is dire. Look around and see what is happening. Lake Powell is projected to reach a new absolute minimum, you know, the one it reached back in 2003. . .
sea ice in the arctic fell off a cliff at the exact same time that temperatures started to rise.
This all just happened to occur when the U.S. and Europe began to install scrubbers in their coal-fired power plant smokestacks, removing the reflective particles of sulfur dioxide that had been cooling the planet.
see: figure 2a
History of sea ice in the Arctic, Polyak et. al (pdf)
@dbstealey
Why do claim that PIOMAS is unreliable?
Back up your position with verifiable, testable facts and empirical evidence.
Meanwhile, back at the “North Pole Camera….”
It got down to -5.9 Celsius yesterday. (21.4 Fahrenheit.)
I meant to say: It got down to -5.9 today. While the sun was shining. When clouds moved in it “warmed up” to -2.5.
Temperatures have been at or below the freezing point of salt water, at that drifting location, since some point between the 1500z and 1800z reports on August 10.
One heck of a way to run an ice-melt; that’s all I can say.
MS&T says:
“…you know where the dry ice post was made, did Anthony happen to delete it.”
What ‘dry ice’ post? If I knew what you were trying to say I wouldn’t have asked. Maybe you were just dreaming…
And:
“Back up your position with verifiable, testable facts and empirical evidence.”
What, do you live in a schoolyard? If your total argument is repeating exactly what I wrote, then you can’t be helped. I also note that the conjecture that PIOMAS is reliable is all yours. As your conjecture, you have the onus of defending your belief system. But it’s clear that you still have not read the links I provided. As stated above, your mind is already made up. The symptom of a True Believer.
And you never did answer my question: Do you believe that global warming is caused by humans? Back up your position with verifiable, testable facts and empirical evidence. Or pretend you’re still in a schoolyard, and you can get away with not giving an answer.
Finally, you did not attempt to refute Huffman’s very logical argument on Venus, so you forfeit. Changing the subject is moving the goal posts, a tactic of alarmists when they cannot refute an argument. Simply put: you didn’t try to refute Huffman because you are not capable.
But nice try, and thanx for playing…
I notice that the sea ice extent at both poles experienced a sharp change on their respective graphs in late July. The Antarctic sea ice extent gained rapidly, while at the same time the Arctic slowed it,s sea ice loss. Is this normal for both poles to react simultaneously in this regard? I watch the daily moves from here…http://nsidc.org/data/seaice_index/#. The rate of sea ice formation in the Antarctic then dropped a bit for 4 days after the accelerated growth, but it is now surging again to further new highs in the last several days.
@dbstealey
I am still waiting for something regarding PIOMAS that is factually based. Why can’t you answer a simple question?
AS far as Huffman’s blog post goes, when he publishes it in a reputable peer reviewed journal I will accept his claims.
Are you familiar with his other books that claim the earth was intelligently designed?
I will have to do a search for the snowing dry ice post on the wayback machine, it’s hard to make things like that completely disappear. I bet someone at Tamino’s blog could give me a link.
MS&T says:
“AS far as Huffman’s blog post goes, when he publishes it in a reputable peer reviewed journal I will accept his claims.”
Who cares what you will accept? As everyone can see, that is a total copout. Hiding behind pal review does not make anything valid, or invalid. You are just incapable of refuting Huffman’s Venus article, that’s all. Just remember: you were the one who brought up Venus.
Same goes for ‘intelligent design’. Why don’t you use the Wayback Machine and find out if I have ever bought into that? heh… But nice try, and thanx for playing.
Say ‘Hi’ to tamina for us. Maybe tamina will give you some new talking points. The ones you’re using are old and busted. And when you click on that blog, you will probably add ten percent to your chump’s traffic. That should make his day… ☺
@dbstealey
I notice you don’t have anything fact based to refute the validity PIOMAS.
@dbstealey
What talking points have I used, that is projection on an IMAX scale?
I never accused you of being a proponent of intelligent design, that is a poorly stuffed straw-man.
The only issue I have is with is your claim that PIOMAS has been discredited. That is an old debunked talking point.
RE: Master of Space and Thyme,
You first commented at 7:19, when I had to get to work. Now I’m back, and am amazed at the time and effort you put in all day. Does your boss know what you are up to? I’d love to spend all day watching ice melt, and thinking about what I watch, however my boss (IE wife) won’t allow it. I am an oppressed worker.
I’ve only had time to skim through the hundred or so comments, and check a couple links, however I did spend roughly eight glorious minutes watching ice melt in that video you linked to back at 11:18.
It is odd how you and I can look at the exact same picture and see such different things. You stated, ” If anyone is interested in seeing how bad the ice is at the H buoy is, check out the movie from the webcam. The cam was removed last week after the ice collapsed. The significant melt starts at about 6 minutes in to the video.”
First, you hurt the feelings of that ice by calling it “bad.” Be careful. In some circles that would be deemed politically incorrect.
Second, that slushy scene looked very typical to me, for the time and place.
Third, the camera apparently was designed to survive being tilted into a lead, and able to right itself, providing it was floating on water. The times it spends looking down are due to being crunched in ice, and unable to right itself. During the final video-minutes it is positioned in water between ice, not on ice itself, and therefore I think it may be incorrect to state, “The cam was removed last week after the ice collapsed.” My assumption would be that the camera was retrieved because it is a darn valuable hunk of equipment, and could be damaged in all the jostling that goes on in a storm, when a sea is 70% sea ice, and a big storm was in the forecast. In any case, even as the camera shows the ship coming to pick it up, the ice cover is 70%.
In my view 70% ice cover is not “bad” ice cover. However, as I said, we see things differently.
I do appreciate the many links you provide, and I’m green with envy that you apparently get away with watching ice melt more than I do.
MS&T says:
“I notice you don’t have anything fact based to refute the validity PIOMAS.”
Wrong as usual; in the Scientific Method, the one who has the onus of defending a conjecture is the one making the conjecture. But you try to put skeptics in the position of having to prove a negative — a tactic in constant use by the alarmist crowd. It is your conjecture that Piomas is a legitimate source.
Even so, I cooperated and linked to 28 articles that referred to Piomas, and showed that Piomas is not a legitimate blog. MS&T could not possibly have read all those articles and threads, which were probably 90% critical of Piomas. So in fact I did post a refutation of that ridiculous, alarmist propaganda blog. And with the Arctic re-freezing early, there goes the alarmist predictions.
As a scientific skeptic, I have no obligation to defend my skepticism. Rather, you have the onus of defending your conjecture [it is not even a hypothesis, because it is not testable, and therefore not falsifiable]. And I note that you are still avoiding answering my question: “Do you believe that global warming is caused by humans? Back up your position with verifiable, testable facts and empirical evidence.”
I suppose you will continue to dodge that impossible question, for the simple reason that there is no empirical evidence or testable, verifiable facts showing that global warming is caused by humans. You would need to provide such evidence that that is true, but as we all know, no such scientific evidence exists.
Anyway, say Hi to tamina for me. He must be wondering where you ran off to.☺
@Caleb
I was surprised to read that the retrieval was scheduled and not related to recent melt and weather events. Your’e right about the buoy floating freely, there are pictures at the link showing it’s retrieval. Here is an online diary from the ship.
http://www.whoi.edu/page/preview.do?pid=123416
The main page at that site gives some background information about the Beaufort Gyre Exploration Project. The Beaufort Gyre traditionally was something akin to an ice nursery. Ice used to spend several years growing in the gyre before returning to the CAB or being flushed through the Fram Strait.
http://www.whoi.edu/page.do?pid=66316
@dbstealey
So you have nothing factual, it’s time to ignore you.
MT&S,
You’re still going to “ignore” the twenty-eight (28) articles I linked for your benefit, which all debunk that ridiculous Piomas blog? And you are going to “ignore” my repeated question to you, because you can’t answer it?
OK. Then run along back to tamina, that’s the True Believers’ echo chamber. Really, that’s where you belong, not here on the internet’s “Best Science” website.
But of course if you change your mind and continue to display the Arctic ice pseudo-science you’ve been posting here, you can trust me to help set you straight on the science. And then there’s that question that you’ve been dodging all day…
Cryosat2 is not going to work for its primary mission.
The raw data changes so much from orbit to orbit (tides, waves, variable air pressure, pressure ridges etc.) that it can’t really resolve the ice thickness as it was intended to do. It takes more than a year of computer crunching time to come up with the data and even then, they had to throw half of it out.
They are trying to come up with alternative missions to keep it flying and maintain the operations/science jobs going.
PIOMAS, well, it has its supporters in the pro-AGW people who “like” their data going in a certain way but its numbers are illogical and nearly physically impossible. For example, the average sea ice thickness is currently under 1.0 metre according to PIOMAS. But let’s say the edges are 5 cms thick and the middle is 2.0 metres. Then the average is 1.0 metre. But even in the depths of the winter, there is still an ice edge at 5 cms, its the area that expands. It will still be 1.0 metre thick on average. Their seasonal cycle numbers are unphysical as is the large decline in the volume.
Bill Illis says:
PIOMAS “…seasonal cycle numbers are unphysical as is the large decline in the volume.”
Thanks, Bill. That explains the ultra-scary graphs that PIOMAS puts out, showing Arctic ice declining at an alarming rate — when in reality, Arctic ice is recovering.
@dbstealey
What have I posted regarding ice that you consider pseudo-science? You’ve got nothing!
You should rejoin the facts based universe, you might enjoy the change.
Your tired old talking points are way beyond their best before dates. When you get cornered you always revert to the same old crap, you have become too predictable. A genuine skeptic has an open mind, you sir are no skeptic.
I
From dbstealey on August 14, 2013 at 7:25 pm:
PIOMAS is now downgraded to a blog? It’s been so long since I looked, the links changed and I had to Google. Now the URL (see link) has “wordpress” in it.
And now it’s down to blog status, not even worth being considered a promising and ernest scientific venture revealed as tragically flawed and failed.
Oh well, thanks for the news!
PIOMAS has a built-in inherent flaw. As seen on the linked main page down in the “Model and Assimilation Procedure” section:
Follow that NSIDC link, and does it say (bold added)?
Thus PIOMAS uses data that is clearly labeled as unsuitable for the very purposes that it is not to be used for.
I expect the Master of Their Domain of Space and Thyme will say that doesn’t invalidate PIOMAS. Much like they would accept a speeding ticket from a police officer using a calculator, yard stick, and stop watch to figure out the speeds.
Brian says:
August 14, 2013 at 1:32 pm (replying to)
RACookPE1978 says:
August 14, 2013 at 1:00 pm
“The average Arctic minimum sea ice area is 2,000,000 sq km.
That is an area corresponding to the area between 85 north latitude and the Pole.”
I think you are misunderstanding my statement, and thus my logic.
1) I’m using just sea ice area in this comment. Sea Ice extents is a different creature.
2) NORSEX has (last year) a minimum sea ice area of 3,000,000 km sq. If today’s – this week’s “average anamoly” of -1,000,000 continues – which is not expected, but certainly could happen, do you agree then that a minium “sea ice area” of 2,000,000 could happen?
3) Do you not agree that last year, a minimum sea ice area of 3,000,000 sq km DID happen? (Cryosphere plot.)
And, by the way, nothing else happened. No “death spiral” no global heating, no cyclones, no hurricanes, no excess tornadoes, no excess people dead from heat worldwide, etc. (There were many tens of thousands of COLD related deaths in the UK, but the CAGW apparently wants that result of their deliberate policies to harm people.)
4) Thus, my question for you: Did it matter that we were at 3,000,000 last at minimum sea ice area, compared to a recent average of just about 5,000,000 sq km?
5) If we were at an Arctic sea ice minimum area of 2,000,000 this year, where would the edge of that sea ice area be located?
When you try to look at maximum available radiation from the sun at various days of the year, knowing the “average” latitude of the edge of the sea ice IS critical!
In the 1980’s , minimum sea ice area was about 7,250,000 sq km.
In the 1990’s, the minimum sea ice area decreased to 6,800,000 sq km.
In the earlier 2000’s, it was down to 5,500,000 sq km.
recently, it has gone down to 3,000,000 sq km. And the “weather” this year is COLD. And the “weather” up north in the Arctic, near the edge of the missing sea ice cover, is colder. Just as thermodynamics predicts.
Greg Goodman says:
August 14, 2013 at 1:02 pm (replying to)
RACookPE1978 says:
A comment was raised above about melt water pond albedo and the resulting melt rate:
Thank you for the correction! As always, I appreciate the help.
While “average area sea ice albedo” decreases considerably during the summer melting period (June through September each year), the “open ocean albedo” is not really sensitive to day-of-year.
It IS VERY, VERY strongly sensitive to “diffuse” sunlight” and “direct sunlight” at EVERY day of the year and EVERY “Solar elevation angle” however. And, as the above two solar fractions change with cloud cover and wind speed and ocean wave height, the open ocean albedo changes with those as well. ‘Tis a complex problem, but solvable.
The following is not well known unless you’ve looked at lots of “open ocean albedo” research papers dating back as far as the mid-50’s, but please bear with me.
Solar radiation at the earth’s surface is made up of direct sunlight and diffuse (indirect) sunlight. On a very cloudy day, there is simply put, NO direct sunlight. (You cannot, standing outside, see any shadow.) All radiation received is diffuse radiation, and comes from a nominal 45 degrees solar elevation angle. Practically speaking, from all around the sky. Through the mid-summer of the high Arctic, cloudy days are about 85% of the weather. So, 6 out of 7 days of the week, ONLY diffuse radiation gets through to the surface. Note that this means that 45% to 75% of the POTENTIAL solar radiation is also immediately and completely reflected from the top of the clouds. Thus, 60%-70% of the POTENTIAL radiation each day does not even arrive on top of the sea ice or, if the sea ice melts, the supposedly “dark” open ocean water.
However, we have seen that the “reflective” sea ice during the mid-summer is – well, actually, not-so-reflective after all: it averages 0.65-0.75 albedo. The open ocean albedo of diffuse IS “dark” at about 0.065, but that albedo does NOT depend of solar elevation angle.
So, IF the solar radiation gets through the clouds, almost all of it – about 94% – WILL get absorbed into open water. But remember, only 30% made it through the clouds on those 6 out of the 7 days of any given “average” week in the summer Arctic when it is cloudy, so only 27% could get absorbed by the open ocean water. Net? 73 percent of that potentially available solar radiation is NOT absorbed by that newly exposed ocean water on 6 of the 7 days when clouds are present.
What if there were sea ice on these cloudy days? How much would get reflected? Well, if the (actual measured) sea ice albedo of 0.65 to 0.75 is correct, then 65% to 75% of the 30% maximum potentially available solar radiation on a cloudy day is reflected from the sea ice.
Net effect of sea ice melting in the Arctic? Not no difference at all, but certainly very little difference compared to the “death spiral” of runaway Arctic warming so often talked about and assumed by the CAGW hysterics. For example, just a few days ago, one such wrote here words to effect of ” Don’t you know that 90% of the sun’s energy is absorbed by the ocean, and 90% is reflected by the ice?”
So, what about those few and far between clear and sunny days when there actually IS direct radiation in the Arctic?
It turns out that the entire problem changes on clear days: even MORE energy is reflected from the open ocean, and the net difference in absorbed energy is even less – but most strongly at times of minimum sea ice area/extents!
But, the “rest of the story” will be later. 8<)
kadaka (KD Knoebel) says:
August 14, 2013 at 10:17 pm
PIOMAS has a built-in inherent flaw
That is interesting, I was wondering why PIOMAS only publishes results on a monthly level. Perhaps that is why. They use the real time data but cannot rely on it on a daily update and rather need to take a smoothed average for the month.
Just because it says you cant use it for a trend or time series doesn’t mean it cannot be used appropriatly as a monthly averaged value as an additional input to improve sea ice estimations. That is why it is why they put that sattelite up there! Just for that purpose!
jai mitchell says:
August 14, 2013 at 11:09 pm says:
kadaka (KD Knoebel) says:
August 14, 2013 at 10:17 pm
dbstealey says:
August 14, 2013 at 9:18 pm
Bill Illis says:
All: PIOMAS has a built-in inherent flaw … And other concerns about PIOMAS.
To quote our esteemed “smartest woman in the world” – the former Secretary of State while testifying (er, lying) in front of Congress “What difference does it make?”
PIOMASS tries to estimate the total mass of remaining Arctic sea ice. It may – and probably does not – do that job very accurately. It certainly does it very slowly, and what “data” (er, estimates, or guesses as critics would prefer) it does create from its programming can’t be verified against actual sea ice masses across any part of the Arctic.
So what? DO we not all agree that Arctic sea ice area, sea ice extents, and almost certainly sea ice mass from year to year recently have gone down? Do we really need to argue about whether any given program “thinks” an area that has melted was 1.5 meters thick, or 2.0 or 3.0?
That area melted. “It’s gone, Jim.” /Star Trek doctor.
That area will be back next year as re-frozen sea ice.
And the difference between an ice-covered Arctic ocean at minimum sea ice extents, and an open ocean at minimum sea ice extents is? A cooler planet.
Note that Antarctic sea ice IS EXPANDING by millions of square kilometers … and that area of ice-covered water DOES reflect significant solar radiation from its ever-expanding sea ice edge at 61 south!
Result of an expanding Antarctic sea ice area? A cooler planet.
From jai mitchell on August 14, 2013 at 11:09 pm:
I really want to say you can’t possibly believe what you just wrote, but you have repeatedly indicated you really could believe such.
If they need a monthly averaged value, then NSIDC makes nice vetted monthly averaged values. There is no need to use the unsuitable near-real time product.
And that satellite is not up there to make nice monthly averages. It collects daily info. The second line from NSIDC I had quoted says what that product is for:
I emphasized the part your allegedly brain didn’t absorb before.
Master of Space and Thyme says:
August 14, 2013 at 4:12 pm
So again, my post above stands, I posted the referrence to it.
The correction is almost the whole uncertainty range, and as said watching calmly waiting to see next corrections soon to come.
The problem you alarmists have is that you think nature behaves linear (and that CO2 is the main driver of climate).
RACookPE1978 says:
August 14, 2013 at 11:28 pm
And the difference between an ice-covered Arctic ocean at minimum sea ice extents, and an open ocean at minimum sea ice extents is? A cooler planet.
Note that Antarctic sea ice IS EXPANDING by millions of square kilometers … and that area of ice-covered water DOES reflect significant solar radiation from its ever-expanding sea ice edge at 61 south!
Result of an expanding Antarctic sea ice area? A cooler planet.
Exactly.
Bill Illis says:
August 14, 2013 at 9:13 pm
Cryosat2 is not going to work for its primary mission.
The raw data changes so much from orbit to orbit (tides, waves, variable air pressure, pressure ridges etc.) that it can’t really resolve the ice thickness as it was intended to do. It takes more than a year of computer crunching time to come up with the data and even then, they had to throw half of it out…
The following paper (free) by Seymour W. Laxon et. al. illustrates the difficulties involved in making a meaningful estimate of Arctic sea ice volume and shows the large diversions from the PIOMASS volume estimates…
CryoSat-2 estimates of Arctic sea ice thickness and volume – 28 FEB 2013
http://www.personal.soton.ac.uk/pgc1g08/grl50193.pdf
kadaka,
Thanks for your comments. The biggest problem I have personally with PIOMAS is the alarming chart they have fabricated. As I regularly point out, just as someone can lie with statistics, they can construct deceptive charts.
This alarming PIOMAS chart is a good example. They use it all the time. Notice how PIOMAS adjusts the axes to show a very scary decline. That directly conflicts with the other charts showing current Arctic ice recovery.
@dbstealey
What is wrong with the chart you linked and why are you so alarmed?
I am still waiting for you to supply fact based evidence to back up your claim that I have been posting “talking points” about sea ice.
The more I read your past comments, the more it confirms my suspicion that you are nothing more a angry contrarian and not a genuine skeptic.
Master of Space and Thyme:
For some time I was obtaining great amusement from following your exchanges with dbstealey and others especially with regard to Piomas.
I admit that part of my amusement was that I am always amused by watching an alarmist get a well-deserved drubbing. However, another part of my amusement was my admiration for the stoicism and fortitude you were displaying while getting such a trouncing.
Unfortunately, the most recent posts from dbstealey and you, suggest that you are now reaching the stage when the ref. needs to ‘stop the fight’.
dbstealey wrote at August 15, 2013 at 5:12 am
http://wattsupwiththat.com/2013/08/14/the-early-chill-in-the-arctic-continues/#comment-1390695
saying
You have responded at August 15, 2013 at 7:03 am
http://wattsupwiththat.com/2013/08/14/the-early-chill-in-the-arctic-continues/#comment-1390755
saying
Please consider your reply that I quote here.
Your reply asks for information that the message you are commenting provides; i.e. the chart is “wrong” because “how PIOMAS adjusts the axes to show a very scary decline” and “That directly conflicts with the other charts showing current Arctic ice recovery”.
Your reply suggests you either have difficulties with reading comprehension or you are dissembling by making a false suggestion; i.e. you suggest dbstealey is “alarmed” when he said the Piomas chart is “fabricated” to be “alarming” by use of an adjusted axis.
Your reply says you still await dbstealey justifying his observation that you are making “talking points” when he first made that assertion at August 14, 2013 at 6:34 pm
http://wattsupwiththat.com/2013/08/14/the-early-chill-in-the-arctic-continues/#comment-1390365
where he suggested you had obtained the “talking points” from “Tamina”. But you have not refuted that suggestion in any of your subsequent posts, so it is hard to understand why you are awaiting anything.
And your reply concludes with ad hom..
Master of Space and Thyme, I would like to continue obtaining the amusement I have obtained from your exchanges. But your post that I quote and comment here suggests you are on the point of getting a KO. So, I suggest that you withdraw, get some help from your ‘seconds’, and return to the fray when you have recovered. Otherwise, I and others will lose the amusement we have been getting from your exchanges.
Richard
@richardscourtney
DBstealy is wrong when he says the axis on the graph has been manipulated, he is not being honest when he makes that claim.
He also claimed that I have been posting “talking points” about ice, but has not been able to show any examples.
Everyone is entitled to his own opinion, but not his own facts.
Daniel Patrick Moynihan
@richardscourtney
I have never ever posted anything from Tamino’s blog. That is another straw-man DB created to muddy the water.
Master of Space and Thyme:
Thankyou for your post addressed to me at August 15, 2013 at 8:18 am
http://wattsupwiththat.com/2013/08/14/the-early-chill-in-the-arctic-continues/#comment-1390800
which refutes the suggestion of dbstealey that you were making “talking points” obtained from Tamino’s blog (assuming Tamina and Tamino are one and the same and that “copying” is the same as restating).
Please consider my suggestion that you ‘take a short breather’. I am sure I am not alone in wanting to observe more of your exchanges on WUWT. Yes, you have had a pounding, and, yes, it is starting to show. But WUWT needs ‘dissenting voices’ such as yours.
Richard
@richardscourtney
I would like you or DB to post a single talking point I made regarding ice. Everything I have posted here was based on factual data backed up with links to the source.
Master of Space and Thyme:
I write to say I have read your post addressed to me at August 15, 2013 at 8:36 am.
[My] posts addressed to you offered sincere advise. Your post I am answering adds to my reason for offering that advise. I have acknowledged your post and you make take this acknowledgement as covering any future posts you address to me.
Richard
If you want to see a chart that had its axis manipulated, here is an example of one poorly done by Professor Nils-Axel Mörner. The offending graph is figure 5.
http://www.publications.parliament.uk/pa/ld200506/ldselect/ldeconaf/12/12we18.htm
I believe he is the individual being referred to in this post.
http://wattsupwiththat.com/2013/07/31/the-marshall-islands-and-their-sea-level-changes/
I found the WUWT post speculating on dry ice snow in Antarctica by the anonymous blogger who posts under the name Steven Goddard.
“How cold is it in Antarctica? According to Weather Underground, Vostok, Antarctica is forecast to reach -113F on Friday. That is four degrees below the freezing point of CO2 and would cause dry (CO2) ice to freeze directly out of the air.”
By Steven Goddard
http://wattsupwiththat.com/2009/06/09/co2-condensation-in-antarctica-at-113f/
It was followed followed by another post where Anthony Watts refuted “Steven Goddard’s” weird hypothesis.
“We all learned something, we had a little fun, some online yelling occurred, and some egos were bruised. Overall though it was worthwhile that this myth of “CO2 snow at Vostok station” was finally put to rest.”
http://wattsupwiththat.com/2009/06/13/results-lab-experiment-regarding-co2-snow-in-antarctica-at-113%C2%B0f-80-5%C2%B0c-not-possible/
Master of Space and Thyme says:
August 15, 2013 at 8:36 am
Thyme: Every paragraph you have written has been a “talking point” from the CAGW community: You have offered absolutely nothing “new” except introducing PIOMAS as “evidence” of a loss of Arctic sea ice” … Which, as i pointed out above, adds nothing, since ALL data from EVERY source indicates a recent Arctic sea ice decline! I would, in fact, be surprised if PIOMAS did NOT indicate a decline in Arctic sea ice.
By the way, what is your position, your sponsor’s position actually, on the +1,000,000 extra sq km’s of Antarctic sea ice? What is the effect of that GAIN in sea ice on the net heat transfer of this planet?
Regardless, please show me, by calculation and not talking point, exactly WHY you so greatly fear Arctic sea ice loss in mid-August and September. We do not disagree on the loss of Arctic sea ice, I just want to know WHAT you so greatly fear because of that Arctic sea ice loss?
Remember, September – at time of minimum sea ice extents. At say, 2:00 in the afternoon on September 21; and 12 hours later – at 02:00 in the morning.
@RACookPE1978
Please name a single talking point regarding ice, there are none. I understand how things work at WUWT, so I have limited all my comments to posting about past or current climate and ice events, backed up with actual data, along with sources.
Nowhere have I speculated about climate change, global warming or future ice conditions.
Just because DB has made assertions, they shouldn’t be given credence when he is unwilling to provide factual evidence.
Meanwhile, back in the facts based reality, it appears various models are predicting the fourth Arctic cyclone of the melt season to form next Wednesday.. That should continue the cold weather north of 80 degrees. It will be interesting to watch the models as we get closer to see if this storm will bring record shattering hot weather to the Canadian Arctic like the storm that ended yesterday.
ECMWF
http://www.meteociel.fr/modeles/ecmwf/runs/2013081500/ECH1-192.GIF?15-12
GEM
http://www.meteociel.fr/modeles/ecmwf.php?ech=72&mode=1&map=1&type=0&archive=0
MODIS aqua caught another peek through the clouds that shows even larger “lakes” north of 80 degrees when compared to images taken before the last storm. The largest area of open water in this pic below measures several hundred square km in area.
http://tinyurl.com/mdta3ha
At the pole, MODIS terra shows what appears to be increasingly larger areas of open water. The cloud cover makes the image less clear, so the true extent of open water is unknown. It will certainly be interesting to catch a view of the pole when the cloud cover lifts, but unfortunately that may not be any time soon.
http://tinyurl.com/kyzwpmz
Master of Space and Thyme says:
August 15, 2013 at 9:54 am
?????
Perhaps you won’t/don’t/can’t understand: Do you not understand we DO agree that there has been a recent Arctic sea ice decline?
A “talking point” is a short, memorized statement used by politicians and their propaganda agents to address a complex issue in short, one to three easily-memorized or written sentences (or, rarely, paragraphs) that serve to further the talker’s position. Most often talking points are actually BASED (somewhat) on (limited) facts, but NEVER all of the facts or mitigating circumstances or full truth of the subject at hand. Further, the person dissembling “talking points”, rather than having an actual conversation or teaching event, simply either repeats his/her memorized/copied talking point, or – if failed to conclude the argument or silence the enemy speaker – immediately changes the subject to the next memorized talking point.
This occurs BECAUSE the speaker/writer does NOT know enough about the subject at hand to do anything but repeat simple copied/memorized talking points.
Your writings have done nothing to either add to that (previously derived here) conclusion that Arctic sea ice is declining now nor have they done to anything that contradicts that (previously derived here) conclusion that Arctic sea ice has declined, nor do they do anything to extend or extrapolate to a future condition with respect to that (previously derived here) conclusion that Arctic sea ice may continue to decline in future years.
Your multiply repeated comments in this thread do NOT add anything to the discussion, nor do they further that conversation/teaching event – which is EXACTLY what you stated above. Your comments do, in fact, solely distract from that previously derived conclusion: Anthony, several YEARS ago, specifically developed his “Sea Ice Page” BECAUSE of the data that showed Arctic Sea Ice was in decline, and that Antarctic sea was changing. (At the time, it was not evident that Antarctic sea was going to grow as rapidly as it has recently. I congratulate Anthony for seeing that potential Antarctic sea ice increase, and for being able to track that increase as it continues into today’s climate/weather.)
Let me try again: We do NOT need “evidence” that Arctic sea ice has recently declined.
Rather, we need a “contribution” – quantifying from you with “scientific” numbers – what the potential effects of this recent decline in Arctic sea will be.
1) Tell us specifically (by calculations and numbers) WHAT YOU FEAR from a continued decline in Arctic sea ice?
2) Tell us WHY you do NOT fear that same problem (whatever that problem is or may become) from an increase in Antarctic sea ice?
RACookPE1978 says:
August 14, 2013 at 10:20 pm
” 2) NORSEX has (last year) a minimum sea ice area of 3,000,000 km sq. If today’s – this week’s “average anamoly” of -1,000,000 continues – which is not expected, but certainly could happen, do you agree then that a minium “sea ice area” of 2,000,000 could happen?”
I don’t think you understand what the word anomaly means. It is not the same as one year change. The average anomaly of -1,000,000 is the difference from the satellite era average, not the 2012 area. This week’s anomaly is actually considerably above 2012, so no, I do not think a sea ice area of 2,000,000 could happen this year. Even if it could, that is way different than your statement I have been refuting: “ALL of the Arctic ice between today’s limits and 85 north SHOULD be expected to melt EVERY year.” This statement is completely false, and I’m not sure why you continue to defend it.
I think the effects of decreased ice remain to be seen, but that it is interesting to watch. I’m not sure if the ice will rebound, remain low for decades, or vanish altogether. I don’t think anyone knows for sure. I think it’s absurd how many warmists think an ice free arctic is a certainty, but I also think it’s absurd how many people on this site think it’s an impossibility.
MS&T says:
I have never ever posted anything from Tamino’s blog. That is another straw-man DB created to muddy the water.
Not really. Upthread you stated that you were going to tamino’s blog to ask them for information, so my assumption was rational. But if you were just inventing a fake response, you can’t blame me for taking you at your word.
Next:
If you want to see a chart that had its axis manipulated…
Thank you for making my point. Prof Mörner’s graph properly begins at a zero baseline. Had the PIOMAS chart started at zero, the apparent decline shown would have been much less pronounced. But I commend you on taking the time to at least scan Dr Mörner paper. You can learn a lot from him. Next:
I believe he is the individual being referred to in this post.
Yes, Prof Mörner is an internationally recognized sea level/ocean expert. I understand that drives you crazy, but you are the one who has demanded a peer reviewed authority. Do a search for Prof Morner’s CV. And BTW… what is your CV? Do you have one? Since I’m in my question-asking mode, are you ever going to try and answer the question I’ve been asking you, or do you intend to permanently dodge it? The reason I ask it is because it is central to the entire AGW debate. There is either testable, measurable empirical evidence for AGW, or there isn’t. Do you believe there is such evidence? Or not?
Also, today is a weekday. Yesterday was also a workday, but it seems you are posting here 24/7. Do you have an employer? [This has been asked before by someone else. I ask out of curiosity.]
Next, you comment on an anonymous blogger who posts under the name Steven Goddard. Since you make that assertion, who is this Steven Goddard? Give us his real name, please, otherwise as Richard Courtney points out, you rely on ad hominem arguments.
Next, your linked article says:
So there you have it. That is how science is done. Note that RealClimate, tamino, Skeptical Science, and other alarmist blogs do not allow wide ranging discussion with input from both sides in order to resolve questions like this. Instead, they censor, delete, and alter comments, and only allow those that support their narrative. That is not science, that is propaganda.
In this case, the question was resolved through much discussion and a follow-up post. You seem very unhappy that a science question was settled this way. But that is how science is supposed to be done. No one is right 100% of the time [and in fact, the predictions of the alarmist crowd appear to be wrong 100% of the time]. Attacking someone because they left partial pressure out of the equation is petty, and worse, unscientific. But if that kind of attack is all you’ve got, I guess that’s what you have to use — since admitting that the catastrophic AGW conjecture is wrong would be entirely out of the question for everyone on the climate alarmist bandwagon.
But as always, thanx for playing.
@RACookPE1978
So like all the others, you can’t find a single talking point I’ve made.
Why am I not surprised?
@dbstealey:
So you don’t have an issue with a fraudulent graph by Mörner that was tilted by 30 degrees to hide the incline. but you are concerned by a graph that has an axis that doesn’t start at zero. That is hilarious.
I am, still waiting for the talking points you alleged I posted.
I did a little google search for your buddy who posts under the name Steven Goddard. It appears that he is really into conspiracy theories. Did you know that he is a birther and also believes that the shooting at Sandy Hook may have been a government conspiracy. There also appears to be quite a bit of racial flaming going on at his alleged science blog. My advice to you is not to be seen as one of his supporters.
@RACookPE1978
“1) Tell us specifically (by calculations and numbers) WHAT YOU FEAR from a continued decline in Arctic sea ice?
2) Tell us WHY you do NOT fear that same problem (whatever that problem is or may become) from an increase in Antarctic sea ice?”
I would like to answer
1) I don’t necessarily fear, but I am interested to watch how the three cell atmospheric circulation pattern evolves. A much warmer polar cell might give way to a 1 or 2-cell system, which would lead to falling dry air over the US and Europe (45 deg latitude), making them more arid. It’s not likely, but an interesting possibility.
2) Increase in winter sea ice has a smaller effect on albedo than decresed summer ice, since there is much less insolation in winter. Also, since the south polar region is land, the albedo wouldn’t be expected to change much regardless of what sea ice is doing.
Master of Space and Thyme says:
August 15, 2013 at 10:40 am
To the contrary: I have shown – and you just confirmed that conclusion – that you have submitted NOTHING BUT talking points.
We have in this thread several times tried to get you to declare what you fear will be the result of reduced Arctic Sea Ice. You have, after many invitations and having has many hours to do the calculations on your own, NEVER said that reduced arctic sea is a potential or a real “problem.” Therefore, we must conclude that you have, in fact, come to this conclusion yourelf.
Congratulations.
Further, since you apparently have also presented no evidence (or memorized talking points) that the recently reduced Arctic Sea Ice is a problem in somebody’s else’s mind, then I congratulate you on being trained in properly the scientific methods of reviewing facts and calculating results independently. (As opposed, for example, to simply repeating memorized short but distracting factoids.)
Therefore I can declare that “Master of Thyme concludes specifically and directly after much discussion with reasonable and well-knowing professionals and skeptics on WUWT that the recent decline in Arctic Sea Ice is not a problem and can be ignored in all future climate discussions.
Further, Master of Thyme agrees that the recent greatly increasing Antarctic sea ice area IS a future problem of great importance to the climate debate since it proves that CO2 does NOT influence sea ice states, and that an increase in Antarctic sea ice extents may potentially very dangerous future cooling of the planet.”
Record heat wave bakes Canada’s North
http://www.cbc.ca/news/canada/north/story/2013/08/13/north-weather-heat.html
“Temperatures 10 degrees above normal across Yukon, Nunavut and Northwest Territories
Historically high heat over the past week has led to broken temperature records in all three northern territories but residents aren’t complaining.
Temperatures across Canada’s three territories have been about ten degrees above normal this week.
In some communities, like Kugluktuk, Nunavut, it’s been even more remarkable: yesterday, it set temperature records for the sixth consecutive day on Tuesday, hitting 29 degrees Celsius.
Typically, in Kugluktuk, it’s about 13 degrees this time of year, according to Environment Canada. Local teacher Barbara Olson and her family found a unique way to deal with the scorching temperatures: they’ve been snorkeling — in the Arctic Ocean.”
It’s interesting that I have been the only one at WUWT who has mentioned the Arctic heat wave.
There also been no mention of the recent eat wave in Siberia that resulted in wildfires over an area of exceeding ! million square kilometers.
@RACookPE1978
Since when has commenting on weather and posting links to current ice conditions been considered “talking points”?
In the facts based version of reality, that accusation is laughable.
My comments are all on topic and I am beginning to get the impression that what peeves you and a handful of other WUWT regulars is t that the facts from reality don’t agree with you own personal version of reality.
Brian says:
“I think it’s absurd how many warmists think an ice free arctic is a certainty, but I also think it’s absurd how many people on this site think it’s an impossibility.”
For the record, I have commented in the past that I think an ice-free Arctic would be a net benefit, saving fuel by providing for shorter transits. Also, icebreakers require a lot of fuel. That’s why many of them are nuclear powered.
The climate is never static. It naturally fluctuates. The Arctic has been ice free in the past, and it will be ice free again. An ice free Arctic is part of the planet’s natural climate variability. Given the choice between global cooling and global warming, I think global warming is preferable. Warming would provide millions of hectares of new arable farmland in places like Siberia, Alaska, and Mongolia; it would provide more precipitation for farmland from increased humidity, and of course, the Arctic would have less ice. Win-win.
===================================
MS&T says:
“So you don’t have an issue with a fraudulent graph by Mörner…”
You, sir, are an assertion-prone regurgitator of stupid talking points. The graph in question is right out in the open for everyone to see, therefore, it can hardly be called “fraudulent”; fraud indicates deception, but nothing is being hidden. Your comment is simply another one of your easily debunked talking points. You do not indicate what if anything you believe is fraudulent, and even if your no-account opinion was worth considering, who should we believe? You? Or the internationally esteemed Dr Mörner? Because one of you is wrong.
I note that you also continue to dodge the question of your mythical CV. Prove me wrong: if you have a relevant CV, post it. Otherwise, Dr Mörner wins by default, because your anonymous opinion means nothing by comparison.
And your pathetic attempts to paint me into a corner as supporting the Sandy Hook shooting, and being a “birther”, and “racial flaming”, etc., are your own lame attempts to move the goal posts with irrelevant talking points, since you have decisively lost the science debate. Note that all your unrelated ad hominem attacks have nothing to do with the questions you are dodging. So I ask you once again: do you have any testable scientific evidence quantifying your belief in catastrophic AGW? Or are you simply trolling from your mom’s basement?
Master of Space and Thyme:
Please withdraw your unfounded smear of Professor Nils-Axel Mörner.
Niklas (which is what he likes to be called by his friends but not others) is a better man and a better scientist than you could dream of becoming. He has published his excellent work in 500+ peer reviewed publications.
His work concerns sea level – not Arctic ice – so there was and is no reason for you to have mentioned him or that work in this thread. But you introduced irrelevance solely to denigrate him and to falsely accuse him of misconduct. An apology for your conduct is warranted.
Richard
@dbstealey
The topic of this thread is not global warming, let’s keep our conversation to what you find factually wrong about my comments.
You are well know at real science blogs, I seriously doubt that you have the testicular fortitude to debate honestly, so all you are going to do is keep spinning over and over until I grow tired.
@richardscourtney
He tilted the axis of a graph by 30 degrees and then claimed that there was no incline, you can’t deny that fact. Who am I supposed to believe, you or my lying eyes?
How can you be so out of touch with reality?
http://nsidc.org/arcticseaicenews/charctic-interactive-sea-ice-graph/
Ice behavior is following the 2005 track closely. Temp traces are also similar.
Master of Space and Thyme says:
August 15, 2013 at 11:17 am
Whenever and each and every time that they ARE talking points.
You have presented NO new evidence past the original and years-old conclusion of this site that Arctic sea ice has recently declined in area
We have disputed no facts that have been presented, so you can stop adding new talking points. (DB has presented evidence that your PIOMAS distraction may be incorrect, and uses misleading graphics to present a extrapolated and propagandist forecast, but nobody has disagreed with the “facts” that Arctic sea ice has recently declined in area.) Rather, you systematically and repeatedly and deliberately REFUSE to discuss the evidence or contribute anything that furthers the conversation.
Master of Thyme, by again failing to present any evidence to the contrary and after had the private time to research and refute any and all of the evidence that has been presented in public, repeats his previous assertion that “There is no present nor future problem with the recent Arctic sea ice decline, and further, Master of Thyme has examined all the evidence presented above and – having presented no statement to the contrary despite many other requests here and on other threads- concludes that the CAGW theories of CO2 affecting Arctic sea ice extents are wrong.”
dbstealey says:
August 15, 2013 at 11:20 am
“The climate is never static. It naturally fluctuates. The Arctic has been ice free in the past, and it will be ice free again.”
While this is certainly true, it hasn’t happened in recorded history. So it will likely have many unforeseen consequences, both positive and negative. It’s obvious you think warminsts are nuts, but that doesn’t negate the possible negative outcomes. And though the climate does naturally fluctuate, humand can cause additional alterations on top of the naturally occurring ones. The difference is difficult to distinguish. Unfortunately, most people seem to fall into two camps: change is either all natural or all anthropogenic. I think it would be better if we stopped all of the rhetoric against the opposing extreme viewpoints and acknowledged all possibilities. The observations and science are interesting enough without the rhetoric.
@RACookPE1978
Show me a single talking point. I am beginning to get the feeling that you consider anything outside your personally generated version of reality a talking point. Is the link
to the heat wave in the Canadian Arctic a talking point?
How about this link to the current Siberian wildfires, heat wave and floods, is that a talking point?
http://robertscribbler.wordpress.com/2013/08/14/a-song-of-flood-and-fire-one-million-square-kilometers-of-burning-siberia-doused-by-immense-deluge/
I think everyone is upset because I posted facts that show that there are very large area of the Arctic that have been anomalously hot recently and they are resentful that it doesn’t conform to their personal beliefs. That certainly indicates a lack of genuine skepticism and open mindedness.
Brian says:
August 15, 2013 at 10:52 am (replying to an earlier, and still open, question)
“1) Tell us specifically (by calculations and numbers) WHAT YOU FEAR from a continued decline in Arctic sea ice?
2) Tell us WHY you do NOT fear that same problem (whatever that problem is or may become) from an increase in Antarctic sea ice?”
Thank you for your contributions above.
Antarctic first: True, the Antarctic continent surrounds the south pole, and that continental land mass is (98% +) always covered by a permanent ice cap/snow cap that always reflects sunlight. But this permanent land ice mass is surrounded itself by the “permanent” ice shelves, and those ice shelves and the ice-covered land mass are THEN surrounded by the “Antarctic Sea Ice at minimum extents” each year.
Thus, even at times of minimum Antarctic sea ice extents, the MINIMUM total reflecting area around the south pole is NOT the continent land area, but the continent (14,000 Kkm2) PLUS the permanent ice shelves (1,500 Kkm2) PLUS the Antarctic sea ice at minimum (2013 this minimum sea ice area was 2,000 Kkm2, 2012’s minimum was 2,000 Kkm2, 2011 was down at 1,750 Kkm2 minimum.) So not only is the MINIMUM “ice area” is what is growing in the Antarctic; but the day-to-day TOTAL ice cap of the Antarctic is also what is growing; and the MAXIMUM Antarctic total ice cap is what is growing past all previous records. Since, as you correctly point out above – when measuring the effect of a constantly changing influence, one must always consider not only the changing influence, but also the effect of any CHANGE (anomaly) from that ever-changing influence – we must evaluate the potential effect of the daily/monthly/yearly anomaly of the antarctic sea ice. After all, the continental area has not changed recently, and the area of the permanent ice shelves has been controversial, but has not changed very much either.
Now, today, look at the total area of reflective ice around the south pole:
http://nsidc.org/data/seaice_index/images/daily_images/S_bm_extent_hires.png
The “growing edge” of that Antarctic TOTAL ice area is what is reflecting “extra” sunlight from the planet not previously lost to space as in past years, and, worse, the “edge” of that TOTAL area is quickly working itself past 60 degrees south latitude even closer to the equator. This is equivalent to an ice area up north lower than the south coast of Alaska, cutting across the middle of Canada, through the lower tip of Greenland, and all the way through half of Europe and Russia/Siberia!
From mid-August through late October, the energy reflected from “new” or “extra” Antarctic sea ice at 60 latitude is many, many times larger than the energy “potentially” absorbed from the same area of ice lost at 81, 83, or 85 north latitude.
Brian,
When did “recorded history” begin? This is recorded history. It is the geological record of Arctic ice cover.
What you are arguing is the Precautionary Principle: “what if” there are problems? And “possible negative outcomes” could apply to anything in future. But none of those things are science. They are all “what if” scenarios — with the “what ifs” completely undefined.
If we based our decisions on the PP, we would never get anywhere. I have given concrete examples of the net benefits of less or no Arctic ice. Saying, “But what if…” is not a credible response.
Also, I don’t think ‘all warmists are nuts’ [MS&T excluded]. I try to keep an open mind. But I have yet to see even one verifiable scientific fact proving that human activity has any effect on global temperature. In all other areas of science, that would be enough to sink the AGW conjecture. But in Climatism, the fact that there are no facts does not seem to matter at all. The alarm must still be sounded!
=========================
MS&T says:
“I think everyone is upset because I posted facts that show that there are very large area of the Arctic that have been anomalously hot recently…”
Well, I’m not upset. My response is: “So what?”
There are always anomalies. So what?
Master of Thyme, by again failing to present any evidence to the contrary and after he had the private time to research and refute any and all of the evidence that has been presented in public, repeats his previous assertion that “There is no present nor future problem with the recent Arctic sea ice decline, and further, Master of Thyme has examined all the evidence presented above and – having presented no statement to the contrary despite many other requests here and on other threads- concludes that the CAGW theories of CO2 affecting Arctic sea ice extents are wrong.”
RACookPE agrees with Thyme that certain areas of the Canadian Arctic land areas have increased in temperature in recent days – as they always do each summer! – and agrees with Master of Thyme that this temporary temperature on the Arctic shores far from the edge of the current Arctic sea ice is not a problem and has nothing to do with the future heating of the Arctic region.
Master of Space and Thyme:
I am outraged by your despicable post at August 15, 2013 at 11:30 am
http://wattsupwiththat.com/2013/08/14/the-early-chill-in-the-arctic-continues/#comment-1391050
In total it says concerning Professor Nils-Axel Mörner
NO! He did not! APOLOGISE.
You have provided no reference, link or evidence concerning your despicable smear because it is merely another talking point you have gleaned from some climate porn blog. And I think you – not your eyes – are lying because I don’t think you have seen the graph.
I have seen it and I am familiar with this matter.
Niklas corrected GRACE data for global isostatic adjustment. The correction to the uncorrected data revealed a truth that warmunists found inconvenient so they did – as you have done – their usual practice of ‘attacking the messenger’ with smears.
The correction – and graph you clearly have not seen – is Figure 8 of this paper
http://scienceandpublicpolicy.org/images/stories/papers/reprint/sea_level_not_rising.pdf
Now grovel, admit you were wrong, and APOLOGISE.
Richard
Master of Space and Thyme says: August 15, 2013 at 11:49 am
Weather ≠ Climate
@dbstealey
“Well, I’m not upset. My response is: “So what?”
There are always anomalies. So what?”
Just like you have no issue with tilting a graph by thirty degrees and then claiming it shows no rise in sea level, you see nothing wrong with a headline that states,”The early chill in the Arctic continues”, during a time period when a majority of the arctic was experiencing anomalously high temperatures.
Keep digging, your disingenuousness and lack of true skepticism is being displayed for all to see.
I told you before, I am a genuine skeptic and have my membership in JREF to prove it.
“NO! He did not! APOLOGISE.”
Did you not click the link to the tilted graph?
You are not being intellectually honest, I have posted nothing that warrants an apology. If anyone deserves an apology, it is me, because you are dishonest with your accusation.
http://stevengoddard.wordpress.com/polar-meltdown/
Master of Space and Thyme I invite you to go the above link to read accounts from the 1800’s of the warming of the Arctic and the loss of sea ice. Also you will find if you peruse Mr. Goddard’s site a graph showing the satellite ice readings, from the early 1970’s not 1979 as normally shown, that show Arctic sea ice was very low in the early ’70’s.
As stated by many we know the Arctic sea ice has declined from the high, but have the oscillations over long periods really changed that much?
@Steve Keohane
Weather ≠ Climate
I am getting the feeling that nobody here has actually bothered to read my comments. Nowhere have I claimed the heat wave in the Arctic was as sign of global warming. I have never ever made even a single comment here in support of global warming.
Steve, maybe you comment should have been addressed the individual who posted this thread, because a lot of posters here seem to be conflating cold temperatures in a small area of the far north as being proof that there is no global warming.
I posted links showing that despite it being a couple degrees colder than normal at the pole. the warm temperature anomalies in the rest of the Arctic dwarf the small negative anomaly north of 80
Master of Space and Thyme:
re your post at August 15, 2013 at 12:19 pm
You ask
I POSTED THE LINK NOT YOU.
Here it is again
http://scienceandpublicpolicy.org/images/stories/papers/reprint/sea_level_not_rising.pdf
And you have the gall to say to me
YOU ARE BEING COMPLETELY DISHONEST.
You now owe me an apology in addition to the apology you owe Niklas.
I appreciate that you lack the intellectual capability to read the text of the paper but you should be capable of reading the titles of Figures 8 and 9.
You really are a piece of work. Having had nothing of substance to say, and having been pummeled for swamping the thread with drivel, you ignore a helpful suggestion that you withdraw and reflect, then you start posting untrue smears, and you refuse to apologise when called on them.
Have you no shame?
Richard
MS&T says:
“I am a genuine skeptic…”
heh
Like all your comments, that one is complete nonsense.
Also, the graph you are fixated on was tilted to make a point. Obviously, that point went flying right over your head. And Richard Courtney is right: you brought up a sea level authority in an Arctic ice thread. That shows you have no credible on-point arguments to make.
Since you’re also fixated on anomalies, here are a couple of charts that debunk your belief that there is a problem with Arctic ice. The fact is that global ice cover is about where it has been ever since the satellite record began.
So whether you like it or not [you won’t], we’re going to be referring to the Antarctic in some future posts to give readers a balanced view, because your belief system is anything but balanced.
@mkelly
I respectfully decline the invitation to that fake science blog. The anonymous blogger who posts under the name Goddard is wrong about that assertion regarding satellite measurements in the early 70’s. The earlier satellites did not do the same type of measurements, the instruments dealt with different wavelengths. I forget the details and that racist conspiracy nut is hardly worth the effort of doing a google search. As far as anecdotal evidence of past Arctic warming, those silly clippings from magazines are famous, poor Steve been laughed at on genuine science blogs for years.
Master of Space and Thyme says:
August 15, 2013 at 12:13 pm (replying to)
@dbstealey
“Well, I’m not upset. My response is: “So what?”
There are always anomalies. So what?”
Master of Thyme, being a genuine skeptic and having a membership in the JREF to prove it, declares that, having reviewed the evidence and all current trends of sea ice growth in the Antarctic, has come to the conclusion using the Precautionary Principle, that the 34 year growth in Antarctic sea ice is only continuing to accelerate and is now increasing at a confirmed rate of 1,250 Kkm2 in only 25 months, and anticipates the complete blockage of the Straits of Magellan and Cape Horn by sea ice in 15 years.
@dbstealey
I brought up a sea level authority in order to illustrate a real manipulation of a graph’s axis, try and keep up little feller. I could just imagine if this blog was to debate individuals from a real science blog, it would be a disaster of epic proportions. Of course it will never happen, there is no way this motley crew would have the courage to debate in an open forum.
[Reply: This is the most open internet science forum you will ever get. But please read the Policy page: those “starting flame wars may find their posts deleted.” Thread-jacking also violates site policy. Your comments are thread-jacking, and you are flaming everyone you disagree with. First warning. — mod.]
Ah, dear Master of Their Domain of Space and Thyme, I think the boys have just been playing with you, seeing if you’ll bite. They’re great Master baiters.
The Nils-Axel Mörner “tilted graph” is old news, covered many times here on WUWT, whenever someone brings it up like it’s a brand new smear. There’s a good comment here:
http://wattsupwiththat.com/2012/12/04/skeptical-science-gets-it-all-wrong-yet-again/#comment-1164567
This is the link to the paper in question:
http://www.21stcenturysciencetech.com/Articles_2011/Winter-2010/Morner.pdf
The “tilted graph” is Figure 10, which is captioned:
Got that? The sea level rise was all in the adjustments, the “tilted graph” showed the raw data, which showed no rise. Professor Mörner explains thusly in the text:
Got that, again? The corrections made for the reported sea level rise. As you can read in the text, the corrections are spurious. The “tilted graph” is what the data really say. Professor Mörner wasn’t being dishonest, he was restoring honesty.
Feel free to keep commenting, as long as the management can put up it. But given all of his defenders here, bringing up Professor Mörner’s “tilted graph” again shows you want to mass debate.
@RACookPE1978
I generally agree with everything in your last response to me.
@dbstealey
“recorded history” consists of the written record, which provides more reliable evidence for the effects of climate on humans.
http://en.wikipedia.org/wiki/Recorded_history
The “geologic record” only allows educated guesses as to how humans were impacted.
http://en.wikipedia.org/wiki/Geologic_record
The precautionary principle is a political idea. I’m not interested in talking politics. I am simply making conjectures, which are very much a part of science, and thus my responses are indeed credible.
“I try to keep an open mind. But I have yet to see even one verifiable scientific fact proving that human activity has any effect on global temperature. In all other areas of science, that would be enough to sink the AGW conjecture.”
Lack of physical proof does not falsify a conjecture. The fact that you think so says something about your “open mind”.
@kadaka
There are several more examples of Nils-Axel Mörner manipulating data and graphs, there were links to literally dozens of examples on real science blogs a couple week ago. I am not here to start a flame war, that seems to be your intention. I am sure I would be banned if I posted just the links that were at Tamino’s and Rabbet Run.
By the way, don’t you realize you now appear silly for denying the heat wave in the Arctic. First you claimed UHI effects from vehicles left running in the cold, then later you claimed it was because of holiday weekend plane traffic at a tiny hamlet of 14 hundred people. BTW, your unusual theory for the hot spell was noticed on some other blogs…lol
Master!
I disagree with your above optimism about the time it will take completely block the Straits of Magellan and the Cape Horn with Antarctic Sea Ice.
True, true, recent Antarctic Sea Ice area has been increasing at an ever-increasing rate. Further, as you fear, that increasing Antarctic Sea Ice will eventually block Cape Horn.
But, at what rate? Should you not use the most extreme increase in Antarctic Sea Ice, and not merely the most recent 25 months since the Antarctic sea ice anomaly went positive? Should you not extrapolate from the 2011 low point anomaly through the most recent high in 2013 of +1,250 Kkm2, and then conclude that Cape Horn will be blocked by sea ice in only 85 months? (8.8 years?)
As always, Mr Master, your continued quiet acceptance of your Arctic Sea Ice fears and lack of any evidence to the contrary as you continue posting of CAGW talking points about already-agreed-upon Arctic temperature records merely confirms the complete acceptance of these stated positions and calculations. Should you be caught or found in agreement with any CAGW beliefs or dogmas, the Secretary will disavow any membership in the JREF.
Master of Space and Thyme:
At August 15, 2013 at 12:50 pm you continue with your untrue smears saying
Rubbish!
Niklas did NOT do as you suggest as can be seen by anyone who reads the paper which I have repeatedly linked.
This “motley crew” includes Monkton, Morner (whom you have falsely smeared) and me each of [whom] has provided guest articles on WUWT. We each welcome open debate from which warmunists run and hide; for example, we spoke against the motion “This House Believes Global Warming is a Global Crisis” at the St Andrews University Debating Society. And we defeated the motion (easy really, because all available evidence refutes it).
But climate porn blogs censor comments they don’t like so it is not possible to provide scientific information on them.
Now, why have you not yet provided your apology?
Richard
[Snip. Labeling our host as “blatantly dishonest” is strike two. You need to take some time off and cool down. — mod.]
[Snip. Also stop labeling other posters as being “dishonest” simply because you disagree with them. — mod.]
Oh, I’m so sorry.
Since you have refused to provide any calculations or contributions to this thread, or others here at WUWT, and, since you have consistently and deliberately refused to answer any questions from any other person with anything but distracting talking points already accepted over the years by tens of thousands of readers at this site, I figured you would not mind if I wrote your half of the conversation about why you do agree that Antarctic Sea is expanding at a dangerous rate, and that Arctic sea ice is not a problem in the future.
@richardscourtney
“This “motley crew” includes Monkton, Morner (whom you have falsely smeared) and me We each welcome open debate from which warmunists run and hide”
I seriously doubt that you and lord M could summon the testicular fortitude to take on real scientists. There is a past incident regarding a debate that cannot be mentioned at this venue, that proves your assertion is far from the truth,
@RACookPE1978
You’re spinning so fast, I’m surprised your head hasn’t fallen off. I have been asking for an example of the alleged talking points and nobody can specifically name one. It is obvious that you and the truth are not acquainted.
Master of Space and Thyme says:
August 15, 2013 at 1:20 pm
See! You do agree with me that you have presented nothing but already-agreed upon talking points.
But, enough about your much-repeated talking points. Since you have presented no evidence to the contrary, you must also agree with me that you desperately fear something about the recent loss of Arctic Sea Ice, and – since you have refused to offer any comments to the contrary – you must also agree with me that the future Antarctic sea expansion will prove to be a dire threat to the planet.
You and I do apparently disagree about what time frame the Straits of Magellan will be closed to shipping traffic by Antarctic sea ice. That’s fine, when do you think they will be closed, and what trends do you base your calculations on?
@RACookPE1978
I am getting annoyed by the constant lies regarding talking points, it is getting old.
Isn’t there a single blogger here that is capable of having an honest debate without resorting to lies?
RACookPE1978 says:
August 15, 2013 at 1:37 pm
You are using the argument from silence fallacy.
@RACookPE1978
“You and I do apparently disagree about what time frame the Straits of Magellan will be closed to shipping traffic by Antarctic sea ice.”
More lies, I have never mentioned anything about that topic and beside that, it isn’t the subject of this thread.
Master of Space and Thyme:
re your post at August 15, 2013 at 1:30 pm
http://wattsupwiththat.com/2013/08/14/the-early-chill-in-the-arctic-continues/#comment-1391240
So now I am not a “real scientist”?
Strange that I was not sacked over my 4 decades of employment as a research scientist. And it is funny how I was deluded into thinking my research conducted as the Senior Material Scientist of a national industry was real science.
You say I lack the “testicular fortitude” to take-on “real scientists”? Well, you clearly don’t know how real science is done.
Perhaps you were thinking about Monckton and me taking on climastrologists? If so, then they are the ones who lack the “testicular fortitude”, not us.
It seems you are having a temper tantrum. Never mind, it is natural for 3 year olds.
Richard
@Brian
Are the inmates here at Bedlam usually this wound up and detached from reality?
Well, now that you have agreed (by your continued silence after 54 examples of talking points (er, replies in this thread), you obviously must have either done the calculations yourself that prove continued Arctic sea ice loss in mid-September cools the planet or have accepted as fact the calculations done by others) that recent Arctic sea ice is not a threat, I challenge your lack of talking points about Antarctic sea ice gain, and so – of necessity – must continue writing your half of the on-going conversation.
I do however, strongly recommend you not merely and silently and blindly accept calculations done by others – the proper response to any certified member of the JREF is, not to blindly accept abd endlessly repeat talking points (er, statements or studies) written by others, but to challenge such talking points based on your own research!
@Master
I’m on the side of reasonable conversation, which you clearly are not. Please stop pushing the rhetoric.
Just a reminder about arguing with fools…..
@richardscourtney
Perhaps you were thinking about Monckton and me taking on climastrologists? If so, then they are the ones who lack the “testicular fortitude”, not us.
You may need the drop mention of Lord M when talking about debates at this blog. Mr Watts may not appreciate it because of what transpired in the past. Hush, Hush, I am not allowed to talk about it, so maybe you better drop it for Anthony’s sake.
But, Master, I digress from your already-agreed-upon and much-repeated but distracting talking points.
If the middle and edge of the Arctic sea ice through the summer is at 80 north latitude, what difference does the mild warming 1200 kilometers away in central and middle of the Canadian tundra and forests have to do with the Arctic Sea ice retreat – which you have already agreed to will further cool the planet?
Oh – by the way, just what IS that pesky 55 year trend of cooling at 80 north latitude by the DMI actually measuring? Isn’t 80 north up around where the sea ice actually meets the Arctic Ocean waters?
Your continued silence indicates you agree with all statements and conclusions in the above.
EW3:
Sincere thanks for your reminder at August 15, 2013 at 1:53 pm.
However, engaging with the Master of Void and Cabbage keeps him here and avoids his disrupting other threads.
Richard
The biggest concern with the early chill in the Arctic may be the shortened growing season in the northern latitudes.
The DMI above 80 degree latitude average temp just dropped like a stone again. Looks like we may have one of the coldest Arctic summers on record. It also appears that the cold is working it’s way south. Looks like Alert NU, Canada will be below freezing for a long time to come. Also
further south Eureka, NU Canada is colder then normal.
This winter could be a doozie in the northern hemisphere.
@EW3
What about the record Heatwave that the Canadian north just experienced?
“Record heat wave bakes Canada’s North”
http://www.cbc.ca/news/canada/north/story/2013/08/13/north-weather-heat.html
MS&T says:
“You may need the drop mention of Lord M when talking about debates at this blog.”
I think not. Ever since Lord Monckton destroyed his opponents in a series of debates, no one in the alarmist crowd will debate him any more. Monckton has won every debate he engaged in, so now the only “debates” are the kind you are engaging in here, where you can be an anyonymous troll. No one on your side has the courage to debate Lord Monckton in an open, moderated debate, where both sides select the moderator and venue by mutual agreement. Your side got their heads handed to them in every debate. Now they hide out.
One example of Lord Monckton debating is here. I have several more examples if you like, just ask, and I will post them.
So now all “debates” over climate alarmism have devolved into your endless talking points and pathetic insults [eg: “little feller”; I’m 6’2″, 195#. What are you? And what is your mythical CV? You have no relevant education, do you? The fact that you won’t answer our questionstells us all we need to know about your lack of expertise].
If you can convince tamina, or anyone else, to man-up and debate Lord Monckton, I am all for it. Let’s put it on YouTube, where the whole world can see that your crowd is devoid of scientific arguments, and instead relies on talking points.
What do you think? Are you up for that? Even if you are, your people certainly are not: they have been tucking tail and running from any real debates for years now. Michael Mann comes to mind…
EW3 says:
August 15, 2013 at 2:01 pm
There are a couple of subtle but very troubling things in your short summary about this coming fall’s weather that you missed. Well, Master of Thyme also missed them as well, but I’ll not speak for him on these issues since you brought them up. 8<)
1. Additional open area (increased Arctic sea loss over "normal", or a larger "negative" Arctic sea ice anomaly) greatly increases the amount of evaporation from the Arctic. This increases heat loss from the water, but it adds those extra billions of tons of water vapor to the atmosphere. In mid-summer, it will condense elsewhere and fall from the skies as increased rain, fog, and dew. Not too much snow obviously. With the increased CO2 as fertilizer, this means a darker arctic land area, and more absorbed solar energy in the short summer months south of the Arctic Ocean itself. But in the early fall and winter, the increased evaporation means increased snowfall (and thus increased long-term ice and snow!) around the Arctic on the land between 70 north and 65 north. If any of that increased snow fall or ice does not melt over the shortened! summer months of the melt season, then the increased albedo down at 65 and 70north latitude WILL reflect more sunlight into space and further cool the planet. Curry has written about this, it is a sobering topic.
2. Open Arctic ocean waters radiate more heat into space: The top of sea ice very quickly assumes the Arctic air temperature, but the top cm or so of open ocean water is mixed with 2 degree water (or 4-6 degree C, depending on area of the Arctic and latitude) water from below the , and so stays at the nominal water temperature. Right? Thus,the top of a sea-ice-covered surface will rapidly approach the air temperature: +10 C, 0 C, -4 degree C, or -15 degree C)
OK. Assume that the "sky" temperature stays the same regardless of whether open ocean or sea ice is present. (This is a little bit of a stretch, but is close to the real world. Over long time, the T sky does vary somewhat depending on surface conditions.) SO, open water radiates long wave infrared energy to space based on the Stefan-Boltzman Law and the 4th power of the radiating surface. An open ocean water surface and sea ice surface have almost the same emissivity to long wave IR radiation, so the open water (being hotter than the sea ice surface) will radiate much more energy to the sky than the sea ice surface will.
3. Convection losses: The warmer open ocean water will exchange much more energy with the colder Arctic air by convection than will a sea-ice -covered surface. (As above, the sea-ice-covered surface rapidly assumes the temperature of the moving air; and the large thick mass of sea ice "insulates" rather effectively the ocean water under the sea ice from the cold Arctic air above the sea ice. )
So, each of the other parts of the thermodynamics of the Arctic Ocean (sensible heat loss, latent heat loss, and long wave radiated heat loss) ALL INCREASE when "additional" Arctic Sea Ice is lost.
When the Arctic Sea Ice anomaly increases at time of minimum sea ice in September, the planet cools further.
But don’t tell Master of Thyme: His silence indicates he already knows this, has fully and already agreed to these calculations, and will add them to his already-agreed-upon talking points.
Master of Space and Thyme
Am I correct in thinking that the JREF to which you have referred in a couple of your posts is the James Randi Educational Foundation? I have to ask as a) I’d never heard of it and b) Google throws up a couple of alternatives when JREF is typed in. Mind you, I am making the assumption that you are not a member of ” a private, not-for-profit organization dedicated to fostering the entrepreneurial spirit in Howard County, Maryland” or indeed “JapanReference” which seem to be the principal alternatives.
Whichever it is, may I thank you for pointing me towards JREF. Having spent sometime reading their website, I can honestly say that I haven’t had such a good laugh in years.
I was thrilled to read, for example, that “distinguished climate scientist Michael E. Mann” will be joining something called “The Amazing Meeting” where he will undoubtedly be enlarging on his contention that “many of those who simply deny that climate change exists, we don’t call them skeptics, because that’s not skepticism. That’s just denial or contrarianism. Now, skepticism is a good thing in science, but it means looking at all sides of an issue.”
I could scarcely contain myself when I read that someone named Steven Novella links “global warming deniers” with “mental illness deniers”, “evolution deniers”, “holocaust deniers”, “HIV deniers” and “germ theory/vaccine deniers” (whatever they are).
You may well write me off as a poor, deluded Englishman with such a serious lack of judgement that I regularly travel to the S.F. Bay area in the forlorn hope of being able to watch the Raiders actually win a game – that is your right ( and, bearing in mind the amount of money I’ve spent on this past-time over the years, you might have a point). On the other hand, anyone who admits to being a member of an organisation which regards Michael Mann as anything other than a charlatan is probably more deluded than I am.
Of course, if I’m wrong, and you are in fact engaged in fostering the entrepreneurial spirit in Howard County, Maryland, I humbly apologise and wish you well in your endeavours.
Either way, please don’t let yourself be put off by what you may regard as negative comments by some on this site. I, for one, will be looking out for more posts from you, as they are giving me such enjoyment.
@RACookPE1978
“If the middle and edge of the Arctic sea ice through the summer is at 80 north latitude, what difference does the mild warming 1200 kilometers away in central and middle of the Canadian tundra and forests have to do with the Arctic Sea ice retreat – which you have already agreed to will further cool the planet?”
I never agreed to it causing “further cooling of the planet” Once again you are making about claims about something I did not write, that is not being honest.
The recent warming extended far into the north and included the CAA, ESS and a large area of the Beaufort Sea.
I posted this map of temp anomalies on the first thread the proclaimed the sudden cold spell in the Arctic
http://img809.imageshack.us/img809/2263/3jnh.jpg
Besides that map I posted links almost daily for both 2 meter and 850hPa temp anomalies, but nobody seems to have noticed. They all cried it was talking points, as if the current weather could possibly be talking points. Anyway, you’re wrong when you claim that the hot temperatures did not extend all the way to the Arctic Ocean, the CBC link corroborates the claim I have been making for the last week regarding this Arctic heatwave.
@dbstealey
The debate result: “That this House would put economic growth before combating climate change” by 135 votes to 110. Not the same as a debate over alarmism in itself. To claim so is a false dichotomy.
Also, he didn’t debate any scientists from whatI can tell. Just a few policy people.
Oh, but you have agreed to it! Didn’t your 56 talking points already include it?
Or did I miss your calculation someplace which clearly shows some sort of warming from increased Arctic sea ice loss in September?
Mr Green Genes says:
August 15, 2013 at 2:30 pm
Please do not worry about the Master of Thyme’s membership in JREF: ALL of the Secretaries (DOE, DOD, Dept of Interior, Dept of State, NASA, NOAA, and EPA and everybody else) has denied all knowledge of his talking points, and further, the entire administration has denied all scientific debate about any all all forms of CAGW. Galileo is being imprisoned by the Inquisition (er, the Master’s government) as we speak!
@RACookPE1978
Name a single talking point, just one example for the genuine skeptics that may happen to read this thread. You can’t name any because I have been very careful not to make any comment that was based on anything other than current weather and ice conditions.
And as far as warming from increased Arctic sea ice loss, that is another straw-man. I never made any such claim. Show me where I made the claim.
@RACook
You listed all of the negative feedbacks of Arctic ice melt but not the larger positive feedback of increased insolation. Also, the thin, rapidly growing young ice will diminish the effects of each of your three negative feedbacks as the winter months advance. If in the future the multi-year ice pack melts out, the duration of insolation to open water will increase, while thin winter ice may remain and hinder outward radiation and evaporation.
Master of Space and Thyme says:
August 15, 2013 at 1:49 pm
@Brian
Are the inmates here at Bedlam usually this wound up and detached from reality?
>>>>>>>>>>>>>>>>>>>>>
Just exasperated at the parasites who want to suck us dry while the clueless keep telling us it is ‘For our Own Good’ After fifteen years and more of continual political bupkis despite the constant barrage of facts from science proving the politicians and their buddies are lying through their teeth you get a bit short tempered.
Q: How do you tell if a politician is lying?
A: If his mouth moves, and especially if what he is telling you moves money from YOUR wallet to the wallet of his buddies.
“Green Energy” companies funded with tax payer dollars are going bankrupt at an alarming rate So far, [thats] 34 companies. Be interesting to see the bank balances of the principles before and after would it not? Reminds me of Maurice Strong and the killing he made on Molten Metal Technologies thanks to his good friend Al Gore hyping the company on the First Earth Day. The people he scammed sued and Congress investigated….
Green Energy fluctuates so indoctrination is absolutely necessary to carry out the government’s plans to get the Smart Grid installed and accepted and to get people to volunteer to buy or retrofit their appliances so the power companies can shut them down at will.
The Financiers of course are jumping for joy because a whole new industry has been manufactured out of thin air. ( Broken Window Fallacy anyone?)
Yet the blinder than blind can not see this is a money making scam.
Hi Brian:
1. If you are asking me to post more Monckton debates, I will be happy to do so. Just ask. And note that I was only responding to the debate comment, not to one specific kind of debate
2. Note that many folks ‘debating’ here are not scientists, either
3. If you can suggest a way to get Michael Mann, or Kevin Trenbert, or Briffa, or Jones, or Schmidt, or any other climate scientist on the alarmist side to debate, I’m all ears.
But the fact is they won’t debate. They refuse. They hide out, and they will not even respond with any reasoning. They debate using proxies like our spice master here, and Algore.
Only skeptical scientists will debate. Lindzen, Christy, etc. But you cannot have a debate with only one side present.
In real science, debate is expected. It is healthy. It brings about an increase in knowledge. So maybe you can explain why only one side of the question refuses to either debate, or to provide their data, methods, methodologies, etc.
I know the answer to those questions. But I’d like to get your views.
Brian says:
August 15, 2013 at 2:35 pm
Ah, but even Master of Thyme agrees with me that politicians do NOT decide on matters of life and death and taxes and energy policies and funding for scientific research and future scientific salaries and environmental policies and regulations based on scientific facts, but on what the their selected few policy makers PERCEIVE is the truth about scientific facts and studies!
Thus, in the political world, perception and impressions and images and propaganda and talking points ARE the truth. Convince the politicians, and it doesn’t matter what the public thinks or what the scientific facts are – as proven by the Master’s governments in the UK, US, California, NY, etc.
To go back to Master’s government condemning Galileo to his dogmatic and stubbornly non-inquisitive Inquisition, it does not matter whether the earth revolves or not: The Master’s government has declared as a matter of policy that their version of the globe is the center of the universe, and all of the universe revolves around the Arctic Ocean’s ice reduction!
[snip] you know the real story regarding debates and Chris M, don’t be so disingenuous. I am not allowed to post the truth because I was told it would result in being banned from this blog
Brian:
re your post at August 15, 2013 at 2:35 pm
http://wattsupwiththat.com/2013/08/14/the-early-chill-in-the-arctic-continues/#comment-1391330
that says
I was not at that debate but I spoke at an earlier debate where I, Morner and Monkton spoke to oppose the motion that “This House Believes Global Warming is a Global Crisis” at St Andrews Uni.
Clearly, that earlier debate was about “alarmism in itself”. And we defeated the motion but only by 3 votes.
In that earlier debate the proponents of the motion were “a few policy people” because the organisers failed to obtain any alarmist scientists who were willing to debate. If they refused then it seems likely that they would also have refused at the later debate.
This supports the contention of dbstealey that “Now they hide out”.
Richard
The Arctic temperature is continuing its downward trend: http://www.phrases.org.uk/bulletin_board/24/messages/1097.html
@dbstealey
I would love to see a debate. I think both sides would be forced to consider viewpoints they never have before. And I don’t believe it would be an obvious victory for either side. Are you aware of a debate of Monckton and scientists? I’m not sure I care about any others. An unbiased account is preferred. The post you referenced does not qualify due to (I assume) Anthony’s interjections.
I’m not sure if I think scientists should debate though. Debate skills do not equate to scientific skills. Also, I have to think there are instances where an alarmist won a debate (perhaps even against your mighty Monckton) and you are not aware of it. If that happened, do you think it would be mentioned at WUWT? It would be nice to have a neutral blog for open discussion. I can’t really find one though. As such, your questions are moot, which is why you already know the answer to them.
Brian says:
August 15, 2013 at 2:49 pm
Ah, but I was specific about the time of year:
1A. Show me by date, by latitude, and by time-of-day (and the logic of choosing each of these) your calculations, and your method for determining this “larger positive feedback” of increased insolation.
1B. At what day-of-year at which latitude does your calculation of heat gain (by increased solar insolation into the Arctic ocean) get smaller than the heat loss (by all types) from the Arctic ocean?
2. There is no “thin, rapidly growing young ice” between mid-August (when this effect of cooling the planet by Arctic sea ice loss overwhelms increased insolation) and the point in late September when Arctic sea ice reaches a minimum.
Gail Combs says:
August 15, 2013 at 3:01 pm
Gail! You are not repeating the Master’s peer-approved and agreed-upon-in-thread talking points! (Well, technically, you must always assert in this thread the disclaimer that whatever he doesn’t respond to, he must have already independently researched – as a Secretary-disavowed registered skeptical member of JREF – and therefore agrees with completely. )
You are a lovely and talented individual with much to contribute in this thread. Please do not introduce new talking points without assuring that the Master has agreed with them first.
@RACook
That’s true about policy, but I’m just not interested in discussing politics. So I have no quarrel with you good sir.
Master of Space and Thyme:
At August 15, 2013 at 2:47 pm
http://wattsupwiththat.com/2013/08/14/the-early-chill-in-the-arctic-continues/#comment-1391349
you assert
Say what!?
Having refused to apologise for your untrue, unjustifiable and off-topic smear of Morner you now claim you did not do it!
Congratulations. Your assertion has proved I was wrong to have thought I could not have a lower opinion of you.
Richard
@richardscourtney
I made no smear. Are you claiming the graph was not tilted to hide the increase in sea level?
@RACook
1A. No thanks. This is a blog comment section. I will discuss, not calculate.
1B. I have no idea. I never claimed to.
2. True, but there is from October through March, when outgoing radiation is greatest.
And specifying the time of year for only your feedback descriptions but not for your prediction of an overall cooling planet is quite misleading, yes? Why did you not include the feedbacks for the rest of the year?
@richardscourtney
The mention of the graph was in response to DB’s assertion of what constituted a fraudulent graph. I showed him that example to illustrate what was really a manipulation of a graphs axis to counter his petty claim regarding the PIOMAS graph’s starting point.
Brian says:
“I would love to see a debate.”
Good for you. But I don’t understand this: “The post you referenced does not qualify due to (I assume) Anthony’s interjections.” Anthony has not gotten involved as far as I know.
You say: “I’m not sure if I think scientists should debate though. Debate skills do not equate to scientific skills.”
I can’t agree. Because there are NO well known alarmist scientists who are willing to debate [not sure about everyone in the world].
If a scientist is incapable of defending his hypothesis, ideas, reasearch, data, methodologies, etc., in a debate, then maybe he/she is overpaid, and should find another line of work. Do you think Richard Feynman would have run away from a debate?
No, they will not debate for one reason: they cannot defend their catastrophic AGW hypothesis, and they don’t want the whole world to see them fail.
Finally, you’re right that I probably don’t know about every debate. But if there were debates won by alarmist scientists, I have a feeling that skeptics would constantly be hit over the head with the results.
“Master of Space and Thyme”
I ask you in all seriousness:
Do you have a job? I mean, a productive job where you work for a paycheck?
Or is your job to make nonsense comments on blogs, composed of endless talking points?
[Because] that is exactly what it looks like. Anyone who makes more than five dozen comments on one thread, constantly arguing with everyone else, asking endless questions but never answering any questions, is either living off the sweat of someone else’s brow, or is paid to run interference, or has mental problems.
So which is it?
Master of Space and Thyme:
re your post at August 15, 2013 at 3:16 pm
http://wattsupwiththat.com/2013/08/14/the-early-chill-in-the-arctic-continues/#comment-1391386
Firstly, you lied when you said
Morner’s work was about neither. You introduced it to make an untrue smear,
Secondly, you ask
YES, YOU IDIOT!
The graph was tilted to show what it would look like without the unjustifiable alterations.
IT WAS NOT TILTED TO “HIDE” ANYTHING: IT WAS TILTED TO SHOW SOMETHING.
Your claim is a blatant and deliberate smear. It is a blatant lie
Read the paper or – that being beyond your capabilities – see Figures 8 and 9.
I dislike untrue smears of me. I am enraged by untrue smears of friends.
Richard
@richardscourtney
Why was it tilted?
From Master of Their Domain (of Space and Thyme) on August 15, 2013 at 1:10 pm:
But now you refuse to post them. “There were dozens of pink elephants in that field. I can’t show you any photos of them, but trust me, they were there!”
Oh please, links to them get posted here often enough. They’re good for a laugh. But by refusing to post them, citing fear of getting banned, you conveniently deny us the opportunity to debunk them direct or search for where they’re debunked elsewhere. “I can’t show you the photos, they’ll kick me out of here, but trust me, those photos are proof!”
Don’t you realize you’re looking silly for being a LYING SQUIRMING WEASEL?
http://wattsupwiththat.com/2013/08/08/according-to-this-dmi-temperature-plot-the-arctic-has-dropped-below-freezing-about-two-weeks-early/
Here you tried to claim “anonymously hot” weather around the coast, which would be temperature readings at settlements which have UHI-type problems. I wanted satellite data. You tried to foist off an anomaly map, which is apparently a favored tactic of yours. Which could only show it was “anonymously hot” relative to the averaged 1901-2000 period, which is meaningless.
I didn’t deny the heat wave, I asked for proper data. You never provided it. You weaseled around, squirmed around. And now you lie. BTW, crosspatch explained how those temperatures weren’t unusual.
UHI-type effects. Too-high temperature readings from vehicles idling too near to the thermometer is a known occurrence. In polar regions, where you can get lost in blinding snow just feet from your door, the thermometers tend to be close to the housing and can be affected by heat from the buildings.
And now you LIE YOUR IGNORANT WORTHLESS ASS OFF AGAIN by saying I claimed that high was BECAUSE of the airport. I clearly said:
Correlation, not the causation you’re trying to attribute to me YOU VIRULENT PESTILENCE-OOZING LYING PUSTULE.
My reputation is promulgated by my enemies, the tales freely disseminated. In time they shall repent their disbelief and bow before my greatness. I am legend.
” think not. Ever since XXXX XXXXXXXXX destroyed his opponents in a series of debates, no one in the alarmist crowd will debate him any more.”
That is not true and I can prove it, but unfortunately it will result in my being banned and the comment being removed.
How does kadaka’s post make it through moderation, with all-caps bolded insults? It is very difficult to sift through all the emotional rhetoric and find worthwhile discussions on this site sometimes.
[Reply: WUWT does not censor comments if at all possible. The commenter in question documented his claim that he was being accused of untruthfulness. — mod.]
MS&T says:
“That is not true and I can prove it”
So prove it. But no game-playing: legitimate scientists or public figures only. No off-the-wall wackos with a vendetta. Lord Monckton’s opponents are scientists like Mann, Schmidt, Jones, etc. I wouldn’t debate Mickey Mouse, and I don’t think Lord Monckton would, either. Mickey, you see, is too far below the Lord.
So, ‘prove it’.
Master of Space and Thyme:
You ask me at August 15, 2013 at 3:35 pm
http://wattsupwiththat.com/2013/08/14/the-early-chill-in-the-arctic-continues/#comment-1391411
I and others have repeatedly told you in this thread. Indeed, kadaka (KD Knoebel) at August 15, 2013 at 12:53 pm
http://wattsupwiththat.com/2013/08/14/the-early-chill-in-the-arctic-continues/#comment-1391186
gave you a link to a WUWT discussion of the matter.
READ HIS POST.
I have provided a link so you can jump to it with a click of your mouse.
He gives you an explanation and a quotation from Morner’s text before concluding his explanation to you saying
But I recognise why you cannot understand that. Your posts demonstrate that you don’t know what honesty is.
Richard
Brian says:
August 15, 2013 at 3:18 pm
A careful and considerate- though cautious! – reply , thank you.
My calculations do extend through the entire year, though my day-by-day calc’s for net Arctic and net Antarctic Ocean heat exchange results are concentrated in the melting season for the Arctic.
Arctic Sea Ice loss is the ONLY “evidence” now available for the Master’s CAGW dogma: everything else and all other data the past 16 years refutes their claims of catastrophic results of their assumed continued “global” warming. Thus, the CAGW community and governments are desperate to maintain their propaganda about Arctic Ice loss.
So, the necessary and essential question to ask is: what is the current result of any loss of Arctic Sea Ice loss? As I asked above, deliberately quoting our Secretary of State: “What difference does it make?”
To answer this question, you need to determine where the Arctic Sea Ice is now (current world) and at what time of year is it at that position (that latitude?)
If there is a change (an anomaly) from the today’s world, where does that change from the normal Arctic (and Antarctic!) sea ice occur, and when does it occur?
At that position of the change in Arctic Sea Ice that you are interested in, what is the actual solar radiation possible at that latitude, and, over a full 24 hour day, what is the ACTUAL clear-day and cloudy day potential solar radiation at the top of the sea ice surface?
Of this potential radiation at this latitude, on the top of the Arctic Ocean, or Arctic Sea Ice, how much of that potential solar radiation is direct radiation, and how much is diffuse radiation?
Of the potential direct radiation, and potential diffuse solar radiation, at this latitude at this time of day on this day-of-year, how much will be absorbed by the open ocean waters, and how much will be reflected from the sea ice? Albedo of sea ice and of open ocean water are NOT a constant (despite what Connelly’s oft-edited Wikipedia says) but changes over the day-of-year, with solar elevation angle, and with wind speed. These changes have been investigated, and they refute completely the conventional wisdom of the Master’s government policy dictators denying climate change in their Un-inquissitive Inquisition.
What is the air temperature over the Arctic Ocean on the hour-of-day on this day-of-year, what is the sky temperature, wind speed, and humidity
Net: Solar insolation gains into exposed open ocean IS greater than net losses in June and much of July for Arctic OCean latitudes between 72 latitude and the Pole. Once past those few weeks, losses from open water are greater than the little gain that is calculated (and actually measured!) and through the rest of the year (about 9-1/2 months), open Arctic ocean’s lose heat when compared to ice-covered Arctic waters.
Does “early” melted ice in the Hudson’s Bay change temperature of the water by insolation? Absolutely! But, does it matter? Hudson Bay loses ALL of its ice every year anyway. There is no net loss of of Arctic sea ice, and no “death spiral” due to its melting. It has already melted each year, and will probably continue to melt every year. South of 82-83 north latitude, all Arctic ice melts anyway by mid-September. There can be no Arctic death spiral from ice that regularly melts each year. ONLY can a “death spiral” continue or be feared if it results in more Arctic ice melting.
The opposite is true in the Antarctic: At the much lower latitudes of the Antarctic sea ice edge between 71 south and 61 south latitudes, the solar elevation angles are much higher every day of the year, and the reflection of “new” sea ice DOES MATTER to planet cooling changes. But at 83, 84, or 85 degrees north when this ice might actually melt in the future?
Nope. The loss of Arctic Ice increases cooling.
@dbstealey
In the WUWT post, there were bracketed interjections within the debate narrative. I assumed those were Anthony’s thoughts, but I could be wrong.
I could be wrong about Monckton’s or climate debates in general as well. I certainly don’t form my opinion based on them.
Brian:
re your post at August 15, 2013 at 3:44 pm.
I thought the post by kadaka (KD Knoebel) at August 15, 2013 at 3:38 pm was quite restrained under the circumstances.
Just saying.
Richard
Brian says:
“…there were bracketed interjections within the debate narrative. I assumed those were Anthony’s thoughts, but I could be wrong.”
I could be wrong, too. But IIRC, those were SPPI commentary.
@db
Would a respected Science journalist who challenged XXXX XXXXXXXX to a debate which he promptly ran away from out of when he found out he wasn’t dealing with a light weight count?
The clever journalist know of his opponents propensity to do a gish gallop, so when he offered to debate he chose a multi day online format so he could research and debunk any claims that were suspect. That is how a real skeptic would debate. To make a long story short, your man ran away from the debate and anyone who mentions that specific debate or even the name of the opponent gets sent down the memory hole at WUWT.
Master of Space and Thyme:
Why not post your apology for your smear of Morner instead of hiding behind more lies about other things?
Your post at August 15, 2013 at 4:05 pm
http://wattsupwiththat.com/2013/08/14/the-early-chill-in-the-arctic-continues/#comment-1391439
only consists of more lies.
They do not make a good screen.
Richard
@kadaka
My goodness, why can’t you accept the fact that it was hot along the Arctic coast? Do you believe the CBC was faking the story too?
MS&T,
Is your so-called “journalist” on the regular payroll of a ‘Science’ publication? I mean, is he/she paid weekly for doing a job as a journalist? If so, I can’t speak for Lord Monckton [whose name you amusingly appear to choke on], but speaking for myself, I would love to see more debates. Keep in mind that protocol requires mutual agreement on the Moderator, the venue, the audience participation, etc. One-sided ultimatums are a non-starter.
Of course, if whomever you have in mind has been personally obnoxious, or gone on one-sided attacks like that professor [I can’t recall the name — but it can’t be him, because he won’t debate either], then if I was LORD MONCKTON, I would let my attacker cool his heels for the next decade or two. Maybe three.
But if you can get the odious, name-calling Michael Mann, or the cartoonist Kevin Trenberth to debate, that would surely be a coup! A feather in your anonymous cap! A real accomplishment.
But don’t hold your breath…
richardscourtney
No lies, just the facts from reality without the heavy hands of the censors at the blog
Master of Space and Thyme:
Your apology is still awaited.
Take time out from posting rubbish and do something important.
Apologise for your untrue smear of Morner.
Richard
@db
He has worked for NPR and the CBC as an Asian correspondent and was worked in the print media for a couple decades. I believe he has a degree in physics, as well as journalism.
I have to X out your friends name because otherwise my comments go into moderation.
MS&T,
“…without the heavy hands of the censors…”
You wish. Nobody censors you here, even though they probably should for your repeated policy violations. Recall that you repeatedly labeled Anthony a “liar”. Is deleting that comment ‘censorship’?
No, it is not. As Anthony has said many times, this is his home on the internet. You do not have the right to barge in and call him a liar, just because he has a different point of view. That is entirely a reflection on your lack of character. It is not ‘censorship’.
Master of Space and Thyme:
I remind you that you have still not apologised for your untrue smear of Morner.
I am at a loss to understand how this could have slipped your mind. But you have been reminded now.
Richard
@richardscourtney
I will do better than that. I will spend a day researching and documenting his bad science. I already have done a google search and have 11 good leads so far.
MS&T,
I wonder why you feel it is necessary to carry the water of someone else? You are being an apologist for a secret person. How strange is that… unless you are him?
I have zero say regarding who Lord Monckton debates. The more proper question is this: why are Mann, Jones, and all the rest of those grant gobblers so afraid to defend their point of view?
Cowards all.
http://www.arctic.noaa.gov/detect/detection-images/ice-seaice-extent-sep2005.png
Here is the average ice extent in September, 2005. Extent came in at 5.6. Note that the NW passage was open.
Master of Space and Thyme:
re your post at August 15, 2013 at 4:22 pm
Before your “research” to find more untrue smears of Morner, you need to make your apology for your existing untrue smear of him that you have posted in this thread.
Apologise now. You can play with your friends on smear blogs AFTER you have done what is now required.
Richard
@DB
I was told by Anthony the very first time I visited this blog that no mention of either the cancelled debate or even the man’s name was allowed at this blog. My comments were removed, but being a real skeptik and well aware of the censorship here, I took screen shots. The owner of this blog then went on to claim that the issue was settled between the two men. It wasn’t, because the retired journalist posted a video refuting that claim
Good to see Mr McKinney or wipneus, or whichever denizen of Arctic Sea Ice BLog has wandered over here as MST. When I raised concerns about the reliability of PIOMAS over there, there was utter panic and denial and a banning of all further comment on its inaccuracies. Thank you dbstealey for your information on this subject.
The more comments that occur the more the message is true and hurting so I hope MST keeps posting as it shows you are winning the arguement
MS&T says:
Translation: “Yes, I smeared a respected scientist, but I refuse to apologize because I am a no-account who only posts talking points, and who accuses everyone else of my own failings. But I will look for similar no-accounts, and post their no-account opinions in order to attack a well respected scientist.”
That about right?
You are the same hypocrite who demanded only ‘peer reviewed’ authority because you couln’t answer a question. And you have no training or education like the person you smeared. But you intend to continue being a reprehensible no-account, with no education, and hiding behind a screen name? What a guy. Why is it that the alarmist crowd is populated by your kind?
Global sea ice anomaly positive 5th or 6th time this year and staying there. Time to make post on this Anthony?
Master of Space and Thyme:
Post your apology, not drivel.
Richard
This is really interesting … most of you, including the author don’t really understand the physical relationship between the salinity of water and its freezing point! I’m amazed lol
I hope you realize I was sent here to prove a point about the lies and censorship at this blog. Thanks for making my job so easy.
I have screen shots of all my comments to prove what a fraud this blog has become
BYE
MST,
Is “Angech” correct? Are you arefugee from a blog/echo chamber that is unable to generate any traffic? LOL! So you come here… and raise the traffic on WUWT. And all the while complaining of non-existent ‘censorship’.
That sounds like James Hansen claiming he was muzzled by GW Bush — after some 1,400 speeches. Could you be any less credible?
[and this is waaaaayyyy off topic and hasn’t one darn thing to do with this thread… your threadjacking is getting tirsesome, and you are now on premoderated status – only relevant comments will be approved per site policy – feel free to be as upset as you wish – Anthony]
MST,
Thanks for admitting we were excatly right about you. You were “sent here”, eh? I’m surprised you admit it. But they probably only paid you peanuts. That’s how it usually works with paid trolls.
Probably sent from some no-account blog that gets zero site traffic and is desperate to fabricate some sort of story.
And complaining about “censorship”, when you had your comment snipped for labeling Anthony a “liar”? Earth to spiceboi: you violated site Policy. That is not ‘censoring’ you, and more than five dozen of your comments that were posted prove it. Could you be any less credible?
If you want to see real censorship, use my name, and post on RC, or SkS, or Closed Mind. That comment will never see the light of day. If it does, it will be a first on all of them.
Also, as you know anyone can fabricate screen shots, so have at it. It’s easy-peasy.
Anyway, I think I speak for lots of folks when I say, “Good riddance, troll.” I’m just surprised you admitted it.
Master of Space and Thyme says:
August 15, 2013 at 4:48 pm
“I hope you realize I was sent here to prove a point about the lies and censorship at this blog. Thanks for making my job so easy.
I have screen shots of all my comments to prove what a fraud this blog has become
BYE”
=====
How pitiful…..”I’m not really stupid….I’m really somebody….I’m a secret agent”
I think Thyme is a vegetable isn’t it.
It might be a herb instead but it is certainly in a vegetative state.
Anyway, it ain’t growing on the Arctic sea ice right now with temps well below normal and well below zero.
When they could not tweak the PIOMASS input anymore (Al Gore ithms) to produce a lower volume and it started to rise there was widespread lamentation at your non favourite sites db
jon says:
August 15, 2013 at 4:47 pm
We (collectively) are aware of its effect, have looked at its effect in real time on sound path ray paths and temperature vs depth curves, and know its (very distant past) effect and its today’s values of salinity on sea water circulation. In earlier points, we discussed its effect on sea ice melt ponds at various times-of-year, and at various “depths” above and below the ice.
What particular part of salinity do you wish to discuss further?
Note that temperature now is running lower and dipping earlier than it did in 2005.
Bill Illis,
Yes, I’ve herb of Thyme before.
Lettuce discuss the matter further before this thread fennelly closes; I truly ask your sage advice: of watt parsely in thyme shall we stay whilst we dell in the subject?
Pamela Gray says:
August 15, 2013 at 4:26 pm
Thank you for the png.
It is “labeled” average” sea ice extent for September, identified as 5,600 Kkm2 of sea ice: Can you locate an image of the actual “outline” of the sea ice at actual minimum that year?
Coming late to this one, but surely any MST fans must realize that the warmists are somewhat welcomed here.
It’s called target practice.
philincalifornia says:
August 15, 2013 at 6:04 pm
Sire! I resemble that remark! By his explicit silence, Master has verified that he HAS researched ALL of the previous discussion and as a bonified and certified Secretary-has-denied skeptical member of the JEFD, he has certified that he HAS independently researched ALL of his previously-agreed-upon talking points, and needs no further “practice” before entering more talking points to be targeted.
“Record heat wave bakes Canada’s North
Temperatures 10 degrees above normal across Yukon, Nunavut and Northwest Territories”.
That is 10 degrees Celsius, about 18 Degrees Fahrenheit above normal.
http://www.cbc.ca/news/canada/north/story/2013/08/13/north-weather-heat.html
The NSIDC charts show continued Ice Melt and continuing reduction in Arctic Ice Extent and area.
nsidc.org/data/seaice_index/images/daily_images/N_stddev_timeseries.png
nsidc.org/data/seaice_index/images/daily_images/N_daily_concentration_hires.png
Umm…is it safe to come out now?
Meanwhile, back at the “North Pole Camera….”
Today temperatures bottomed out at -8.6 Celsius. (That is 16.5 Fahrenheit.)
Temperatures have since risen to -5.4 Celsius. (22.3 Fahrenheit.)
Winds are not coming from the bitter cold icecap of Greenland. Winds are from the north, crossing miles and miles of ice which cannot be slushy to have temperatures so low. Slush will have frozen and melt-water pools will be freezing, releasing latent heat in the process, but that latent heat isn’t warming things up much at all.
Roughly 100 miles north-northeast is another buoy, “Paws Buoy 975420.” It must be across a weak area of high pressure, for winds there are from the south-southeast. The temperature there is nearly the same: -5.3 Celsius, and falling. Temperatures at that buoy have been below the freezing point of salt water since August 10, and below the freezing point of fresh water for well over a week.
At the very least it should be obvious that a wrench is in the works of typical ice-melt, in that quadrant of the Arctic Sea.
Further thoughts at bottom-of-post update at http://sunriseswansong.wordpress.com/2013/08/06/north-pole-camera-one-pictures-polar-bear-tracks/
Kelly Manning says: “Eeek!! S-O-S! S-O-S! Mayday! Mayday!!”
[Well, maybe that wasn’t verbatim…]
To counteract Kelly’s terrible fright at the Arctic ice situation, here is the same info, except it’s for the Antarctic:
http://nsidc.org/data/seaice_index/images/daily_images/S_stddev_timeseries.png
http://nsidc.org/data/seaice_index/images/daily_images/S_daily_concentration_hires.png
See, Kelly? You can relax now. There’s nothing to be alarmed about. It’s all in your head.
From Master of Space and Thyme on August 15, 2013 at 4:11 pm:
Um, I just said above:
It was hot, which happens, not unusual. I asked for proper data. Granted it’s a bit hard to accept when the US Navy shows so much water surrounding the coast is below freezing, but that’s how it can go when the heat comes up from the south. Did you also not see what crosspatch had wrote?
That’s the problem when you do too much mass debating, it’s harder to see things. You have to stop rushing to the end and posting your victory. Take your time, be sure you know what you’re doing. Make your words glide straight and smooth, well oiled, before they slam home like steel. Then when you hit the button and eject your thoughts upon the internet, you’ll know it feels right, you had to do it. And you liked it!
Come on, shoot out those warm globs of thoughts all over the blank canvas of the internet and see what sticks. Come, oh Master, come!
Kelly Manning says:
August 15, 2013 at 6:51 pm
Hi Kelly! Robt waves very friendly-like. 8<)
(Are you here jest in Thyme two? ) Remember the rules of the game for this thread, what comment you do not respond to, you have independently researched, and have completely agreed with as stated.
Yes, we all agree that the tundra and forests 1200 km south of the Arctic ocean shore have warmed up this summer. Seems like they often do that though.
By the way, what is the measured water temperature up under the edge of the Arctic sea ice today? How much did change from yesterday's or last weeks or lastyear's "average" for this week in mid-August?
What do you fear from any potential Arctic Sea Ice decline? Thyme says (by emission and omission) that he either fears everything or doesn't fear it all because declining sea ice from the past few years of minimum sea ice in September don't really mean a thing. If not more cooling.
Master of Space and Thyme says:
August 15, 2013 at 4:22 pm (replying to)
@richardscourtney
Neat!
I have 32 peer-reviewed papers on open ocean albedo alone already copied, and 96 more on Arctic sea ice and heating and weather and other stuff. What can I help you research?
Oh. By the way, none of these papers support your talking points. But you knew that already, because you agree with all of our earlier statements.
RE: Retired Engineer John says:
August 14, 2013 at 9:33 am
I’d like to thank you for your comment, early on in this discussion. It really got me thinking about the dynamics of the refreeze. While I think Dr. Wadham’s idea of the entire water column needing to chill right down to the pycnocline has merit, (and have seen some neat video of ice freezing below the ice and slowly floating upwards that seems to affirm that concept,) I think other factors can come into play as well, not the least of which is that the pycnocline needs to be punctured by sinking brine in order for thermohaline circulation to occur.
Dr. Wadham’s ideas are wonderfully elegant, and likely explain a lot of what occurs during a refreeze, however as engineer I’m sure you know “a lot” isn’t always good enough, as reality tends to to throw a wrench in the works of well thought out ideas. (Murphy’s Law)
There is stuff going on during this current refreeze that seems to break certain rules, and that baffles me. Therefore I am casting around for ideas such as your idea about the power of hydration energy. Another idea involves the fact salt water does not necessarily need to sink before it reaches it’s freezing point when cooled, if it is in contact with ice already floating and already below the freezing point. (Think of the complex problem created when a falling freshwater snowflake at just below the freezing point lands on saltwater just above the freezing point; will the snowflake melt or will the saltwater it lands on freeze? Besides the hydration energy you have to factor in the latent energy of the phase change from ice to water or from water to ice.
Straining my mind about this stuff is great fun, but I doubt I am close to any sort of answer. (I thought I had it all figured out at one point, but then I rolled over and woke up.) In any case I really appreciate your attitude and what you add to the discussion.
RE: RACookPE1978 says:
August 15, 2013 at 3:50 pm
While I listen with interest to your political ideas, what I find most cool are your ideas concerning direct and indirect sunshine, and the whole matter of albedo. You’ve done some hard work there, and I thank you for sharing.
It would be nice if we got paid for all this hard work we are doing, but it is likely “our reward is in heaven,” and therefore we might as well just enjoy the fun of seeing truth as it is displayed to us by nature here on earth. Witnessing such truths is a joy which those who distort truth for political ends know nothing about. Sort of sad, when you think of it. They are impoverished, yet think that makes them better off.
http://earthobservatory.nasa.gov/Features/WorldOfChange/sea_ice.php?all=y
Sea ice minimums. Click the “show all” button if they don’t all show up. Scroll down to September minimum 2005.
Thanks for the entertainment guys. Reading this thread has been like watching a playground fight in slow motion. But why don’t you swap email addresses or phone numbers, and continue behind the bike sheds
The question we should be asking is has anything changed in the process of collecting the data and producing the graph to cause this marked drop in temperatures. It is definitely the question that would be asked if the current year had stayed above the average line all summer instead of below it. Were stations dropped or added? Or “corrected”
Excellent point Skeptic. This is an unusual trace compared to all the archived traces from previous years. None look like the current one in terms of crossing/not crossing the average trace during the melt season.
Noticed Arctic Sea Ice forum hero member Chris Reynolds asking why the cause of the muted melt of 2013. Was hoping Mosher as an interested lurker could help enlighten him as I am not able to comment there. The cause is well known. The arctic sea temperature is colder under the ice so there is less melting. The sea is colder because the currents coming into the arctic are colder this year. Poor Chris feels it is due to changes in air temp and pressure, the dipole thingamajig , not realising that this is an effect of, not a cause of ice melt .
Nev is a Hero member as well.
MST may be a newbie member, (it is ranked) trying for hero status.
Keep an eye on Antarctic ice. It’s nearing last years record and still has a month to go. 2013 might be shattered by a mile…
RACookPE1978 says:
August 15, 2013 at 3:50 pm
To your point about the 24 hr day, any single location will only have the Sun directly overhead for a few hours, after that the angle increases and more of the incoming Solar energy get reflected as glare.
refreeze of the arctic will follow as predicted
http://wattsupwiththat.com/2008/03/16/you-ask-i-provide-november-2nd-1922-arctic-ocean-getting-warm-seals-vanish-and-icebergs-melt/
Sounds familiar? Back then, in 1922, they had seen that the arctic ice melt was due to the warmer Gulf Stream waters. However, by 1950 all that same ‘lost” ice had frozen back. I therefore predict that all lost arctic ice will also come back, from 2020-2035 as also happened from 1935-1950. Antarctic ice is already increasing.
http://blogs.24.com/henryp/2013/04/29/the-climate-is-changing/
From Angech on August 16, 2013 at 8:20 am:
I Googled for that forum, think I found it:
https://forum.arctic-sea-ice.net/
But my browser won’t let me go there. Invalid Security Certificate, appears registered to the hosting service’s server and not the site.
When I consider adding an exception, it says “This site attempts to identify itself with invalid information.”
This is puzzling. But I see in the search results this forum was started by Neven Curlin, “associated” with his Arctic sea ice blog. Then warnings about the site supplying “invalid information” make more sense.
Neven’s “Arctic Sea Ice Blog” is a hotbed of warmist lunacy, all cheerleading for the end of the world as we know it so they can wallow in their righteousness and catch some of that tax funding. But Gaia is not following their little script, darn her!! And now on the Ides of August I see Arctic temperatures are plummetting, et tu Gaia! All those rainwater ponds near the pole that Neven’s acolytes have been praying praying praying would be a harbinger of the ice cap’s demise, are re-freezing. Because of that, the sea ice area graphs show (shock!) sudden flatlining and even rising as the warmista graphers rush to CYA. Don’t look for Mosher to lend any knowledge there, as he writes there “this is a wonderful place to learn”, HA HA.
And the early chill grows deeper. Today,s falling DMI N of 80 is turning into a ‘nosedive’. I just thumbed through all of the years, and there is nothing even close to what this graph is showing for 2013. Only 2009 and 2010 show a little wiggle of difference that could be interpreted as the beginning of a slide to cooler temperatures earlier. At the same time the Antarctica,s daily graph is also showing a steeply rising line, for the sea ice growth.
MiCro says:
August 16, 2013 at 11:35 am (replying to)
RACookPE1978 says:
August 15, 2013 at 3:50 pm
At that position of the change in Arctic Sea Ice that you are interested in, what is the actual solar radiation possible at that latitude, and, over a full 24 hour day, what is the ACTUAL clear-day and cloudy day potential solar radiation at the top of the sea ice surface?
Probably nothing can so clearly show the difference between actual near-Arctic solar energy received and “nominal” near-equator solar energy received as Dr Frank Bason measurements on voyages in 2006:
Solar Radiation Measurements from Greenland to
Antarctica – Optics Table Data from the Danish
Galathea III Expedition 2006-2007
The plot for Accra, Ghana shows 8x consecutive days of clear sky, 975 watts/sq meter.
The plot for Uummannaq, Greenland (latitude 70.7, Oct 10-Oct 19, days-of-year 283 – 294) shows 10x days of decreasing radiation, beginning at only 180 watts/meter, ending at only 92.
And that 92 watts/sq mtr was at noon, on a clear, calm day. At noon. The rest of the 24 hour “day” was even lower, and was -of course – zero or near zero from 4:00 PM through 8:00 AM. But heat loss continued the whole time: low-range radiation “out” , conduction “out” , and convection “out”, and no solar radiation “in” for 3/4 of the time.
See:
http://www.soldata.dk/%5CPDF%5CRadiation-Data-Frank-Bason-Riga-2007.pdf
It does seem like the impact of the polar storm has come and gone.
http://osisaf.met.no/p/ice_extent_graphs.php
Nz willy good to see you about. Mosher’s comment? Saw that too, at least they let him post and he might have been sarcastic. He is on our side but doesn’t know or want to admit it. Hence his angst.
The graph’s are good but the interpretations are monotonous and orchestrated.
NSIDC has the ice actually increasing today/yesterday while the average loss is about 55,000 km^2 in the average climatology.
Showing my bias, I hope the sea ice maintains the trends and leaves us with a significant recovery this year. It will help everyone come to grips with the issue that warming is far less than expected and should be downgraded. The Arctic sea ice was about the only thing which allowed the pessimistic forecasts to remain on the table.
Meanwhile, back at the “North Pole Camera…”
It got down to -8.0 Celcius again today. Rather than heading south towards Fram Strait, the camera is drifting northeast.
Something odd is going on up there. Usually I am content to stick with what I see from the camera’s view, but this year I’m starting to study other places. So I look at the DMI map of polar temperatures, to see if it is below freezing outside of the camera’s immediate neighborhood. Between yesterday (the 15th) at 00z, and today (the 16th) at 12z, roughly half the Arctic Ocean went from above freezing to below freezing. Don’t ask me to explain it. I can’t.
http://sunriseswansong.wordpress.com/2013/08/16/the-big-chill-sea-ice-version/
The currents have changed, the Atlantic current is going up the east coast of Greenland, so ice is not going out Fram Strait. Also, some of the crazy readings you are seeing are the satellite operators going into CYA mode — there is far more leeway in how the data can be interpreted than is publicized. Since the Arctic is not co-operating in the meltists’ game, the time has come for disorderly retreat.
“Bill Illis says:
August 16, 2013 at 7:10 pm
Showing my bias, I hope the sea ice maintains the trends and leaves us with a significant recovery this year.”
Bill, Living in semi-rural New England, I am concerned about this winter.
The low temperatures above 80 north we see via DMI, and the early low temperatures at northern CA weather stations has me thinking the ice/snow cover will expand early.
This tends to bring down temperatures in this area.
We’ve already had the coolest August I can remember around here. We’ve had nights in the 40’s!
Caleb,
Check out http://weather.gc.ca/
The temperatures in NU (places like Alert/Eureka/Grise Ford/Resolute) are all below normal.
The cold temperatures are descending to lower latitudes early this year.
In support of:
Bill Illis says:
August 16, 2013 at 7:10 pm
William:
The years that had record Arctic sea ice had exceptionally cold fall and winter temperatures. That is what is required to get the thicker sea ice.
As you note the warmists go on and on with comments concerning the reduction of both extent and thickness of the Arctic sea ice. If there is significant cooling due to the solar cycle 24 change it will be interesting to hear the explanations for a complete recovery of sea ice both poles.
There are multiple anomalies with the warming in the last 70 years and the last 150 years that cannot be explained by the general circulation models, assuming greenhouse gas forcing (CO2 and CH4) caused the warming. The sensitivity issue is likely the most important however the latitudinal anomaly is considered by some to be as important. The general circulation models did not predict high northern latitude warming. The Northern latitudes (ex-tropics) warmed twice as much as the planet as a whole and four times more than the tropics. (See Christy’s paper below for details.)
The latitudinal pattern of warming does not make sense from the standpoint of a greenhouse forcing mechanism as the greenhouse gases (all atmospheric gases) are evenly distributed in the atmosphere (the potential for warming is therefore similar for the entire global) and the actual warming is proportional to the amount of greenhouse gas in the atmosphere and the long wave radiation that is emitted to space at the latitude in question so the most amount of warming should be in the tropics.
The latitudinal warming observed is the same pattern that occurs in a Dansgaard-Oeschger cycle (there have been nine (9) cycles D-O in the Holocene) and the D-O cycles are known to correlate with solar magnetic cycle changes. Svensmark’s cloud modulation mechanism is stronger at higher latitudes due to configuration of the geomagnetic field so that mechanism could explain the latitudinal pattern of warming observed.
http://arxiv.org/ftp/arxiv/papers/0809/0809.0581.pdf
Limits on CO2 Climate Forcing from Recent Temperature Data of Earth
vensmark estimated that roughly 70% of the warming in the last 100 years was due to solar magnetic cycle modulation of planetary cloud. Svensmark’s estimated is supported by Shaviv’s analysis in the attached paper. Based on Shaviv’s analysis the range of global cooling due to the current solar magnetic cycle change is estimated to be 0.47C ±0.19C or cooling in the range of 0.28C to 0.66C.
http://www.eike-klima-energie.eu/uploads/media/Shaviv.pdf
On climate response to changes in the cosmic ray flux and radiative budget
In addition to Colorado mountain tops getting snow several times in the first two weeks of August – very, very rare! – Atlanta GA set a new record for the day: 64 (F) was the high!
I found a nice collection of polar view maps at: http://www.weather-forecast.com/maps/Arctic?over=pressure_arrows&symbols=none&type=wind
Meanwhile, at the “North Pole Camera,” after reaching the coldest temperatures of this August, -8.9 at 0000z this Saturday morning, temperatures at our buoy have risen to -1.1 at 1500z. (from 16 degrees up to 30 degrees Fahrenheit.) The camera shows fog. I think “warmer” air, (it is still below freezing, after all,) seems to be getting pumped north and then east by a big gale that passed south of Iceland is is heading north of Scotland. It is still very cold north of Canada’s northernmost islands and up to the pole itself.
The DMI “extent” graph, which everyone was fussing about when it showed a big plunge a few days ago, (shown at the start of this post,) now actually shows a small uptick:
http://ocean.dmi.dk/arctic/plots/icecover/icecover_current_new.png
Anthony’s “Sea Ice Page” is now in second place, among “top posts” at this site.
(Concerned melting-ice-watchers want to know.)
@Pamela Gray “Note that temperature now is running lower and dipping earlier than it did in 2005.”
If you note the temperature curve North of the 80th parallel has been lower than IT EVER WAS since records have been taken from 1958 from roughly the 140th day of the year onwards.
Way lower.
But the ice is not higher. This maybe due to the fact that the previous years ice was probably thinner than it ever was.
RACookPE1978 says:
“We (collectively) are aware of its effect, have looked at its effect in real time on sound path ray paths and temperature vs depth curves …. ”
You missed my point … I was commenting on the blog comments, not on our scientific understanding of the relationship between salinity and temperature on density (which is well established)! Please go back and look at them 🙂
Anyone know why JAXA hasn’t updated since the 16th?
As if by magic, caught up again. Steady as she goes …
http://postimg.org/image/q3klqw3lt/full