Guest Post by Willis Eschenbach
In a post here on WUWT, Nils-Axel Morner has discussed the sea level in Kwajalein, an atoll in the Marshall Islands. Sea levels in Kwajalein have been rising at an increased rate over the last 20 years. Nils-Axel pointed to a nearby Majuro tidal record extending to 2010, noting that there’s been no acceleration there. A furor seems to have erupted in the warmosphere over his comments, with folks like Tamino pointing out that we have tidal data for Majuro up until 2013, not just 2010 as Nils-Axel highlighted, and those final three years show higher rates of sea-level rise, so indeed there is acceleration there …
Bemused by the excess of heat over light, and dismayed by the battle over twenty-year sea-level trends, as a long time sailor and commercial fisherman with more than a bit of knowledge about tides, let me say that they’re all wrong, warmists and skeptics alike. Here’s the critical graph for any discussion of sea-level rise and fall:
 Figure 1. Confidence intervals for the estimation of sea-level rise using tidal gauge data. This means that 95% of the results fall between the two extremes. For twenty year trends, these are from a sea-level rise of three mm/year to a sea-level fall of three mm per year. See endnotes for the corresponding equation. SOURCE: Pacific Country Report, Sea Level & Climate: Their Present State Marshall Islands December 2010
The interpretation of Figure 1 is as follows. Let’s consider twenty-year trends in sea level rise. The uncertainty is 2.8 mm per year … which is about equal to the global average sea-level rise itself.
Now, twenty-year trends are convenient because trends of that length are under discussion by Morner and the rest. It’s also convenient because we have twenty years of satellite records, as well as twenty years of SEAFRAME records in Majuro. The uncertainty in Figure 1 says that IF there were absolutely no change in global sea levels over time, about one tide gauge out of every six would show the sea levels as rising between 1.5 and just under 3 mm per year over twenty years. Another one in six tide gauges would solemnly assure us that the sea level is falling between 1.5 and 3 mm per year over the same twenty years.
SO … if you see a couple of twenty-year trends from two tide gauges that differ by say four mm per year, that is an EXPECTED RESULT of the short length of the data. Let me explain why the uncertainty is so large, and then we’ll look at the Marshall Islands sea level data. The problem is the tides. The ocean tides are a driven resonant system. By “resonant” I mean that ocean water “sloshes” back and forth in the ocean basins, just like the water in a wide basin after you set it down. Each ocean basin has natural resonant periods. The driving forces are the gravity of the sun and the moon. They vary in a hugely complex cyclical motion, which sort of repeats only after over fifty years. The basins have long- and short-period “standing waves” on the surface, or rather waves circulating around a wandering “amphidromic point” where there is no tide. There is no known way to predict what the combination of driving force, natural sloshing, and standing waves will look like at any given point for a given ocean basin. As a result, you have to wait for at least 50 years to get an accurate reading of the rate of sea-level rise. With shorter records, the uncertainty rises rapidly, and with 20-year records, the 95% CI is ± 3 mm per year.
With that as a preface, let’s take a closer look at the sea level rise in the area. First, where are these mysterious “Marshall Islands”, and how many tide gauges in the Marshall Islands have records up to the present?
Figure 2 shows the location of the three tide gauge records in the Marshall Islands that extend up to the present. They are at Wake Island, Kwajalein, and Majuro. The Majuro tide gauge is part of the “SEAFRAME” sea-level measurement project.
 Figure 2. Location of Majuro (the capital), Kwajalein, and Wake Island in the Marshall Islands. Australia is at the lower left. Papua New Guinea is the large turkey-shaped island at center-left. The islands in the chain to the right of Papua New Guinea are the Solomon Islands
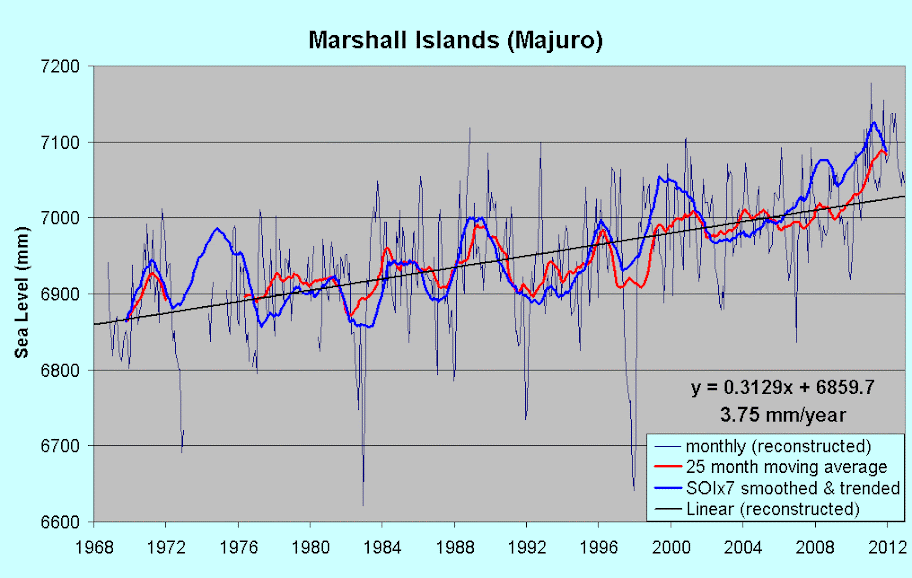
Now, what do we know about the sea levels at those points? Here are the three records. I’ve spliced together the recent and the previous record at Majuro (Majuro B and Majuro C), as they are nearly identical in their overlap periods. Here are the three records.

Figure 3. All available tidal records which extend to the present, Marshall Islands. Heavy lines show 6-year centered Gaussian averages of the data.
You can see the post-2010 uptick at the end of the Majuro record (red) that Tamino referred to. Now, the whole hoorah has been about the trend of the last 20 years in Kwajalein. The records for Kwajalein and Majuro differ by about 4 mm per year … remember what I said about 4 mm per year above? Not meaningful.
Now, we do have one other source of information about the sea level rise in the Marshall Islands. This is the satellite record. At the time of writing, you could find the satellite sea-level record for any spot on the ocean at the University of Colorado “Interactive Sea Level Time Series Wizard” (it currently says “Under Revision”). Figure 4 shows those results. I’ve left out the annual results this time, and just shown the Gaussian averages, so we can get a sense of the difference between the tide gauge records and the satellite records.
 Figure 4. Gaussian averages of the three tidal gauge records shown in Figure 3. In addition, the satellite records for the same location are shown, aligned to the average of the first five years of the common period of record.
I show the data from 1970 so we can compare recent records (last twenty years, back to the early 1990s) and early records (previous 20 years, early 1970s to early 1990s. Now, there are a few oddities here. First, although the satellite records generally “wiggle-match” the tide gauge records, the agreement isn’t all that great.
Next, of the three dataset pairs (satellite and tide gauge), two of the pairs (Wake Island and Majuro) end up together after 20 years. At Kwajalein, on the other hand, the tide gauge record ends up about 50 mm above the satellite record … the cause of this divergence is unknown. It appears to start in 2003, and it may be something as simple as the dock where the tide gauge is located slowly sinking into the sand … or not.
The most internally consistent data that we have, the satellite records, show little difference between the rise in Majuro and Kwajalein over the last 20 years. One is 6.4 mm, one is 7.4 mm … be still, my beating heart.
So Nils-Axel and Tamino are both wrong. We can’t conclude anything either way by comparing Majuro and Kwajalein. Their records are far too short and too similar.
Finally, how unusual are these three satellite-measured trends at Wake, Kwajalein, and Majuro, of 2.1, 6.4, and 7.4 mm respectively? Well, to answer that, I took the approximately half a million areas of the ocean for which the satellite has measured the trends from the University of Colorad, and made a histogram …
 Figure 5. Histogram of the sea level trends for each 0.25° square gridcell of ocean area from 89.5 North to 89.5 South.
Now, the trends shown in Figure 5 are 20-year trends. Recall from Figure 1 that the 95% confidence interval on tide gauge records was estimated at just under ± 3 mm. The 95% confidence interval on these satellite measured trends in Figure 5 is somewhat larger, at ± 5 mm per year. Note also that about 12% of the gridcells show a decrease in the sea level, and thus they have a negative trend.
Finally, you need to be aware that the trend that is shown by the tidal gauge data is NOT the rate of sea-level rise, for a couple of reasons. First, what you are seeing is the rate of global sea-level rise PLUS the tidal effect from the sun, the moon, and the shape and resonant frequency of the basin. The means used for removing those tidal effects is beyond the scope of this discussion (see Mitchell for details under “Asymptotic Trend Evaluation”). However, generally what has to be done is the 112 different major solar/lunar tidal components are estimated from a tidal record to date at a specific location. Then the “best guess” estimate of the combined tidal effect is subtracted from the observed change in sea level. What remains is the best estimate of the actual change in the underlying sea level, but it still needs to be corrected for the land uplift/subsidence.
So for example, the measured change in the sea level at the Majuro B (SEAFRAME) tide gauge was +5.6 mm/year 1993-2010. But after subtracting the tidal effects, it drops to 4.3 mm/year. And after removing land subsidence effects, the actual trend was estimated by the SEAFRAME folks at 3.8 mm/year.
To complete the circle, here are the Majuro and Kwajalein tide gauge and satellite records, aligned on their 1995-2000 averages.
 Figure 5. As in Figure 4, but with the Majuro records adjusted upwards by 59 mm so that they are all aligned on the average of their 19/95-2000 period.
SUMMARY: TIDE GAUGE AND SATELLITE DATA, MAJURO AND KWAJALEIN
• The early (1973-1993) and late (1993-2013) trends in Majuro were about the same.
• In Kwajalein, the early trend was about flat, and the later trend was quite steep.
• Given the close physical proximity of the two atolls, and the similarity of the two satellite records, one or the other of the tidal records may contain an error.
• After about 2003, the Kwajalein record wiggle-matches with the two satellite records. The Majuro record does not. On the other hand, after diverging from the two satellite records in 2003, the Majuro record ends up agreeing with them, while the Kwajalein record ends up ~ 50 mm higher than the other three. Go figure.
° The post-1993 Majuro tide gauge “B” is a modern design acoustic SEAFRAME gauge, and is presumably quite accurate.
• There is absolutely no statistical significance in the ~4 mm difference between the 20-year tide gauge trends for Majuro and Kwajalein. And the satellite trends, as you can see above, are nearly identical.
• In short, there is no evidence for or against an acceleration in sea-level rise in the three Marshall Islands records.
Best to all,
w.
DATA AND CODE: Spreadsheet is here … enjoy
UNCERTAINTY EQUATION—The empirical equation relating years of record (YR) and uncertainty (one standard deviation) is:
Uncertainty (mm/yr) = 0.102 * EXP( -4.939 * EXP( -0.02 * YR ) )
This says that with a fifty-year record we still have an uncertainty of plus or minus two-thirds of a millimetre per year, or 63 mm (2.5 inches) per century.
If a skater spinning puts their arms out their rotation speed slows.
If there is a sea level rise, then you must be able to detect it in the rotation speed of the earth.
If the gauges are on different sides of the islands, then presumably prevailing winds would have an effect linked to enso?
It might be a good idea to wait for a reply from Nlis-Axil Morner since he is still the world’s sea level expert.
Land movement can be different between two close oceanic islands which could explain the difference between these two Marshall (unrelated) Islands.
Nick says:
August 2, 2013 at 3:08 am
[snip]”If there is a sea level rise, then you must be able to detect it in the rotation speed of the earth.”
I don’t think so. Warmism (whether true or not) says that sea level rise comes from melting land ice. So the ice would be falling while the sea rises, pretty much canceling out.
(OT with apologies to Willis, please do note but do not respond)
Is Global temperature sensitivity for doubling of CO2 = 0.7C ?
Calculations from correlation of global land temperature to the geomagnetic Ap index indicates so as realistic possibility.
http://www.vukcevic.talktalk.net/Ap_LT.htm
Global Land Temperature (HadCru3) for the period 1880-1990 rose about 0.8C, it could be concluded that half of this is due to solar activity (via geomagnetic storms as measured by the Ap index) and the other half had to be attributed to all other factors including CO2 rise
Eustace Cranch 5:32
“I don’t think so. Warmism (whether true or not) says that sea level rise comes from melting land ice. So the ice would be falling while the sea rises, pretty much canceling out.”
The ice is at the poles, near the axis of rotation, water moves to the entire globe and, in fact, bulges a little at the equator, so the effect would be there. I don’t know if it would/should be detectable.
“They vary in a hugely complex cyclical motion, which .”… You have a few words missing from that sentence, Willis
[Thanks, fixed. It was late … -w.]
“They vary in a hugely complex cyclical motion, which . ”
I suspect there are some words missing from the above sentence.
Quite so Willis. Figure 1 should be memorized by all as it very well demonstrates the fatuity of short term trends.
“In short, there is no evidence for or against an acceleration in sea level rise in the three Marshall Islands records.”
This statement is incorrect. Figure 5 shows clear evidence for an acceleration in SLR after 1990.
The mean of 18 tide gauge records from the central Pacific also shows an acceleration after 1990:
http://oi41.tinypic.com/11ak7sh.jpg
The question isn’t whether relative SLR accelerated in the Pacific after 1990, because it did. The question is what this acceleration signifies.
lowercasefred says:
August 2, 2013 at 5:46 am
The ice is at the poles, near the axis of rotation, water moves to the entire globe and, in fact, bulges a little at the equator, so the effect would be there. I don’t know if it would/should be detectable.
=============
there was a graphic the other day showing sea levels rising in the western pacific and falling in the eastern pacific. clear evidence of a delay in the “extra” water from the pole getting up to speed, and being pushed by the eastward rotation of the earth in a westward direction. 🙂
Nick-
The speed of rotation of the Earth was very recently discussed here at WUWT-
http://wattsupwiththat.com/2013/07/11/length-of-day-governed-by-earths-core-processes/
So it appears that sea level rise/land ice melt/earth’s rotational speed would be a highly non-linear relationship and probably not a useful metric.
I think we should correct your definition/explanation of a confidence interval (see figure 1). A 95% confidence interval will cover the true value of the thing we are trying to estimate on 95 out of of 100 occasions that we compute it. Each of those 95 out of 100 intervals will be different. In some cases the true value will be slap in the centre of the interval and in some cases it will be near the edge. So you are not correct when you imply that 95% of results will fall between the extremes of a single interval.
I am slightly suspicious that all of your intervals are centred on 0, especially those to the left
I doubt that this affects the point that you are making
Thanks Willis. I came across a reference to the tidal effect of the moon alone rising the sea six feet when overhead, and the crust of the earth some 16-18 inches. What we experience as solid is a lot more plastic than one might assume, and is in constant flux from within and without. With all the modeling and guess work, measuring millimeters seems specious.
Roger Andrews says: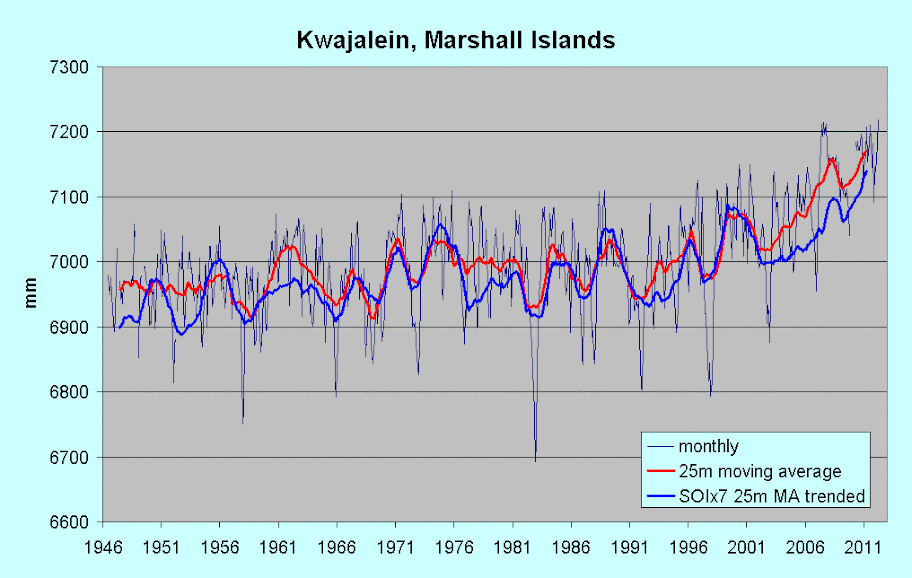
August 2, 2013 at 6:34 am
The question isn’t whether relative SLR accelerated in the Pacific after 1990, because it did. The question is what this acceleration signifies.
Indeed, and the answer’s simple – it’s ENSO. Sea-level at Kwajalein was trending down between 1976 and 1992, as SOI was trending negative. After then, SOI trended up to a positive peak in late 2010/early 2011, and has since dropped back to zero at present (June 2013). Sea-level has followed almost in lock-step, with an underlying upward trend, of course. Most south-western Pacific stations match those trends closely, including Majuro, Pago Pago, Pohnpei (FSM), to name but a few, and northern and western Australian stations also. Note the latter – it doesn’t chime in any way with what Mörner claimed here back in April.
Here are the relevant two, with an SOI multiple smoothed and trended added:
Kwajalein
and Majuro
Eliminating SOI by subtracting the multiple from monthly sea-level data removes the extreme lumps and bumps and the 1990s-present uptick entirely. I’m just about to post on both correlation and SOI removal, with Darwin and Fremantle included – the method works particularly well there.
Maybe it’s due to the missing heat hiding in the 700 to 2000 meter layer of the Pacific causing it to expand to 700.1 M, or thereabouts.
/sarc
johnmarshall says:
August 2, 2013 at 3:47 am
It might be a good idea to wait for a reply from Nlis-Axil Morner since he is still the world’s sea level expert.
———————————————————————————————
+1
studies of the effect of sea level rsie ( and ice cap melting) on rotational speed are out there.
One artcile in 1988 ( I forget the title) and this
http://www.scientificamerican.com/article.cfm?id=global-warming-shortens-day
@Willis:
I would be very interested in hearing more about areas where sea level is rising at an average 15 mm/yr. In 20 scant years, the sea level is reported to increase by a foot (~30 cm). What does that look like? Are these places anywhere near an island?
My bewilderment was why anyone would look at some islands and conclude anything. I ean, you are claiming that the Pacific Ocean is rising,which to me means it is rising EVERYWHERE. Look at
ocean levels all around the ocean on the shorelines, etc. if you want to determine Pacific sea levels. The ocean isn’t going to just rise at certain spots.
Nick, if you can gauge the change in length of a day to the microsecond, then please be my guest. That would very much be interesting. However, proving that it is due to sea level rise instead of any number of astronomical interferences or internal geological effects would be a challenge beyond the scope of possibility.
Actually I think there’s a point to expecting changes in earth’s rotation if sea level rises. Water from Ice melting in the polar regions would be assimilated into the oceans and shift the mass balance. On the other hand we have effects like humidity in the air creating a greater amount of drag against the surface and an increased mass of the oceans deforming the crust. Not an easy thing to fiddle apart.
How do the sea level data correspond to the altitude data?
I mean, there are probably Differential GPS stations at or near each location. Is it possible to compare the land “altitude” record from the GPS data to see if there’s any indication of subsidence/consolidation of the atolls themselves? Would this be unexpected, given that their formation is through hot spot volcanism?
Sea level rising across the pacific is not that daft an idea, given that the Pacific basin is (mostly) surrounded by subduction zones and is shrinking by 0.5km²/year according to the refs on wikiwassit.
Nick says:
August 2, 2013 at 3:08 am
“If a skater spinning puts their arms out their rotation speed slows.
If there is a sea level rise, then you must be able to detect it in the rotation speed of the earth.”
Yes. That’s LOD, Length Of Day.
http://tallbloke.wordpress.com/2009/11/29/planetary-solar-climate-connection-found/
Kwajalein atoll is a string of islands enclosing a lagoon. Between the islands the water is shallow with reefs nearly reaching sea level. During a low spring tide one can walk across the reefs from one island to the next in some spots.
According to the map below, the Kwajalein tide gauge is on the lagoon side of the island of Kwajalein (the southeasternmost and largest island in the atoll).
https://www.bodc.ac.uk/data/information_and_inventories/gloss_handbook/stations/111/map/%7Bmapdir%7D/
As I mentioned in the previous thread, there was an in-filling in of the shallows between the three islands north of Kwajalein in 2002, and this changed the inflow-outflow between the ocean and the lagoon. I don’t know how much it affected the tide gauge readings, but it’s probably not insignificant.
MostlyHarmless says:
August 2, 2013 at 7:40 am
… with Darwin and Fremantle included – the method works particularly well there.
=====================
It certainly sounds like you know what you are doing, but are you sure that you want to use Darwin? Daily tidal variations at Darwin are quite dramatic (as much as 8 meters) and any tidal component errors in sea level determination are likely to be much magnified there compared to other locations.
The Geo
Is it possible to compare the land “altitude” record from the GPS data to see if there’s any indication of subsidence/consolidation of the atolls themselves?
=======================
I think (opinion) that it’s possible, but not easy. It’s a geometry problem. Most of the time GPS satellites will be at low elevation angles and thus contribute mostly latitude/longitude information with only a little altitude information.
IMHO, tidal gauge data that isn’t backed up with solid altitude change information for the gauge is more or less useless for sea level change estimation. But I seem to be the only person who thinks that, so maybe I’m overlooking something.
Willis,
“I’ve spliced together the recent and the previous record at Majuro (Majuro B and Majuro C), as they are nearly identical in their overlap periods.”
Why do you continue to muddy the waters with superficial junk science???
Roger Andrews says:
August 2, 2013 at 6:34 am
Thanks, Roger. Figure 5 shows only two of the three Marshall Islands records. Overall, one record accelerated (Kwaj), one decelerated (Wake), and and the trend of one stayed about the same. Furthermore, because of the huge error in sea level rise from the tidal effects, there is no statistical difference between the three.
So no, Roger, those three records don’t provide evidence either way. That’s the whole point of my post. A 20-year tide gauge record has an inherent 95%CI of about ± 3 mm …
Roger, while I thank you for the information, I must say I despise the habit of posting uncited, unreferenced, unsupported results as you have done. Your cited graph is a great example of the kind of garbage I deal with daily. Which “18 tide gauge records” are they referring to? Where is the data? Is the average area-weighted, or not? What are the error margins on the result? Do all 18 stations run the full timespan? Have they combined SEAFRAME data with other data?
Since I can’t answer a single one of those questions from your graph, it goes straight into the garbage on my planet. It’s useless information, without patrimony or provenance, and as such is worse than no information at all.
Please, folks, if you are posting a graph, cite the source of the data or the graph. Otherwise, you’ll get roundly ignored, by me at least.
w.
Thanks, Peter. You say (emphasis mine):
pe51ter says:
August 2, 2013 at 7:22 am
I think we should correct your definition/explanation of a confidence interval (see figure 1). A 95% confidence interval will cover the true value of the thing we are trying to estimate on 95 out of of 100 occasions that we compute it. Each of those 95 out of 100 intervals will be different. In some cases the true value will be slap in the centre of the interval and in some cases it will be near the edge. So you are not correct when you imply that 95% of results will fall between the extremes of a single interval.
I don’t see the difference between your two statements. Both of them say the same thing, that 95% of the outcomes will fall between the extremes of a single interval, which is the 95% CI of ± 3 mm for a twenty year record.
What am I missing?
w.
arthur4563 says:
August 2, 2013 at 8:14 am
Curiously, the oceans do indeed “rise at certain spots”. Look at Figure 5. Heck, over the last 20 years about 10% of the gridcells have fallen, with negative trends.
Which is why I share your bewilderment at anyone grabbing one tide gauge record and proclaiming anything.
w.
The Geo says:
August 2, 2013 at 8:58 am
The SEAFRAME stations like Majuro all have an associated GPS. Other stations, like Kwajalein, do not.
w.
kuhnkat says:
August 2, 2013 at 9:43 am
Sorry, but there’s an ~ 7 year period of overlap. The correlation of the two datasets during the overlap period is 0.98 …
In addition, I’ve noted the splice procedure in the text, and provided the spreadsheet so you can see exactly what I did, and you can judge whether it’s a valid procedure or not.
Finally, I spliced them together because that’s what Tamino did when he made his claim. If I’m going to discuss his claim, then I need to follow his procedure.
What is “superficial junk science” about that, and why?
w.
JDN says:
August 2, 2013 at 8:11 am
@Willis:
I would be very interested in hearing more about areas where sea level is rising at an average 15 mm/yr. In 20 scant years, the sea level is reported to increase by a foot (~30 cm). What does that look like? Are these places anywhere near an island?
Would Australia count? This map shows the trend in SLR for ’92 to ’12 from sat altimetry
http://tinyurl.com/msltrends92-12
You may note that Australia and New Zealand are surrounded by quite a bit of red, although sea level measures form non satellite sources suggest something much different. This video of Dr. Willie Soon covers a number of arguments I have made in the past about why no one should get exited about sea level until something serious that has been above water shows indications of going under water.
To those who still can’t get past the notion that the seas of the world are anything but level
http://en.wikipedia.org/wiki/File:Geoid_height_red_blue_averagebw.png
and
http://bulletin.aviso.oceanobs.com/html/produits/aviso/welcome_uk.php3
Don K says:
August 2, 2013 at 9:26 am
It certainly sounds like you know what you are doing, but are you sure that you want to use Darwin? Daily tidal variations at Darwin are quite dramatic (as much as 8 meters) and any tidal component errors in sea level determination are likely to be much magnified there compared to other locations.
You’re right about the tidal range, but my correlation with SOI works very well there – better than the Pacific stations in fact, and it would work just as well for all W Australian stations as they have virtually identical sea-level profiles, though different rates. I’ve now posted charts, including a reconstruction for Majuro (Willis’ reconstruction is sound, average difference only 12mm), and charts for Kwajalein, Pago Pago, Pohnpei, and an up-to-date (June this year) sea-level chart for Majuro, which shows the uptick has subsided, following SOI down to around zero at end 2012.
Almost the exact opposite is happening on the W coast of N America, as Californian stations show. When sea-level rises in the west, it falls in the east, and vice-versa, but over an underlying upward trend of course. That current (20 years) underlying trend in the west is around 2.5 mm/year from my corrections, which is rather less than the published global rate from altimetry.
Roger Andrews quotes: “In short, there is no evidence for or against an acceleration in sea level rise in the three Marshall Islands records.”
The Roger Andrews says, “This statement is incorrect. Figure 5 shows clear evidence for an acceleration in SLR after 1990.”
Willis was trying to explain. There are complex and fairly chaotic changes in sea level due to tides and ocean water “sloshing” around. Then there are issues with the measurements themselves. Given the above, it is expected that you could easily find 3 tidal gauges that show an acceleration that does not actually exist or show a deceleration or even a drop in sea level that does not exist.
The idea is that even if the gauges show an acceleration in sea level rise especially over a short period like 20 years, this is not scientifically valid evidence that sea level rise is accelerated due to the previously mentioned chaotic tidal changes and potential problems with making the measurements. You are correct that it is “evidence” It just isn’t convincing or statistically significant evidence.
Willis:
Here’s a plot of the 18 tide gauge records with accompanying data. The mean is arithmetic because I’m calculating sea levels relative to coastlines, not absolute sea levels.
http://oi44.tinypic.com/1085lyr.jpg
Incidentally, a polite request for more data would have been more appropriate than dismissing my work as “garbage” before you’d even seen where it came from.
Though it is really off the topic that Willis was really getting at there are some interesting things about sea and earth heights that need to be discussed when trying to find what is going on with sea level. Willis was kind to arthur 4563 when discussing the variability of some sort of standard worldwide sea level.
The sea and even the earth are not ever static. The earth’s geoid in fact varies by up to 100 meters in a somewhat static fashion over the global surface. Tidal forces seen in the oceans also can be seen on the earth. There are earth tides at times as great as a meter. Rebound of portions of continents from removal of glaciers can cause some dramatic changes in gauge measurements. Subsistence of islands can do the same. This is a very dynamic earth we live on and trying to get even long term sea height measurements is a daunting task.
In one of my previous lives I worked on a program called Seasat which had a synthetic aperture radar on it. I was a field type that tracked this satellite but I was very curious about one of my babies and looked at the data as it was developed and was put out to the public. Sea heights throughout the ocean basins varied a lot. Things like seamounts affected heights. It was an eye opener as to how un-static the oceans were. We need to keep relearning what we think we really know.
Bernie
This is not about tides. Roger Andrews is pointing to the mid-90s shift in trade winds.
Tides are just one element of what can be seen. Of course trade winds cause some long term height differences in the Pacific that put some these tiny signals in the noise. And many other elements are at work here. Teasing out “real” sea height values is a daunting task.
To clear up some evident confusion.
All I’m saying is that Figure 5 does in fact show evidence for an acceleration in the rate of sea level rise in the Marshall Islands after about 1990. I haven’t commented on whether or not this acceleration is statistically significant or on what might have caused it, although the fact that we see it when 18 tide gauge records in the central Pacific are averaged together suggests that it may be real.
Roger Andrews says:
August 2, 2013 at 12:22 pm
A polite request for more data? Why should I care about your data? YOU should care that there is a LINK to your data and code. I assume that the plot is the result of a spreadsheet. Where is the spreadsheet? Without it, as I said, that’s just garbage. Artfully delivered garbage, to be fair, and apparently meaningful … but in fact useless in this discussion. I can’t demonstrate the error bands on your results. I can’t see if you’ve made stupid mistakes. I can’t measure the autocorrelation and see if it’s significant (as I suspect it will be). It’s of no use to me at all.
I’m certainly not going to root around in the PSMSL looking to duplicate your spreadsheet. If you think your spreadsheet shows interesting results, then publish a link to it.
And yes, you’re right, without such a link, your graph may not be garbage … but it sure as hell won’t gain any traction with me.
w.
Roger Andrews says:
August 2, 2013 at 3:46 pm
Thanks for the clarification, Roger. What Figure 5 shows is one record, Majuro, that has a fairly constant trend beginning to end.
The other record, Kwajalein, is basically flat for the first half of the Figure and rises after that.
That is not “evidence for an acceleration in the rate of sea level rise in the Marshall Islands”. This is particularly true when the only other Marshall Islands record, Wake, shows no such acceleration. Like Majuro, it has a fairly constant trend end to end.
So two out of the three Marshall Islands records show no increase in the rate of sea level rise. That’s many things, but it’s not “evidence for an acceleration”.
Next, you say it is “evidence” but that you don’t know whether the change is statistically significant. It doesn’t become “evidence” until it is actually shown to be statistically significant. I’ve shown that the difference in the two trends is NOT statistically significant, so it is not evidence.
Next, whether the average of the 19 records is significant remains unanswered. The uncertainties in even long tidal records are large. Many of the records you cite are only 30 years long. From Figure 1, that gives them a ± 1.5 mm/year 95%CI.
Additionally, such averages tend to be highly autocorrelated. As a result, the difference in the pre- and post 1990 trends may not be statistically significant. So I wouldn’t draw any conclusions without a statistical analysis of the results. With highly autocorrelated data, what looks like a trend may be just random fluctuations …
Finally, you need to bear in mind that not one of the records you accessed has had the tidal effect filtered out. Those records are the SUM of the slow tidal changes and the underlying sea level changes (if any). The sun-moon tidal cycle roughly repeats with an 18.6-year period, with a closer return to original conditions every three cycles (55.8 years). That’s why you need fifty years of tide gauge data to determine the change in the underlying sea level.
So what we are looking at in your graph may be just the tidal action and the standing waves. Remember that while overall the sea level has gone up over the last 20 years, the sea level in about 10% of the 0.25° gridcells has actually gone down over that time … that should give you an idea of the size of the standing waves in the Pacific basin.
Best regards,
w.
Paul Vaughan says:
August 2, 2013 at 2:15 pm
Cite? Not saying I disbelieve it, quite the opposite. I’m saying I’m interested.
w.
Lol tide gauges are normally within harbors where weather and construction play a large part in the long term averages. As for GPS its based on a theoretical model of the earth and even DGPS is only accurate to 2meters which is great for ships and meaningless for survey results.
What “tidal effects” did you remove from the Majuro data, Willis? Enlighten us please. Monthly sea-levels are mean sea-levels, and average out all the high-frequency tidal components. Over the course of a year, all the others are accounted for too, except the 18.6 year nodal tidal cycle, and its amplitude is about 25mm for Majuro. Only a fraction of that can possibly affect the tide height over the entire cycle. The NTC increases tidal amplitude – high water is higher and low water lower, both by half the NTC amplitude at any location. There may be a residual of as much as 10-20% of the amplitude at some stations, less at others, and only about 25% of stations worldwide exhibit any detectable NTC variation. The NTC varies in phase and amplitude around the globe, with an extreme range of between 10 and 100 mm.
If your truly interested in why tide gauges, even 18 averaged over the pacific, is meaningless, read this article concerning DATUM. http://geokov.com/education/datum.aspx
But now Tamino can’t descend in to more statist panic.
Tidal variation between locales is one reason that Holgate 2007 combined the result of a number of sea level gauges worldwide, to see the picture of overall global sea level rise history (using 177 stations and using 9 particularly high quality stations over various continents), and, as they observed:
“The rate of sea level change was found to be larger in the early part of last century (2.03 ± 0.35 mm/yr 1904–1953), in comparison with the latter part (1.45 ± 0.34 mm/yr 1954–2003).”
On the decadal rates of sea level change during the twentieth century
S. J. Holgate
Geophysical Research Letters, Vol. 34
http://www.joelschwartz.com/pdfs/Holgate.pdf
Overall, sea level rise rate deaccelerated over the past century.
Figure 4 of that paper (full-text linked above) plots the sea level record in the cumulative rise form which most people are used to seeing, favored by alarmists since it looks like more of a continuous upwards trend than if plotted otherwise.
Figure 2, however, is particularly informative by plotting the sea level record as a rate of change over time, showing the derivative, in a manner usually never ever, ever seen from most sources since it is too revealing of the truth and not suited for making misleading propaganda.
While the misleading style of plotting used in most (other) publications makes the derivative of change not easy to see, the depiction of figure 2 in contrast reveals how there are cycles in such fitting with cycles in cosmic ray forcing as illustrated in the middle of the following:
http://s23.postimg.org/qldgno07f/edited4.gif
(enlarges on click)
MostlyHarmless says:
August 2, 2013 at 6:01 pm
Glad to. I haven’t removed the tidal effects from any of the data. Nor did I claim to have done so. I hope this news finds you enlightened.
w.
That’s not really a “level” issue so much as it is variation in the equipotential surface of mass-attraction gravity due to mass inhomogeneity.
GPS receivers give you lat/lon/alt relative to the reference ellipsoid, which is transformable to ECEF position. Which means: no, there’s no Earth model that bears any relevance, here.
DGPS can give you position accuracies in single-digit centimeters. Survey-grade instruments have only been around for maybe a couple of decades.
See also: here:
As an aside: I’d be shocked if Kwajalein didn’t have DGPS available, given that it’s a major missile testing ground. Ditto Wake.
One last thing: there’s a decent treatment of crustal movement due to lunar and solar gravity here. I’ve always referred to that as “solid Earth tide”, so as not to confuse it with oceanic tidal response.
johnmarschall “It might be a good idea to wait for a reply from Nlis-Axil Morner since he is still the world’s sea level expert.”
Not really, although he seems to have a very high opinion of himself on lots of subjects, from how to use dowsing rods to how to store nuclear waste (he claims it’s impossible to safely store nuclear waste in Sweden since it’s going to have huge earthquakes) to disputing there even is a greenhouse effect caused by greenhouse gases.
Slartibartfast says:
August 2, 2013 at 9:36 pm
…
As an aside: I’d be shocked if Kwajalein didn’t have DGPS available, given that it’s a major missile testing ground.
==============================
Probably does. I’d guess the GPS position(s) are for the tracking radars and launch pads, not the tidal gauge. I’m not sure it makes any difference. We know where Kwajalein is. It’s probably not moving very much laterally, and even if it were, it’s hard to see why that would affect sea level measurement. And any vertical motion is probably similar everywhere on the atoll. (Are soil related phenomena like compaction even possible on a coral atoll?)
Vertical motion is a different issue. It’s harder to measure but much more important. Measuring height of a fixed feature from an elevator is tricky.
Willis said in the post: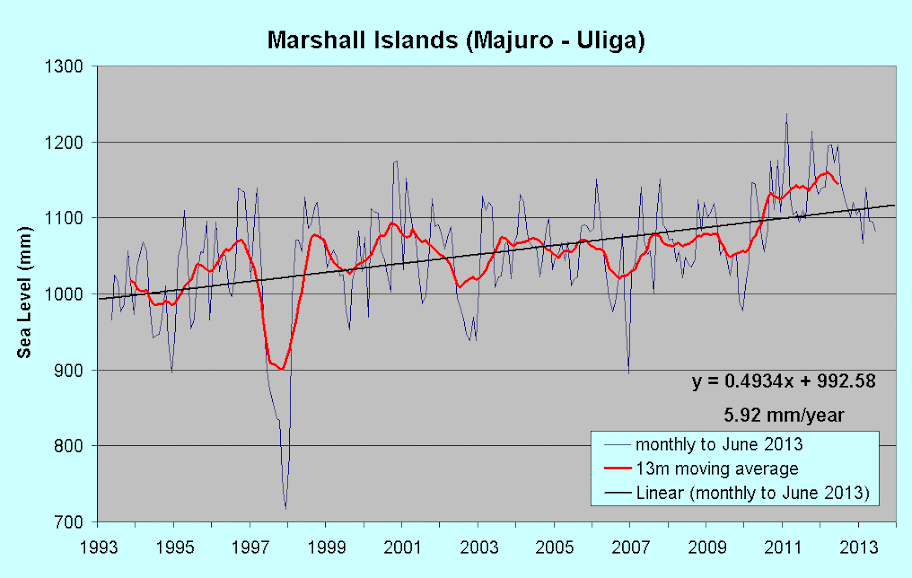
So for example, the measured change in the sea level at the Majuro B (SEAFRAME) tide gauge was +5.6 mm/year 1993-2010. But after subtracting the tidal effects, it drops to 4.3 mm/year. And after removing land subsidence effects, the actual trend was estimated by the SEAFRAME folks at 3.8 mm/year.
I repeat – what “tidal effects” were subtracted?
Here’s the SEAFRAME plot for Majuro to last month – June.
Source:
http://www.bom.gov.au/ntc/IDO70052/IDO70052SLD.shtml
Nothing wrong with Roger Andrews composite chart – I have spreadsheets for most of those stations to 2012., and data and charts for almost all are accessible on PSMSL.
I repeat what I said before – it’s ENSO at work, with a rebound from the early 1990s low caused by two El Ninos – 1991-2 and 1994-5. On the other side of the Pacific, sea-levels have been largely static over the period under discussion, and for the same reason – ENSO. Between 1980 and 2012, sea-level at San Francisco rose at just 0.03 mm/year, and since Oct 1992 (satellite era) has dropped at -1.02 mm/year.
thomas.
There is no empirical evidence for the GHE it is just s construct to overcome a poorly understood model.
And thanks for misspelling my name.
DonK
Actually island lateral movement will make a difference. As the tectonic plate moves away from the spreading center the sea depth increases due to plate local cooling but this movement is centimeters per year so would not make any difference in this case over such a short time.
The warmists have connected ocean level changes with the increase in planetary temperature. If the planet is cooling and does significantly cool (due to the solar cycle 24 change) based on that hypothesis and the mechanisms ocean levels should drop. It will be interesting to see how the sea level data is changed (climate gate type changes, climate war explanation) and how sea does change (physical change and pure science attempts to explain the physical change).
There are multiple unexplained sea level anomalies (the data and analysis is not consistent) if one starts to look for mass and volume changes to explain the sea level rise and constraints the analysis with rotational changes. Significant unexplained anomalies often indicate that there is either a fundamental error in the analysis/theory or there is missing parameter/mechanism.
I believe in this case there is a missing parameter/mechanism that affects both ocean level and satellite altitude (this missing mechanism/parameter explains the GRACE anomalies). If that belief is correct ocean level will fall more than predicted if and when the planet cools. The missing parameter/mechanism also explains why the solar wind speed dropped by a factor of two during the Maunder minimum.
The satellite give sea level rise of 3.2 mm/yr is not correct and is due to adjustments. I believe the tidal gauge analysis gives 1.5 to 2.0 mm/yr (no change in rate of increase). Mass and volume changes based on temperature changes and ice sheet melting give 0.5 mm so there is an unexplained the 1.0 mm/yr to 2.0 mm/yr.
ftp://www.grdl.noaa.gov/pub/laury/nature.pdf
Mass and volume contributions to twentieth-century global sea level rise
The rate of twentieth-century global sea level rise and its causes are the subjects of intense controversy1–7. Most direct estimates from tide gauges give 1.5–2.0mmyr21, whereas indirect estimates based on the two processes responsible for global sea level rise, namely mass and volume change, fall far below this range.
Estimates of the volume increase due to ocean warming give a rate of about 0.5 mm yr (ref. 8) and the rate due to mass increase, primarily from the melting of continental ice, is thought to be even smaller. Therefore, either the tide gauge estimates are too high, as has been suggested recently, or one (or both) of the mass and volume estimates is too low.
Here we present an analysis of sea level measurements at tide gauges combined with observations of temperature and salinity in the Pacific and Atlantic oceans close to the gauges. We find that gauge-determined rates of sea level rise, which encompass both mass and volume changes, are two to three times higher than the rates due to volume change derived from temperature and salinity data. Our analysis supports earlier studies that put the twentieth-century rate in the 1.5–2.0 mm yr range, but more importantly it suggests that mass increase plays a larger role than ocean warming in twentieth-century global sea level rise.
http://anquetil.colorado.edu/~archie/publications/Mitrovica_etal_2006.pdf
Reanalysis of ancient eclipse, astronomic and geodetic data: A possible route to resolving the enigma of global sea-level rise
johnmarshall, sorry, I didn’t realize you were one of the “dragonslayers”.
http://wattsupwiththat.com/2013/08/02/the-most-important-sea-level-graph/#comment-1378833
vukcevic,
(if it’s ok to reply to his comment)
Are you implying that that only CO2 forcing incurs feedbacks and not solar forcing (or any other)? That seems to be your position when you subtract solar-forced changes to determine climate sensitivity. I would have thought that establishing climate sensitivity would include any forcings. This would be complicated by any differences in efficiency of various forcings.
Also, your ‘model’ is a TCR (Transient Climate Response Model) and should be compared with TCR (not ECS) estimates. Mean TCR estimate is 2.1C for a doubling of CO2 – the response at the time of doubling. ECS is the changed climate state after reaching equilibrium.
A vigorous ‘skeptic’ at a forums I used to inhabit ginned up a graph based on TCR and this was the result for the instrumental record.
http://i1006.photobucket.com/albums/af185/barryschwarz/TCR21.png
(Blue line is TCR derived from linear CO2 increase, and red line is TCR from observed CO2 increase)
arthur4653,
As Willis pointed out, local sea level change is highly variable (even negative), even though sea level rise has occurred on average. There are all sorts of local factors at play, and a changing global climate brings change to patterns in the climate system (with different sign) across many indices.
Willis,
I would say the same if the local tide gauge was used as a proxy for global, but I don’t see any problem with limiting the cliam to that location. Error bars should be included for the claim to apparoach any kind of rigour.
johnmarshall,
Never mind AGW – you are saying that the greenhouse effect is bogus? That if you removed all greenhouse gases from the atmosphere (including water vapour), global temps would not change?
Oh dear. Thankfully, most people here will dismiss that instantly for the nonsense it is.
there is no DGPS in the islands, gps with its standard 2 meters is good enough for navigation and flight. There are requirements that make it difficult to set up a proper DGPS site. The equipment for GPS survey equipment is quite expensive and is only used to determine a fixed objects position and centimeter accuracy is quite awful compared to the cost. So you might use it to fix the position of your tide guage but not the tides which move too fast for that particular type of surveying. Also I believe the marshalls are still using WAKE-ENIWETOK 1960 – Marshall Islands, for their surveying which makes it even more unlikely they will build their own DGPS site.
Eustace,
Not so, the primary cause of sea level rise is attributed to thermal expension (warer expanding as it is heated).
Robert of Ottawa,
“The fatuity of short-term trends” – excellent note to engrave in the top bar of climate blogs. But it’ll be *forgotten* in a day or two.
Looking at the seaframe equipment, they do have a static GPS install to try and determine what the land Is doing. However their expectations of the accuracy of that equipment (installed in 1993 and used continuously to 2010) is a bit over the top. Static equipment requires weekly checks for errors from a separate system, one of the reasons I personally would not use GPS equipment in a study like this. If your measuring millimeters, centimeter accuracy isn’t going to cut it.
The oceans have been warming in the time of relatively flat surface temperatures. Sea level should rise correspondingly.
http://sealevel.colorado.edu/
@Dave Wendt
“http://tinyurl.com/msltrends92-12” Thanks.
It looks like the sea level changes are wind-driven. It’s a bit ridiculous. You have one island in the Aleutian chain that has 1 cm/yr rise over 20 years, but it’s so spatially confined that by the you get to the island itself, there is no sea level rise.
Does local sea level reflect average water temp (think El Nino), thus average local air pressure driving sea level change? Sorry Dave, I don’t have the wherewithal to do this, but, if you look for spatial correlation of 20 yr average ocean temp with mean sea level rise, is there significance?
Bill Illis — possibly the most sensible WUWT commentator — has illustrated here countless times the relationship between trade winds & enso.
See figure 2 here for some related insights:
http://www.per.marine.csiro.au/staff/ming.feng/Publications/2004FengGRL.pdf
Also figure 1 here:
http://www.per.marine.csiro.au/staff/Ming.Feng/Publications/2011FengGRL.pdf
One thing that makes the 90s changepoint interesting is that it’s shared with secular ozone (i.e. once you filter off annual, semi-annual, QB, & solar components).
Tides aren’t the main thing going on.
excellent NASA video (h/t Bob Tisdale) makes coupled temperature, mass & velocity crystal clear
How can any fool put a tide guage on a volcanic island sitting on a magma chamber and figure out the sea level rose X mm per year? How stupid!
Willis:
Thanks for your response of 3.46 pm yesterday and apologies for the delay in replying. Here are my comments on your comments:
1. “(Y)ou say (the rate of sea level rise) is “evidence” but that you don’t know whether the change is statistically significant. It doesn’t become “evidence” until it is actually shown to be statistically significant. I’ve shown that the difference in the two trends is NOT statistically significant, so it is not evidence.”
Sorry, but it’s still evidence. Just not enough to convict.
2. “Whether the average of the 19 (sic) records is significant remains unanswered. The uncertainties in even long tidal records are large. Many of the records you cite are only 30 years long. From Figure 1, that gives them a ± 1.5 mm/year 95%CI.”
The error of an estimate typically decreases as the inverse square of the number of data points, so when we average 18 records together we should get a number which is considerably less than the +/-1.5 mm/year you cite. But even this 1.5 mm/year estimate is still less than the difference between the pre- and post-1990 sea level rise trends (0.8 vs. 4.7 mm/year), so I think you have to consider the possibility that this trend difference IS statistically significant.
3; “Finally, you need to bear in mind that not one of the records you accessed has had the tidal effect filtered out.”
As I mentioned earlier, I’m estimating sea levels relative to coastlines, not absolute (or geocentric, or eustatic) sea levels, and if you want robust relative sea level estimates it’s a good idea not to start “correcting” the tide gauge records.
4. “So what we are looking at in your graph may be just the tidal action and the standing waves.”
Well yes, it may be. But what if it is? It doesn’t make the acceleration go away.
Willis Eschenbach
Another humdinger Willis. Great treatment of a complexity.
Confusion abounds due to the accepted misusage of the term “mean sea level” which is a misnomer. The Sea is not level, it is CURVED. Additionally, any plumber will tell you that water runs down hill. Old timers refered to it as the Bounding Maine because it is a moving target. /sarc.
It is a logical falacy of missplaced precision to try to measure to a milimeter of accuracy something that constantly moves up and down in meters and tens of meters, with ripples superimposed upon waves, upon swells, and upon tides all moving differently. I think I’ll chunder now.
Roger Andrews says:
August 3, 2013 at 6:49 pm
…..The error of an estimate typically decreases as the inverse square of the number of data points, so when we average 18 records together we should get a number which is considerably less…..
>>>>>>>>>>>>>>>>>>>>
Noep can’t do that. You would get your hand smack in industry if you tried that.
That rule only applies to repeated measurement of the same thing. That is why the the error on temperature measurements is so much larger than admitted. It is ONE (1) reading at ONE (1) specific location at ONE (1) specific time. Same logic applies.
arthur4563 says:
August 2, 2013 at 8:14 am
….The ocean isn’t going to just rise at certain spots.
>>>>>>>>>>>>>
Actually it will and that is the problem.
Bob Tisdale mentions winds link depending on the strength of the trade winds, one side of the Pacific ocean can be as much as three feet (~ 1 meter) higher than the other side.
E.M. Smith goes into the complicated motion of the moon and its effect.
About That Lunar Cycle
Lots more interesting info in that essay.
Why Weather has a 60 year Lunar beat
In the Bay of Fundy the difference in water level between high tide and low tide can be as much as 48 feet (14 meters). link
barry says:
August 3, 2013 at 7:57 am
johnmarshall,
“There is no empirical evidence for the GHE it is just s construct to overcome a poorly understood model.”
barry says
“Never mind AGW – you are saying that the greenhouse effect is bogus? That if you removed all greenhouse gases from the atmosphere (including water vapor), global temps would not change?”
————
Barry, lets pick that bone clean shall we? There is a lack of clarity in either your thinking or your language.
A green house obtains it’s efficacy not from it’s constituent gasses and their radiative properties, but from the mechanical boundary imposed by the glazing membrane that stops convective and reduces conductive heat loss. Radiative heat loss is minimal, even negligible, by comparison. I look to professionals for clues here. A friend of mine is a commercial greenhouse operator. He covers his frames with 2 layers of clear plastic film. He inflates the roof with positive pressure using blowers (using regular atmospheric air), creating several inches of dead air space. This stops convection and reduces conduction. He doesn’t worry about radiative loss, it is minimal. He certainly doesn’t add CO2 to retain heat. He adds CO2 because the plants consume it as a nutrient.
Applying this model to the atmosphere the corresponding boundary layer is the tropopause below which convection dominates heat transport. Above the tropopause convection ceases, conduction decreases and radiative loss dominates. That is also above 80% of the atmosphere. The gas that dominates the convection (and advection) cycle in the troposphere is H2O due to the dynamics of phase change, absorbing energy down low during evaporation and releasing energy up high during condensation.
I am not a physicist. I would love for some one to explain how a change in constituent gasses will effect the tropopause, because that is where the “greenhouse effect” is found. The way I see it, if the tropopause rises to a higher equilibrium altitude, the effective diameter will increase, radiative surface area will increase, and net radiation will increase. Negative feedback. If the temperature at the tropopause increases, black body radiation loss will increase even faster than temperature. Negative feedback again.
As for CO2, the way I see it, MORE CO2=MORE SUGAR (or cellulose poly saccharides). That is proven by experiment.
barry
The GHG’s in the atmosphere help to remove the excess heat supplied by the sun. Remove them and global temperatures would increase not decrease.
Calling something by a wrong name does not make it work. The atmosphere does not act like a greenhouse. It does not limit convection as a greenhouse does. GHG’s react with IR energy which helps remove heat from the surface. Water vapour has the added ;property of latent heat which removes even more heat.
The GHE cannot work. It is a construct to get round the flat earth model of K&T in AR4 of the IPCC report. If your model is not based on reality your thinking goes the same way– away from reality. We do not need a GHE to get the average temperatures measured on the surface. Reality supplies more than enough from the sun.
@ Gail Combs (August 3, 2013 at 9:08 pm)
Roger’s a bright guy. I recommend welcoming him here. He’s well aware of spatial autocorrelation because, like Bob Tisdale, he looks carefully at patterns in the data. I don’t doubt for a second that he knows how to take the uncertainty estimate to second order. Best Regards.
Paul Vaughan,
“Roger’s a bright guy. I recommend welcoming him here. He’s well aware of spatial autocorrelation because, like Bob Tisdale, he looks carefully at patterns in the data. I don’t doubt for a second that he knows how to take the uncertainty estimate to second order. Best Regards.”
Undoubtedly Roger is a bright guy. Unfortunately, like many in the Climate Community, he is not bright enough to separate his agenda or bias from his technical expertise.
One last post on tides….Tide gauges are placed almost exclusively in harbors, they are susceptible to weather events and if your in an area where there is a constant wind from a particular direction it can have a long term significant effect on the local tides which has a higher magnitude than what is caused by the sun and moon. Most harbors are undergoing changes, typically they get built up which changes their volume which changes how they react. Tide gauges are great for their purpose but they aren’t very good at determining long term trends.
Paul Vaughan at 6.46 am:
Paul, thank you for that vote of confidence. However, I’m not sure you would want to have me take the uncertainty estimate to second order. I would recommend you have a statistician, not a geologist-geophysicist, do that.
On the question of uncertainty I’m guided by my experience in the mining industry, where for the last 20 years I’ve been calculating ore reserves from drillhole assay data, a procedure analogous to calculating temperature series from temperature records (temperature = assay grade, time = depth in the hole etc.) One basic principle of ore reserve calculation is that the more assays you have the closer you get to the true grade of the deposit. A single gold assay in one drillhole, for example, will give you no idea of the true grade, but when you average 50,000 of them in several hundred drillholes you will probably get within 5%, which is remarkable when you consider that the 50,000 tiny gold beads you assayed might weigh a tenth of an ounce in total while the deposit might contain several million ounces.
This basic principle also applies to tide gauge records. The more you have, the closer you get to reality, all other things being equal.
William Astley says:
August 3, 2013 at 3:48 am
The satellite give sea level rise of 3.2 mm/yr is not correct and is due to adjustments. I believe the tidal gauge analysis gives 1.5 to 2.0 mm/yr (no change in rate of increase).
======================
If it will make you feel any better, ERS1&2 (Different satellites than the Topex/Poseidon satellites used by CU) reanalysis is much closer to 2.0mm/yr than Topex/Poseidon. BUT, the ERS folks have very little faith in current ionospheric delay models and thus slap large estimated error bounds on their estimate. Topex/Poseidon uses a different technique (dual frequency radiometry) to estimate ionospheric delay, and it may have a less dubious result.
======================
My take — for what it’s worth.
1. Tidal gauge values are poorly distributed geographically and mostly lack high precision estimates of local tectonic forces. Their great merit is that they cover a long time span. Still, it’s hard to place much faith in them for measuring global sea level change.
2. ERS satellite estimates come lose to tidal gauge estimates, but have large estimated error bounds
3. Topex/Poseidon satellites as interpreted by CU. I just plain don’t trust the analytic skills of the folks at CU. Their inclusion of Glacial Isotacy in their calculations strikes me as being bizarre (AFAICS it is inappropriate), and their estimated error bounds look to me to be optimistic. (If we can’t identify the error, it’s not there). They could be right and I could be a churlish dolt. OTOH, I’m occasionally right about some things.
4. The AR5 draft notwithstanding, I’m not convinced that we have yet managed to get computations of sea level rise from ice melt, storage of precipitation, pumping of previously stored water, thermal expansion of the ocean, etc to add up to anything reasonable.
5. Other alternatives for estimating sea level rise e.g. changes to Earth rotation rate from greater sea volume, simply don’t currently work well enough to be useful
Seems that WUWT is resorting to suppressing “inconvenient comments” so I’ll post my last one again.
Willis hasn’t responded to my question about “tidal components”, so I will. They’re irrelevant to monthly mean sea-levels. His reference to the Mitchell paper is invalid – they don’t discuss “removing those tidal effects”, they include them by trending, and therefore averaging, hourly tidal data, using “asymptotic analysis”. That’s a method of trending part of the record, extending the data range, producing another trend, and so on to the end of the dataset. I use a similar technique using monthly data – it shows how the trend evolves month-by-month to the end of the data. The final value is exactly the same as an overall linear trend – same data, same spreadsheet function. The NTC use it for showing trend evolution for all their SEAFRAME stations.
His “1993-2013” trend for his Majuro reconstruction is incorrect – the satellite plot shows a very close correlation; with a rate of 7.4 against the trend for Majuro (reconstruction) over the same period of 7.3, and not 5.6.
He said in his summary that
• The early (1973-1993) and late (1993-2013) trends in Majuro were about the same.
… but that’s not true either – the trend to end 1993 is 2.76 mm/year.
Roger Andrews says:
August 3, 2013 at 6:49 pm
My thanks to you as well, Roger, and I understand the imperatives of time all too well, Answer when you do.
To continue the legal metaphor, actually it’s more like hearsay, which the jury is not allowed to hear …
That’s just handwaving. You need to actually calculate the error in the pre- and post-1990 records, and see if the bend is just random. In addition, it needs to be adjusted for autocorrelation. Until that is done, no, I don’t have to even think about the situation.
Finally, why would I “consider the possibility”? That’s what statistics are for, to tell us whether it is or isn’t significant. We absolutely cannot just use our eyes for that.
Mmmm … from the way you talk about “correcting’ the tide gauge records, it appears that you didn’t read the Mitchell citation I provided regarding “Asymptotic trend evaluation”. Take a look at that, and let me know if you still have questions.
Ah. I think I see the problem. We’re using the words “sea level” in different ways to mean different things.
In general, the scientists studying sea level rise divide the height of the sea measured at any given instant into two components—an underlying, slowly changing “sea level”, and on top of that, the tidal component of the height.
For example, when the tide is coming in, the measured level of the top of the ocean is increasing. But this is NOT described as an “acceleration of the sea level rise”. Sea level rise is an entirely different thing.
The problem is that separating the tidal signals out from any changes in the underlying “sea level” takes a very long dataset. The reason is that the tidal cycles are long, and they interact in unpredictable ways with the basin shapes.
As a result, what I personally am discussing, and what Tamino and Nils-Axel are discussing, is NOT the tidal component. It is the underlying sea level. And my statement is true. All we may be looking at is tidal action.
Does that “make the acceleration go away”? No, it just highlights the fact that what we are seeing may be tidal only, and there may be no change in the underlying rate of sea level rise at all.
Hope that helps,
w.