Guest Post by Willis Eschenbach
According to the current climate paradigm, if the forcing (total downwelling energy) increases, a combination of two things happens. Some of the additional incoming energy (forcing) goes into heating the surface, and some goes into heating the ocean. Lately there’s been much furor about what the Levitus ocean data says about how much energy has gone into heating the ocean, from the surface down to 2000 metres depth. I discussed some of these issues in The Layers of Meaning in Levitus.
I find this furor somewhat curious, in that the trends and variations in the heat content of the global 0-2000 metre layer of the ocean are so small. The size is disguised by the use of units of 10^22 joules of energy … not an easy one to wrap my head around. So what I’ve done is I’ve looked at the annual change in heat content of the upper ocean (0-2000m). Then I’ve calculated the global forcing (in watts per square metre, written here as “W/m2”) that would be necessary to move that much heat into or out of the ocean. Figure 1 gives the results, where heat going into the ocean is shown as a positive forcing, and heat coming out as a negative forcing.
 Figure 1. Annual heat into/out of the ocean, in units of watts per square metre.
I found several things to be interesting about the energy that’s gone into or come out of the ocean on an annual basis.
The first one is how small the average value of the forcing actually is. On average, little energy is going into the ocean, only two-tenths of a watt per square metre. In a world where the 24/7 average downwelling energy is about half a kilowatt per square metre, that’s tiny, lost in the noise. Nor does it portend much heating “in the pipeline”, whatever that may mean.
The second is that neither the average forcing, nor the trend in that forcing, are significantly different from zero. It’s somewhat of a surprise.
The third is that in addition to the mean not being significantly different from zero, only a few of the individual years have a forcing that is distinguishable from zero.
Those were a surprise because with all of the hollering about Trenberth’s missing heat and the Levitus ocean data, I’d expected to find that we could tell something from the Levitus’s numbers.
But unfortunately, there’s still way too much uncertainty to even tell if either the mean or the trend of the energy going into the ocean are different from zero … kinda limits our options when it comes to drawing conclusions.
w.
DATA: Ocean temperature figures are from NOAA, my spreadsheet is here.
Guess this means I won’t be able to use the sea to boil eggs. Bummer.
Ol’ Twitchy Jim must have upped his twitching by a tenth of a watt per eyelid, +/- 0.1….
Gawd, and I was hoping for a free natural sauna. Guess I’ll hafta wait until Earth reaches Venus’ orbit, or until the sun goes nova.
O/T but this is REALLY IMPORTANT NEWS. see http://www.dailymail.co.uk/news/article-2343966/Germany-threatens-hit-Mercedes-BMW-production-Britain-France-Italy-carbon-emission-row.html
It would appear that Germany (Europe’s most powerful player) has woken up and has now realised the adverse effect of carbon emission restrictions.
I have often commented that Germany will not let its manufacturing struggle as a consequence of such restrictions and/or high energy prices (which germany is begining to realise is disastrouse for its small industries which are the life blood of German manufacturing).
First, germany is moving away from renewables and is building 23 coal powered stations for cheap and reliable energy.
Second, Germany wants to rein back against too restrictive carbon emissions.
The combination of this new approach is a ground changer in European terms.
In the recent Salby lecture posted in this blog he said at one point “if the energy budget is wrong then all bets are off”. Over at Talkshop there is a post that points out that TSI measurements by radiometers disagree by about 5 watts/m2 (and they don’t know why!!).
Yet so many people pretend that they can calculate the temperature of the seas in thousandths.
Then they pretend they knew what the temperature of the sea was 50, 100, 200 years ago.
This is all claptrap.
Willis concludes, “But unfortunately, there’s still way too much uncertainty to even tell if either the mean or the trend of the energy going into the ocean are different from zero … kinda limits our options when it comes to drawing conclusions.”
I hate when that happens.
Thanks for the post. I enjoyed it.
Regards
Hmmm, this rather puts the kibosh on this graph from the SkS zealots:

Cook writes: Build-up in total Earth Heat Content since 1950. The data comes from Figure 6b in Murphy 2009. The data was kindly emailed to me from Dan Murphy and I plotted just the Ocean/Land + Atmosphere components of the graph in order to show the heat building up in the climate system. The ocean data was taken from Domingues et al. 2008.
Excel Spreadsheet XLS: http://www.skepticalscience.com/graphics/Total_Heat_Content.xls
Makes me wonder how Murphy finds such a large trend in OHC, but Levitus does not find any trend in forcing.
[REPLY: Thanks, Anthony. There is a large trend in OHC, as you show in your graph, but it is not statistically significant. This is because of the high autocorrelation of the data (lag-1 autocorrelation of 0.92). As usual, SkS forgot to mention that … w.]
If Joe Public realised just how little the scientists actually know about what’s happening to the world, they might start to wonder how come they’re so certain about what’s in store for us later.
Yes, this makes an important point, which is that the actual measurements which go into the calculation of the rising OHC have huge error bars, which are not reflected in the graph Anthony has plotted above meant for public consumption and hand-wringing. Bob Tisdale has, I believe, come to a similar conclusion.
richard verney
What they really mean, in placing limits of CO2 emissions, is making cars more economical, doing more kM/ltr or mpg. That is the only real way they can reduce vehicle emissions!
Reminds me of the comment Jeremy Clarkeson made on Top Gear a few years back whilst interviewing former soldier turned pop-singer James Blunt, he commented that the EU are demanding military vehicles have reduced emissions of CO2 & other stuff, so that they can still fire depleted uranium out the sharp end, but at least they can claim they’re being more friendly to Gaia from the rear end!!!!
Perhaps this reality is going to be the catalyst to bring down the ghastly edifice of AGW in Europe? Who knows?
Everyone knows my admiration for Bill Gray, so at the risk of bias, I live and die with his ideas. Let me share this with you:
http://typhoon.atmos.colostate.edu/Includes/Documents/Publications/gray2012.pdf
a great read
this easily (to most normal folk perhaps?) demonstrates to jai mitchell why the claim for bucket loads of heat stored in the ocean as per the other thread, is complute bunkum.
Thanks Willis. Using comprehensible units like watts instead of gazillions of mega-joules makes it obvious.
Joseph Bastardi says:June 19, 2013 at 4:54 am
Thanks Joe, interesting paper.
Just for perspective, how does this tiny ocean heat accumulation compare to what the science is based on – GHG forcing.
The SKs chart shown above, does not have the other side of the equation in it and, in fact, is only presenting a tiny part of the picture.
The GHG forcing is 2.86 W/m2 in 2012, while the accumulation in the ocean and land/atmosphere/ice-melt is only 0.52 W/m2 (I’ve got slightly different numbers than Willis).
http://s9.postimg.org/cwz2zl70v/OHC2000_M_GHG_Forcing_Q1_2013.png
Now, that is a completely different picture.
But it is not the whole picture. Over the time interval, there were volcanoes which reduced the net impact of the GHG forcing and there were aerosols reducing the net impact of the GHG forcing (and other changes like land-use etc.). The total forcing which supposed to be apparent in 2012 is 1.78 W/m2 (according to the numbers being used in the upcoming IPCC AR5 report).
http://s12.postimg.org/urxw7cq71/OHC_Accum_vs_Forcing_1955_2013_Q1.png
But again, that is not the whole picture either. As it gets warmer, more long-wave energy is supposed to escape to space, as it gets warmer, more feedbacks like water vapor and reduced cloud opacity are supposed to show up and ramp up the energy accumulation even further.
The total net forcing which is supposed to be showing up is 2.3 W/m2 including the feedbacks (feedbacks which are to occur at a 0.7C temperature increase). Increased long-wave emissions to space in the climate models are supposed to be in the 0.8 W/m2 range (according to Church and White 2011).
http://s10.postimg.org/vf4h3oizd/Net_Forcing_Feedbacks_Energy_Going.png
Putting everything into place, the net forcing which is supposed to be here is 2.3 W/m2, while the ocean heat accumulation, land/atmosphere/ice-melt warming and the increased LW emissions to space total up to just 1.3 W/m2. So, a full 1.0 W/m2 is completely missing from the climate system.
http://s12.postimg.org/6cycqfpcd/Net_Forcing_Heat_Accum_vs_Missing_Energy.png
Church and White 2011 provides some background to the above and the paper is where SKs got their idea from on “90% of the heat is going into the oceans” misdirection (I’m just updating and presenting the info in a different way than C&W11 – ignore the sea level parts of this paper).
http://igitur-archive.library.uu.nl/phys/2012-0229-200953/2011GL048794.pdf
Darn, I put the wrong chart in on the total missing energy (it’s hard to keep your head straight on this).
The total forcing “including feedbacks” is supposed to be 4.0 W/m2 and the energy accounted for in ocean heat, land/atmosphere/ice-melt and increased LW to space is only 1.3 W/m2 and thus the total missing energy is 2.7 W/m2.
http://s10.postimg.org/w4uagx7jt/Total_Forcings_Energy_Accounted_for.png
Quote: According to the current climate paradigm, if the forcing (total downwelling energy) increases, a combination of two things happens. Some of the additional incoming energy (forcing) goes into heating the surface, and some goes into heating the ocean….
Of course if the surfaces heat the fraction of energy which “downwells” i.e. “back radiation” then decreases as more is radiated by the surfaces (upwelling) than downwells. This is due to the unfortunate fact that most downwelling energy comes from thermal energy in the atmosphere originating from the thermal mechanisms: conduction, convection and latent heat of evaporation. This non GHG back-radiation is equal to (and opposite in direction) the net removal of thermal energy from the surfaces which is radiated into space via these thermal mechanisms.
As a heater reaches higher temperature radiative loss begins to dominate over thermal loss (just like infra-red heaters radiate far more than they conduct/convect whereas convector heaters like the domestic “radiator” are lower temperature devices and convect much more heat than they radiate).
Lower surface(s) temperatures = more fractional back radiation (from all sources).
It’s important to note that ‘downwelling energy’ to Earth’s surface from above does and can not ‘heat’ the surface unless it comes down as … heat. So, what radiative flux comes down to the surface from above as heat? The solar flux. What about the alleged atmospheric radiative flux? It is not a heat flux. If it even exists, it is THE LESSER PART of an exchange, the assumed IR exchange between surface and atmosphere, and the spontaneous ‘net’ energy flow that would come out as a result of this posited exchange is a radiative heat flux going UP. There is NO radiative heat coming down from the atmosphere to the surface of the Earth. The atmosphere is not a separate source of heat for its own heat source, the surface. The surface acts like a heat source to the atmosphere, not the other way around. Because the surface is warmer than the atmosphere. And that’s that.
People need to understand and remember these most elementary thermodynamic concepts …
Heat is energy in transit from a hot to a cold system. Energy is not in itself heat.
Note I exclude solar originating radiation from my definition of downwelling..
Speaking of oceans, I was recently having a cordial debate with a co-worker regarding an earlier discussion of Mayor Bloomberg’s plans for dealing with “rising sea levels”. I used the NOAA trend tool to highlight the 1’/century rise and he said I supported Bloombergs assertions. Well, that got me to looking around and I noticed the trend for Guam found here: http://tidesandcurrents.noaa.gov/sltrends/sltrends_station.shtml?stnid=1630000
Someone please help me understand the 2.77’/century from this trend. Obviously, I’m not as smart as a government employee.
I also take note that the higher trends seem to be found on sedimentary soil/substrates bays, inlets, and coastlines while in rocky bays and coastlines the trend is generally no more or less than +/- 0.5 feet/century.
I doubt that most visitors to Anthony’s site would believe that the models are even close to the truth on what is actually driving Global temperature and its trends (if any).
This just goes to confirm that opinion.
Thanks Willis,
Some of my own ponderings: 1) If it cannot be shown that CO2 is heating the ocean then CAGW is done as a theory. 2) LWIR is only capable of penetrating water at a depth of millimeters and the amount of heat transfer rate change from an increase in CO2s LWIR is dwarfed by the amount of LWIR from clouds. 3) SWR can penetrate the ocean to a depth of 30 meters (if my memory serves) and changes in cloudiness and/or solar activity would have a much greater impact to OHC than LWIR from all sources. Is this correct?
Water is the most energy consuming thing per degree C rise of anything, ie,. it needs more energy to raise its temperature by 1C than anything in the known universe. So to raise the temperature of the oceans by 1C needs lots of heat which comes from a, now, quiet star. Cooler oceans means cooler continents.
There is no ‘back radiation’. If there was you’d be able to feel it on the back of your hand.
As for the ocean heat transport, it’s the difference between absorbed SW and that lost by evaporation plus direct radiation.
Anthony Watts: Thanks for the link to the SkepticalScience spreadsheet. I’m sure it’ll come in handy one of these days.
Regards
Perhaps that’s why Trenberth says the heat is in the deep ocean below 2000m. Nobody can look down there.
0.2W/m2 is indeed trivial. How then , can they point at this as if it is material to anything?
But the oceans had nothing to say …
Thanks Willis. Excellent article!
The “pipeline” is empty because it does not exist. Weather drives climate, ENSO reigns.
@ Eco-geek 5:55 am
Your analogy with radiant space heaters fails due the the vast difference of relative temperatures. Radiant heaters operate at 400 – 900 deg C, our earth is circa 30 deg C.
The Stefan–Boltzmann law is proportional to the fourth power of the temperature T.
The size is disguised by the use of units of 10^22 joules of energy … not an easy one to wrap my head around.
I agree. So let’s wrap it up.
Convert all such figures in 10^22 Joules into ZetaJoules, 10^21 Joules.
(Note, these are the units of the SkS graph above… those exponents are fine print)
Now keep these earth constants in your back pocket:
Heat to raise upper 0-2000m Ocean 1 deg K = 2730 ZJ / deg K
Heat to raise 0-700m Ocean 1 deg K = 960 ZJ/K
So the SkS graph’s Y-Axis of 0 to 200 ZJ could be replaced with 0 to 0.07 deg K.
On top of that, the X-Axis runs from 1950 to 2003… stopping before the ARGO constellation. Today, with ARGO, it is debatable whether we have precision of 0.05 deg K. Before ARGO, it is fantasy to suppose we measured the average temperature of the 0-2000m ocean layer to even 0.25 deg K. So the entire SkS graph is well within reasonable error bars.
So, whenever you see x.x*10^22 Joules,
immediately convert it to temperature at the rate of 2730 ZJ per deg K
Interesting,
What you are calculating is the net heat flux into the ocean that is causing it to warm. I don’t understand why you are surprised that the calculated amount of extra warming is so small (on the scale of < 1 Watt per m^2. The ocean is a pretty big place.
compare this additional heating with the ACTUAL energy balance of the oceans, where MASSIVE amounts of heat energy are absorbed in the tropics and carried to the higher latitudes by currents where it gives off its heat energy to the atmosphere:
http://oceanworld.tamu.edu/resources/ocng_textbook/chapter05/Images/Fig5-7.htm
The tropical net energy absorbed in the latitudes of -30 to +30 is about 40 Watts per meter squared on average.
Anthony Watts says:
June 19, 2013 at 4:13 am
Hmmm, this rather puts the kibosh on this graph from the SkS zealots
…
Makes me wonder how Murphy finds such a large trend in OHC, but Levitus does not find any trend in forcing.
_______________________
If you draw a corresponding graph using data in Willis’ sheet (the Joules column) you get very similar, compatible result. That actually ensures me the Willis’ analysis is about right.
What’s missing are uncertainity intervals but I don’t think they would change much as individual errors cancel out. There is no dispute that there’s about 0.07 between -0.013+/-0.006 and 0.061+/-0.002, you can’t bring that down to zero by saying that the forcing is statistically indistinguishable from zero as demonstrated in this article. And that’s the answer to your question.
I like this article. It puts those huge OHC numbers nicely in context.
Recall that Trenberth is looking for 0.58 W/m2 (“missing”) he can’t account for in his energy balance of the planet, which infers that he believes he has something like 0.29 W/m2 of +/- in his work (sig:noise ratio = 2.0).
So the see a value of 0.2 +/- 0.3 W/m2 of oceanic heating, with a trend of 0.1 W/m2 per DECADE, +/-0.2 W/m2. Hmm.
We need to review what Trenberth is claiming: he is “missing” 3 times what you see, with a probable error of about the same.
Something doesn’t jive and I bet I know what: Trenberth’s missing heat is the reductive product of all sorts of calculations and measurements (not the same) that have been systemically cleaned of error bars.
I don’t believe on first principles that we know or can know the energy balance of the Earth to such fine points as Trenberth must believe to do his work.
I find it hard to believe anyone can say, with any degree of certainty, just what the average temperature of the oceans on this planet is. The Pacific and Atlantic oceans alone are so vast, with currents constantly changing, and upwellings and downwellings occurring constantly somewhere at all times, there are not enough static temperature monitors at all the various depths to adequately measure and compile data.
Willis,
interesting article, I was able to read your other study on the missing heat here:
http://wattsupwiththat.com/2013/05/10/the-layers-of-meaning-in-levitus/
where you said,
“I’d say not particularly. Yes, the middle layer (100-700 m) started warming in 1995. And yes, the lower layer (700-2000 m) followed suit starting in about 2001. But neither of these seem particularly surprising. I don’t have any explanation for them, but they do not seem to be unusual. It is possible, for example, that they represent the sub-surface changes associated with the gradual shift of the Pacific Decadal Oscillation from the positive to the negative phase. ”
————–
I wanted to let you know that this is EXACTLY what is going on and it shows that a very small (almost imperceptible amount) of extra heating is going into the deeper ocean when the PDO turns negative.)
The net energy flux in the tropics is still quite large and positive (see post above) but the amount is only very slightly more or less positive.
————————-
The reason that this is significant is that the amount of heat energy going into the tropics is SO LARGE that only a very small change in the amount of heat absorbed in this region can produce massive changes (heating and cooling) in the atmosphere.
———————-
This is why we have had a “stagnation” of warming since 1998.
The interesting (bizarre) part of their argument requires that the energy flux at the surface has to be orders of magnitude higher in the areas where there is downwelling.
Given that the “missing heat” is not stored in the upper layers of the oceans. Given that the “missing heat” is warming the deep oceans. Given that the “missing heat” travels to the deep ocean by downwelling. Given that the areas of the oceans where downwelling occurs is something like 1% of the entire area of the oceans. Given that the volume of the deep oceans is so vast that the “missing heat” raises its temperature by fractions of a degree.
This can only mean the “missing heat” is discretely added to the downwelling water just when it becomes too late to measure.its temperature.
I recall reading that it takes over 800 years for surface waters to permiate down to the deep ocean. If true, any energy increase we may (or may not) be seeing is from the MWP.
Here’s a reality check. For ease of arithmetic, let’s suppose that a 1M x 1M x 200M water column is absorbing 1 Watt every hour of every day for a whole year. If we convert that to calories we get: 5363190 cal.
There are 100 x 100 x 200 x 100 grams of water in the column. Since one calorie causes one gram of water to warm by one degree centigrade, we divide the calories by the grams to get a net heating of 0.027 degrees centigrade per year.
So, if the ocean were a uniform 200 M deep and if it absorbed 1 watt per square meter (of surface) 24 hours a day for 100 years, it would warm up almost THREE whole degrees. That’s the worst case if you make a couple of unsupportable assumptions.
I have no idea how fast heat moves vertically in the ocean but its average depth is around 4000 meters. If the heat were uniformly distributed then the warming would be closer to 0.15 degrees C per century. If we choose a more sensible value for the watts per square meter, then the heating is even less.
As others have pointed out, the warming of the ocean is so tiny that we can’t even measure it from year to year. That’s why the alarmists give us values in gigajoules. It sounds way scarier.
With the accumulated “coolth” from an entire ice age, the deep oceans are colder than a penguins armpit. The last thing we want is that cold water coming up to trouble an unhappy world.
Claiming that that’s where all the global warming has gone is, perhaps, the most honourable exit that can be found for the IPCC.
I am on the hunt for some historical census of deep ocean temperature data: How much by time. I found this curious paragraph describing what appears to be the MiniMODE experimental system from the early 1970s :
These floats were short range so the data is clumpy and the recordings very primative.
Whatever you thought the error bars were on OHC prior to 1970…. double it.
Willis, is it me or is this a typo:
“…from the surface down to 200 metres depth.”
2000 metres, right?
It divides commiebob’s calculated result by 10.
[Thanks, fixed. w.]
My mistake on this comment, Bob T
Willis: Sorry to say, I get different results. But mine show annual changes that are significantly less than yours. Your variations range from about -2.2 to +2.2 watts/m^2, while mine range from -0.06 to +0.06 watts/m^2.I started with the annual NODC vertically averaged temperature data for 0-2000 meters:
http://data.nodc.noaa.gov/woa/DATA_ANALYSIS/3M_HEAT_CONTENT/DATA/basin/pentad_mt/pent_T-dC-w0-2000m.dat
I then created a graph of the annual changes in temperature, and the wiggles matched your graph:
http://i42.tinypic.com/347d1xl.jpg
In their Table S1 of Levitus et al (2012), the NODC provides the relationship between the changes in Heat Storage and Vertically Averaged Temperature. See page 22 of pdf.
http://data.nodc.noaa.gov/woa/PUBLICATIONS/grlheat12.pdf
Based on linear trends, for the period of 1955 to 2010, they claim heat storage increased 0.39 watts/m^2, while the vertically average temperature rose 0.09 deg C, both based on the pentadal data of course. That gives a multiplier of 4.333 watts/m^2 per deg C.
If I then apply that multiplier to the above changes in vertically average temperatures, I have the change in heat storage in watts/m^2.
http://i41.tinypic.com/2la67hj.jpg
@Joe Public
Pedantic correction:
“The Stefan–Boltzmann law is proportional to the fourth power of the temperature T.”
“…where T is expressed in degrees Kelvin.” I am adding this because you cited °C in the previous sentence.
Very nice, Willis.
I’ve seen this depth of penetration argument made a numnber of times. Beware of it because it is false.
Just think about the day night temperature cycle over the ocean. During the day SWR heats the ocean. And at night it cools back down again mostly by radiating LWR to the sky. The amount of heat that it loses at night by radiating LWR is approximately equal to the amount gained during the day by absorbing SWR – else the oceans would have boiled by now.
It is true that since LWR is strongly absorbed by water, only the top couple of millimeters can absorb or emit LWR. This means only a thin skin on the surface cools at night. But this cooled surface layer then sinks and warmer water from deeper down rises to the surface and is cooled in turn. This overturning process goes on all night. Night time cooling due to LWR moves almost as much heat out of the water as the sun put into it during the day via SWR (some heat is also lost to evaporation).
Now consider what happens if there is backscattered LWR at night from clouds or from CO2. The sky appears ‘less cold’ – as can be seen by pointing a thermometer at it – because of the backscattered LWR. The result is that on cloudy nights the surface of the water cools less quickly as the backscattered LWR counterbalances some of the emitted LWR and slows the cooling process.
Net warming of the oceans over a period of time can be achieved in two ways. By increasing the SWR energy absorbed during the day, or by increasing the backscattered LWR to slow cooling at night. Both processes move a similar amount of heat. The fact that only the top millimeter of water can radiate LWR doesn’t prevent a lot of heat moving into and out of water via LWR so long as overturning is mixing the layers near the surface, which happens every night.
Don’t get fooled by the depth of penetration argument. The reason you can’t heat water from above efficiently with a heat lamp is simply because convection would need to run in reverse to mix the heat into the lower layers. So long as convection is running in the right direction an IR lamp can transmit heat into water quite effectively. To warm water from above with an IR lamp all you need to do is stir.
Indeed it is. The 0.3° doubling sensitivity matches my own long-time estimates, so it must be right! 🙂
Self-contradictory, incoherent, patent nonsense. Convection blocks heat penetration. Duh.
Where does the energy come from to do the “stirring”? The work cost to the oceanic heat engine zeroes-out the counter-convection deep heating. TANSTAAFL
Kristian says June 19, 2013 at 5:57 am “It’s important to note that ‘downwelling energy’ to Earth’s surface from above does and can not ‘heat’ the surface unless it comes down as … heat.”
Energy is the ability to do work, whether it is to move an object or to heat an object. Radiated energy becomes heat, electrical energy (solar cells) or chemical energy (photosynthesis) when it is absorbed.
“To warm water from above with an IR lamp all you need to do is stir.”
I don’t think so.
Movement of the water increases surface area which increases evaporation which is a powerfully net cooling process.
Surface molecules receiving downward IR do not get warmer and sink. They simply evaporate sooner than they otherwise would have done and stirring makes it happen even sooner. In the process of evaporating all the energy from downward IR disappears into latent heat for no net slowing of the background rate of energy transfer from water to air.
I went into it all in tiresome detail some time ago, here:
http://climaterealists.com/index.php?id=7798
“The Setting And Maintaining Of Earth’s Equilibrium Temperature “
science is settled
jai mitchell says:
June 19, 2013 at 7:48 am
///////////////////
I have not checked your figures, but they could be correct. All that extra net energy is from Solar.
There is so much excess Solar going into the tropical ocean that it will never freeze. This excess heat/energy is then distributed polewards which in turn prevents the oceans at higher latitudes freezing. It is only tjose at the very highest latitude that don’t receive enough Solar and distributed heat energy emanating from warm currents from the tropics that freeze, or freeze seasonally.
DWLWIR is not needed at all to explain why the oceans do not freeze (a point that Willis does not appear to appreciate). Which is obvious given that about 60% of LWIR is absorbed within the first 2 or 3 microns (not millimeters) where the heat flux is upward such that energy absorbed in the first 2 or 3 microns cannot be sequestered to depth and simply drives surface evaporation. and all but no LWIR penetrates beyond about 15 microns 9where the heat flux still operates upwards).
Nice post Willis. In a much earlier post on this site you made the assertion that the behavior of the ocean and atmosphere above it (what I now think of as the rest of the ocean of water on our blue ball) was the “governor” regulating the temperature on the planet. I agreed with that insightful thinking and now even postulated further on it. (For this response think of the “ocean” as encompassing ALL of the water on the planet, from the bottom of the liquid ocean to the top of the atmosphere where water has crystalized into ice particles.)
I would like to add to the theory in your earlier post, something that I observed later on in a different post here on WUWT. During the time that hurricane Sandy was making a big splash in the news, someone posted a picture of what the storm looked like in the infrared part of the spectrum from outer space – at night, no moon! Now unless the storm was actually giving off infrared light, that picture should have been all black. But what you could clearly see was that different layers of the storm were giving off different amounts of light. So I assert that what was missing from your original post is that at the three different layers in the ocean/atmosphere where phase change occurs – ie. where massive amounts of energy get dumped into the liquid ocean to create water vapor, then at the layer where that vapor condenses back out of the atmosphere, and then again at the top layer where the liquid crystalizes to form ice – you should see in infrared images (especially in the IR spectrum where water has a high extinction coefficient) where water appears to be “glowing”. That IR “picture” is a dynamic rebalancing of the radiative energy equation. Radiative energy being transmitted off of our blue ball is not a static “average” thing. It is as dynamic as solar storms are, and water is the primary molecule that absorbs then moves then condenses and transfers the energy off of the surface of the ocean back to the cold of outer space.
Combining radiative losses from the background IR glowing from storms with the HUGE radiative loss every time lightening occurs and you have the last piece of the dynamic energy balance that is happening every day at all locations on this planet. Any excess energy from the sun that warms up the ocean, causes water to evaporate, carrying that energy into the lower layer of the atmosphere. Now that layer continues to absorb light and along with continuing evaporation lifts the water vapor up vertically until the elevation where the temp/press matches dew point at which point condensation releases some of the energy radiatively back to space and also coincidentally creates a white billowy cloud that now scatters sunlight back to space preventing the ocean below from absorbing any more energy. If the condensed water vapor continues to absorb excess energy from the sun and is fed more water vapor from below the white billowy cloud climbs higher and higher until it reaches the height where the temp/press match the freezing point and a second phase change occurs. Both phase changes AND the active transport of energy off of the liquid oceans surface up to the highest level of the atmospheric ocean create a “self regulating” system that CAN NOT exceed the boundaries water’s natural temp/press/phase properties place on it.
This “model” is still too simplistic because in any storm, a massive amount of energy is consumed in the work of transporting huge volumes of water across vast expanses of ocean or land, and the energy expended in a storm can get extreme! No one can really predict the violence that results. Chaos!
In a self regulating system that at any point in time or space has temperature varying from a warm 80 degrees all the way up to 0 degrees where ice has formed, again what is the point of fixating on “average” temperature variation of 1 degree over a day, month or year? or trivial fluctuations in average energy content that is more than likely noise? Why is everyone paying so much attention to our self regulating system’s noise that is most likely error in measurement anyways?
Jeff Norman
when you said,
The interesting (bizarre) part of their argument requires that the energy flux at the surface has to be orders of magnitude higher in the areas where there is downwelling.
————
This isn’t really true at all, in the tropics where the heat is absorbed by the ocean only a very small change in the mixing/efficiency of heat energy transported into the deeper waters would produce the measured warming in this article.
maybe about 1.2% increased absorption in the tropics would do it. See the following graphic.
http://oceanworld.tamu.edu/resources/ocng_textbook/chapter05/Images/Fig5-7.htm
The tropical net energy absorbed in the latitudes of -30 to +30 is about 40 Watts per meter squared on average.
Willis,
Really appreciate looking at this from average power density rather than total joules to gain proper perspective.
Performing a simple numerical integration using the “trapezoidal rule” on the data from your spreadsheet yields 0.21W/m^2 averaged over the 57 year period.
Doesn’t seem like much to be worried about relative to the earth’s average solar insolation and known negative feedback mechanisms i.e. thunderstorms.
Reducing this by a factor of 37.5, as indicated by Bob Tisdale’s update, yields an average 0.0057W/m^2 averaged over the 57 year period.
Not going to worry over this one bit
jai mitchell says:
June 19, 2013 at 10:43 am
“Jeff Norman
when you said,
The interesting (bizarre) part of their argument requires that the energy flux at the surface has to be orders of magnitude higher in the areas where there is downwelling.
————
This isn’t really true at all, in the tropics where the heat is absorbed by the ocean only a very small change in the mixing/efficiency of heat energy transported into the deeper waters would produce the measured warming in this article.
maybe about 1.2% increased absorption in the tropics would do it. See the following graphic.”
You do know that the downwelling of CO2 rich cold water happens near the poles, right?
http://en.wikipedia.org/wiki/File:Thermohaline_Circulation_2.png
Eric H. says:
June 19, 2013 at 6:38 am
Not really, or at least that’s not all there is to it. Once it strikes the ocean, long-wave infra-red (LWIR) is converted from radiant energy to thermal energy, so it adds energy to the ocean. See my post Radiating The Ocean for a “full and frank” discussion of the issues.
w.
DirkH
Yes, I know about the Meridional Overturning Circulation. what is it you are trying to say? That the normal amount of ocean convective heat transport determines the only way that heat energy can be transferred into the deeper oceans?
You do realize that the only way the “CO2 rich” water sinks is because it gets colder (and has a higher salinity) Which means that the absorbed heat from the tropics is released into the atmosphere.
This is why Europe stays warmer than Montana and the Dakotas even though they are at the same latitude.
The point is a very small amount of surface mixing and transport of the 40 Watts per meter squared energy absorption that occurs in the oceans from -30 to +30 latitude is needed to completely hide the global warming signal
AND
This is exactly what happens during a negative PDO (and La Nina)
richard verney
The reason the oceans don’t freeze is because water that gets colder gets denser and sinks. Then warmer water takes its place. That is why the surface of a pond freezes but you can still ice fish 🙂
During the day coelacanths rest in caves as much as 5°C warmer than ambient water. This suggests that their physiology is still adapted to some extent to the Devonian surface temperature at which their vestigal lung evolved, while for survival these slow, energy efficient swimmers feed in cold, deep water. But the question arises, why are these caves warm? Possible contributing factors include: 1) ground heat, which would produce some 70mW/m^2 on much of the cave surface; 2) communal coelacanth body heat; 3) relict heat from occasional episodes of warm saline water flowing from the Red Sea or Persian Gulf.
At any rate there certainly exist mechanisms for transporting surface heat downward, including both tide turbulence at all depths and downwelling warm saline water. –AGF
It is worth re reading Willis’ previous post on Levitus.
It is also worth noting the comment made by Manfred (see his post of May 10, 2013 at 7:46 pm). It is so important that I set it out again in full:
“Just to show how implausible the 1 E23 Joules increase during the approx. 2 years around 2003 is:
Global ocean surface is 361 E12 m2.
2 years have 63 E6 seconds.
That means average heat uptake of oceans must have been
1E23 Watt *s / (361 E12 m2 * 63 E6 s)
= 4.4 W /m2 in the 2 years around 2003.
Compare this with with the IPCC AR4 estimate of ocean heat uptake of 0.2 W/m2.
There is no way that oceans took up as much heat in 2 years around 2003 as in all other years between 1970-2010 combined (see figure 2).”
Retired Engineer John says, June 19, 2013 at 9:55 am:
“Energy is the ability to do work, whether it is to move an object or to heat an object. Radiated energy becomes heat, electrical energy (solar cells) or chemical energy (photosynthesis) when it is absorbed.”
Er. No, John. Energy does not ‘become’ heat upon absorption. This is such a basic concept that I simply can’t fathom why educated people have such a hard time grasping it but instead keep on mixing it up.
‘Heat’ is called ‘heat’ for a reason. ‘Heat’ heats.
Heat is energy transferred from a hotter to a colder system. So that the hotter system heats the colder system. Heat only ever spontaneously moves in this SINGLE direction. Cold cannot heat hot. That’s all you ever need to know.
The direction of movement of a block being pushed forward by a strong force will not be reversed if applying a weaker force pushing up from the opposite side. All that happens is a slowing down of the block’s forward acceleration. F-> is reduced because ma-> is reduced. There is less ‘work’ done per unit of time.
Just like heat transfer. Put a less cool object than before in front of the warm object and Q-> is reduced because (Th^2 – Tc^2) is reduced. The direction of the energy transfer, however, is not reversed. There is still no ‘heat’ going from the cool object to the warmer. Not at all. And remember, only energy in the form of ‘heat’ heats (disregarding ‘work’, which also only goes one way). The opposing object will have to be, surprise, surprise … warmer than the warm object in order to be able to accomplish that.
As soon as people stop considering all energy to be heat and hence that heat can travel in all directions only more in some than in others (it can’t and it doesn’t), this whole bizarre notion that ‘DLR heats the oceans’ will dissolve at once. ONLY the Sun heats the oceans from above. Why? Because the Sun is hotter than the Earth’s surface and can thus function as a heat source (a ‘hot reservoir’). A revolutionary idea, don’t you think?
Anthony
“Makes me wonder how Murphy finds such a large trend in OHC, but Levitus does not find any trend in forcing.”
I’m sure both Anthony and Willis know very well that once you have put the water boiler on you don’t need a “trend in forcing” to get the water boiling.
Spencer produced the same graph two years ago btw.
Kristian says: June 19, 2013 at 11:43 am
Kristian, get yourself a good physics textbook and read it.
This is probably a dopey comment. But I’m far from convinced anyone really knows much about temperature or heat in the oceans. ARGO hasn’t been going long enough and there aren’t enough of them.
And the people beating the scare drums are proven incompetent liars.
But what about heat coming up from the core?
Doesn’t that matter? There was a paper earlier this year suggesting a core temperature of 6,000ºC. Instead of 5,000ºC aassumed previously by everyone except Al Gore. Doesn’t this make a difference? What about all those pesky vents?
Not sure about ocean temperatures 2,000 m deep (or much more). Don’t think it is all that hot.
1,000 m down a coal mine is bloody hot.
Just a thought.
There are three ways to account for a global energy imbalance (at the ToA). Either 1) there is more coming IN, 2) there is less going OUT, or both, or 3) something happened at some point (or across a stretch of time) where the cooling mechanisms of the Earth system all of a sudden fell way behind the solar warming mechanism, without the solar necessarily in itself increasing. After such a threshold being crossed, the cooling mechanisms would have to start playing catch-up. In the meantime, until balance after some time, depending on the original gap, became restored, there would be global warming (a net global accumulation of energy).
Well, global OLR has increased rather than decreased over at least the last three decades of observed global warming. That’s Earth strengthening its cooling to space while still warming. That’s an impossible combination if the atmosphere were to be the cause of the warming. You cannot create a positive energy imbalance by increasing the heat loss and keep the heat gain steady. Either you increase the heat gain or you reduce the heat loss.
The only way the atmosphere could induce warming is by restricting or limiting the cooling (assuming absorbed solar flux to be pretty much constant). Increased cooling during warming points to a (lagged) Earth system response to solar input, not to the atmosphere being the cause of the warming.
This has a lot to do with the variation in cloud cover above the tropical oceans. This to a large extent governs how much solar heat is absorbed by the Earth system. Heat gain. The ENSO process is the main controller of this variance. However, it also has a lot to do with tropical pressure gradients –> tropical mean wind stress across the ocean surface –> mean release of latent heat through evaporation from the tropical oceans. Heat loss.
Something clearly happened pressurewise in the Pacific Ocean in the mid 70s:
http://i1172.photobucket.com/albums/r565/Keyell/SOIvslatentampwind_zps8dcdab36.png
Is the latent heat flux forced to play catch-up from 1978/79 (upon the completion of the Great Pacific Climate Shift) onwards …?
2 conclusions
1. If there is more heat going into the deep ocean, the body of water to be heated is much larger than previously thought, requiring less surface warming and a lower sensitivity.
2. As temperature increases in deep ocean are only of the order of hundredths of a degree since 1750, that heat can never recombine to generate a warming of say additonal 1 degree on the surface once deep water upwells. Entropy cannot be reduced.
Therefore heat going into deep ocean is not much different from going back to space.
Retired Engineer John says, June 19, 2013 at 12:21 pm:
“Kristian, get yourself a good physics textbook and read it.”
I don’t have to, John. I’m not the one not getting (or simply misrepresenting) what the basic thermodynamic concept of ‘heat’ is and means.
Great post and excellent observation, unexpected oddities are a fecund source of new discovery. So the thermal budget associated with measured ocean temperature changes is small and insignificant? Reflecting on this, the word that comes to me is thermocline. When I was studying oceanography at Uni back in the early 80’s, the thermocline was presented as a central feature and impassible obstacle in ocean heat dynamics. There is surface vertical mixing above it, and deep circulation below it, but not much exchange across this sharp thermal barrier.
but like so much historic established research this understanding of the thermocline has been brushed aside by “climate science”. Now we are told that large amounts of peccatogenic heat can fly down in practically real time from the atmosphere to 2000m ocean depths without any thought of obstruction by the thermocline.
However, Willis’ finding of only small heat changes measured in the oceans suggests that the thermocline might indeed be a real barrier, and that thermal budget above it and maybe below it also is something of a zero sum game. Are SSTs hot? This is from stratification meaning that deeper down it remains colder. Vice versa when above-thermocline mixing causes cooler SSTs. So Willis’ data may point to a damping and stabilising role of the thermocline.
This combined with the gigantic heat capacity of the oceans may mean one has to look to century and millenial timescales to notice the oceans’ thermal dynamics.
The PRIMARY role of the physical sciences is to notice the countless procession of things we can’t simply quantify. Failing to understand this is the Achilles heel of modern sciences and the “Enlightenment” mentality in all fields. Modern science ever portends a grasp of reality, just around that corner if not sooner.
This is the fallacy of the assumption of knowledge without proof. Add to that the fallacy of “not knowing” as a failure.
serious error in the trend calculation here. i find
0.23 plus-or-minus 0.02 W/m2 (2-sigma)
which is easily statistically significant.
REPLY: Stan, show your work. Just saying there is an error with out showing how/why is meaningless – Anthony
the work is easy — just use excel to calculate the data’s slope and its uncertainty. for 0-700 meters it is
0.265 plusmn 0.020 *10^22 J/yr
then divide by the area of the ocean (361.8 M sq-km)
Kristian says:
June 19, 2013 at 12:42 pm
“I’m not the one not getting (or simply misrepresenting) what the basic thermodynamic concept of ‘heat’ is and means.”
Um, yes you are. I am the third or fourth person to call you out on it. I’m pretty sure we are all non-warmists. You are not helping us. You are making long posts which thereby become representative to onlookers, and paint us all in a bad light. Please stop.
Ximinyr says: “the work is easy — just use excel to calculate the data’s slope and its uncertainty. for 0-700 meters it is…”
But Willis presented data for depths of 0-2000 meters
Regards
Bob Tisdale says:
June 19, 2013 at 9:11 am
“http://i42.tinypic.com/347d1xl.jpg”
Good graph.
Info like that plot tends not to be posted in a location many readers would see but should be. That shows the claimed actual temperature variation in Kelvin, amounting to a few thousandths of a degree over the years and decades, not converted to another metric hiding how tiny it is. To place much stock in trusting such, one would have to believe that temperature over that volume of ocean is both measured with 0.001K level accuracy and so reliably reported, at the same time even something with far more potential independent verification, reported U.S. surface temperature history, has 0.3+K variation.*
*
http://www.giss.nasa.gov/research/briefs/hansen_07/fig1x.gif
…is very contradictory to
http://data.giss.nasa.gov/gistemp/graphs_v3/Fig.D.gif
…as the former shows the 5-year mean of U.S. surface temperature was 0.4 degrees Celsius colder during the local high in the 1980s than during the high in the 1930s, but the latter had those two times under 0.1 degrees Celsius apart in the same 5-year mean.
Contradiction is further illustrated about two-thirds of the way down in http://s9.postimg.org/3whiqcrov/climate.gif which enlarges on click, with lines drawn to be more blatant.
The most useful thing about the deep ocean is that because it deep and massive its very hard to measure anything down there and there ‘could be’ lots of things there , indeed perhaps more is know about the moon than the deep oceans so our knowledge is not good .
Which for the AGW faithful means that lots of things can be ‘claimed’ via modelling to be true about it because these claims cannot be disproved . Now in normal science that would mean your theory is at best only a ‘theory ‘ But in ‘special’ Trenberth science strong belief in the models is all you need has definitive proof .
Bart says, June 19, 2013 at 2:13 pm:
“Um, yes you are. I am the third or fourth person to call you out on it.”
Calling me out on what, Bart? You’re calling but you’re not showing anything.
What is ‘heat’ to you, Bart? Does it fly around in every direction? Show me how my definition of ‘heat’ goes against the physical definition. Show me how the atmosphere is a source of heat for the surface, how it transfers heat downwards. Do that instead of submitting meaningsless, unsubstantiated “Um, yes you are” comments …
Bart says to Kristian:
“Please stop.”
Yes, Kristian. Please stop. Stop before Bart starts drowning in his own drivel of cognitive dissonance.
Ximinyr says:
June 19, 2013 at 1:19 pm
Ximinyr says:
June 19, 2013 at 1:27 pm
No, it’s not “easy”, and you do need to show your work rather than just say “the work is easy”. Easy work in climate science is often the hardest.
It’s hard to say because you haven’t shown your work, but I suspect you have forgotten to adjust for autocorrelation. The autocorrelation of the 0-2000 metre layer temperatures is very high, so that reduces the significance of any trend, as I pointed out above.
I use the method of Nychka (pdf), if you are interested in doing it yourself. See in particular Section 4.4.4.
It calculates an “effective N”, which is the number of data points you effectively have.
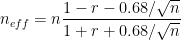
where “n” is the number of data points, and “r” is the lag-1 autocorrelation of the detrended series.
For the Levitus dataset, n = 58. But because of the very high autocorrelation (detrended autocorrelation = 0.78), if you plug those numbers into the formula you get an effective n of only four data points …
Of course, this affects the “degrees of freedom” for calculating the significance of the trend. And that, in turn, gives the trend of the ocean heat content of the 0-2000m layer a p-value of 0.08, meaning it is not statistically significant.
Please remember this lesson the next time someone asks you to show your work, and you get your back up and say it’s “easy”. You’re right, we’re only asking in order to find flaws in it … and the name of that process is “science”.
All the best,
w.
Willis: I discovered my error. If you would, please strike my June 19, 2013 at 9:11 am comment. Or if you like, I will.
[REPLY: Thanks, Bob, you had me worried. I don’t ever delete my wrong postings or comments, although I have the ability and authority to do so, that wouldn’t be right in my world. Instead, I put in a note at the head of the comment or post saying [UPDATE: I erroneously calculated the results. -w.] or whatever the situation calls for. Even then I don’t disappear wrong numbers or conclusions. Instead, I use the html strikeout codes of strike and /strike to strikeout what was in error.
However … YMMV.
w.]
Kristian says:
June 19, 2013 at 5:57 am
Thanks, Kristian. I will join the others who say your understanding of physics is flawed. Let me see if I can point out exactly where. You start by saying:
Neither the solar flux, nor the downwelling longwave radiation (DLR) from the atmosphere, nor the upwelling longwave radiation (ULR) from the surface, is a flow of heat. They are all flows of energy. Heat, on the other hand, is a NET energy flow.

It is easier to understand if I show it in terms of money. Here are two views of the same transaction:
In the upper panel, we see the entire transaction. I give you a hundred dollars, and you give me seventy-five dollars. There is a two-way flow of money.
In the lower panel, we see the NET effect of the two individual transactions—I give you twenty-five dollars. There is a one-way flow of NET money.
Note that both of these views are entirely true and correct. They’re just different ways of looking at the two transactions.
The exact same situation exists with longwave radiation, if you consider the actual exchanges of money in the illustration as actual exchanges of energy, and the net money flow as the flow of heat.
Suppose we have 75 W/m2 of downwelling longwave radiant ENERGY (not heat) striking a planetary surface, and an upwelling longwave radiant energy of 100 W/m2. As in the illustration above, the NET heat flow is 25 W/m2 and is in one direction, from warm to cool. But the physical reality, what actually happens, is just like with the money—75 W/m2 of energy is actually flowing from atmosphere to surface, and 100 W/m2 of energy is actually flowing the other way, with a NET heat flow of 25 W/m2 going in only one direction, upwards from warm to cool.
Next, there have been thousands of electrons that died unnecessarily from folks arguing whether the downwelling radiant energy “warms” the surface. To avoid that semantic difficulty, I put it this way:
The surface is warmer than it would be in the absence of downwelling longwave radiation, by the amount of energy absorbed.
If you go back to the illustration of money, it’s like arguing about whether I’m “richer” (= “warmer”) because you pay me the $75. I don’t end up “richer”, I end up with less money than when I started. But I can put it the same way:
My wallet is fatter than it would be in the absence of the money coming from you, by the amount of money I get.
So in terms of radiation, while a cold object cannot warm a warmer object, it can slow the cooling rate by the exact amount of the back-radiation.
There is no such thing as “radiative heat”. It doesn’t exist. In radiative terms, heat is a NET energy flow, not a single flow of energy. There is definitely radiative energy coming down from the atmosphere to the surface of the earth, and if there weren’t, the earth would be much colder. You can call that “warming the earth” or not as you desire, the end result is that the earth ends up warmer because of the downwelling radiative energy than it would be if it weren’t there.
Always a dangerous and hubristic claim, my friend …
w.
the Levitus dataset for 0-700 m is given quarterly; it has n = 233
Alan the Brit says:
June 19, 2013 at 4:29 am
What they really mean, in placing limits of CO2 emissions, is making cars more economical, doing more kM/ltr or mpg. That is the only real way they can reduce vehicle emissions!
==========
Close. Actually, they could get fewer CO2 emissions from the same vehicle three ways:
1. As you suggest, make the conversion of hydrocarbons to motion more efficient. Lots of room for improvement there in theory I believe, but it’s not all that easy to do or it would be done.
2. Make the vehicle lighter. Also not easy
3. Switch the fuel from liquid hydrocarbons to methane (Compressed or Liquified Natural Gas). The exhaust stream will include more H2O and less CO2 because all of the energy produced from combustion comes from C-H bonds and none from C-C bonds.
Willis, if I had read Levitus et al to determine how they defined storage (derivative of time), I could have saved myself the embarrassment. So I struck through my offending comment.
Again, great post.
Regards
Thanks Willis,
Excellent post along with some good comments. Particularly like your energy explanation. Was working on one myself for the same reason but yours was way better.
Ximinyr says:
June 19, 2013 at 4:22 pm
Thanks Ximinyr. Since I’m not discussing that dataset, I’m unclear what your point is.
In addition, it looks like you’re starting to search for a significant trend somewhere in the dozens and dozens of subsets of the Levitus data. I took one dataset, the most inclusive, global 0-2000m. I like to start with the most general, if I find something there it may be real …
The problem you now face in looking at subsets is this. Suppose you look at say a dozen datasets, and find one whose trend is statistically significant at the 5% level (p=0.05). Remember that this means that one in twenty of your claimed significant results will occur by chance. One in twenty “significant” results will actually be a “false positive”, an incorrect claim of significance for a random occurrence.
So what are the odds of finding a one-in-twenty false positive if you look at twelve datasets?
The answer is (1 – !pn), where “n” is the number of datasets, and “not p” (!p) is the probability of NOT finding a false positive in one trial (0.95). In this case that would be
1 -0.9512 = a 46% chance of finding false positive in twelve trials. That’s almost a coin flip …
Finally, it may be that the oceanic heat content in some layer of the global ocean, or some entire basin, has a significant trend. My point was a bit different. It was that the most general measurement of ocean heat content, from the surface to the maximum depth of the global oceans, does NOT show a trend which is significantly different from zero. Nor is the mean of the annual forcings in that dataset significantly different from 0. This is the total global heat storage in the ocean, a number of importance in the climate discussion.
Let me close by saying that I don’t point these things to discourage you, just to assist you in developing a more jaundiced eye. I spend lots of time testing the significance of what I find. I encourage you to look at the quarterly 0-700m dataset, there’s always more to learn. Don’t forget the autocorrelation …
w.
w:
so you agree, ocean warming is highly statistically significant for the 0-700 m region.
and for the 0-2000 m region, there is warming but the data is insufficient to conclude that at the 95% confidence level.
Bob Tisdale says: “My mistake on this comment.”
No real harm done, Bob. I eyeballed your results, compared them with Willis’s, decided it didn’t matter much. Willis had the more conservative numbers, which were quite acceptable, so I assumed they were right. If not, so much the better. Embarrassment is and should be an occupational hazard in Science done properly.
agfosterjr says:
June 19, 2013 at 11:08 am
Thanks, ag. I spent a reasonable chunk of my life as a commercial fishermen, and I’d never heard that. Sadly, you gave no link, but here’s one in return. I found out some interesting things about coelacanths.
No known predators. Eats less than any other known vertebrate. Slowest metabolism of any known vertebrate. Longest gestation period (3 years) of any known vertebrate. Basically they seem to drift around motionless, conserving energy, and wait for food to swim by.
Curiously, that link doesn’t mention warm caves, although it talks about caves. And it appears to contradict your claim, saying (emphasis mine):
Seems doubtful, given all of that, that they’d preferentially sleep where it’s warm. Unlike most creatures, they’re going for slow, not for fast. The warmer they are in their sleep, the more energy they burn, and the more they have to go out hunting …
Always more marvels in this amazing world … thanks for reminding me of an astonishing fish.
w.
Ximinyr says:
June 19, 2013 at 5:14 pm
As far as I know, in this thread I’ve said nothing about the significance of anything but the 0-2000m layer.
I can defend my own words. I can’t defend your interpretation of my words. If you have an issue with something I say, please quote what you object to, so we can all understand what you are talking about.
Thanks,
w.
and, your methodology is flawed.
you aren’t calculating the trend of OHC, you are calculating the trend of the derivative of OHC. that is a very different thing.
to find if a body of water is warming, i.e. if the amount of heat Q it contains is increasing, you would calculate dQ/dt. that’s the slope of OHC(t).
but you have first calculated (essentially) d(OHC)/dt for each year, then calculated the slope of *that*. That’s more like the 2nd derivative, which you have found to be positive (but at some CL lower than 95%) — i.e that the rate of increase is (most probably) increasing.
a proper calculation of the linear trend of OHC for the 0-2000 region gives 0.27 plusmn 0.01 (1-sigma, no autocorrelation, entire Earth area). autocorrelation will increase sigma by a factor of sqrt((n_eff-2)/(n-2)), where n_eff can be calculated by your Nychka method. that’s a factor of (i’m guessing; i haven’t calculated the lag-1 correlation coefficient) 3 or so, but it’s certainly far less than 27/2, which means the trend in OHC is easily statistically signficant at the 2-sigma level.
conclusion: the 0-2000 m region of the ocean is most definitely warming.
Ximinyr (and others), determining the significance of a particular dataset is not a simple task. If I have a dataset that I truly want to know the significance of, I usually model it as an ARMA (auto-regressive moving-average) process and do a Monte Carlo analysis.
In the computer language “R” it’s easy to extract the best-fit AR and MA variables for a given dataset. For natural climate datasets these are often on the order of 0.7 for autoregression, and -0.3 for the moving average. However, each dataset gives different coefficients. I generally only model it one lag deep, although you can do more.
Then I use those coefficients to generate I don’t know, say 100,000 random datasets with those coefficients and the length (n) of the observation dataset. Random ARMA pseudo data.
Having done that, I just count how many of them have a greater trend than the observations …
I’ve tested the Nychka formula I gave above in this Monte Carlo manner, and it gives generally good results and is usually a bit conservative. By that I mean, usually the Monte Carlo analysis indicates the situation is worse than Nychka’s method says, less significant. So I use it for my quick and dirty work.
w.
w: the question isn’t really about your statistics, it’s about your physics.
you are calculating the trend of d(OHC)/dt, not the trend of OHC.
The Ocean ate my homework is not a convincing argument…
Ximinyr says:
June 19, 2013 at 6:45 pm
Oh, stop with the jerkwagon pronouncements. I am indeed calculating the trend of the OHC. I have also calculated the trend of the annual forcing necessary to produce the trend in the OHC. Neither one is significant.
I see. You haven’t done the work yet, you haven’t said which dataset you’re using (pentadal? quarterly? annual?), but you’re here to tell me I’m wrong? That’s hilarious, X, you don’t mind if I call you X, do you?
Around these parts it’s considered good form to provide links. Links to the dataset you are using. Links to the spreadsheet where you did your calculations. In other words, you’ve been asked several times to show your work.
You have not done the slightest thing to comply. Instead, you inform us that you haven’t even done the calculations, but you know the answer …
I’ve tried to assist you. You’ve paid no attention. Now I’m stopping. Please direct any further comments to someone else, this is bad for my blood pressure.
The rest you have to do on your own. Here’s a protip: repeating your claim once again about the slope, once again without showing your work, once again without citation or explanation, will get you no traction around here. That don’t impress anyone much.
w.
sorry willis, you are not calculating the trend of OHC.
you are calculation the trend of the change in OHC, because you are assuming the forcing is proportional to the change in OHC.
your entire post is wrong. what you have proven is that the warming of the ocean is most likely accelerating.
i am using the pentadal 0-2000 m dataset:
http://data.nodc.noaa.gov/woa/DATA_ANALYSIS/3M_HEAT_CONTENT/DATA/basin/pentad/pent_h22-w0-2000m.dat
but the question isn’t about the data, but your interpretation of it (i.e. the physics), which you have badly muffed.
Re: showing work. given the data (link above), it is easy to calculate the trend and trend’s uncertainty with Excel’s LINEST function. then you can correct for autocorrelation if you so desire via n_eff. i assume anyone here can calculate the slope of a line using linear regression and there’s no need to show that work.
the issue is, you have not understood what you are calculating. this post is completely wrong.
what’s more, it’s *obvious* that you’re wrong. anyone can look at the graph of pentadal 0-2000 m OHC and see that it is increasing in an obviously statistically significant manner.
it’s the graph #2 here:
http://www.nodc.noaa.gov/OC5/3M_HEAT_CONTENT/
Joseph Bastardi says:
June 19, 2013 at 4:54 am
Everyone knows my admiration for Bill Gray, so at the risk of bias, I live and die with his ideas. Let me share this with you:
http://typhoon.atmos.colostate.edu/Includes/Documents/Publications/gray2012.pdf
a great read
========================
Thanks for the link, I agree with you that it is a worthwhile read. Good graphics. Nice to see the radiative balances clearly expressed in the graphics. I intend to go over this paper by Gray again later.
Should be read by those trying to gain knowledge to keep up with some of the more involved discussions.
=================================================================
I would add, “and nothing to be ashamed of.”
(We are talking “science” and not “grammar”, right?)
a great read
it might be if it had passed peer review. without that it means very little, and will have no influence.
I guess I’m pretty dumb as I had never though of it this way
Judith Curry – “Climate etc” in her very recent post; “The New Republic on the ‘pause’” has this to say in her own comments.
[quote]Global warming is pretty much defined in context of the mean surface temperature. People live on the surface, not in the ocean below 700 m. Yes, warming the ocean interior will cause some sea level rise associated with thermal expansion. But this line of argument that warming in the deep ocean will change the climate (presumably due to changes in the ocean circulation) really just supports the argument for ocean circulations being a primary driver for climate (the natural variability hypothesis promoted by many skeptics).[ end]
If Trenberth’s missing heat is going into the oceans then the oceans are the main controllers of the global climate as they absorb, smooth out and transfer heat around the planet.
And when that “dangerous” heat is again released as promised by Trenberth, Hansen and etc, it is the Oceans that will again be controlling the global temperatures and climate.
Where does CO2 fit into that except in a minor and / or subsidiary role?
1 / If the missing heat is going into the oceans it’s not CO2 but the oceans that are the main controlling factor of the global climate [ nothing much new there, ]
2 / Or Trenberth’s “missing heat” has just gone plain missing and nobody yet knows why.
Or far more likely, that “missing heat” was never there to actually go missing.
The solar guys are probably the closest to the answers to the “missing heat” question.
All just another blatantly biased example of climate model vapourware and climate warming scientists running around as all their previous theories fail, with yet another hypothesis looking for an excuse to exist..
.
=======================================================
Perhaps you should at least “copy/paste” the commenter’s name with the date and time they made the comment you are responding to?
w: here’s an explanation more in the language you’ve used.
you’ve shown there is a small trend in the annual forcing, that isn’t statistically significant at the 2-sigma level (but is at some lower level).
but even an unchanging forcing, i.e. a constant forcing, means the ocean is warming — some number of W/m2 is going into the ocean on a constant basis. more joules every second.
that *heats* the ocean, until the forcing=0.
a zero *forcing* keeps the ocean at a constant temperature (i.e. constant OHC), not a constant forcing.
you haven’t understood what you’re really calculating. this is a wrong post all around.
Willis Eschenbach says, June 19, 2013 at 3:57 pm:
“Neither the solar flux, nor the downwelling longwave radiation (DLR) from the atmosphere, nor the upwelling longwave radiation (ULR) from the surface, is a flow of heat. They are all flows of energy. Heat, on the other hand, is a NET energy flow.”
Eh, have you even read my posts? Where do I say anything to the contrary? That’s my whole point. There is no NET flow of IR, as you call it, to the surface from the atmosphere. Hence, there is no HEAT, as I call it, going from the atmosphere to the surface. The NET radiative energy goes from the surface to the atmosphere. There is no IR from the atmosphere that can increase the internal energy of the surface, because on average more always goes the other way. The posited 390 UP and 324 DOWN fluxes are part of the same exchange and the spontaneous flow of NET energy (‘heat’) that results is going UP. That’s my whole point.
If we agree on this, which we appear to do, there is no quarrel.
The solar flux, however, is clearly a heat flux. It warms the Earth. It brings the surface a NET contribution of energy – heat. It is most important to separate between systems when looking at heat flows. There’s the ‘exchange’ between Sun and Earth’s surface. That is +168 W/m^2. Radiative HEAT coming IN (of course there is such a thing, that is the thing, that’s the thing that’s actually measured/detected, not the inferred individual fluxes). Then there’s the ‘exchange’ between Earth’s surface and atmosphere/space. That is (324-390=) -66 W/m^2. Radiative HEAT going OUT. (Of which 26 go to the atmosphere and 40 go directly to space.) Then you have that other heat loss flux from the surface which is the convective one (conduction/convection + evaporation). Convective HEAT going OUT. This is -102 W/m^2 on average. It all goes to the atmosphere.
(-66-102=) -168 W/m^2 of total HEAT escapes the surface. Balancing the incoming from the Sun.
This is the heat budget of the Earth’s surface. It is balanced. 168 in, 168 out.
Well Ximinyr,
I am pretty sure that if the ocean heat content has an average effect of increasing the averaged temperature of the ocean by less than a .1 degree C over the course of 60+ years; for most of that time we were taking a very small number of measurements; and those measurements were taken had a greater uncertainty than .1 degree C than this is logically not significant.
If you have to take a measurement such as the oceans temperature and turn it into energy and then graph it so it looks huge and significant your not doing anyone any favors. Particularly if the data it is based on is not statistically significant.
David Riser: i am told that ARGO sensors can measure temperature to ~0.01 C.
it does not matter if you are talking about heat gain or temperature — they are proportional. the oceans have a huge volume, so a small temperature change means a lot of heat change.
what do you think is the change in avg ocean temperature from a glacial to interglacial period?
Kristian says:
June 19, 2013 at 9:21 pm
Yes, thanks, Kristian, I have read them, and I’d be glad to help you out. Here is exactly what you said to the contrary:
There is no such thing as a “heat flux”. You claimed the solar radiation was a “heat flux” but DLR wasn’t, which is wrongity-wrongity-wrong.
And it is certainly “to the contrary” of my statement above.
Q. E. D.
In any case, why would solar and DLR be different in their ability to transfer energy? They’re both EMR, just different frequencies. You think only light can heat things, but DLR can’t? How do you think a microwave oven works, or an infra-red heater? All kinds of electromagnetic radiation can transfer energy, and can add that energy to things that they strike.
You went on to say:
That’s because there is no such thing (except apparently in your imagination) as a a flow of “radiative heat”. You think the sun puts out “radiative heat”, but DLR doesn’t … and as many folks have said, that’s way, way wrong. It’s reflective of your very weak grasp of the underlying concepts.
There’s an old saying. When one man calls you a horse, laugh it off. If two men call you a horse, think it over.
But if three men call you a horse … buy a saddle.
At this point a number of folks, more than three, have told you that your claimed understanding of physics is poor. I agree completely, your misunderstanding is profound. So at this point, you have two options:
1. Admit you are wrong, even if just to yourself, and go and learn some more, or
2. Continue with your absurd and futile, although somewhat funny, attempt to convince us that you really do understand this physics thingie, yes sirree you do, and if we only knew it, your physics-fu is so awesomely strong …
Your choice.
Me, I’m noted among climate bloggers because I admit publicly when I’m wrong. It’s not easy, and I hate doing it, but it’s the only way for me to learn and for science to advance. Falsifying someone’s scientific ideas and theories and claims is at the heart of science, even when it’s my own claims and ideas that get falsified.
Best regards,
w.
The variation in figure 1 is again totally implausible.
There is a mean of 0.2 W/m2 representing the oceans heat uptake due to total forcing of about 1.6 W/m2 since 1955
(IPCC at about 2.4 today, about 0.8 in 1950).
http://i81.photobucket.com/albums/j237/hausfath/ScreenShot2012-12-13at43419PM_zps4a925dbf.png
Every upside variation has to be associated with a reduction in cloud cover.
The effect of a 3% decrease in cloud cover is believed to represent a forcing of 1-1.5 Wm-2 (Rossow and Cairns, 1995, Svensmark has similar numbers).
Observed cloud cover changes amount to only a few percent over a year. Therefore cloud reduction forcing has at maximum been about the size of the total forcing.
Any yearly variation in figure 1 exceeding about 0.2 W/m2 is then not plausible.
Larger variation must then be a measurement error. Such errors may level out during long term measurements similar to very noisy sea level data.
But this does not apply to the largest error in 2003-2005 due to equipment change to ARGO. This false step increase in ocean heat content will not be corrected by future ARGO data.
The AGW paradigm of the ocean is ludicrously simplistic. It treats the oceans as a passive puddle. Only external “forcing” (what a deeply ignorant word) can change its temperature and heat content. However the oceans own internal dynamics with oscillations on century and millenial scales drive heat and temperature changes in the upper ocean, bearing in mind the overwhelming majority of climatic heat content being in the ocean. Measured temperature trends in the upper ocean allow very little if anything to be concluded about in-out heat budget.
I love this graph. It is easy to understand, and it shows how little change there really has been.
Ximinyr says:
June 19, 2013 at 7:04 pm
you are calculating the trend of d(OHC)/dt, not the trend of OHC
—————————
Yes, because Willis was talking about d(OHC)/dt, What is your point ???
The trend in OHC is approx. equal to the mean, also given in figure 1. Its all there…
Ximinyr says
David Riser: i am told that ARGO sensors can measure temperature to ~0.01 C.
Actually ARGO sensors are not that accurate nor are they the same type or design of sensor across the fleet. Nor is the accuracy of other ocean temperature sampling methods prior to ARGO that accurate. for a interesting read on the issue:
http://earthobservatory.nasa.gov/Features/OceanCooling/page1.php
To go from Cooling to Heating based on the accuracy of your measurements is precisely what Willis is talking about.
Ximinyr says:
June 19, 2013 at 8:33 pm
Man, that’s just too precious. Why waste time on math, it’s so hard after all ,,, just look at the graph and declare victory, anyone can do it!

Hilarious … however, thank you for identifying the dataset you are using (pentadal global 0-2000 heat content).
For those who, unlike Ximinyr, want to actually do the math before declaring victory, here’s how it works out.
Mr. X is right that Excel makes it look like there is definitely a significant trend in the pentadal. The slope and error of the trend is given by the LINEST function as 0.43e+22 joules per year with an error of only 0.02e+22 joules per year. What’s not to like? So he declares that the autocorrelation adjustment is un-necessary. But he doesn’t realize the power of autocorrelation.
The problem is, the pentadal dataset is made out of 54 years of overlapping 5-year averages! So of course, the autocorrelation is horrendous. For the detrended dataset it’s 0.86.
Remember that the Nychka equation is:
Plugging in the “n” of 54 and the autocorrelation of 0.86 gives us an effective “n” of one lone solitary data point … not enough to do anything with. Which is why annual overlapping five-year centered averages aren’t all that useful.
The problem doesn’t go away with annual data, however, but it’s better. As I pointed out above, the p-value of that trend can at least be calculated, and it’s 0.08. Not significant, roughly one chance in ten that it’s a false positive.
And that is why you can’t just shine on the autocorrelation adjustment, particularly for “pentadal” data.
It is also why Mr. X is wrong when he claims that you can determine significance by looking at a graph … sorry. As some folks know, I am an enthusiastic supporter of the use of the Mark I eyeball. But determining significance from looking at the graph? That’s not even theoretically possible.
w.
Well actually I should say ARGO are typically calibrated to .001C however none of the manufacturers will say exactly how accurate they are in the operating environment of an ARGO float for a wide variety of reasons. ARGO claims .005C yet they have to quality check the data and there are frequently issues with them. The Ocean Cooling page goes into a lot of detail on some issues they have had but really the record before ARGO was so bad that when ARGO came online it showed cooling…. So they had to correct the record…..So they do Quality changes to their data….. So I am saying that there accuracy leaves a lot to be desired…
Why bother to entertain the change in subject? The climate scientists said temperature was going up and would continue to rise. Hockey stick anyone. They did not say heat content would rise like a hockey stick. Temperature and heat are two different things. If they want to discuss ocean heat then say fine first lets discuss land and atmosphere heat rise from 1900. Anthony’s graph show no rapid rise in land heat content.
Manfred says:
June 19, 2013 at 10:16 pm
Manfred, thanks, sorry I haven’t replied to your interesting point. Onwards.
Mmmm … I’ve grown careful about words like “every” and “all”. There’s at least three ways to increase the amount of heat in the ocean.
1. Increase the energy input.
2. Decrease the losses.
3. Increase the residence time.
So whatever your statement was intended to prove, it hasn’t.
Again, mmm … and again, there are more ways to increase the energy input than to decrease the cloud cover. One main one, which functions as a major thermal control mechanism in the tropics where most of the energy enters, is to vary not the amount of clouds but their timing. A one-hour delay in the average onset time of the tropical clouds leads to about 60 W/m2 of additional incoming energy. On a 24/7 basis, that comes down 2.5 W/m2 increase in forcing.
No, larger variations can easily be due to rearrangements of the clouds, and alterations in their time of onset and disappearance.
Part of the problem is that you are looking at the average effects of clouds. But take a typical tropical day. Clouds during the day have a strong cooling effect, hundreds of watts per square metre.
Clouds in the night have a weaker effect, which is in the opposite direction, a warming effect.
So if we have twelve hours of clouds, the average cloud cover is the same whether the clouds are there in the day or the night. But the thermal effect is totally different, by hundreds of watts/m2. My point is that although the average cloud cover doesn’t vary much … that doesn’t mean much.
As a result, I find your argument unconvincing. Small, un-noticed shifts in cloud onset time make a very large difference in downwelling radiation. And because the normal onset time of the tropical cloud cover is just before local noon, the sun is at the optimum position to deliver energy deep into the ocean.
Finally, you have to consider the size of the energy flows. The 24/7 average total downwelling radiation over the tropical ocean is well over half a kilowatt per square metre. What you may not have considered is that basically all of that energy passes into the ocean during the day, and then about the same amount is lost from the ocean overnight. If that were not so, if the huge amount of heat absorbed by the ocean every day were not lost every night, the ocean would quickly boil away.
That 600 W/m2 is the amount of energy that is being first absorbed by the ocean, and then lost by the ocean through radiation, conduction to the atmosphere, and evaporation on a 24 hour basis.
Given that huge daily throughput of energy coursing into and out of the ocean, I see no reason that annual variations in the amount of energy that stays in the oceans could vary by ± 3 W/m2. That’s only about a half a percent of the energy flowing through the ocean, I can see that much variation no problem …
Like you, I mistrust the big jump in the data early this century. It just doesn’t look right to me, a weak argument I know, but it’s tricky to build one dataset from different kinds of records. However, as I’ve pointed out, it’s the best we have.
Finally, let me point out the large error margins in the values of the forcings. I suspect that some of the “unphysical” jumps in the amount of energy in the ocean are just a consequence of the large error bars.
Best regards,
w.
Willis,
Another good post, and good responses to other commenters. Many thanks.
David Riser says:
June 19, 2013 at 10:51 pm
Thanks, David. You are correct that they are not the same type or design of sensor across the fleet.
However, their claimed accuracy is better than 0.01. In a study of 6 Argo floats pulled from the water and tested, they say:
As Satchel Paige said, it’s not what you don’t know that hurts you. It’s what you do know that ain’t so …
w.
Matthew R Marler says:
June 20, 2013 at 12:06 am
Thanks, Matt, always good to hear from you.
w.
Willis Eschenbach says:
June 19, 2013 at 11:54 pm
…Mmmm … I’ve grown careful about words like “every” and “all”. There’s at least three ways to increase the amount of heat in the ocean.
1. Increase the energy input.
2. Decrease the losses.
3. Increase the residence time.
Again, mmm … and again, there are more ways to increase the energy input than to decrease the cloud cover. One main one, which functions as a major thermal control mechanism in the tropics where most of the energy enters, is to vary not the amount of clouds but their timing. A one-hour delay in the average onset time of the tropical clouds leads to about 60 W/m2 of additional incoming energy. On a 24/7 basis, that comes down 2.5 W/m2 increase in forcing.
No, larger variations can easily be due to rearrangements of the clouds, and alterations in their time of onset and disappearance.
Part of the problem is that you are looking at the average effects of clouds. But take a typical tropical day. Clouds during the day have a strong cooling effect, hundreds of watts per square metre.
Clouds in the night have a weaker effect, which is in the opposite direction, a warming effect.
So if we have twelve hours of clouds, the average cloud cover is the same whether the clouds are there in the day or the night. But the thermal effect is totally different, by hundreds of watts/m2. My point is that although the average cloud cover doesn’t vary much … that doesn’t mean much.
—————————————————–
Agree, there are such rearrangements and timing chances etc, but to what extent for a whole year and globally ?
And even if, the peaks are too large to be explained by any such mechanism:
4% reduced cloud cover corresponds approximately to the IPCC average 1955-today forcing and this correponds to a heat uptake of 0.2 W/m2
But there are yearly heat uptake values of 2.3 W/m2 in the dataset. Subtract 0.2 due to “global warming” and 2.1 W/m2 remain to be explained !
2.1 W/m2 heat uptake not forcing..This would then correspond to a cloud cover reduction of 42% (or an alternative rearrangement) globally and for a whole year.
Willis Eschenbach says, June 19, 2013 at 10:08 pm:
Yes, always the same old bluster without substance when entering this subject: “You don’t know physics! Your ideas are deeply flawed! Go read a textbook and learn something! All physicists disagree with you!” And so on and so forth.
And that’s that.
Could you rather than rambling please address what I asked from Bart upthread?
“What is ‘heat’ to you? Does it fly around in every direction? Show me how my definition of ‘heat’ goes against the agreed upon physical definition. Show me how the atmosphere is a source of heat for the surface, how it transfers heat downwards.”
I have no problem admitting when I’m wrong, Willis. I am not wrong on this one.
I will however concede one point. I shouldn’t have quoted that whole paragraph of yours when claiming my argument didn’t oppose it. I was actually referring only to the last line: “Heat, on the other hand, is a NET energy flow.”
How does what I’ve written above go against this notion?
You mix up individual and opposing energy fluxes in an exchange between two systems and the ‘net’ flux between them, the heat transfer. Only heat transfer transfers … heat (increase in internal energy for the cool system, decrease in internal energy for the warm system).
There is nothing novel in my definition of heat, Willis. Heat is energy transferred from a hot to a cold system. This transfer (the ‘net’ flow of energy) only goes one way. Pertaining to the radiative interaction between Earth’s surface and Earth’s atmosphere, the transfer goes UP and only up.
You can look this up anywhere. This is not a warped idea om mine.
What happens when you introduce the upwelling and downwelling IR fluxes between surface and atmosphere in the energy budget diagrams, is that you confuse people’s perception of what is actually physically going on. You give the impression that the atmospheric flux is equivalent to the solar flux. It is not. The inferred 324 flux is not an independent, extra flux of energy coming down to the surface, like the solar flux. The 324 W/m^2 down could not increase the internal energy of the surface, and therefore could not heat it, because on average it would always be opposed by a larger flux going up (the equally inferred 390 W/m^2 flux). The 324 is the LESSER PART of an assumed continuous IR exchange between the two systems, the result of which is an upward radiative heat flux of 66 W/m^2. (Well, since you’re seemingly so against the term ‘heat flux’, then use the term ‘net energy flux’ instead.) You cannot include the one and exclude the other. They are two sides of the same coin (exchange process).
In what way is this wrong, Willis?
Manfred says:
June 20, 2013 at 12:34 am
Good question. I see the change in ocean heat content in large part as a direct result of one of the ways that the climate regulate the temperature, through the timing of the onset of tropical clouds. So I would suspect that it would vary quite a bit. You could think of it as your gas pedal when you have cruise control on in your car. The amount of fuel energy going to the car engine varies depending on the slope you are driving up.
In the same way, the system varies the amount of energy entering the system by varying the timing, amount, and color of the clouds. These are specific changes in specific areas of the world, and will perhaps not show up in global averages. But they are controlling the input of energy as well as the throughput of energy.
As I said above, leave the amount of cloud cover exactly the same in the tropics, but push it back by one hour. During the day you get increased sun into the ocean. During the night, you get reduced losses from the ocean. These total more than 3 W/m2 on a 24/7 basis.
I think you mean “4.2%” rather than 42%, but as I said, cloud cover variations are not the only possibility.
Another obvious example is a shift in currents. These are occurring constantly at many temporal and spatial scales. For example, consider the huge oceanic heat loss that occurs during an El Nino/La Nina pump cycle. Vast quantities of heat are removed from the tropics as warm water and transported to the poles, where they rapidly lose energy through the usual means.
I’ve never calculated the total amount of heat flow of one of these El Nino/La Nina pump cycles, it’s on my to-do list. I would not be surprised, however, if it added up to a watt per square metre or so.
Or consider the currents that hit the continental shores and upwell. They bring billions of tonnes of cold water up from well below 2000 m, and often to the surface. Remember we’re only looking at 45% of the ocean volume, the upper layers. So any intrusion of water from the deeper layers alters the heat content of the upper 2000m of the ocean. Note also that what goes up must come down. So when a current hits a coast and upwells, bringing water from the deeps up to the 2000m level, somewhere an equivalent amount of water (of unknown heat content) is sinking from the 0-2000m level and going back into the deeps.
Note that this is a way that the 0-2000m OHC can increase and decrease, with absolutely no change on the surface. It could all happen underwater, with nothing to do with clouds or evaporation or anything.
Speaking of evaporation, that brings me to wind. Evaporation varies linearly wind speed. The globe loses on the order of 80 W/m2 from evaporation on a 24/7 average basis to evaporation.
This means that a 5% change in average wind speed means a change of 4 W/m2 in evaporative heat loss. From memory global average wind speed is about 7.6 knots, so if it went to 7.2 knots, that alone would give you your 4 W/m2 increase in ocean heat content
So yes, I can think of lots of ways that the ocean can vary its heat content that don’t involve changes in average cloud cover, and one that doesn’t involve the surface at all. You’ve excluded lots of possibilities.
Having said that, I think that some of the large annual excursions are merely a function of the large error bars in the data.
For example, given the known errors, in only nine of the 58 years was the annual change in OHC larger than the error bars of the OHC of two years involved. In other words, we can’t say anything about those annual changes in OHC at all, because the two succeeding OHC values are not statistically different from each other.
Best regards,
w.
Kristian says:
June 20, 2013 at 1:11 am
Nonsense. I have quoted your words exactly. You denied saying it, and asked where you have said the contrary. I quoted those words to you. I’ve been very, very specific about the exact nature of your misunderstanding.
As a result, your handwaving tirade above is laughable. Sorry, but I’ve been most detailed from the start.
Sure, be glad to. Heat is the net of all of the energy flows into and out of a body. It is unidirectional, and always goes from hot to cold. It is a concept, not a physical flow, so it can’t “fly around” anywhere.
You, on the other hand, talk of impossibilities like this:
Now, that totally goes against the agreed upon physical definition. There is no such thing as a “radiative heat flux”. There are only radiative flows of energy, not of heat. The radiative energy flows in both directs between two objects like say the atmosphere and the surface.
The NET of these two energy flows to and from a given body is called heat.
So it is NOT TRUE under the agreed upon physical definition that solar energy is a “heat flux”, or that DLR is not a “heat flux”. Not only is it not true, it doesn’t mean anything. In the agreed upon physical definition, all electromagnetic radiation is a flow of energy, not a flow of heat. Solar radiation is not a “heat flux” as you wrongly claim, because there is no such thing. It is an energy flux.
Heat is the net of the gains and the losses of all of the energy fluxes that affect the body. It’s not a separate flow of some kind.
And certainly, your claim that solar radiation is a “heat flux” and longwave electromagnetic radiation is not a “heat flux” makes no sense at all.
This is because in terms of radiant energy exchange, “heat” doesn’t really exist. It’s a concept, not an actual flow of something.
By that I mean that the reality is that the surface of the earth radiates upwards at about 400 W/m2, and that the downwelling radiation from the atmosphere is about 325 W/m2. This means that the heat flow is upwards from the surface to the atmosphere, and is about 75 W/m2.
But that doesn’t mean that there is some physical upwards flow of 75 W/m2. There is no such flow of 75 W/m2. Heat is a concept, a way to understand reality. When I say heat doesn’t exist, I mean heat is not a physical flow of radiation somewhere. It’s merely the net of the actual physical flows, which are the flows of energy.
Heat loss is a number calculated by taking the sum of all the energy flowing into a body, and subtracting the flows of energy out of that same body. If the outflow exceeds the inflow, we say the body is losing heat. In the earth’s case, the surface is losing heat at the rate of 75 W/m2.
Note that the surface would lose heat much faster without the back radiation from the atmosphere. If the greenhouse gases (water vapor and co2) weren’t there, the heat loss would be 400 W/m2 instead of 75W/m2, and the surface would be much, much colder.
w.
Willis Eschenbach says, June 20, 2013 at 2:03 am:
“Heat is the net energy flow. It is unidirectional, and always goes from hot to cold.”
Thanks. That’s all I’m saying. Still you seem to be arguing that the inferred downward atmospheric radiative flux is somehow capable of heating the surface/ocean (like the solar flux) to a higher temperature than what the Sun could manage on its own. Even if we appear to agree that the ‘net’ radiative flux (the heat) between surface and atmosphere always on average goes up, the surface/the ocean radiatively loses ‘net energy’ (heat) to the atmosphere. Go figure.
How does heat loss make warmer?
Willis Eschenbach says:
June 19, 2013 at 10:57 am
Eric H. says:
June 19, 2013 at 6:38 am
Thanks Willis,
Some of my own ponderings: 1) If it cannot be shown that CO2 is heating the ocean then CAGW is done as a theory. 2) LWIR is only capable of penetrating water at a depth of millimeters and the amount of heat transfer rate change from an increase in CO2s LWIR is dwarfed by the amount of LWIR from clouds. 3) SWR can penetrate the ocean to a depth of 30 meters (if my memory serves) and changes in cloudiness and/or solar activity would have a much greater impact to OHC than LWIR from all sources. Is this correct?
Not really, or at least that’s not all there is to it. Once it strikes the ocean, long-wave infra-red (LWIR) is converted from radiant energy to thermal energy, so it adds energy to the ocean. See my post Radiating The Ocean for a “full and frank” discussion of the issues.
w.
Thanks Willis and Ian for your responses but I am not trying to argue that LWIR cannot heat the ocean my question is one of effectiveness which I apologize if this was lost in my post. The point I was trying to make is that changes in solar output and/or cloudiness are better explanations for an increase in OHC than CO2 due to a greater ability of solar and clouds to raise ocean temperatures. If clouds and solar cannot be ruled out then CO2 cannot logically be the cause. If CO2 can’t be shown to be the cause of increased OHC then CO2 cannot be the driver of climate change…
What I appear to have wrong was my thought that SWR was a greater forcing than LWIR which I incorrectly thought was due to penetration:
“So if the DLR isn’t heating the ocean, with heat gains of only the solar 170 w/m2 and losses of 390 w/m2 … then why isn’t the ocean an ice-cube?”
Again, thanks for the info, Eric
From Kristian on June 20, 2013 at 1:11 am:
An object can be heated to where the wavelength distribution peak for the energy emitted is strongly in the ultraviolet, the predominant emissions amounts are UV. Significant UV emissions come from the Sun, but also arc welding, and the rarefied gas inside a fluorescent tube yields little but UV.
The UV travels and strikes a fluorescing surface, resulting in the production of visible light. The UV wavelength energy transferred from the hotter object to the cooler object (surface) that is transformed to visible light, is heat?
Kristian, in addition to my comments above, let me return to this image.

The upper panel represents the two-way flows of money (or radiative energy).
The lower panel represents the net of the two flows, which is called profit/loss (or heat gain/loss).
As I said, both ways of looking at the transaction are valid, and present true information. And there is no contradiction between them.
But there is one very important difference.
The upper panel is a description of the physical reality. In that panel, I give you $100, and you give me $75. That’s what really happened. Same with the flows of radiative energy. They are real and physically measurable.
The lower panel is conceptual only. There was never a time when I gave you $25. I gave you $100, not $25. Heat, like profit, is a concept only, a way to gain understanding of a transaction.
I’m trying to get across that the energy flows are real, but heat is not. It’s a way to understand or simplify the situation, and a very valuable way to do that. But it’s not a real flow.
As a result, there’s no solar “heat flux” striking the earth as you claim. Nor are there some types of radiation that contain heat (solar) and some kinds that don’t contain heat (DLR) as you claim. Heat isn’t contained in any kind of radiation. Heat is a concept, not a physical flow of anything.
w.
Bears repeating that the problem with the Argo Bouys, which measure ocean temperatures, is that they are free floating. While they only spend about 2 days a month on the surface, they will, none the less, drift away from areas of upwelling (colder waters) toward areas of downwelling (warmer waters), and particularly warmer water at depth.
The Argo data tells us nothing worthwhile about ocean heat or temperatures, because of this bias.
Willis, you say:
“[Heat] is a concept, not a physical flow, so it can’t “fly around” anywhere. […] There is no such thing as a “radiative heat flux”. There are only radiative flows of energy, not of heat. The radiative energy flows in both directs between two objects like say the atmosphere and the surface. The NET of these two energy flows to and from a given body is called heat.”
Oh my. I see your confusion. Wow. Just wow. Listen, ‘heat’ is what we actually and physically measure, Willis. We cannot physically separate and detect individual opposing flows of energy in a radiative field between objects, only the spontaneous flow of heat that results from temperature gradient from hotter to colder. Those individual fluxes are only inferred, assumed.
‘Heat’ is the physical flow. The ‘radiative flows of energy’, the ‘exchange’, is the concept.
You’ve got it all turned on its head.
http://en.wikipedia.org/wiki/Pyrgeometer#Measurement_of_long_wave_downward_radiation
http://tallbloke.wordpress.com/2013/04/26/pyrgeometers-untangled/
Willis says:
“[…] your claim that solar radiation is a “heat flux” and longwave electromagnetic radiation is not a “heat flux” makes no sense at all.”
Again I have to say, wow. How is this possible to misunderstand so profoundly?
The solar flux represents a GAIN in energy for the surface. The atmospheric flux does NOT. It is the lesser part of the exchange in energy between surface and atmosphere. The ‘net’ represents a LOSS in energy for the surface.
There are two system interactions here, Willis, not one. The Sun is heat source to the surface, so it tranfers heat (a net gain of energy seen from the perspective of the surface) to the surface. The surface in turn is heat source to the atmosphere, so it transfers heat (a net loss of energy seen from the perspective of the surface) to the atmosphere.
What’s not to understand here?
From Eric H. on June 20, 2013 at 2:19 am:
Never be a doctor, especially an ER doctor. If hepatitis and acetaminophen overdose cannot be ruled out then cirrhosis cannot logically be the cause of liver failure?
Of course in the real world it could be all three at once.
CO₂ could be the bad front end alignment. As in, it is not the driver, the driver determines where the car’s going. But it can be a force the driver has to counteract, and if the hands are off the steering wheel then instead of going straight the car will drift left.
kadaka,
So the sun and clouds (drivers) are responding to CO2 (bad alignment)? How does that work exactly?
If your car cranks and doesn’t start you check for fuel and spark first (primary drivers of combustion) you don’t start by changing the MAF sensor. If fuel and spark cannot be ruled out then the MAF sensor cannot logically be determined to be the cause.
Or perhaps we should just avoid bad analogies?
Kristian says:
June 20, 2013 at 2:39 am
///////////////////
It is because people conflate slowing the heat loss with warming.
A warmer atmosphere may slow the heat loss from the surface, but it does not warm the surface. Save in rare cases of a very warm wind where the wind is warmer than the ground below, all warming (ignoring geothermal) comes from the sun (and, of course, the sun was the source of the warm wind),
Unfortunately, some people give an example of clouds forming at night warming the surface below, as if clouds were heaters (when they are not).
Warming, and slowing heat loss are different processes, and it is important not to conflate one with the other.
Those who study the history of the science of hominid evolution have often said how remarkable it is that researchers in the field often find exactly the bones and tools that supports their stated pet theory. Or to be more precise, bones and tools that appear to support their theory, which may later be re-interpreted in a slightly different light.
I suspect that all this stuff about greatly increasing ocean heat content (OHC), especially the Cook graph posted by Anthony Watts above, is mostly a result of more measurements by people wanting to find more heat, but which heat was already there before. It’s a relatively easy mistake to make, to want to see more heat but which is simply a larger and denser number of measurements of the already existing heat, to give an apparently increasing amount of heat. Like the hominid researchers, they may be simply interpreting the results in the way they wanted to find them in the first place.
One would have to go back to the original data to see how much of the earlier raw data has been extrapolated or adjusted, to get a hockey stick in the OHC.
Willis Eschenbach says:
June 20, 2013 at 2:20 am
///////////////////////////////
Willis
Further to your explanation above.
Lets say that the facts are that YOU has no money at all and therefore has nothing from which to give ME anything, but there is an arrangement that at in the early morning ME gives to YOU his payment, and at the end of the day YOU gives to ME his payment. The arrangement can work because ME is effectively funding everything. IF YOU had to make the payment before ME handed over any money, the arrangement would fail instantaneously.
Now lets consider the position in relation to K&T energy budget where Surface absorbed solar is 168 Wper sqm .and where atmospheric back radiation is 324 Wper sqm. Lets say the atmosphere is YOU and the surface absorbed solar is ME.
On day 1, the very first day that Earth acquired an atmosphere, the atmoshere (YOU) has an empty bank. It has nothing to to give to the surface (ME). At the beginning of the day, ME gives to YOU 168 Wper sqm, being all the solar that it was able to absorb. At the end of the day, YOU is obliged to make his payment. He only has 168 Wper sqm being the payment made by the surfaced absorbed solar, so all he can pay to ME is 168 Wper sqm; he is unable to pay 324 Wper sqm because he does not start with anything in his kitty.
The example you gave works fine where ME is richer than YOU, or where YOU actually has something in his pocket with which to fund his payment independently of the payment made by ME. But is falls down IF those facts are not met.
The problem in the real world is that the only source of revenue is the sun,so how can the atmosphere pay more than it receives.
It is like government expenditure. Lets say a government cannot borrow. The only asset that the government has is tax revenues. How can it spend more than it receives in tax?
It is the problem we have in the UK. Some consider the public sector to be a wealth generator. They consider that the government should employ more people and this will help the government since the people it employs will pay tax. They consider it to be self financing.
In reality the only wealth generator is the private sector. It is the private sector that pay for everything. It is taxes taken from the private sector that enable the government to employ some people in the public sector. Of course the government does not have to pay the full gross wage of those it employs on the public sector, it only pays the net pay, ie., after the public sector workers have paid their tax. But none of the tax paid by the public sector workers enables the government to employ public sector workers. It is the tax paid by the private sector that enables this.
In short, you can’t spend what you do not have. It is difficult to see how the atmosphere can spend more than it receives from solar (surface absorbed solar which the surface radiates) when the only source of revenue into the system is from the sun.
Manfred says:
Yes, because Willis was talking about d(OHC)/dt, What is your point ???
no, willis’s graph is the *trend* of d(OHC)/dt, i.e. the second derivative d/dt[OHC’].
willis has succeeded in proving the ocean heating is *accelerating.*
willis wrote:
It is also why Mr. X is wrong when he claims that you can determine significance by looking at a graph.
i first gave the calculation, with uncertainty, then noted that eyeballing (intuition) clearly backs that up. Anyone can look at that graph of 58 points and see that it clearly has a positive slope.
But the more important point is that you have completely misunderstood what it is you’re calculation, which is not the trend in OHC but the trend in d(OHC)/dt.
Your entire post is badly wrong.
ironargonaut says:
The climate scientists said temperature was going up and would continue to rise. Hockey stick anyone. They did not say heat content would rise like a hockey stick. Temperature and heat are two different things.
the *change* in heat content is proportional to the change in temperature,
dQ = mc*dT
hence
dT/dt = (dQ/dt)/mc
if the heat content is changing, the temperature is changing.
From Eric H. on June 20, 2013 at 3:08 am:
Is it that hard for you to figure out?
Out here in the real world, we’ve been doing something horrendously old-fashioned, the taking of actual measurements and making deductions based on empirical evidence. From this we find the transient climate sensitivity (aka climate response) to further atmospheric CO₂ concentration increases is basically negligible, with the equilibrium climate sensitivity (ha ha, like equilibrium will happen anytime this millennium) likewise negligible to easily manageable.
But that’s in a system filled with feedbacks, overwhelmingly negative, that work to maintain the temperature, as found in the many different temperature regions and local climates with certain processes that have global effects, etc.
What would happen without them? Without the feedbacks, including clouds which you’ve mislabeled as a driver though they form in response to other things, what’s the effect of CO₂?
We’re shooting for a constant global average temperature. Don’t higher concentrations of CO₂ tend to bring about higher temperatures, when feedbacks aren’t countering that force?
Let’s say without the feedbacks, the “ideal” concentration for the preferred global average temperature was 300 parts per million (volume). Wouldn’t 400ppmv cause a higher temperature?
So there’s the analogy. 300ppmv CO₂ would be good alignment, the climate would keep going straight without feedbacks. 400ppmv would be bad alignment, the climate would want to drift warmer. But with feedbacks, the climate could still be going straight at 400ppmv because the feedbacks would be counteracting the bad alignment.
The Mass Air Flow sensor would be very low on the list of anything to check, as the worst that should happen if that goes bad is the computer will switch to the less-economical “static” setting where it computes with stored presets rather than dynamically with “live” measurements. These newfangled “modern” cars will also likely signal a problem, with a “check engine” light or similar, and plugging in the diagnostic scanner should quickly reveal that particular problem.
Hopefully you realize a diesel engine could be involved which doesn’t require spark.
With today’s vehicles, spark is rarely an issue, and good chance you’ll find individual ignition coils for each cylinder rather than a single central coil with a distributor, thus it is very likely you’ll have cylinders firing. If there are no cylinders firing then it’s possibly a loose connector, or a blown fuse, but also possibly a computer failure.
As long as there’s fuel in the tank showing on the fuel gauge, you likely have fuel. With in-tank electric pumps it’s easy to check for fuel at the relief valve on the fuel rail, but there’s normally a sensor checking that anyway. But even then, with injectors on every cylinder, for no cylinders to fire indicates a possible loose connector, or a blown fuse, but also possibly a computer failure.
Frankly, outside of the lawn tractor, the only vehicle I have that I have had a problem with starting for a long time, is an old Ford pickup with a V8 from the glory days of the early 1980’s when vacuum controls on carbureted engines reached their pinnacle of complexity before makers surrendered to practicality and went with fuel injection. Which has the brown grommet Ford solid-state ignition module, much less common than the blue grommet, which I replaced soon after getting the truck when the old module melted out. The mechanical fuel pump might die, but that’d more likely be at full-out highway speeds rather than slow starting.
If that truck doesn’t start, I just pump the pedal a lot more, and play with the gas pedal a lot more, trying to get it to start firing at least a little before the battery dies… Because it’s the computer that’s keeping it from starting, and I have to basically override the emission controls.
So to summarize, if a vehicle doesn’t start these days, fuel and spark are not the first things to check. Indeed, the most likely problem is electrical/electronic, plug in the diagnostic scanner, available at auto parts stores for about $90 and up depending on the frills. Which will report on many things, including the MAF sensor, at once. Thus the first thing to check, is what does the car think the problem is.
Please do so, yours was terribly screwed up.
willis wrote:
Remember that the Nychka equation is…
another point is that, if the Nychka equation gives such a low n_eff, it is not a good model for the autocorrelation, i.e. you can’t ignore higher-order lags. you need something like an ARMA model.
in any case, your physics is still all wrong — you aren’t calculating the trend of OHC, but the trend of its derivative. you’ve proven ocean warming is (probably) accelerating!
also willis, your graph is wrongly labeled. you’re not calculating the annual forcing that’s gone into/out of the ocean, but into/out of the top 2000 m of the ocean.
heat may well be going deeper into the ocean, below 2000 m. average ocean depth is about 4000 meters.
Last time I dipped my toe in the ocean it was way too cold. Maybe if you live in the tropics the oceans are barely warm enough to go swimming. Everywhere else and you risk dying of exposure with anything more than a quick dip.
Call me when the oceans are jacuzzi warm. There is a reason fish are cold blooded and whales have blubber. The oceans are COLD and at depth they are VERY COLD.
ferd berple says:
Call me when the oceans are jacuzzi warm.
silly. tell us, what do you think is the (approximate) difference in average ocean temperature between a glacial and an interglacial period?
Willis writes “So in terms of radiation, while a cold object cannot warm a warmer object, it can slow the cooling rate by the exact amount of the back-radiation.”
I know Willis has made a generalised statement here but for the specific case of the ocean, if the energy is added to the surface of the ocean where the back-radiation is absorbed in the top 10um or so, then that additional energy must increase evaporation with everything else being equal. Its a fundamental unavoidable result.
So the resulting decrease in cooling is less than the amount of back-radiation. Much less probably, because evaporation actually cools the ocean not just “uses up” that energy.
richard verney says:
June 20, 2013 at 4:32 am
The problem in the real world is that the only source of revenue is the sun,so how can the atmosphere pay more than it receives.
=============
surface warming can only increase if the atmosphere is made cooler. otherwise, energy is being created out of nothing.
So, for example, GHG in the atmosphere can remove energy by conduction from the surrounding air, and radiate this to the surface and space. This will cool the atmosphere while warming the surface. Which is what we observe, the atmosphere is cooler than the surface, rather than isothermal as one would expect without GHG.
However, there is a problem with this. As the surface warms and the atmosphere cools, this sets up convection which works to return the atmosphere to the same temperature as the surface. The stronger the atmospheric cooling and surface warming effect of GHG, the stronger the vertical circulation to remove the effects of GHG.
This negative feedback is inherent in the climate system. The limiting factor is the force of gravity, which determines the maximum acceleration of the atmosphere downward, which limits the conversion of PE into KE, which determines the dry air lapse rate.
Ximinyr says:
June 20, 2013 at 6:49 am
silly. tell us, what do you think is the (approximate) difference in average ocean temperature between a glacial and an interglacial period?
==========
Are you talking surface temperature or average temperature? There is a big difference. And what possible practical use is knowing glacial temperatures outside of academia? Are you planning to move from the interglacial to the glacial?
What is important to anyone that is routinely on the ocean is that for the most part the surface is bloody cold and you will quickly die of this cold long before you need worry about drowning.
Humans are one of the best adapted warm climate animals on the planet. Everything about us is optimized to deal with heat. So long as we have water and shade there is no place on earth too hot for us to survive. Which tells us that conditions where humans evolved were much warmer than where most of us live today.
In fact, if you sit naked on the beach in the tropics on the equator at noon under a palm tree and there is a breeze blowing you will be very comfortable. If you try the same thing at midnight and there is a breeze blowing, you will be cold. Even if you come out from under the palm tree and bask in the abundant back radiation.
Call me when the oceans are jacuzzi warm.
jai,
“surface mixing and transport” might be a good parameter label but it doesn’t describe much at the ocean surface. Do waves mix the surface? Sure. What happens next? The warm water comes right back to the top after having perhaps conducted some energy to nearby molecules a few meters deep, which molecules immediately join in returning to the surface.
Besides wind driven wave mixing there is shallow mixing from K and R waves bouncing back and forth. That’s it. There is no other downwelling “transport” in the tropics. The heat can’t hide from the satellites, and these tell us unequivocally that the surface component of Levitus’s averages is not evenly distributed. Rather, surface warming in the Indian and Arctic Oceans accounts for most of the increase.
ferd berple says:
Are you talking surface temperature or average temperature?
What I already indicated — average temperature. What is it difference between a glacial and interglacial?
The rest of your post is a lot of hand-waving arguments about optimum temperatures. Rates of its change are more relevant. Humans don’t live on the beach, and there is much more to the world than people — other animals, plants, ecosystems — that all have to adapt too. Historical evidence says such adaptation is difficult for them.
Big Macs don’t fall from outer space, you know.
Willis,
I understand the laboratory accuracy of the ARGO floats. The issue as I see it is the previous generation of methods for measuring the ocean used sensors of similar accuracy. Yet the ocean apparently cooled once ARGO was fully deployed. So different instruments with calibrated sensors of relatively similar design showed different enough results to go from warming to cooling just based on the homogenous method of sampling the ARGO floats use.
I think this highlights your point that the forcing or for that matter OHC change is not statistically significant. The data record is particularly problematic due to small sample size and a wide range of methods, sensors and equipment to take those samples over the graphs some 60 years of data. Which makes the overall error of the entire record large, very large.
This is also a problem for ARGO because there isn’t a really good way to test their operational accuracy in the lab. If I had the roughly 20k it would cost to throw about I would take a ARGO float out and test it in the OCEAN versus a suspended TCD to see if the float itself creates error as it operates. This would be pretty hard to accomplish but given some time and experimentation I think you could get an idea of accuracy. If ARGO were to be confirmed to an accuracy of .005C through out its operational range through rigorous operational testing then the rest of the record is essentially junk. In that case we should deploy more of the little devils and kick back for about 20 years to get a good idea of what is going on. Particularly since there is a new model coming out that is capable of doing 6000M.
Yet the ocean apparently cooled once ARGO was fully deployed.
completely false; just look at graph #2 here:
http://www.nodc.noaa.gov/OC5/3M_HEAT_CONTENT/
in fact, the ocean has been warming strongly.
Philip Bradley says:
June 20, 2013 at 2:27 am
Oh my goodness, no, no, no. The Argo data, like any dataset, has its problems. Coverage is one of them, albeit not a large one.
Despite that, the Argo data is a huge irreplaceable addition to our knowledge about the ocean. The idea that they can “tell us nothing worthwhile” is simply not true. I’ve mined lots of valuable information from them.
w.
Ximinyr says:
June 20, 2013 at 4:52 am
Manfred is correct. The graph is of the first derivative of OHC, in units of W/m2. This is the forcing required to effect the annual changes.
Really, my friend … you should quit when you’re behind …
w.
And the beat goes on–see this interview of Hans von Storch in
the online edition of Der Spiegel. (Don’t worry, it’s
been translated to English.)
http://www.spiegel.de/international/world/interview-hans-von-storch-on-problems-with-climate-change-models-a-906721.html
Note the careful phrasing, but the rigid adherence to the defense of
AGW:
— Simulations show a “pause” in global warming lasting 15 years or
longer less than 2% of the time, BUT–“… in five years, at the latest, we
will need to acknowledge that something is fundamentally wrong with
our climate models.” Move the goalposts again, why don’t you?
— “[Ocean] Temperatures at depths greater than 700 meters (2,300 feet)
appear to have increased more than ever before.”
— “The IPCC’s predictions have been conservative. And, considering the
uncertainties, I think this is correct.”
— Asked if there were findings related to global warming that worried him:
“The potential acidification of the oceans due to CO2 entering them
from the atmosphere. This is a phenomenon that seems sinister to me…”
Willis Eschenbach says:
June 20, 2013 at 12:09 am
David Riser says:
June 19, 2013 at 10:51 pm
This is a question of precision versus accuracy. The oceans are vast. The floats only sample them at specific locations. So, while the individual measurements can be infinitely precise, the overall mean value is not necessarily accurate.
Kristian says:
June 20, 2013 at 2:16 am
“Still you seem to be arguing that the inferred downward atmospheric radiative flux is somehow capable of heating the surface/ocean (like the solar flux) to a higher temperature than what the Sun could manage on its own.”
Your disconnect is in not thinking of this as a continuous flow problem. Consider this analogy. You have a pot of water sitting in the Sun – assume there is no night. Eventually, the water will evaporate and the pot will be dry. So, you put in a hose which continually trickles water in. The level of water in the pot reaches an equilibrium where the rate of evaporation is equal to the rate of the trickle.
Now, you put a transparent but permeable covering of some sort over the pot. It does not prevent evaporation, but it slows it down. What happens to the level of water in the pot?
It rises, and as it does so, the rate of evaporation increases. At some point, you again reach an equllibrium in which the rate of the trickle is equal to the rate of evaporation. But, the level of water is higher than it was before.
That is how the GHE works. It does not create a permanent heat flow imbalance, just as in the analogy, the covering over the pot does not cause a permanent imbalance between evaporation and trickle input. It just causes one long enough that the stored heat, or water in the case of the analogy, increases. All of the heat energy is coming from the Sun, just as in the analogy, all of the water input is coming from the trickle hose. The greenhouse gases, or the cover on the pot, merely establish the equilibrium level for the stored heat or water level.
BUT, that is only a simple analogy in which all other processes influencing the water level in the pot remain fixed. Suppose that we put a hole in the side of the pot at the level of water before we put the cover on. Now, when the water level rises, it will just spill out the hole. So, putting the cover over the pot has no net effect on the water level. The hole comprises a negative feedback, which maintains the water level below a particular point.
That is the discussion which learned people are having. All things being equal, an increase in greenhouse gases should increase the level of heat stored in the Earth’s land/ocean/atmospheric system. But, all things are not equal. There are many “holes” or negative feedback reactions through which the virtual excess heat can escape, or be blocked from entering in the first place.
richard verney says:
June 20, 2013 at 3:31 am
Richard, this is a meaningless semantic argument. It depends on a non-standard definition of warming.
Let me start with my preferred phrasing. The earth with GHGs ends up warmer than if the GHGs were not there.
Of course, what the GHGs do is slow the cooling of the surface. The problem is that in common parlance this is called “warming”.
For example, suppose we light a fire, but the house isn’t getting warm. We might find the problem and say “The back door’s been open all this time, close the door, I want to warm up the house.”
Nobody jumps up and down and says “You’re wrong, only the fire can warm the house. All you are doing is slowing the cooling.”
Why?
Because the common everyday meaning of to “warm” something includes the concept of slowing the cooling. We say “Boy, putting on that sweater really warmed me up”, and nobody complains that sweaters are not heat sources.
So I absolutely reject the argument that the meaning of the word “warming” does NOT include the concept of warming by slowing the heat loss. We say a thick blanket warms us in the night, because the everyday, accepted meaning of “warms us” includes warming by means of slowing the heat loss. We actually end up warmer because of the blanket, so as you’d expect, we say the blanket warms us, and the mechanism is not considered.
As a result, you are fighting against the common, accepted use of the word. I haven’t seen one grammarian, scientific or not, win that kind of argument. Words mean what people actually use them to mean, regardless of logic.
However, the fight goes on, which is why I use my preferred formulation, which is not subject to your semantic objection. My formulation answers the unasked question in the statement “Does the atmosphere warm the earth?”
The unasked question in that is “Does it warm it compared to what?”
Regarding the earth, the answer is, “Compared to exposing the earth’s surface directly to the frigid infinite heat sink of outer space temperatures of ~ 3 kelvin”. So I say as follows:
The earth is warmer with GHGs than it would be without them, by the amount of the absorbed downwelling radiation.
Now, you can call that “warming the earth” or not as you wish. It makes no difference, because either way it’s the exact same outcome—GHGs (mainly water vapor and CO2) increase the amount of downwelling radiation striking the earth compared to no GHGs.
As a result, the earth ends up warmer than in the alternative, which common folk like me call “warming” something, but apparently you don’t.
So … I assume you don’t say to a friend “Come inside and warm up”.
Instead, you say “Come inside and slow your heat loss by increasing the amount of longwave radiation striking your body from the walls of the house, which are cooler than your body so they can’t actually warm you but you’ll end up warmer anyhow because the house walls emit more longwave radiation than the radiation we get from the cold environment standing here outdoors arguing semantics” …
Best regards,
w.
PS—Perhaps a thought experiment will make it clearer.
Imagine an earth just like ours, but with an atmosphere containing no GHGs. You measure the temperature of the planet. Let’s say it’s just above freezing.
Now you add greenhouse gases to the atmosphere, and after allowing the system to reach a steady state, you measure the temperature again. I think we agree that the planet will be significantly warmer.
And that’s why it is 100% correct to say that GHGs warm the planet … because compared to no GHGs, the surface of the planet ends up physically and measurable warmer, because of the physical and measurable increase in total downwelling radiation at the surface. And in English, when you add something and the system ends up warmer, people say that warmed the system. I know it’s not logical, but that’s English for you.
So does this mean that the only way to significantly increase ocean heat is to increase the amount of water in the ocean? If so then if the ocean level is a little less than in say 1600 AD would that mean there is less heat in the ocean now than before the Little Ice Age?
Manfred is correct.
Manfred is incorrect.
Look, this isn’t difficult. You have calculated the annual change in OHC, and taken the trend of that.
That is not the trend of OHC.
The function f(x)=x has a trend of 1.
But you have plotted the point-by-point difference in f(x), which are the points {1,1,1,1,1,…}, and taken the trend OF THAT, which is obviously zero.
It’s obvious — your calculated trends in forcing are essentially the 2nd derivative of OHC, not the 1st derivative.
Suppose the OHC for year Y is
OHC(Y)=kY
where k is a constant. This clearly has a trend of k units per year.
Your graph plots the forcing:
F(Y) = [OHC(Y)-OHC(Y-1)]/A
where A is the area of the ocean. Obviously F(Y)=k/A, a constant, for all Y.
Thus the forcing has a trend of 0. That’s what your graph is showing.
But clearly the trend of the OHC is *not* zero, it is k, i.e the ocean is warming.
Q.E.D.
Really, Willis, this is obvious.
Willis wrote:
Manfred is correct. The graph is of the first derivative of OHC, in units of W/m2.
The points in the graph are the value of the first derivative of OHC(t).
Hence, its trend is the second derivative. Obviously.
My example with OHC(Y) just above makes this very clear.
gymnosperm says:
June 20, 2013 at 7:28 am
Thanks, Jim, you raise an interesting issue.
Over time I’ve grown leery of making that kind of absolute “there is no other” statement. Nature always surprises me, and often there is not only another, but several others of what I’ve claimed don’t exist.
One of these occurs during an El Nino. The wind-driven waters pile up in the western Pacific. The resulting gravitational pressure of the pile of water forces underlying layers both downwards and outwards. So your “no other transport” claim is already falsified.
Then you have what are called “geostrophic gyres”, which also pile up surface water and like the El Nino, this forces underlying layers downwards as well as outwards.
I mentioned another mechanism above, changes in deepwater currents that upwell along continental shelves. If the upwelling increases from time to time, which it certainly does, somewhere else on the planet water an increased amount is being forced downwards out of the 0-700m layer. In other words, instead of moving warm water down, nature simply moves cold water up and the warm water has to go down …
There is also the nocturnal overturning of the ocean. This nightly occurrence thoroughly and regularly mixes the upper layer of the ocean to a depth of some tens of metres depending on conditions. Remember that if this nocturnal overturning slows, it increases the heat content of the entire mixed layer.
It is important to note that a slowing of the nocturnal overturning increases the heat content of mixed layer without mixing heat downwards. How? Instead of increasing the amount of heat moving downwards (which as you point out is difficult because warm water rises), it simply decreases the amount of heat moving upwards. Since the OHC is a balance, slowing the heat moving upwards has exactly the same effect as increasing the heat moving downwards.
So there are four examples of downward transport mechanisms, where you said there were none.
However, there’s a larger conceptual problem. The ocean heat content is not some stable amount to which a little bit is annually added and subtracted.
Instead, the OHC represents the ongoing balance between two very large flows—the flow of sunlight and longwave radiation into the ocean, and the same sized flow of energy out of the ocean in the form of radiation, conduction to the atmosphere, and evaporation.
Globally on a 24/7 basis, this flow averages about a half a kilowatt per square meter that is constantly flowing into the ocean, and another separate flow of a half a kilowatt per square meter that is flowing out of the ocean.
It is the difference between these two large flows that accounts for the annual changes in the OHC shown in Figure 1. As determined above, annual OHC change average about two tenths of a watt/m2 … and the flows are half a kilowatt.
Finally, remember that the OHC changes in the 0-700m layer do not depend on oceanic mixing. By that I mean that a joule added to the surface-most layer is counted the same as a joule added down at 700m depth.
All the best,
w.
Instead, the OHC represents the ongoing balance between two very large flows—the flow of sunlight and longwave radiation into the ocean, and the same sized flow of energy out of the ocean in the form of radiation, conduction to the atmosphere, and evaporation.
again, you are ignoring heat that travels out the bottom of the 0-2000 m layer.
Ximinyr says:
June 20, 2013 at 10:09 am
Certainly, you are correct that the ocean appears to be warming.
But our data are not yet good enough to establish whether this apparent warming is real, or is only another random fluctuation. You keep saying it’s real, it’s real … but statistics disagree. We don’t yet have enough information to draw that conclusion.
Yes, the trend itself is not zero. But we don’t have enough data yet to say it’s real.
Let me give you an example. Suppose you roll a pair of dice once and you get a pair of sixes. Can you conclude from that throw that the dice are loaded to give you sixes?
Well … no, you can’t. The chances of throwing a pair when you throw two dice is one in six, so getting a pair of sixes could easily be a random occurrence.
This is the same problem we often face in climate science, not having enough data to draw a statistically significant conclusion.
So yes, you are correct, the trend is non-zero, just like yes, a pair of sixes were thrown. The problem is … we don’t have enough data to know if either of those results is statistically significant.
I understand and share your frustration regarding that, but it’s the hard mathematical facts.
w.
Willis: you are getting lost in the statistics.
Again: you aren’t calculating the trend in OHC!
you are calculating the trend of its derivative.
these two things have very different statistical results, because the first is increasing strongly, but the second isn’t.
that’s hardly surprising — that the 2nd derivative fluctuates more than the 1st derivative. differences of differences often do.
the problem is with your understanding of the data, not the statistics. look at my example at 10:09 am above, for OHC(Y)=kY. This is a clean example where statistics can be ignored.
What does your methodology, as in your post, predict for the trend in forcing?
kadaka (KD Knoebel) says:
June 20, 2013 at 6:07 am
From Eric H. on June 20, 2013 at 3:08 am:
So the sun and clouds (drivers) are responding to CO2 (bad alignment)? How does that work exactly?
“Is it that hard for you to figure out?”
Actually it is. Can you please provide a reference that shows the sun responding to CO2? I would love to read it.
I read climate blogs because the debate and science interests me. I seldom post and when I do I do so respectfully and I am usually asking questions.
Unlike you, I don’t harass others and engage in petty fights in order to try and look smart, in short kadaka, I don’t wrestle with pigs and I don’t argue with idiots.
I am done with you,
Eric
PS I have over 30 years experience in auto mechanics… as a profession, business, and hobby…Don’t quit your day job.
Ximinyr says:
June 20, 2013 at 10:36 am
First, thanks for quoting my words. It makes it possible to see where the misunderstanding is occurring.
I did not say the “ocean heat content (OHC) in the top 2000 metres represents …”
Instead, I said “the OHC represents”. This is because I was talking about the total OHC, not some subsection of it.
As a result, I am not ignoring anything regarding the 0-2000m layer, because I said nothing about it. In that quote I was discussing the OHC, the ocean heat content. Sorry for the confusion.
Best regards,
w.
willis: my point is that by looking only at the balance at the surface of the ocean you are ignoring energy that goes in and out of the bottom of the 0-2000 m region,
but that’s a minor point. the major point is your misinterpretation and misuse of the data. your result says nothing like what you have claimed.
Willis Eschenbach says:
June 20, 2013 at 10:33 am
“So there are four examples of downward transport mechanisms, where you said there were none.”
OK, you’ve made your point. There are avenues for deep water mixing of upper heated levels. However, it still does not jibe with me.
I grasp what you are saying with the following analogy. You have a bucket of clear water. You take a pitcher and, from a height, start pouring blue tinted water in. By the force of gravity, it plunges down in a narrow channel, creating a localized gradient from deep blue at the surface to lighter blue with depth. But, that gradient doesn’t exist everywhere, so on average, as the plume spreads out below, you get bluer depths than in the upper layers.
Here’s where I see that scenario failing to match the real world. Even though there is mixing, there is nothing like a focused jet of tinted waters rocketing to the depths. Moreover, we are concerned specifically with heat generated by excess CO2, and that is not coming in at one particular focal point, but broadly distributed over the entire body of oceans.
So, it’s more like raining blue tinted water over the entire bucket, and then swirling a portion of the surface downward in a whirlpool eddy. Does this create a deeper blue at depth than in the upper layers? I have difficulty in imagining that.
Ximinyr says:
June 20, 2013 at 10:09 am
I think I see your point, though my reading is really only cursory. However, let me ask you this.
If the mean of a process is not statistically significant, how can the slope of the accumulation be so?
The answer to the question does depend on the autocorrelation of the process but, assuming your estimate of the mean is optimal, then it is tautological that you cannot estimate the slope of its accumulation better than that. If you could, then the estimate of the mean was not optimal.
For example, if you take a sequence of zero mean white noise and accumulate it, you end up with a random walk. You may will find that a finite sample of that random walk process displays a readily apparent trend, and be able to fit a slope to it. However, the uncertainty in each point of that process is increasing with the square root of the number of samples accumulated, and so your apparent trend is merely a manifestation of the accumulating noise in the original sequence. The trend could reverse tomorrow, and so your estimate has no predictive power. Your best estimate of the future is actually the final value of the accumulation.
Bart, I don’t immediately know the answer to your question, which is a good one as the random walk example makes clear.
Intuition often fails when dealing with autocorrelation, but I have an intuitive sense, for whatever that’s worth, that the slope of a set of nearly linear points can be statistically significant while the slope of the set of their differences may be statistically near zero.
I just have a very hard time believing that the NOAA plot of 0-2000 m OHC as a function of time does not have a statistically significant positive slope, even with autocorrelation. I could be convinced if (1) someone did a calculation of the slope using the OHC data directly, and not the slope of their differences, and (2) they used a better model for the autocorrelation than the Nychka equation.
jai mitchell sez:
“”” maybe about 1.2% increased absorption in the tropics would do it. See the following graphic.
http://oceanworld.tamu.edu/resources/ocng_textbook/chapter05/Images/Fig5-7.htm
The tropical net energy absorbed in the latitudes of -30 to +30 is about 40 Watts per meter squared on average.”””
That sounds like you are saying the tropical oceans absorb this apparently small increase in the energy flux across the vast expanses of the oceans and then magically concentrate it in the small areas of the tropical oceans where there might be deep downwelling. Nice trick.
Ximinyr says:
June 20, 2013 at 12:23 pm
“…I have an intuitive sense, for whatever that’s worth, that the slope of a set of nearly linear points can be statistically significant while the [mean] of the set of their differences may be statistically near zero.”
Take a closer look at the plot of samples of Brownian motion at the Wikipedia link I gave previously. Are there periods in which there appear to be a linear slopes? Are they real?
Willis Eschenbach says:
June 19, 2013 at 6:37 pm
==========================
Forey writes (p.37: http://books.google.com/books?id=wHZ6WwqbrmkC&pg=PA37&lpg=PA37&dq=coelacanth+cave+temperature&source=bl&ots=RHe2hmN7TZ&sig=2x3cq-kyLPQN3SydSah6Gp6ITzc&hl=en&sa=X&ei=GuzBUfiHNuKUywGC9oGIAw&ved=0CEYQ6AEwAw#v=onepage&q=coelacanth%20cave%20temperature&f=false):
“It is generally believed that the minimum depth distribution of Latimeria is governed by temperature because the maximum oxygen saturation of coelacanth haemoglobin occurs at 15-18°C. Latimeria is unlikely to be able to tolerate temperatures exceeding 22°C for any length of time. The depth of observed coelacanths does correlate with the depth of the 18°C thermocline…
“Within these caves the water temperature was generally higher and in some cases reached 23°C (Fricke et al., 1991: table 1). This observation, and the fact that the water temperature of the Mozambique find (Bruton et al., 1992) was 28-30°C, calls into question the preferred temperature tolerance (Huges and Itasawa, 1972).”
A few points:
1) Only big coelecanths have been caught or observed; juvenile behavior remains unknown. Their large size, nocturnal and cold water preferences, cave hiding and fatty tissue are probably all evolved to avoid sharks (and pleisoraurs, orcas, etc.), which prefer warmer T ranges (and daylight?).
2) Morphologically the coelacanth is similar to its Devonian ancestors; physiologically it has adapted to colder T’s than those in which it’s ancestors evolved lungs. It is a big enough fish to generate an internal T slightly higher than its surroundings in spite of its low metabolism–how much higher I can’t say. It’s a very safe bet the coelacanth’s metabolism has decreased greatly in the last 300my.
Granted, a “cold blooded” fish of extraordinarily low metabolism (apparently calculated by observation of feeding habits and stomach contents–they never survive at the surface) could not be expected to contribute much heat to its surrounding water–maybe less even than ground heat (back to down welling warm water). But the assumption that an ectotherm would always seek out colder water to keep its energy expenditure low runs into a brick wall of problems, first and obviously that of the wide T range of ectothermic adaptation. Some like it hot; some like it cold. They don’t care if they have to burn a few more calories–they will try to keep their body at whatever T their enzymes have evolved to work at.
And notice that this notion of T and calories has reversed the argument: ectotherms are defined by their inability to control their temperature by burning calories, and here is claimed that a higher T would automatically entail a metabolic increase, as if these ectotherms were really fur-less endotherms all along, albeit with broad T tolerances (I think they were).
Now where were we? The adults do spend the day in caves; we don’t know what the little ones do. No, communal body heat isn’t good for much with such a low metabolism. Do they prefer warm caves over cold? Nobody knows. They probably stay in caves to hide from predators. Circulation must be poor in the caves, meaning low oxygen, meaning low metabolism, but they only want to rest anyway. That they sleep in caves means they hug steep shorelines, avoid open water, move vertically rather than horizontally (compared to others), and so are able to choose an ideal T with minimum effort.
Hemoglobin suggests the coelecanths need cold water, as does their inability to survive capture, while the Mozambique specimens prefer warmer water. Granted, cave resting doesn’t tell us much except that they can’t survive open water during the day. Their low metabolism is probably a product of cave hiding, a product of avoiding predators. They gave up their lungs and they gave up their primeval metabolism and tropical physiology in order to survive for 300my while all their kin went extinct.
So why are the caves warm? They most slope upwards, for one thing. –AGF
Willis’ top post: “..heat content of the global 0-2000 metre layer of the ocean…”, “” …change in heat content of the upper ocean..”, “..move that much heat into or out of the ocean…”,”..Figure 1 gives the results, where heat going into the ocean…”
1) Fig. 1 shows energy flux density vs. time not heat vs. time; the caloric theory had some usefulness in its time but like slide rules, we have moved on to energy flux densities as shown.
2) “..the energy that’s gone into or come out of the ocean on an annual basis” – that’s better, like calculators replacing slide rules.
Willis’ reply to Kristian 6/20 2:03am:
“Heat ….is a concept, not a physical..”
Think Willis will then agree that the term “energy” is the more appropriate physical term to use in the top post e.g. “…energy content of the global ocean”, “…change in energy content…”, “…move that much energy…” are more modern & correct than “heat content”. And better understood.
So agree, the difference in term causes much unneeded electron death. And much unneeded blog reader irritation.
Blogged at:
http://davidappell.blogspot.com/2013/06/wuwt-ocean-misunderstanding-and.html
Ximinyr says:
June 20, 2013 at 10:57 am (Edit)
What, are you caught in a time warp? Here’s yesterday’s interaction:
Willis Eschenbach says:
June 19, 2013 at 8:15 pm
I calculated them both. I gave you the results of both. I explained about the precise reasons for the lack of significance of both, and went over the math.
Please do try to keep up, you’re embarassing yourself. I am calculating the both the trend in OHC, AND the trend in its derivative . Neither one is significant.
Sadly, there are no examples where statistics can be ignored. I’ve shown that in excruciating mathematical detail above. You think all you have to do is grab Excel and use the canned routines … doesn’t work that way.
Now you have me stumped. What I said in the post and the comments is that the data are inadequate to determine a trend in either the OHC, or in the forcing responsible for the changes in the OHC. It’s in part a reflection of the large errors in the data, particularly in the early years.
And in part it’s a reflection of the fact that the OHC is the net of two very large, ~ half-kilowatt constant flows into and out of the ocean. If either of those flows varies by half a percent from year to year, thats a 2.5 watt/m2 forcing … and if they both vary by half a percent in opposite directions, that’s a 5 W/m2 forcing.
So my methodology doesn’t predict anything about the trend in forcing. I don’t know which way that frog will jump, and neither does anyone else. Heck, since the trend is not statistically distinguishable from zero, we cannot even say yet if there is a trend in the OHC, or whether we’re just looking at the expected random fluctuations.
The problem is that as the saying holds, nature is naturally trendy. This is one of the common features of autocorrelated datasets—they contain trends of surprising length compared to random datasets.
I see you really, really don’t like it that the data is inadequate to draw even simple conclusions about the oceanic heat content … but them’s the facts .
My regards to you,
w.
In response to:
Anthony Watts says:
June 19, 2013 at 4:13 am
I would LOVE to hear Cook’s explanation for the several periods of a few years length when the ocean lost considerable heat content but the atmosphere did not gain any. The heat must be hiding in rocks too. Sneaky heat.
agfosterjr says:
June 20, 2013 at 1:35 pm
Good stuff. Thanks for the followup, the details, and the edification.
w.
Trick says:
June 20, 2013 at 1:49 pm
Thanks, Trick. You’d be right if the English language were logical, but it’s not. As a result, in climate science the amount of thermal energy in the ocean is called the “ocean heat content” and is known far and wide by its acronym, OHC. Go figure.
Me, I’m not one to butt my head against walls, but if you want to try to convince the planet you’re right and established usage is wrong, well, be my guest …
w.
Willis wrote:
I’ve shown that in excruciating mathematical detail above.
No, you’re applied some formulas, without understanding what they meant or their limitations.
In particular, the Nychka equation is inapplicable here. The document you referenced even says it doesn’t work when n_eff < 6.
Willis wrote:
Now you have me stumped.
Oh please. The example OHC(Y)=kY clearly shows that your methodology is incorrect. It predicts a forcing trend of zero, when clearly the OHC is increasing.
It doesn’t get simplier than that.
Willis wrote:
What I said in the post and the comments is that the data are inadequate to determine a trend in either the OHC, or in the forcing responsible for the changes in the OHC.
Where did you calculate the statistics for the trend in OHC?
All I see is the trend in its annual change. Very different.
Ximinyr says:
June 20, 2013 at 2:19 pm
You appear to have glossed over what Willis has written without paying attention.
“The first one is how small the average value of the forcing actually is. On average, little energy is going into the ocean, only two-tenths of a watt per square metre. In a world where the 24/7 average downwelling energy is about half a kilowatt per square metre, that’s tiny, lost in the noise. Nor does it portend much heating “in the pipeline”, whatever that may mean.
The second is that neither the average forcing, nor the trend in that forcing, are significantly different from zero. It’s somewhat of a surprise.
The third is that in addition to the mean not being significantly different from zero, only a few of the individual years have a forcing that is distinguishable from zero.”
So, no, he is not saying what you and Appell (unless you are the same person) claim he is saying.
Willis wrote:
So my methodology doesn’t predict anything about the trend in forcing.
Does your own spreadsheet (cell P6) not say,
“”Mean: 0.2 ± 0.3 W/m2 (95%CI)
Trend: 0.1 ± 0.2 W/m2 per decade (95%CI)
Neither mean nor trend is statistically significant.””
https://dl.dropboxusercontent.com/u/96723180/Levitus%20Forcing.xlsx
Willis wrote,
Heck, since the trend is not statistically distinguishable from zero, we cannot even say yet if there is a trend in the OHC.
You are calculating the trend in the ANNUAL CHANGE IN OHC, not in OHC.
Surely you can see that.
My OHC(Y)=kY example above makes this very clear.
Bart says;
,I.The first one is how small the average value of the forcing actually is. On average, little energy is going into the ocean, only two-tenths of a watt per square metre.
Willis isn’t calculating any “forcing.” For one thing he ignores heat moving into or out of the 2000 m layer of the ocean. In any case, heat transport is a “forcing” — it is just an exchange of heat. Forcings happen at the TOA.
Bart says:
The second is that neither the average forcing, nor the trend in that forcing, are significantly different from zero. It’s somewhat of a surprise.
It’s not a surprise. As the OHC(Y)=kY example shows, the ocean can steadily and monotonically gain heat when the “forcing” as defined by Willis has a trend of zero.
That immediately tells you that his interpretation of what he’s calculating is wrong. Period.
Ximinyr says:
June 20, 2013 at 2:38 pm
You appear to somehow be editing out the part you don’t want to see. The average of what Willis calls “forcing” is indistinguishable from zero. Thus, the slope in OHC is indistinguishable from zero, too. What Willis is saying is that, as in the random walk example I provided earlier, there is no assurance that the slope in OHC is not a spurious, statistical artifact. At least, that is how I read it.
Willis then goes on to say that the trend is also statistically indistinguishable from zero. But, that is just icing on the cake.
I have not delved into Willis’ calculations, and am not vouching for them. It just appears to me that your line of attack is unfounded.
Willis
I’ve just downloaded and had a very quick look at your spreadsheet. I’ll have a closer look later. But something caught my attention. Now It’s possible I’ve misunderstood exactly what each part of SS is calculating but I notice that Cell F3 contains the value 5.11E+14. Cell P3 contains the text “m2/surface” which I assume refers to the value in F3.
It’s just that the total surface area of the earth, I believe, is about 510 million sq km which looks pretty close to your F3 value. Is this what you intend – or do you really want to use the surface area of the ocean which is about 70% of this value.
sorry if I haven’t understood what’s going on. .
Bart says:
The average of what Willis calls “forcing” is indistinguishable from zero. Thus, the slope in OHC is indistinguishable from zero, too.
Absolutely not.
The example OHC(Y)=kY explicitedly shows your claim is untrue — that a zero trend in “forcing” does not mean a zero trend in OHC(t).
John Finn says:
It’s just that the total surface area of the earth, I believe, is about 510 million sq km which looks pretty close to your F3 value. Is this what you intend – or do you really want to use the surface area of the ocean which is about 70% of this value.
It’s somewhat a matter of taste. Over 90% of the Earth’s extra heat is going into the oceans, so dividing by the total area of the Earth would seem to make sense. On the other hand, it’s explicitedly going into the ocean, so why not use it’s area?
It’s easy to transition between the two, so it’s really a mote point.
Bart says:
I have not delved into Willis’ calculations, and am not vouching for them. It just appears to me that your line of attack is unfounded.
Simply consider the case OHC(Y)=kY, which I wrote about it detail above.
Willis’s method finds, clearly, that the trend in “forcing” for this function is zero.
But obviously the ocean is steadily gaining heat.
Hence, Willis’s interpretation of “forcing” is clearly wrong. It’s obviously wrong. It can’t be made clearer.
ferd berple says:
June 20, 2013 at 6:37 am
Last time I dipped my toe in the ocean it was way too cold. Maybe if you live in the tropics the oceans are barely warm enough to go swimming. Everywhere else and you risk dying of exposure with anything more than a quick dip.
——————————————————-
Not quite true, Ferd. I have been in the ocean off Perth, Western Australia (31.9 degrees S) in summer, and the water was tepid. Summer currents bring this water a long way beyond the tropics.
It is certainly true that there is a lot of cold and dangerous ocean on the planet. But, given that the Pacific is the largest of them all, and most of it is in tropical or temperate zones, things are not quite as bad as you claim. The Indian Ocean – which Perth adjoins – is also substantial, and contains significant amounts of (to me) water which is like a bath you need to get out of.
Ximinyr says:
June 20, 2013 at 3:22 pm
“The example OHC(Y)=kY explicitedly shows your claim is untrue — that a zero trend in “forcing” does not mean a zero trend in OHC(t).”
What a curious blind spot. Please read more carefully.
From Eric H. on June 20, 2013 at 10:58 am:
Actually that comes from what you said just before, “So the sun and clouds (drivers) are responding to CO2 (bad alignment)? How does that work exactly?” You mangled my clear analogy and assigned “sun and clouds” as drivers. My apologies for fleshing out my analogy as I intended rather than address the mangling.
Frankly, after reading this stuff for this long, I doubt there’s any particular thing that can be called a “driver”. Sure, the Sun provides the energy, but there are many feedback mechanisms, with many interconnections, that regulate how much solar energy is absorbed, rejected, and re-emitted. There are compensation mechanisms, including biological, that adapt to variances in solar output over time and maintain temperatures.
The climate travels in a rut. Unless it drops into the deeper rut of glaciation, where it’ll travel much longer.
It’s feedbacks on feedbacks, feedbacks all the way down.
I look for the quirks, the snags, where what should be the smooth flow of logic gets hung up. I comment to show those glitches, make them apparent to those who don’t realize they’re there.
Thus you imply I am both an idiot and a pig. But you have done so respectfully, as is your wont when posting. I appreciate your respectfulness.
Gee, I have about that long myself, but I do it for survival, couldn’t and can’t afford to run to the repair shop every time. I remember putting up a new power rack on my 1978 Ford Fairmont, in winter, with snow so deep outside I had to cut a path through the snow, it was up to the door handles, to get it to the front of the garage, where I worked underneath on a tarp on snow while wearing several layers. Fun times. It’s much better to break out the engine hoist and rebuild an engine in summer.
So you couldn’t point to anything specifically wrong with what I said? Oh well, thanks for the employment advice. You presented it quite respectfully.
Bart says:
What a curious blind spot. Please read more carefully.
I have read all your comments. Certainly you are much smarter than me, so you will have to provide more detail here, or just the same detail for dumb people like me.
Is Willis really going to ignore the OHC(Y)=kY example, that disproves his method?
Really Ximinyr your really struggling with this cool graph that shows a huge change in energy 200×10^23. But this change is really insignificant depending on what unit of measure your using. I think Willis has shown that the forcing that is “causing it” is actually indistinguishable from zero. Additionally the source data your referring to is not raw data but massaged data. No one has actually determined in water accuracy of the multitude of instruments that created that data set. So the Data is somewhat suspect. another 20 years of ARGO with some expansion and a few in water experiments would nicely let us know what is actually going on.
The oceans of the world may be cooling or heating and cooling. We don’t know based on these data sets. The Data has been massaged because some folks didn’t like what it said compared to some models. Some ARGO’s were pulled out because they were too cool without doing anything other than tossing the cold readings other older instruments were adjusted cooler without any real onsite analysis. So time will tell.
David Riser wrote:
I think Willis has shown that the forcing that is “causing it” is actually indistinguishable from zero.
Wow — is there not a single person here who understands how to do basic functional algebra?
A “forcing” trend of 0 says nothing about the change in Ocean Heat Content.
The example OHC(Y)=kY shows this explicitedly.
Did anyone here study calculas, or at least algebra?
David Riser wrote:
The oceans of the world may be cooling or heating and cooling. We don’t know based on these data sets.
Utterly, completely, totally false.
Look at the graph of the data. Does it look like anything but an increase to you??
David Riser wrote:
Some ARGO’s were pulled out because they were too cool without doing anything other than tossing the cold readings other older instruments were adjusted cooler without any real onsite analysis.
Which buoys? Serial numbers? Where can I read a report on the particular buoys that were allegedly pulled?
Please let me know. Thanks.
Willis 2:15pm: LOL, I know, I know, & you’re welcome. But ohhh…the electrons, the electrons… Not physical…
Ban heat, no more use for it, bury it with the the caloric. One small step for a top post, one giant leap for modern science.
Ocean energy content. So much more meaningful. Physical too. OEC. Take the lead. Sounds great.
You could be the one to stop a lot of the irritating heat discussion here or your next post, just don’t use the word heat, ban it, save your own time too. Use energy in joules ALL the time instead of heat in the same joules. You could put a whole organization out of business (you know the one…). Out.
Trick: Heat is a useful concept.
It is the change in energy between two states.
A number showing how much energy is in the ocean is not a very useful number — it includes all kinds of unuseful information about internal energy states, potential energy, and the like.
But a number showing how that energy changes over time — i.e. “heat” change — is very useful concept.
Nothing more, nothing less.
LoL, ok Ximinyr, read the story. Please read the story, its the backstory to the pretty rising graph. I remember quite clearly the ARGOs OMG the ocean is cooling story. Followed by well maybe not.
http://earthobservatory.nasa.gov/Features/OceanCooling/page1.php
Its a good story even if it means our data is not as sound as we would like.
David Riser; I know the story.
And I know that a trivial example shows that Willis is misintrepreting the data.
Can you do basic algebra? If so, use Willis’s method for OHC(t)=kt.
That is clearly a definite ocean warming.
Yet Willis’s method says the forcing trend is 0, i.e no warming.
I can’t make it any clearer than this. Do a line or two of algebra.
Ximinyr says:
June 20, 2013 at 4:54 pm
“…you will have to provide more detail here…”
OK. You said: “The example OHC(Y)=kY explicitedly shows your claim is untrue — that a zero trend in “forcing” does not mean a zero trend in OHC(t).”
Would you agree that a zero mean in “forcing” does mean a zero trend in OHC(t)?
Because that is what Willis has stated. He has stated that both the mean and the trend are statistically indistinguishable from zero.
Willis, I think you are misusing the Nychka method, and all your calculations are wrong.
The Nychka method provides a formula to calculate the degrees of freedom for a t-test or 95% confidence interval, but it is not the effective sample size used in calculating variance. This is not clear in the document you link to, but is clear in the paper by Lee and Lund[1] that Lucia uses to refer to the Nychka article. In this article they state clearly the correction factor for the variance of the OLS estimate of the slope, and then give the Nychka formula for the degrees of freedom of t.
In fact, the efficiency of a properly calculated estimator of the slope is challenging to calculate and doesn’t rely on an specific estimate of an “effective sample size” (see Lee and Lund), but it has been calculated for specific instances. In your case, a simple approximation of the standard error of the slope would be that it is about sqrt(0.22) times the standard error of an ordinary least squares regression slope, which would mean that the t-statistic is divided by sqrt(0.22), so about probably 3 times bigger. You can use this document to estimate efficiency for an AR(1) autocorrelation of 0.8, assuming that the x-axis has no serial dependence (since it is just time). Or you can plug the numbers into the formula from Lee and Lund if you like that sort of detail. But what should happen is that your t statistic from the OLS estimator will become bigger by a factor of about 3, which is equivalent to an effective n of about 20. Not 4 as you suggest. Then you can compare this value against a t statistic with degrees of freedom calculated using the Nychka method – that is the “effective sample size” minus 2 (because it’s regression).
If you do this I think you will find your p value is much less than 0.08.
Note however that Lee and Lund observe that Nychka’s method a) is not published in peer-reviewed literature and b) tends to give degrees of freedom below 0 for large autocorrelations, so may not be reliable.
You also don’t need to use any of this strange Monte Carlo stuff to handle testing in these cases. Every stats package can get you an auto-regression adjusted best linear unbiased estimator for the slope, directly from the data with a couple of lines of code. It’s a trivial and well-established task. So rather than using a complex combination of Nychka adjustments and MC runs, just use the standard methods in R.
I think you have misunderstood some of the background material for time series analysis. Instead of relying on complex and little-used methods promoted by other bloggers, I recommend you purchase a good textbook and work through the basic parts. I recommend Brockwell and Davis[2]. Until you do, you will continue to make the kind of basic errors that you made here.
I hope that helps.
—
References
1. Lee J, Lund R. Revisiting simple linear regression with autocorrelated errors. Biometrika. 2004;91(1):240-245. {available online free if you search}
2. Brockwell P, Davis R. Introduction to Time Series and Forecasting. Springer, New York. {I’m sure any edition will be fine}
Ximinyr 6:09pm: “ Heat is a useful concept.”
Why? How? No longer. The word “heat” had some uses when the caloric theory was in vogue. There is no longer any use for the word I can think of, it causes too much trouble like slide rules. It can always be replaced by a term with more physical meaning.
“(“Heat”) is the change in energy between two states.”
Then just say “the change in energy between two states is…
Energy transfers due to temp. differences, don’t need heat.
“But a number showing how that energy changes over time — i.e. “heat” change — is very useful concept.”
How? You just said it twice! Drop the second term, just say “a number showing how that energy changes over time is…” Save Willis’ some poor electrons for his next post.
I say ban “heat”. Join the bandwagon, lobby Willis with me.
“The room is too warm, turn down the heat.” That we all got yelled at growing up goes to:
“The room is too warm, turn down the furnace.” Much better.
Some say heat is energy in motion. NO! That implies heat was over there, now it is over here. Heat doesn’t have a position like a dog or cat.
Here’s one that might get your attention and Willis’:
The heat content of the ocean is ZERO.
It went to zero sometime in the late 1960s or 1970s when the last paper using the caloric theory was ever published. But, sure the Ocean Energy Content is greater than zero.
Can anyone else come up with any situation the word “heat” has NO, I mean NO better thermodynamic alternate? I will show the alternate.
Ximinyr says:
June 20, 2013 at 10:09 am
Since Mr. X somehow thinks this most of his is the key to the whole thing, I thought I’d take a look at it.
Actually, your post is not obvious. You start by describing an imaginary condition, where the OHC is rising the same amount each and every year, viz:
OHC(Y) = k Y
You then compare your imaginary situation to the real situation I plotted.
F(Y) = [OHC(Y)-OHC(Y-1)]/A
where OHC(Y) is not k Y, but instead is the actual measurement of OHC at time Y.
So far, so good.
But then you want to apply the OHC(Y) = kY rule from your imaginary situation, where the forcing rises the same amount every year, to the real situation where that is not true. In the real situation, the ocean heat content doesn’t rise regularly like in your imaginary condition.
So all you have shown is that if you assume that the OHC is rising monotonically, then my procedure gives a monotonic trend …
Seriously, all you’ve done is proven that if you start with a dataset with a monotonic regular trend, and you apply my procedure, you get a monotonic regular trend …
But I’m not applying the procedure to a synthetic dataset. I’m applying it to the observations, in order to understand the variations in forcing. And in that case, F(Y) is NOT k Y. That’s the funny thing about the real world.
Please learn about statistical significance. Yes, as you say the trend is non-zero. In the real world it’s almost never zero.
But to date, we don’t know if that’s just random chance, just . We don’t have enough data.
You’re like a guy that sees the roulette wheel come up red four times in a row, and jumps up and down and declares that there’s a “trend” … this is why statistics was invented, to separate the wheat from the chaff.
w.
Willis Eschenbach says:
June 20, 2013 at 1:31 am
I think you mean “4.2%” rather than 42%, but as I said, cloud cover variations are not the only possibility
—————
No i mean 42%
0.2 W/m2 ocean heat uptake is supposed to be caused by average forcing of about 1.6 W/m2 between 1955 and today.
Same forcing and therefore also 0.2 W/m2 ocean heat uptake could also be generated by a cloud cover reduction of approx. 4%. (Rossow and Cairns, 1995, Svensmark has similar numbers).
2.1 W/m2 ocean heat uptake would require a cloud cover reduction of 2.1/0.2 * 4% = 42%.
And with the cloud forcing numbers from the IPCC it gets even more implausible:
“Thus the net cloud forcing of the radiation budget is a loss of about 13 W/m²”
http://en.wikipedia.org/wiki/Cloud_forcing
0.2 W/m2 ocean heat uptake have been caused by an average forcing of 1.7 W/m2 since 1955.
There are years with a heat uptake of 2.3 W/m2.
0.2 W/m2 of these are due to IPCC forcings, but 2.1 W/m2 need an explanation.
2.1 W/m2 ocean heat uptake correspond to a forcing of 2.1/0.2 * 1.7 W/m2 = 17.8 W/m2
That means, even removing ALL clouds for a whole year would not be sufficient to explain this increase in ocean heat uptake.
Willis Eschenbach says:
June 20, 2013 at 8:42 am
Oh my goodness, no, no, no. The Argo data, like any dataset, has its problems. Coverage is one of them, albeit not a large one.
I’m saying there is a warming bias in the data due to surface drift and perhaps subsurface drift as well that will affect every ARGO float. Maybe the bias is too small to worry about, maybe not. I don’t know, but nobody else does either. I can think of 2 ways to quantify the bias. The obvious one is to make a percentage of the ‘floats’ fixed as a control for drift bias. But I am not aware of any plans to do this. The other way is a bit more complicated.
We are not talking drift of few kms. Some floats are drifting more than 1,000 km in a year.
Watch this animation from real ARGO data, especially the floats in the Southern Ocean.
Ximinyr were just going to have to agree to disagree. I get what your saying but your not getting what Willis is saying. I am decent at math, I can do basic calculus and enough statistics to get me into trouble. I am better at logic and working with objects and dealing with errors. The problem just boils down to a data set that is at best interesting, most likely its a crap shoot and it could be anything. What we need is about 20 more years and 10x the ARGOs we have, with a means to verify their accuracy at a given depth, drop rate etc.
Well Philip your vid is not working for me. Which is a bummer.
I too would like to find some way to verify the accuracy of the various floats, I have some ideas but they would take a good bit of work as does most science when it comes to field work. I do hope we continue with ARGO, even if it does have a bias, as long as the data set your using is entirely ARGO it would be useful.
David, I wasn’t expecting WordPress to create the link. This is the URL with ** around it.
**http://www.youtube.com/watch?v=miiHsBTC6X4&feature=c4-overview&playnext=1&list=TLgaBT5oxRC4o**
My basic point was you can not reliably determine a trend from a dataset that has a systematic sampling bias.
Stats101, you either sample randomly OR you measure the same thing at the same place at intervals. Argo does neither.
Or try this.
**http://www.youtube.com/watch?v=miiHsBTC6X4&feature=c4-overview&playnext=1&list=TLGFO7H4wWuBs**
Willis Eschenbach says:
June 20, 2013 at 9:44 am
/////////////////////////
Willis
Your two articles on Levitus are good articles, so it escapes me why you would wish to lower the tone with drivel.
My comment was to the effect that lessing the rate of cooling is not the same as warming (different processes are involved) and I shall therefore restrict my response to that.
In science and lwa, precision of languaguage is paramount. It assists in understanding what is going on, the proper identification of cause and what response might be required and the effectiveness of such response.
This is a science blog. It means that your audience has either a scientific background, or least an interest in science. You are not dealing with 5 year olds. Sometimes with 5 years it may be advantageous to give a simplified analagour explanation of something complex so as to help them undderstand the effect of that. You know that when they grow up, they will be better educated and a correction will take place so that when they have better knowledge and understanding they will told the truth, ie., the real explanation.
I do not know why you find it so difficult to accept that, in scientific terms, slowing the rate of cooling is not warming. The statement “So I absolutely reject the argument that the meaning of the word “warming” does NOT include the concept of warming by slowing the heat loss.” is merely a misunderstanding of what is going on. It is easy to see this.
A better analogy would be: I want a boiled egg. An hour ago I made myself a cup of coffee and there is still some hot water in the keetle. It is 40degC and I pour it into a sause pan and put in my egg. I know that I need to warm the water up iin order to boil the egg. My old mate Willis has told me a trick. He informs me that I can do this by slowing the rate of cooling. I therefore put a lid on the sausepan and 8 mins later I come back to get my boiled egg. Unfortunately when Ibreak it open, it is raw and un cooked. I don’t understand why. I check the water in the sause pan and find out that it is 39degC.
Now has the water in the sause pan warmed? Observational evidence would say no.
I decide to conduct an experiment by repeating the event the next day, checking that the water that I use from the kettle is 40degC, but this time without placing a lid on the sausepan. The egg is just as uncooked, but this time the water in the sause pan is measured at 37degC
I then repeat the event the next day, again checking that the water from the kettle is 40degC, but this time I switch on the cooker, and apply heat from the hotplate. Hey presto, my egg is cooked.
I measure the temperature of the water in the sause pan and find it to be 100degC
I conclude that the only time there is any warming of the water from the kettle is when I apply heat. i conclude that the time when I simply used the lid of the sause pan did not warm the water from the kettle. Indeed, the water from the kettle cooled (it was 40degC then fell to 39degC). When I did not use the lid, I noted that the amount of cooling was greater (the water cooled from 40degC to 37degC) and I conclude from that tthat placing alid on the sause pan slows the rate of cooling, but does not in any sense warm the water. It does not cook the egg. I conclude from this that if I want to warm the water I need to applly heat. I also conclude that there is a difference between slowing the rate of cooling and warming. They are different things in real terms, in effective terms and paractical terms; they are not equivalents.
If you want to conflate these processes, please do so, but it does not help anyone (and in this I include yourself; it does not help you understand what is going on in the real world and why).
If something slows the rate of cooling, say it slows the rate of cooling. Say it would be even cooler but for X. Don’t say X warms, when X does not and merely slows the rate of cooling. .
Philip Bradley says:
June 20, 2013 at 9:44 pm
//////////////////////////
Philip
You are not alone in ththat there may be a bias which may need to be taken into account. Like all data sets, in my opinion, errors are not sufficiently identified, ackknowledged and ascertained.
When I comment on ARGO, I frequently suggest that there may be a bias. We do not know whether it exists, and if so whether it is a warming bias or a cooling bias. however, the fact that the buoys drift suggests that they will be influenced by prevailing currents and prevailing currents have a distinct temperature profile distinct from the larger body of the ocean at large.
Personally, I would be surprised if there was not some form of bias. Whether it is significant is a different matter, but then again when you are dealing with hundreths, even more so with thousands of a degree, the slightest bias could be material and could pollute the data and one’s interpretation of what the data is revealing.
So to conclude, if we are trying to read something significant into very small changes of temperature, we need to ascertain whether there is an bias and its extent. We need to be conscious that due to the free floating nature, we are never making precise like for like measurement, so we do not know the precise change of the precise column of water over time.
ARGO is useful, since pre ARGO, ocean temps are not known with any degree of accuracy. ARGO is at least giving us some clarification on this, albeit the coverage is insufficient and the length of data sparse.
Manfred says:
June 20, 2013 at 9:04 pm
///////////////////////////
Manfred
You are spot on that there must be some other ongoing process and some people are not grasping the significance of this fact. This is why I copied one of your comments from the earlier article on Levitus since I consider that to be the meat of the issue raised by all of this.
The IPCC (and the Team) are hiding the implications that follow from the claimed changes to OHC and forcings going into the ocean.
Since we know that there are deep ocean currents and that the thermocline is not at uniform depth, would we not be expecting to see changes in temperature measurements of the deep ocean? The fact that there may be a very slight increase in temperatures taken in the deep ocean does not surprise me (at least not at this stage when there is at best only about 10 years worth of data), and does not suggest that something not normal and/or not natural is going on.
From richard verney on June 21, 2013 at 2:09 am:
But dear sir, it is a common technical misstatement which you are rehashing into pedantry. You want to warm up inside, you put on a sweater, or turn up the thermostat. You want to warm up outdoors, you put on your coat, or do jumping jacks. Either way has the same net effect, you are warmer than if you had taken no action.
Then there’s the case where you are still cooling off, but at different rates. A naked swimmer can lose heat quickly, so instead a wetsuit is worn to stay warm. You’re trapped in a field overnight, and make yourself a burrow of dry leaves to keep warm while you sleep. In either situation, you’ll end up colder than when you started.
But it is readily understood that “keeping warm” is the slowing of the rate of cooling, “warming up” can also be that slowing. We’re not 5 year olds, we know what we mean when we use such language.
English can be very hard to learn as another language, as we rely so heavily on context, with any one word having perhaps four or five meanings depending on use. As long as it is known what was meant, the job is done.
And there is a sterling example of you knowing what Willis meant, Willis knew what he meant, I (a reader) knew what was meant… And by what you wrote, I’m wondering why you don’t know the difference between adding warmth and slowing the loss of warmth.
And putting a lid on lukewarm (104°F) water to slow the rate of cooling? I do slow the rate of heat loss while cooking by covering pots and pans, which does so by reducing the energy loss from steam production. But covering a pot of barely-warmed water? Evaporative loss is negligible, I’d keep the water warmer longer by taking the pot off the burner and putting it on a dry towel.
kadaka writes “You want to warm up inside, you put on a sweater”
For me the difference between reduced cooling and actual warming is that you can (for example) reasonably accurately determine the temperature of a dead body shortly after death because its just cooling down and if you put a jumper on it, and you know how much effect the jumper has you can determine the rate of heat loss and hence temperature.
Compare this with knowing the temperature of a living body that puts on the same jumper. Now to know the temperature you need to know how much effect the jumper had AND how much energy the body is producing.
Its the same with the ocean. Its not enough to determine how much the ocean is warming by understanding the factors that slow its cooling, you also need to know the factors that add energy in the first place. So you need a good understanding of, amongst other things, clouds and we just dont have that right now.
Willis,
El Niño, geostrophic gyres. etc. pile up water to be sure, but they merely depress the thermocline rather than effectively forcing “heat” into lower layers.
Slowing nocturnal overturning would be a function of atmospheric temperature near the interface. To slow the ocean surface cooling the atmosphere would have to warm, and we have pretty good information that is not happening.
I nearly wrote a follow up comment that while I see no significant down welling transport in the tropics, upwelling is an entirely different story. “Somewhere on the planet” is the key phrase in your response regarding the necessary corresponding down welling.. That somewhere is not in the tropics.
I was responding to jai and his concept of stirring and mixing. This is all about the mixed layer, above the thermocline in the tropics. My point is the warmed water will always return to the surface where it can’t hide from the satellites.
richard verney says, June 21, 2013 at 2:09 am:
Thank you for that exposition, Richard. What you told Willis there is exactly what I was trying to tell him earlier on, upthread. The atmosphere does not warm the surface, because it does not transfer heat to it. It is not a separate heat source to the surface. The surface is the heat source of the atmosphere. The surface loses energy to the atmosphere. If anything, the atmosphere can only slow the rate of surface cooling. Like you said, that’s a very different physical mechanism.
I have great appreciation for Willis’ contributions to this blog. He has a clever mind and a sharp eye for details that other people might not see. But sometimes he comes off as a bit too full of himself, seemingly thinking he is the only person in this world with knowledge and experience and then addressing his opponents as if they were 5 year olds without even trying to follow what they’re actually saying … Not a good trait.
So I agree completely with what you’re saying, Richard.
richard verney says, June 20, 2013 at 4:32 am:
“In short, you can’t spend what you do not have. It is difficult to see how the atmosphere can spend more than it receives from solar (surface absorbed solar which the surface radiates) when the only source of revenue into the system is from the sun.”
Again, great way of showing the absurdity in portraying the 390/324 individual IR fluxes as real, separate and hence detectable energy flows. They are not. If anything, they are part of a continuous exchange of inseparable and unextractable energy flows/waves that results in a measurable heat flux going UP from the surface. And that’s that. Those two opposing fluxes are simply inferred from the ‘concept’ of energy exchange between systems.
The surface of course only gains its energy from the Sun (from above). That’s a no-brainer. The Sun is the heat source of the Earth. The surface in turn loses energy back out/up, by radiation (to the atmosphere and space), conduction/convection and evaporation (to the atmosphere). It gets 168 W/m^2 in (transfer of heat from Sun to surface) and sends 168 W/m^2 out (transfer of heat from surface to atmosphere/space), of which 66 W/m^2 is radiative loss and 102 W/m^2 convective loss: (66+102=) 168. There is heat balance at the surface as at the ToA.
Kristian says:
June 21, 2013 at 8:17 am
“If anything, the atmosphere can only slow the rate of surface cooling.”
Now, you’re getting it. When you slow the rate of a flow, the flow backs up, just like a car accident on the freeway causes the cars behind to back up.
Do not confuse energy, measured in Joules, with power, measured in Watts. A Watt is a Joule per second. It is the measure of the rate at which energy is transported. The Earth acts to equalize Watts in to Watts out. But, what happens to the actual inventory of energy in Joules stored on the planet depends on how those Watts get modulated coming in and going out.
Think of a dam placed across a river. Initially, the flow stops, and the water builds up behind the dam. But, eventually, the water gets deep enough that it flows over the dam. When equilibrium is reestablished, the flow in, above the dam, is the same as the flow out, below the dam, but there is more water behind the dam than there was before.
The analogy with the Sun’s input and CO2 in the atmosphere, is obvious. Sun energy flow in = radiation energy flow out. The CO2 acts like a dam, and the energy builds behind it until it reaches the point at which it spills over, and equilibrium of the flow is reestablished.
Philip Bradley says:
June 20, 2013 at 9:44 pm
Please don’t project your ignorance on the rest of us. I’ve looked at the issue of float drift and distribution in some detail here.
w.
richard verney says:
June 21, 2013 at 2:09 am
Richard, in the English language, when we do something and the end result is that something ENDS UP BEING WARMER, we call that “warming the object”.
And by the same token, if we do something and the end result is that some object ends up cooler, we call that “cooling the object”.
The world ends up warmer if we add GHGs than if we don’t. So we say that GHGs warm the world.
Now, you seem to think that this is a horrible, terrible misuse of the english language. But since everyone knows what is meant by it, where is the misuse?
The addition of GHGs to an atmosphere without them results in more downwelling energy striking the surface. This ends up with the surface being warmer that it was without the GHGs.
Now, I and the rest of the world call such a process, where energy is added to an object and it ends up warmer as “warming”.
You can call that process “slowing the cooling” if you wish, Richard. But since that terminology neither increases peoples understanding nor gives us any further insights into the physical process, and simply confuses people and leads to meaningless semantic arguments … what’s the point?
I used to think that grammar Nazis were bad. But they are nothing compared to scientific grammar Nazis. You have a long road ahead if you think you’ll change things so that people no longer say say “Boy, that jacket you gave me really warmed me up”, and instead they start saying “Boy, that jacket you gave me really slowed my heat loss”.
Adding GHGs to the atmosphere increases the energy striking the surface. As a result of that additional energy striking the surface, THE SURFACE ENDS UP WARMER than it would be without the GHGs.
Now, us bozo normal people out here call such a process, where an object ends up warmer than it would otherwise be because more energy is striking the object, we call that process “warming” the object.
As I have said, you can call it what you damn well please, because regardless of what you call it the end result is the same—the object ends up warmer than it would be otherwise.
But no matter what you call it, other folks will just go on calling it “warming”, because the object ends up warmer. Or as the Online Thesaurus says:
warm – make warm or warmer; “The blanket will warm you”
As the thesaurus entry clearly demonstrates, the language doesn’t care about the process. The language doesn’t care that the blanket is not a heat source. “Warming” refers to the end result, that the object ended up warmer than it otherwise would have been. It does not refer to or care about the details of the process.
You can rail against that all you want, claim it’s not logical and all the rest, and you’ll be 100% right … so what? Language isn’t logical, never was, and never will be, despite the best efforts of all the world’s grammar Nazis.
w.
kadaka (KD Knoebel) says:
June 21, 2013 at 3:41 am
/////////////////////////////
It is not pedantic. It goes to the processes involved.
If one is only talking about slowing the rate of cooling, it is possible to achieve this result without the need to apply any energy. That may tell you a lot about a system, or feasability or expense of achieving something.
If one is talking about warming something, then one needs to apply some form of energy. That leads you to a different insight into the system.
If you are unable to understand the importance of this distinction then you have my sympathies. One does not achieve understanding and knowledge without properly and correctly identifying the processes involved.
richard verney says:
June 21, 2013 at 4:33 pm
“If one is talking about warming something, then one needs to apply some form of energy.”
There is a constant stream of energy coming in from the Sun. It must be constantly dissipated to maintain thermal equilibrium. If you inhibit that release, it will build up behind the obstacle, just like a dam inhibits the flow of water in a stream, and causes it to pool up behind the dam.
Willis Eschenbach says, June 21, 2013 at 12:36 pm:
“The addition of GHGs to an atmosphere without them results in more downwelling energy striking the surface. This ends up with the surface being warmer that it was without the GHGs.
Now, I and the rest of the world call such a process, where energy is added to an object and it ends up warmer as “warming”.”
But Willis, there isn’t more downwelling energy striking the surface. There is less going out. Do you seriously not see the difference? You need to get this. Your ‘downwelling’ energy would never ADD energy to the object (the surface of the Earth) because it is always simultaneously, instantaneously and continuously countered by a larger IR flux of ‘upwelling’ energy. You cannot separate the two. They are not independent fluxes. The ‘net’ is on average always negative seen from the perspective of the surface. There is radiative LOSS.
So, the surface on average gains 168 W/m^2 of internal energy by positive radiative heat transfer from the Sun. At the same time, with our particular atmosphere, it theoretically sheds a ‘net’ radiative energy flux of 324-390, resulting in an actual loss of internal energy by way of radiation of -66 W/m^2. 168 W/m^2 in, 66 out. There is thus 102 W/m^2 missing for there to be balance. Well, the surface doesn’t lose energy through radiation only, it isn’t a black body in a vacuum, but also has large convective losses, in fact on average precisely 102 W/m^2 worth (all according to T&K97).
And we have 168 W/m^2 coming in and (-66-102=) -168 going out. Balance.
So where in this do you see the atmospheric ‘flux-specific’ restriction to cooling? Where is the 288K global mean surface temperature coming from with 168 coming in and 168 going out? The Moon’s surface has on average 298 W/m^2 coming in and 298 going out. Why, then, is the mean global surface of the Moon not a lot warmer than the Earth’s surface? Why is it rather 90K colder? It seemingly has nothing to do with the magnitude of the ‘net’ energy fluxes striking and escaping the surface …
There is no doubt that what our atmosphere is doing radiatively is depriving the surface on a daily basis of 44 % of its potential radiative energy gain from the Sun, compared to the situation of the Moon, without an atmosphere. The restriction is on the radiative warming, not on the cooling. The Earth’s surface simply cools as much and as fast as it needs to with the 168 W/m^2 coming in. The incoming heat transfer sets the target for the outgoing. Had the surface gained 100 W/m^2, it would’ve shed 100 W/m^2. Had it gained 300 W/m^2, it would’ve shed 300 W/m^2. That’s all there is to it …
Bart says, June 21, 2013 at 6:16 pm:
“There is a constant stream of energy coming in from the Sun. It must be constantly dissipated to maintain thermal equilibrium. If you inhibit that release, it will build up behind the obstacle, just like a dam inhibits the flow of water in a stream, and causes it to pool up behind the dam.”
Bart, the release isn’t inhibited. That’s the point. 168 W/m^2 comes in, (-66-102=) -168 goes out. Just what’s needed. There isn’t just radiative energy loss. There is radiative AND convective loss for the surface. Together they maintain the balance … Where do you see the flux restriction making up the radiative GH surface warming effect?
Willis 12:36pm: “The world ends up warmer if we add GHGs than if we don’t. So we say that GHGs warm the world.
Now, you seem to think that this is a horrible, terrible misuse of the english language. But since everyone knows what is meant by it, where is the misuse?
The addition of GHGs to an atmosphere without them results in more downwelling energy striking the surface. This ends up with the surface being warmer that it was without the GHGs.
Now, I and the rest of the world call such a process, where energy is added to an object and it ends up warmer as “warming”.”
The misuse is you say both GHGs warm the “world” and “the surface being warmer”.
GHGs can’t increase mean temperature of the entire world system, they can only do so to the surface from reducing the energy reaching great height. The “surface being warmer” is the correct use of language in the above context.
From richard verney on June 21, 2013 at 4:33 pm:
Mister Verney, I do know the processes involved, I do know the distinction. I also know I expect anyone with enough of a grasp on the English language to understand what I mean when I refer to a mean from a study of people who are mean, to understand what is meant by warming up by putting on a sweater.
If correct identification was really all that important for achieving understanding and knowledge, then please direct your efforts towards the correct usage of mean and average. Technically a “running mean” should have no meaning, yet it is universally recognized and understood, and used by those who are achieving understanding and knowledge.
I learned electronic circuits by visualizing the flow of positive charges from V+ to Ground (V-), as indicated by the diode and transistor arrowheads. Thus your pedantry about proper and correct identification of processes, which is the proper and correct identification of what you are engaging in, being so necessary in the pursuit of understanding and knowledge, likely impresses me less than others. Likewise for the generations who have learned chemistry by Bohr electron shell model without ever having heard of the Pauli exclusion principal.
Kristian says:
June 21, 2013 at 6:42 pm
“That’s the point. 168 W/m^2 comes in, (-66-102=) -168 goes out.”
This is precisely where you err, Kristian. Think of it this way.
What if I described a traffic flow though a tunnel to you as “20 cars per minute come in, and 20 cars per minute go out”. Can you tell me how many cars there are in that tunnel?
That is the problem. Watts is a measure of energy rate, not energy. It tells you how much energy is coming out and going in per unit of time, but it does not tell you how much energy there is.
Or, in my earlier analogy, I tell you that water is flowing into a reservoir behind a dam at 100,000 gallons per minute. Downstream from the dam, I measure the flow rate as 100,000 gallons per minute. How much water is contained in the reservoir?
If I make the dam higher, after the flow has been reestablished and we have 100,000 gal/min coming in, and 100,000 gal/min flowing out, has the water level behind the dam A) risen, B) stayed the same, or C) dropped?
Willis Eschenbach says:
June 21, 2013 at 10:18 am
Please don’t project your ignorance on the rest of us. I’ve looked at the issue of float drift and distribution in some detail here.
You discuss how some areas of the ocean are sampled more than others. An issue if you want to determine the precise average temperature of the ocean, but no one is really interested in this.
What they are interested in how much the oceans have warmed or cooled overall, and sampling some areas more than others is pretty much irrelevant to that question, especially given climate scientist’s love of gridding. Sampling some areas more than others might give you a somewhat higher or lower answer than the real answer, but you will get in the general area and with the right sign.
Drift is a completely different issue, and you confuse drift with drifts effect on gross spatial sampling. Not the same thing at all.
regards
Bart says, June 21, 2013 at 10:45 pm:
“Watts is a measure of energy rate, not energy. It tells you how much energy is coming out and going in per unit of time, but it does not tell you how much energy there is.”
I’m not the one introducing the usage of W/m^2 to describe Earth’s energy budget situation, Bart. It’s people like Trenberth and Kiehl. The entire scientific industry promoting the radiative GHE.
I’m perfectly aware that the Watt represents power, energy per second, and that W/m^2 represents power density, energy per second per square metre. You don’t have to tell me this.
The point is, the Earth system is practically a closed system constantly gaining and losing energy. There is continuous energy throughput. It gains its energy from the Sun (its hot reservoir) and it loses it to space (its cold reservoir). It is the rate of this energy gain vs. the rate of this energy loss that we’re after. If the Earth system gains energy at a faster rate that it manages to rid itself of energy, then energy will start accumulating inside the system, its internal energy content will increase and the system will thus start warming.
168 W/m^2 IN is exactly the same rate as 168 W/m^2 OUT, Bart. The rate IN isn’t faster that the rate OUT. Ergo, balance. In the longterm, the Earth system maintains this balance at the surface, at the ToA and at every layer in between. There is no room for any accumulation only looking at the energy fluxes. Flux-wise, the only way to increase the energy content of the system and thereby raise its temperature, is by increasing the INCOMING (positive) heat (168 W/m^2) or by reducing the OUTGOING (negative) heat (-168 W/m^2).
So how is the Earth system able to contain energy at all? Where does its storage of energy originally come from?
Mainly two phenomena working together:
1) The thermal mass (heat capacity) of air (atmosphere), earth (land) and particularly water (ocean),
and
2) The weight of the atmosphere upon the surface restricting the rate of energy escaping the surface through convective and evaporative means.
This originally set the necessary surface temperature (with the specific mean solar flux) enabling the surface to maintain flux balance. From this ground temperature, then, the lapse rate set the temperature profile of the troposphere.
Kristian
And how much energy per second per square metre is a black-body at 288 K radiating?
lgl says, June 22, 2013 at 2:26 am:
“And how much energy per second per square metre is a black-body at 288 K radiating?”
Surrounded by an infinite heat sink vacuum: 390 W/m^2. Thanks for showing us how the 390 W/m^2 flux in the T&K97 diagram is calculated. It is not measured. It is derived from a formula. From measuring the actual radiative ‘heat’ going up from the surface, one can then arrive at the inferred ‘back radiation’ flux from the atmosphere: (390-66=) 324 W/m^2.
Sorry, forgot to explain how exactly the 390 W/m^2 flux is derived. You first assume that the surface of the Earth is a black body in a vacuum at 0 K. Then you measure its physical temperature. Apply the Stefan-Boltzmann equation and voilà! No upward radiative flux needs to be measured or detected in any way …
@Ian H
>>Eric H. says:
>>June 19, 2013 at 6:38 am
>Some of my own ponderings: 1) If it cannot be shown that CO2 is heating the ocean then CAGW is done as a theory.
>I’ve seen this depth of penetration argument made a numnber of times. Beware of it because it is false.
>Just think about the day night temperature cycle over the ocean. During the day SWR heats the ocean. And at night it cools back down again mostly by radiating LWR to the sky. The amount of heat that it loses at night by radiating LWR is approximately equal to the amount gained during the day by absorbing SWR – else the oceans would have boiled by now.
[Large snip]
Let’s look at this again.
You have constructed a mental picture of how LWIR pads things in a way that reduces heat loss and also which results in warmer oceans. CO2 pads thing (a little). The problem with your model of heat transfer is that you treat water on a micro scale as if it was water on a huge scale (where heat cannot get from one portion of the water to another). Conduction is not considered and the value of evaporation as a cooling factor underestimated. On a micro scale water is a pretty good conductor. On a macro scale it is not.
As Willis has previously shown, convection vertically cools horizontally through the mechanism of thunderstorms. That is, vertical atmospheric convection produces cooling at the surface even though the surface is horizontal and does not move.
IR received at the surface only promotes evaporation, 1 for 1. It is important to mention here your ‘stirring argument’. If the water got warmer from LWIR just below the surface instead of evaporating, the heat would go down by conduction, with or without stirring. Consider the time interval between energy received at the surface (there is no penetration to speak of, water is completely opaque to IR – it might as well be black paint). The surface heats immediately and evaporates water. Place wet paint out of the sun but where it can get radiant heat from a wall. While there is still paint thinners available, it gets cooler! The temperature change is related to the volatility of the thinners and the local environment and incoming power.
At night there is both convection of heat from below, and, right near the surface, conduction. Significant heat conduction in air (gases) is difficult without movement but water is far better – 22 times better in fact. One cannot model water on a micro scale as ‘needing to move’ as if the heat is ‘trapped’ in it (which with gas it is, mostly).
Heat conduction in water from http://physics.info/conduction/
Air at sea level 0.025 Watts/m●K
Water 0.561 Watts/m●K
The argument that LWIR heats water fails at the surface. The sea surface cools at night primarily by evaporation, just as in the day and the heat to do so comes from within. Even though the surface is the equivalent of black paint at IR wavelengths, evaporation is still by far the largest component. The air just above the surface is always supersaturated. If the wind blows, it carries away the water vapour. If there is atmospheric convection, there is cooling by wind.
The math favours cooling. The human body cools in the same manner. http://hyperphysics.phy-astr.gsu.edu/hbase/thermo/sweat.html
The radiative cooling of a human (which is much warmer than the ocean surface) is minor compared with the evaporative cooling from sweat which can reach 2.4 kW. Pointing a small heater at a human increases their evaporative cooling rate. Stepping into the sunlight causes the same effect though somewhat complicated by the short wave heating which we are not considering because we are looking at night time warming.
If one ran a series of very thin pipes just under the surface of the ocean and pumped heated liquid through them, the result would be more evaporation. Even very high power, like an electric kettle with the coil at the top, would promote to a vast degree, evaporation. Stirring such a kettle would indeed cause the water to be heated, but these conditions are worlds away from an ocean receiving an additional Watt per sq m at its skin.
One Watt additional heating at the surface would evaporate an additional 36g per 24 hours. If all that heat were to be stirred into the top metre of ocean, it would raise the temperature 0.02 degrees and the next day, being slightly warmer, evaporation would increase by 36 g. In fact it is not stirred in. It never gets that far.
In conclusion, the idea that LWIR heats bodies of water is groundless, given the conditions we have on planet Earth.
Kristian
So it’s just a strike of luck the measurements here are in perfect agreement with the S-B equation? http://scienceofdoom.com/2010/07/31/the-amazing-case-of-back-radiation-part-three/
What about all the measurements of DLR. Are they just made up too? http://scienceofdoom.com/2010/07/24/the-amazing-case-of-back-radiation-part-two/
… and Kristian
who has ever measured the “actual radiative ‘heat’ going up from the surface” and how?
Egads, how many times does one need to explain this?! The ‘heat flux’ is what’s measured/detected. Its value is then used as input to derive a theoretical ‘individual’ flux, like the DLR. The individual radiative energy fluxes are simply calculated, derived from this measured heat flux and the temperature of the measuring instrument. Of course these flux values will match the S-B equation. They’re arrived at using (a modified version of) the S-B equation:
http://en.wikipedia.org/wiki/Pyrgeometer#Measurement_of_long_wave_downward_radiation
http://tallbloke.wordpress.com/2013/04/26/pyrgeometers-untangled/
Kristian
So it’s the S-B law you are rejecting? Experiments show it works. http://www.phywe.com/index.php/fuseaction/download/lrn_file/versuchsanleitungen/P2350101/e/P2350101.pdf
Here down to 672 K. At which temperature is it not valid any more?
Kristian says:
June 22, 2013 at 1:56 am
“It is the rate of this energy gain vs. the rate of this energy loss that we’re after.
No, we are interested in how much energy is stored on the Earth. The average temperature on the Earth is related to how much energy is stored.
“168 W/m^2 IN is exactly the same rate as 168 W/m^2 OUT, Bart. The rate IN isn’t faster that the rate OUT. Ergo, balance.”
The evidence indicates, to the best of our knowledge, that there is, in fact, a slight imbalance between these two. The Earth appears to have been warming steadily, overlaid with a cyclical variation acting over a period of approximately 60 years, with some other lesser variations, since accurate temperature records began to be kept.
I agree that there is little indication that this behavior is due to CO2 accumulating in the atmosphere. To add further opprobrium to the proponents of AGW, it is evident that humans have little effect on atmospheric CO2 levels in the first place.
But, I believe the jury is still out as to whether the lack of correlation of CO2 with global temperatures is because of a fundamental misunderstanding of greenhouse dynamics, or a neglect of countervailing negative feedbacks.
And, that has not been the point of my discussion with you. The point has been that you have phrased your diatribes, tinged with a bit of what comes across as hysterical ranting, in terms which indicate that you do not understand the basic greenhouse argument, and you cannot effectively argue against something you do not understand. In particular, this weird division of radiational energy flows into “heat” and “non-heat” immediately pigeonholes you as someone who does not understand the problem, and you will fail to gain traction every time you advance it.
Radiational energy is radiational energy. There is no division into heat and non-heat. Radiational energy gets stored as heat when it is absorbed by materials. Because there is so much water on the planet and in our bodies, and water absorbs infrared wavelength radiation preferentially, we feel heat from IR more than from other bands. But, that does not make radiation in other bands inconsequential, as there are plenty of other materials on the Earth which absorb them.
David Riser wrote:
Ximinyr were just going to have to agree to disagree. I get what your saying but your not getting what Willis is saying. I am decent at math.
No, I don’t agree to this, and you’re not decent at math.
The example OHC(Y)=kY is an explicit example of a warming ocean where Willis’s method says it is not warming.
That falsifies his methodology.
It’s a simple as that.
Q.E.D.
Bart says:
Would you agree that a zero mean in “forcing” does mean a zero trend in OHC(t)?
Willis didn’t find a zero mean forcing.
He found a positive mean forcing, with a certain standard deviation.
It’s still positive.
It’s like you’re at a casino with a die that rolls 3.1 +/- 2.
Would you bet that that die, over the long term, is going to average out to 3?
Of course you would not.
It’s exactly the same here.
And the example OHC(Y)=kY, which is independent of any considerations of statistics, whos that Willis’s methodology is wrong and hence his conclusion is false.
It’s clear, though I know he wants to pretend otherwise.
Willis wrote:
In the real situation, the ocean heat content doesn’t rise regularly like in your imaginary condition.
So all you have shown is that if you assume that the OHC is rising monotonically, then my procedure gives a monotonic trend …
False.
Please, Willis — I assume you know basic algebra.
My example is of a world where the ocean is definitely warming.
You seem to understand that much.
Yet “your procedure” finds a trend of zero (0) for the term you call “forcing.”
Right?
The trend of forcing is zero?
Right.
So then, what use is your “forcing” if it’s trend fails to diagnose an obviously warming ocean?
Ximinyr says:
June 22, 2013 at 2:34 pm
“Willis didn’t find a zero mean forcing.”
Which parts of “…how small the average value of the forcing actually is…”, “…neither the average forcing, nor the trend in that forcing, are significantly different from zero…”, or “…in addition to the mean not being significantly different from zero…” did you not understand?
The forcings look ENSO ish; when ENSO3.4 is less than -0.5, 12 out of 14 of the forcing are positive (two are zero and two are slightly negative).
The positive nino34’s explain nothing (the r2 for the overall forcing:nino is only 0.1) however the state of Nino the year before/ the violence of the change seems important.
eg The negative relationship between nino34 and forcing is reduced if both this years and last years nino are postive – r2 about 42%
One can do a bit better if the annual change in Nino34 is included.
If the annual change in ocean energy content/forcing is dependent on Nino34 then the ocean heat content itself should be an accumulation of the Nino3.4 effect ??
Bart:
Willis did not find a zero forcing.
He found, in effect, a die that rolls on average 3.7, with a standard deviation of 0.3.
Would you ever place a bet on such a die? Of course not.
And I notice you, like Willis, continue to ignore the case of OHC(Y)=kY, which demonstrates his methodology completely fails in just the simpliest case.
How much longer will you, he, and David Riser ignore this?
Ximinyr says:
June 22, 2013 at 5:05 pm
“He found, in effect, a die that rolls on average 3.7, with a standard deviation of 0.3.”
You can reasonably argue about that. Which is why it baffles me why you are instead arguing that he didn’t claim it at all, which is a complete non-starter.
“And I notice you, like Willis, continue to ignore the case of OHC(Y)=kY…”
The mean of dOHC/dt is k. If k is statistically indistinguishable from zero, then the slope of OHC is indistinguishable from zero. QED. Why are you arguing this?
Bart says:
The mean of dOHC/dt is k.
Yes!
That’s exactly what I’ve been saying all along — Willis has plotted the *derivative* of OHC(t), which he calls a “forcing.” He finds it has a near-zero trend — that is, that the 2nd derivative of OHC(t) has a near-zero trend..
Yet clearly this ocean is warming!
That indicates his methodology is completely false — his interpretation of “forcing” is just wrong.
He thinks a forcing trend of zero means the ocean is not warming.
Yet clearly it can be warming!
He thinks a forcing trend of 0 means the ocean is not warming.
But this example shows it clearly *can* be warming.
Perhaps you’re finally starting to get it??
lgl says, June 22, 2013 at 9:10 am:
“So it’s the S-B law you are rejecting?”
No. I am not rejecting the S-B law. Any other strawmen you’d like to throw in …?
Ximinyr: I don’t believe that Willis is claiming that a lack of trend in the changes of OHC means that the world is not warming. This thread is based directly on the Levitus paper which clearly shows an accumulation of heat over its period. Given that, it is still an interesting question whether or not the warming of the ocean is *accelerating*.
I think you have a point that the use of forcing by Willis is confusing – what he really is getting at is the warming of the ocean. His calculation is very simple – (he takes the total change in heat content per year as reported in Levitus and divides it by the surface area of the Earth and the number of seconds in a year) – not much to disagree with there.
It seems to me that the interesting point that should’ve been made is that there is no *observable* acceleration in the warming of the ocean even though there *should be* given that there has been an accelaration in the forcing the Earth (as per the GISS forcing numbers (see Sheet1 column F of Willis’ spreadsheet). IOW, our predictions didn’t match our observations – an accelaration in forcing was not matched (well) in a similar accelation in the change of OHC.
Cheers, 🙂
Bart says, June 22, 2013 at 10:38 am:
“No, we are interested in how much energy is stored on the Earth. The average temperature on the Earth is related to how much energy is stored.”
I agree. And yet, the GHErad proponents keep claiming they can estimate the surface temperature of the Earth by simply looking at the fluxes coming in and going out. That’s the origin of what seems to be a deliberate and concocted state of confusion. Remove the inferred 390 and 324 fluxes to replace them with the actual 66 flux going up, and the deception and circular reasoning behind this approach becomes clear as day at once. The 390 & 324 individually don’t do anything. Only the ‘net’. So they have no function, no place in that budget diagram. Except to muddy the waters. To distort people’s perception and understanding of what is actually, physically going on in the Earth system.
And it’s clearly worked. Because everyone is buying it.
How is the atmosphere helping the storage of energy on Earth to build if there is balance between incoming and outgoing energy fluxes at all times, Bart? I’m not talking about transient imbalances which will always be there in the short term (geologically), the Earth system is a highly dynamic one. I’m talking about the general picture. The mean (longterm) energy budget between incoming and outgoing. It is at balance.
So how is energy building in the Earth system by way of restricting the outgoing energy? That’s the claim of the radiative GHE hypothesis, Bart. The atmosphere apparently let’s ‘all’ energy in, but slows the release back … This is a bogus claim. You only need to look at the budget in terms of ‘heat’ fluxes to see this. And that’s my point. 235 IN, 235 OUT at the ToA. 168 IN, 168 OUT at the surface. Where is the ‘letting all in but slowing the release out’ in all this? Where do you see it? Flux-wise.
The outgoing simply follows the incoming, Bart. It’s its slave. Our atmosphere reduces the incoming flux from the Sun reaching the surface as compared to the Moon (without atmosphere) by 44 %! And the surface in turn releases back out the entire absorbed solar flux, at the same rate.
How is this ‘letting all in but slowing the release out’? In what universe? They’ve got it all turned completely on its head.
So, we need to look beyond the radiative properties of the atmosphere to explain the mean surface temperature of our planet. That’s been my point all along.
Ximinyr says:
June 22, 2013 at 7:04 pm
“That’s exactly what I’ve been saying all along…”
Good grief, Dude. Yeah, I know what you’re saying. I’ve known what you are saying. I’ve repeated it back to you several times now. It holds no water.
I have given you three instances where Willis clearly states that the mean or average, i.e., the “k” value, is indistinguishable from zero.
You keep saying “He finds it has a near-zero trend”, but that is not ALL he said. In fact, it was stated secondarily. He specifically said the mean is indistinguishable from zero, as well as the trend.
Why do you keep editing this out?
I should add to that last comment that I am talking about energy gained and lost through radiation. Not through conduction/convection and evaporation. These latter ones after all are the mechanisms holding the key.
Kristian says:
June 22, 2013 at 11:31 pm
“How is the atmosphere helping the storage of energy on Earth to build if there is balance between incoming and outgoing energy fluxes at all times, Bart?”
Who says there is a “balance between incoming and outgoing energy fluxes at all times”? On what basis do you claim a long term balance? In the past century, and in the long term trend, the global temperature average has been going up, which indicates an imbalance somewhere.
It hasn’t been going up as much as the AGW proponents expected lately, and the long term trend is not due to CO2 forcing, as it has been going on for longer than CO2 could have been a significant forcing even if they were right. But up nevertheless.
Kristian
Of course you are rejecting the S-B law when claiming the 288K earth is only emitting 66 W/m2. It does not say “in a vacuum at 0 K”.
And you are rejecting all the measured emission spectra, even to be found here at WUWT; http://wattsupwiththat.com/2011/03/10/visualizing-the-greenhouse-effect-emission-spectra/
so I’m asking again: Do you think they are just made up?
Chas
“If the annual change in ocean energy content/forcing is dependent on Nino34 then the ocean heat content itself should be an accumulation of the Nino3.4 effect ??”
Exactly, http://virakkraft.com/Radiative-imbalance-ENSO.png
lgl says, June 23, 2013 at 2:40 am:
“Of course you are rejecting the S-B law when claiming the 288K earth is only emitting 66 W/m2.”
Sigh. I do not ‘claim’ that the 288K surface of the Earth on average emits 66 W/m^2 of radiative heat, lgl. That is what it is emitting. It’s called ‘reality’, lgl. As opposed to ‘theoretical concepts’.
The S-B law works perfectly well … in the situations where it’s supposed to work. The surface of the Earth is not such a situation. It simply doesn’t apply. The convective losses of the Earth’s surface are easily large enough to throw way off the estimation of radiative loss, and the S-B result will therefore always be in error.
http://hyperphysics.phy-astr.gsu.edu/hbase/thermo/stefan.html
http://hyperphysics.phy-astr.gsu.edu/hbase/thermo/cootime.html
“And you are rejecting all the measured emission spectra (…)”
Again, no. I’m not ‘rejecting’ them at all. I’m just informing you: They are not measured. They are derived from applying radiative heat transfer equations based on assumptions on the concept of energy exchange. There is nothing inherently wrong in that. The concept works. But what’s actually measured is the ‘heat transfer’.
Kristian
So you think you can just decide the S-B law does not apply at the Earths surface. Fine, dream on and let others deal with science.
The emission spectra are indeed being measured, using FTIRs for instance, http://journals.ametsoc.org/doi/abs/10.1175/1520-0442(1995)008%3C0286%3ASLEITT%3E2.0.CO%3B2
but again, dream on.
lgl says, June 23, 2013 at 5:30 am:
Yes, lgl, you’re pretty clear evidence of the truth in the adage: Mundus vult decipi. ‘Verden vil bedras.’ Ergo decipiatur. ‘Så la den bedras.’
Pointless continuing this discussion …
Kristian says:
June 22, 2013 at 11:39 pm
Bart says:
June 22, 2013 at 11:45 pm
//////////////////////////////////
It is often claimed that pre the industrial era, CO2 levels have not changed significantly during the Holocene.
If GHGs have the ‘heat trapping’ effect claimed, how has the Earth shed the ‘heat’ that was present during the Holocene Optimum, or for that matter during the Minoan, Roaman and Medieval Warm Periods?
I have never seen anyone explain, in the light of the claimed ‘heat trapping’ properties of GHGs, how the ‘heat’ was lost, or where it went.
richard – The best basic, simplest explanation is the atm./surface interface planet wide energy balance 1st law:
energy flux density in – energy flux density out = 0
2nd law would be enforced by the ~g/Cp gradient temperature mean decline with height.
If the first balance term gets larger, the surface temperature responds – rises to make the 2nd term larger until = 0 again, the g/Cp gradient has a new starting temperature at h=0. And vice versa. Ad infinitum.
Satellites measure Teq.=255K, and thermometers measure surface mean Teq. = 288K today: h=0 starting point for g/Cp. The 33K would remain ad infinitum until input or output changes. Go back in history, project back satellites & thermometers would measure some different surface T means as planet wide infrared active gas changes, surface emissivity changes, net solar changes so the difference would not be 33K however it would still be significantly nonzero since:
There has always been water vapor and CO2 in the atmosphere.
Here are two nice sources on how FTIR spectrometers work. No one is measuring (in the sense of detecting) ‘back radiation’ from a cool atmosphere impinging on a warm surface/instrument detector anywhere:
http://en.wikipedia.org/wiki/Fourier_transform_infrared_spectroscopy
http://www.daham.org/basil/leedswww/ftir/ftir_principle.htm
“The basic components of an FTIR are shown schematically in Figure 1. The infrared source emits a broad band of different wavelength of infrared radiation. The IR source used in the Temet GASMET FTIR CR-series is a SiC ceramic at a temperature of 1550 K. The IR radiation goes through an interferometer that modulates the infrared radiation. The interferometer performs an optical inverse Fourier transform on the entering IR radiation. The modulated IR beam passes through the gas sample where it is absorbed to various extents at different wavelengths by the various molecules present. Finally the intensity of the IR beam is detected by a detector, which is a liquid-nitrogen cooled MCT (Mercury-Cadmium-Telluride) detector in the case of the Temet GASMET FTIR CR-series. The detected signal is digitised and Fourier transformed by the computer to get the IR spectrum of the sample gas.”
In other words, a hot (near BB) beam passes through the sample gas (ambient air) and ends up after partial absorption at a deeply cooled detector, from where the signal is transformed and computed into an IR spectrum for the specific air sample. From hot to warm to cold. That’s the way heat travels.
Kristian
And your point? The modulation distorts the signal and it’s a pure coincidence the result showing radiation only (almost) in the GHG bands when pointing upwards from the surface, and much more radiation in the atmospheric window relative to the GHG bands when looking downward from TOA?
Like when the analog signal of a human voice is modulated on to a high frequency carrier and sent thousands of kilometers through the air it coincidentally still sounds like a human voice after demodulation because an analog signal just can’t travel thousands of kilometers through air, right?
lgl,
What’s your point? I have never claimed any emission/absorption spectra to be incorrect or made up or imaginary. So I seriously don’t understand what you’re trying to convey here. All I’m saying is that radiation from a cooler object to a warmer isn’t and cannot be measured directly. It will have to be inferred, calculated. Only the heat flux going from hot to cold is directly observable. That’s the real, physically detectable phenomenon. That goes for pyrgeometers, that goes for spectrometers, that goes for bolometers, that goes for … all things.
Either way, this line of discourse is quite irrelevant. All you need to comprehend is what ‘heat’ is and what it entails. Get that and you’ll see at once that the postulated 390 and 324 fluxes are doing nothing but fogging up the real picture: 168 IN, (-66-102=) -168 OUT. Balance. Heat balance. That’s all you need to know. Incoming reduced from a potential 298 W/m^2 (lunar mean solar surface flux), outgoing simply compelled to equal it, nothing more, nothing less.
Kristian
Not long ago you said “We cannot physically separate and detect individual opposing flows of energy in a radiative field between objects”
Then I pointed to spectra proving your claim wrong. The opposing flows are totally different, spectra almost the inverse of each other in fact, and they are both being measured, no matter what nonsense you are making up just because you do not understand the technology. The radiation from the surface is close to a black body spectrum, the downwelling spectrum is not a black body spectrum, containing radiation mostly in the GHG bands. Note those from the arctic, almost no radiation except from the GHGs. Not only can we measure the downwelling radiation, the spectra also looks totally different in the arctic compared to the tropics. How do you explain that? Your 66 W/m2 is going out so it must look like a black body spectrum.
Now you say “I have never claimed any emission/absorption spectra to be incorrect or made up or imaginary”. Ok, then you must have come to your senses and are now accepting there is radiation coming from the GHGs to the surface, good. Then all that’s missing is for you to realize this radiation is indeed being absorbed by the surface attributing to the high temperature of the surface, which the 168 IN/OUT cannot explain.
lgl,
You’re making a fool out of yourself. It helps reading what your opponents are actually writing before trying to tear it down. You’re just making up strawmen and keep fighting those instead of addressing what I’m teling you.
YOU ALWAYS MEASURE THE HEAT FLUX. YOU NEVER MEASURE THE INDIVIDUAL FLUXES IN AN INFERRED ENERGY EXCHANGE. YOU CALCULATE THEM. (Or how do you imagine we physically separate them from each other? Why do you think that pyrgeometers have to go the long way around first detecting the heat flux coming in to or going out from the thermopile and then taking into account the temperature of the apparatus and its state of calibration before applying different formulas with this as input to obtain the DLR flux from that? Why do you think that is, if the DLR is so easy to just measure directly? Same with bolometers. If you read how they actually function, you will see that the priciple is exactly the same.)
If you cool the detector to a temperature below that of the atmosphere, then of course you will register incident radiation from above. But it is still ‘the heat flux’ coming in, not the individual ‘back radiation’ flux from the atmosphere to the surface. It’s still ‘the net’.
Get a grip, man.
Kristian
Why didn’t you take a look at Fig. 8.2 from Petty here, http://wattsupwiththat.com/2011/03/10/visualizing-the-greenhouse-effect-emission-spectra/
Then you would have seen they are obviously measuring the individual fluxes and not the net.
richard verney says:
June 21, 2013 at 2:09 am
If something slows the rate of cooling, say it slows the rate of cooling. Say it would be even cooler but for X. Don’t say X warms, when X does not and merely slows the rate of cooling.
Sometimes it does both Richard, the rate of cooling at the ToA is slowed, therefore the surface warms!
Here’s an example, you have a surface which absorbs solar radiation at 240 W/m^2, it has an emissivity close to 1 in the IR so in equilibrium it is at a T of ~255 K and emits ~240 W/m^2.
Now place a dichroic mirror above the surface which passes 100% of solar but reflects 50% of IR. The immediate effect is to reduce the amount of cooling of the system to 120 W/m^2 and to increase the flux to the surface to 360 W/m^2. The surface will warm until 240 W/m^2 is emitted from the system and equilibrium is restored, that will be achieved when the surface is emitting 480 W/m^2 and its temperature has reached ~304 K.
Everything done in vacuum.