This morning I found two emails in my inbox about an alarmist blog post that claims Big Jump in Ocean Warming, in response to the NODC’s recent quarterly update of their Ocean Heat Content data. (Thanks, Anthony and Marc.) The alarmist blogger, David Appell, is a self-described freelance science journalist. Some might think he’s an author of science fiction after reading the opening to his post (my boldface):
Ocean heat content numbers are in for the first three months of 2013, and they show the 0-2000 meter layer increasing more than in any previous observed period…
First we have to assume David Appell is discussing the ARGO-era data, because the NODC presents the ocean heat content data for 0-2000 meters prior to the ARGO era only in pentadal form—as a result, it shows no quarterly wiggles due to the smoothing. Once we agree on that, then David Appell appears to have difficulty reading time-series graphs, or he purposely overlooked the sharp rise in the 0-2000 meter data near the beginning of the ARGO era.
Note: If the subject of ocean heat content data is new to you, refer to the post Is Ocean Heat Content All It’s Stacked Up to Be? It’s a long post, but it contains a lot of information about the problems with the ocean heat content data.
LET’S PUT THE OCEAN HEAT CONTENT DATA IN PERSPECTIVE FIRST
We’ll first look at the global ocean heat content data in terms of the average temperature anomalies of the global oceans for two depth ranges, just to keep things in perspective. We’ll start with the quarterly data for the period beginning in 2005 for both depths—recall that the NODC only provides 0-2000 meter data here on a quarterly basis starting in 2005.
For the depths of 0-700 and 0-2000 meters, the NODC identified the relationships between their ocean heat content data in terms of Joules and deg C in the abstract of their recent Levitus et al (2012) paper. There they note for 0-2000 meters:
The heat content of the World Ocean for the 0–2000 m layer increased by 24.0 +/- 1.9 x 10^22 J (+/-2S.E.) corresponding to a rate of 0.39Wm^2 (per unit area of the WorldOcean) and a volume mean warming of 0.09 deg C.
And for depths of 0-700 meters, Levitus et al (2012) write:
The heat content of the World Ocean for the 0–700 m layer increased by 16.7 +/- 1.6 x 10^22 J corresponding to a rate of 0.27 W m^2 (per unit area of the World Ocean) and a volume mean warming of 0.18 deg C.
With those relationships roughly established, the first graph, Figure 1, presents the quarterly changes in average temperature anomalies of the global oceans to depths of 0-700 and 0-2000 meters, where the change is presented as the value for a given quarter minus the value of the previous quarter. The most recent change in the average temperature of the global oceans at 0-700 meters is comparable to two other quarters and has been exceeded by a change in 2011. For the depth of 0-2000 meters, the quarterly change in the last quarter of 2005 was slightly more than the recent change.

Figure 1
Now, examine Figure 1 again, please. Note how small the changes are from quarter to quarter. For depths of 0-2000 meters, the changes are about +/- 0.01 deg C (that’s one one-hundredth of a deg C), and for 0-700 meters the changes are on the order of +/- 0.015 deg C (and that’s fifteen one-thousandths of a deg C). Does anyone really think that 3300 ARGO floats, which constantly require corrections, are able the determine the temperature changes of the global oceans to that accuracy—to depths of 700 meters (about 2300 feet) and 2000 meters (about 6550 feet or about 1.25 miles)?
If we look at the time-series graph of the average temperature of the global oceans for the depths of 0-700 and 0-2000 meters, Figure 2, we can see that the rates of warming (based on the linear trends) are comparable. That is, the data for 0-700 and 0-2000 meters both show the global oceans warming at rates of about 0.03 deg C/decade.

Figure 2
OF COURSE THE RELATIONSHIP CHANGES WHEN WE EXPRESS THE DATA IN TERMS OF 10^22 JOULES
The ARGO-era ocean heat content data for both depths are presented in the standard form of 10^22 Joules in Figure 3. While the temperature changes for both depths are similar, Figure 2, the 0-2000 meter data has a higher ocean heat content trend because it includes a larger volume of water, Figure 3.

Figure 3
Also in Figure 3, we can see that there is nothing unusual about the latest quarterly increase in ocean heat content. And if you’re having trouble comparing the quarterly wiggles, Figure 4 presents the quarterly changes in ocean heat content for the depths of 0-700 and 0-2000 meters. So David Appell is wrong with his statement that the ocean heat content data for first 3 months of 2013 “show the 0-2000 meter layer increasing more than in any previous observed period.”

Figure 4
NORTH ATLANTIC AND NORTH PACIFIC STILL SHOW LITTLE TO NO WARMING DURING ARGO ERA
Using annual data, we recently examined the North Atlantic and North Pacific data for both depths in the post Ocean Heat Content (0 to 2000 Meters) – Why Aren’t Northern Hemisphere Oceans Warming During the ARGO Era?
Presenting the data in quarterly format and including the data for the first quarter of 2013, doesn’t significantly alter the results of that post. The North Atlantic continues to show very little warming for depths of 0-2000 meters, Figure 5, and cooling at depths of 0-700 meters.
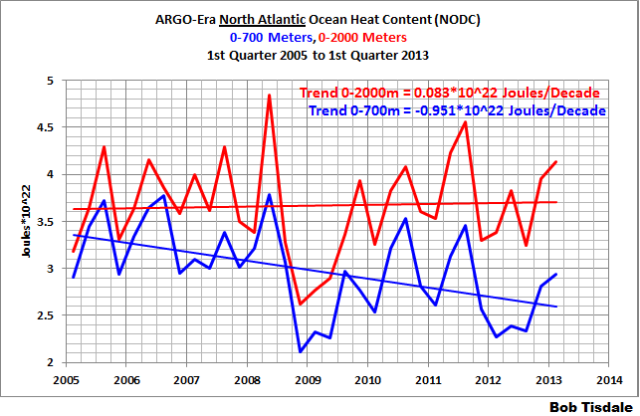
Figure 5
For the North Pacific, Figure 6 presents the ocean heat content data for both depths. Both show cooling, with the 0-2000 meter data cooling at a lesser rate than the 0-700 meter data.

Figure 6
We’ll check back in another quarter to see if there have been any drastic changes in those trends and to discuss if there are any peer-reviewed papers based on climate model simulations that explain the recent flattening and cooling of the ocean heat content data in the North Atlantic and North Pacific. So far, I haven’t run across any papers, and when I’m talking of climate model-based papers, I’m thinking of the climate models in the CMIP5 archive that are used to hindcast and project global climate—not one-off ensembles of simulations designed for a specific purpose.
ALSO NOT EXPLAINED BY THE CLIMATE SCIENCE COMMUNITY
We’re going to switch to the KNMI Climate Explorer as the source of data for the following discussions of ocean heat content for the depths of 0-700 meters.
The ocean heat content data for the tropical Pacific (24S-24N, 120E-80W) and the extratropical North Pacific (24N-65N, 120E-80W) warmed in very specific ways. Both subsets of the global oceans show multidecadal periods of cooling interspersed with sudden warmings that are tied to natural phenomena—both subsets indicate that without those natural phenomena those two significant portions of the global oceans would cool since 1955. And there’s also another curiosity when you combine those two subsets.
So far, the climate science community has never presented (or I have never found) a climate model-based peer-reviewed study that explains why ocean heat content in the tropical Pacific (24S-24N, 120E-80W) cools for the multidecadal period between the La Niña events of 1954-57 and 1973-76 and cools for the multidecadal period between the La Niña events of 1973-76 and 1995/96. See Figure 7. And they’ve never explained how and why the long-term warming of the ocean heat content data for the tropical Pacific is dependent on the three 3-year La Niña events of 1954-57, 1973-76 and 1998-01 and on the freakish La Niña of 1995/96. It’s plainly obvious that the ocean heat content of the tropical Pacific would cool over the long-term without the 1973-76 and 1995/96 La Niña events. And it’s very tough to claim manmade greenhouse gases are responsible for the warming while the oceans are cooling for multidecadal periods.

Figure 7
Note: The periods in red shown in Figure 7 are the official months of the 1954-57, 1973-76, 1995/96 and 1998-01 La Niñas as presented in NOAA’s Ocean NINO Index. Also keep in mind that the installation of NOAA’s Tropical Atmosphere-Ocean (TAO) Project floats was completed in the early 1990s, so there’s been continuous coverage of subsurface temperatures in the tropical Pacific since then—but before the TOA project floats, the sampling was sparse, very sparse. I continue to find it quite remarkable that we can even find the impacts of the 3-year La Niña events, and the dip associated with the 1982/83 El Niño, in the data for the period before the installation of those floats, especially when we consider how sparse and random the sampling was before the TAO project buoys.
Figure 7 portrays the recharge-discharge oscillator function of La Niña and El Niño events, with the highlighted La Niñas acting as the recharge mode and with El Niños in the discharge mode. It’s unlikely that climate modelers will, anytime soon, be able to explain the naturally caused warming of the tropical Pacific because climate models still cannot simulate El Niño and La Niña processes…even after decades of modeling efforts. Refer to Guilyardi et al (2009)—presented in the post here—for further information.
The ocean heat content data for the extratropical North Pacific (24N-65N, 120E-80W) is presented in Figure 8. It shows long-term cooling, not warming, until 1988. Again, it’s very difficult to claim manmade greenhouse gases are responsible for the warming when the oceans are cooling for multidecadal periods. After that cooling period, there’s a sudden upward shift in ocean heat content in the extratropical North Pacific. I’ve highlighted the 24-month period of January 1989 to December 1990 in red to help illustrate the shift. There was a decade-long cooling followed by a gradual warming after the shift. But it’s blatantly obvious that without that 2-year shift, there would be a long-term cooling in the extratropical North Pacific.

Figure 8
The late-1980s/early-1990s shift is also present in the sea surface temperature and sea level pressure data of the extratropical North Pacific. I discussed that in the post Ocean Heat Content (0 to 2000 Meters) – Why Aren’t Northern Hemisphere Oceans Warming During the ARGO Era? There I noted: Almost 2 decades ago Kevin Trenberth discussed the same wind pattern-based upward shift in the sea level pressure of the extratropical North Pacific. Refer to Trenberth and Hurrell (1995) Decadal coupled atmosphere-ocean variations in the North Pacific Ocean. See their Figure 6, which shows the sea level pressure of a portion of the extratropical North Pacific. One would think Trenberth should also know that same shift exists in extratropical North Pacific sea surface temperature and ocean heat content data.
Earlier under this heading, I noted that there was a curious effect when the tropical Pacific and extratropical Pacific ocean heat content data are combined. Individually, both show long-term periods of cooling followed by short-term bursts of natural warming, but the variations in the two datasets do not coincide. When they are combined, Figure 9, they present a more gradual long-term warming that is mimicked by the global ocean heat content data.

Figure 9
And of course, the climate science community and other proponents of hypothetical human-induced global warming would like you to believe that the warming of global ocean heat content could only be caused by the increases in manmade greenhouse gases, primarily carbon dioxide.
THE NATURAL WARMING OF THE GLOBAL OCEANS
For more than 4 years, I’ve illustrated and discussed how ocean heat content data and satellite-era sea surface temperature data show no evidence of having been warmed by manmade greenhouse gases—that is, while the oceans have warmed, the data indicates they warmed naturally. If the natural warming of the global oceans is new to you, refer to my illustrated essay “The Manmade Global Warming Challenge” [42MB]. And if you’re looking for a much more-detailed discussion of the natural warming of the global oceans, refer to my book Who Turned in the Heat? It was introduced in the post “Everything You Ever Wanted to Know About El Niño and La Niña”. It’s for sale in pdf form for only US$8.00.
CLOSING
The warming of the metric most commonly used to present global warming, surface temperatures, has stalled. Alarmists are looking for another medium to present continued warming. And logically they’ve elected to present the problematic and much-modified ocean heat content data—without discussing its problems or the adjustments made to it. And sometimes, in their desperation, alarmist bloggers make erroneous claims. So, what else is new?
I presented two quotes by climate researchers in my post Is Ocean Heat Content All It’s Stacked Up to Be? There I quoted Raymond Schmitt of the Woods Hole Oceanographic Institution and Kevin Trenberth of the National Center for Atmospheric Research (NCAR). I’ll close with portions of those quotes again:
With ocean heat content data before the ARGO era, the measurements are so sparse we are unable “to observe the motions of thermal anomalies in the mid- and high latitude oceans” [Raymond Schmitt], and since the introduction of the ARGO floats, there are “issues of missing and erroneous data and calibration” [Kevin Trenberth]. Phrased other ways: ocean heat content is not a reliable dataset—and—it’s not a dataset in which we should have confidence.
Another excellent analysis. Between Bob and Willis, real science is being done here. It is quite a contrast to the mainstrem junk science that tries to explain away the planet’s deconstruction of the catastrophic AGW conjecture.
Clearly the oceans have been warming since the end of the last ice age. What was their approximate absolute temperature then? I would think it would have been pretty close to the temperature at which sea water freezes. And what is the absolute temperature of the oceans now? From these two numbers we ought to be able to get the average warming of the ocean over a long period.
But really, I’ve got doubts that it’s possible to measure the temperature of the oceans this accurately.
I have tried reasoning with David Appell. Nothing came of it. He claims to have an advanced degree in physics but in my estimation he was not paying attention even in his high school physics classes.
Agreed about David!
Thanks
JK
Help me out here- seriously. Not being facetious.
Can someone explain to me in layman’s terms why some AGW scientists seem to think that heat is moving to (hiding in?) the deep oceans when it wasn’t, say, 15-20 years ago?
I really don’t understand this. What is the mechanism? What has supposedly changed?
Eustace Cranch says:
May 26, 2013 at 7:37 pm
Help me out here- seriously. Not being facetious.
Can someone explain to me in layman’s terms why some AGW scientists seem to think that heat is moving to (hiding in?) the deep oceans when it wasn’t, say, 15-20 years ago?
I really don’t understand this. What is the mechanism? What has supposedly changed?
————————-
darn good questions. I don’t think you’d get a ‘consensus’ answer on this from mainstream climate scientists. I don’t think any of them know, but individually they might come up with various theories to explain your question.
See, but there’s no need in their eyes for a consensus answer on this question. It’s an explanation that keeps the fairy tale alive for a little while longer… I think that’s all they’re shooting for at this point.
A question from an idiot passerby looking at your bare graphs without context:
Your Figure 3, 0-2000m, going by the slope line, at the start of 2005 there was 10.5*10^22 Joules Global Heat Content. By the start of 2013 it was up to 16.75*10^22 Joules, a 60% increase.
The global oceans have 60% more energy in just eight years! Soon they’ll boil, we’re all going to die!
Is that what it’s supposed to show?
“…Some might think he’s an author of science fiction after reading the opening to his post…”
He IS an author of science fiction – and probably the only “climate scientist” that’s attended the prerequisite Graduate Program in Creative Writing needed to get his BS degree.
“The warming of the metric most commonly used to present global warming, surface temperatures, has stalled. Alarmists are looking for another medium to present continued warming. ”
——————————————–
If the climate alarmists are choosing to use ocean heat content to create alarm, they are doomed to fail in the court of public opinion. This blog is not a representative cross-section of society – it is, in general, visited by those of well above average scientific & mathematical skills & by & large, get the content of this post.
On the other hand, the general public has absolutely no concept of thermodynamics, heat capacity of water vs air, what a joule or a W/m^2 is … and there is little hope the climate alarmists can help them understand …. not to mention the potential data quality illustrated in this posted.
The subject of ocean heat content is so completely over the head of the collective public, there is no way it can ever be leveraged to create significant alarm.
Just one more sign that it’s game over for climate alarmists.
Eustace Cranch says:
May 26, 2013 at 7:37 pm
Can someone explain to me in layman’s terms why some AGW scientists seem to think that heat is moving to (hiding in?) the deep oceans when it wasn’t, say, 15-20 years ago?
————————————-
Simple – because alarmism has never been about science – it’s been about politics & politics doesn’t have to be constrained by pesky laws of physics, thermodynamics, chemistry, etc. So, when the surface temps aren’t cooperating with the political narrative, it’s time to try finding something that might … let’s try ocean heat content.
I am confused by Table 1. The complete y axis goes from -0.02 C to 0.025 C or a change of 0.045 C. Then how can the 0-2000 m go up by 0.09 C and the 0-700 m by 0.18 C?
You can’t really even measure those differences in a physics lab in an esteemed college. My question is twofold. What type of data management is done? First off, do they derived a new function from a plot graph of all 3300 ARGO data points? What is their R^2? Linear? Polynomial? or are the using a exponential equations (my personal belief is that the real problem with climate science is the liberal application of exploding functions). The second question I have is why isn’t a 3 month moving average applied to figure one? Wouldn’t that be a better extrapolation? I see a big problem with presenting the natural jerks in mean temperature corrections when earth’s cycle are measure in 10’s of thousands years. A real presentation for data like this is this: We really don’t know if this is of any significance because the span of time presented here represents the MINUTEST of fractions when compared to the history of an earth with oceans present. We would need about 10000 years of continuous data and that would have to be presented with a 100 year moving average. People really just don’t understand earth dynamics and the processes of the earth, as well as planetary evolution. This planet will likely support life for the next billion years or so, and probably without humans if the intelligence of the “climate scientists” are any inkling of our societies collective IQ. Think about this. What is the entropy of an spherical shell 50 miles thick about our earth (atmosphere, oceans, some crust)? What is the entropy of all human creation? I thought so.
“Now, examine Figure 1 again, please. Note how small the changes are from quarter to quarter. For depths of 0-2000 meters, the changes are about +/- 0.01 deg C (that’s one one-hundredth of a deg C), and for 0-700 meters the changes are on the order of +/- 0.015 deg C (and that’s fifteen one-thousandths of a deg C). Does anyone really think that 3300 ARGO floats, which constantly require corrections, are able the determine the temperature changes of the global oceans to that accuracy—to depths of 700 meters (about 2300 feet) and 2000 meters (about 6550 feet or about 1.25 miles)?”
So the oceans continue to warm.
In the first graph, isn’t the trend of 700-2000(blue) 8.0E22/decade and of 0-700 (red) 3.7E22/decade, for a deep to shallow warming ratio of about 2.2?
Which is shown visually as if there were two separate layers, but of course the ocean is a continuous series (outside of the thermoclines, okay).
If the data were showing a series of smaller intervals, approaching a continuous depth series would it instead show a warm, deep layer rising then a shallow layer that was were cooling at 50% of the warming rate, the heat going into the atmosphere?
Or is the energy content of the oceans – a calculation, not an observation – showing a computational or depth-change process of which we are not aware? I can’t imagine a temperature drop in water through compression, as gases heat through compression … but in a non-compressible liquid …. does molecular vibration slow down (cool) under higher compressive forces?
Doesn’t seem reasonable.
How about the water coming to the surface today is the water that dropped down 800 years ago, when the MWP was in play? Density, not temperature, causes water to sink, after all.
What age is the rising water?
Scribblings based on Figure 1:
0-700m: 9.28*10^23 Joules = 1°C
0-2000m: 2.67*10^24 Joules = 1°C
2.67*10^24 / 9.28*10^23 = 2.88
Volume 0-2000m is 2.88x volume 0-700m
2000/700 = 2.86
Looks like the conversions based on Levitus et al (2012) yield more volume 0-2000m than simple extrapolation from the volume of a straight-walled cylinder 700m in height. However the calculations did involve some rounding-ups on the conversions, the multiplier numbers could be the same.
So it looks like Levitus et al (2012) is saying there’s the same volume per meter depth from 0-700m as 0-2000m. All the world’s oceans added together, are effectively a straight-walled cylinder from the top to 2000m down, no tapering.
Does that match the physical reality? For the first 2000m of ocean, basically you step off the land and drop straight down?
David Appell provides his insights to the magazine SciAm. I’ve read several and will suggest he has honed his “science fiction” writing skills therein. Whatever his day job is, he shouldn’t abandon it for either science or fiction.
Is it the same Dvid Appell that wrote “W[h]ither Global Warming? Has It Slowed Down?” for the the YALE forum on CLIMATE CHANGE & THE MEDIA.
Most interesting was the report that Trenberth is arguing “the oceans lost heat during the 1990s, at a rate of about -0.26 Watts per square meter”, when NOAA’s Levitus models shows the 1990’s with steep rising OHC.
“Giving support to their finding is a forthcoming “reanalysis” by Magdalena Balmaseda and Erland Källén of the European Centre for Medium Range Weather Forecasts in the U.K., and Trenberth. Their research, by combining several sources of data with climate models, finds a sharp increase in ocean heating over the past decade, beginning shortly after the 1997-98 El Niño. “In the last
decade, about 30 percent of the warming has occurred below 700 m, contributing significantly to an acceleration of the warming trend.”
In fact, their reanalysis finds that the total of all oceans actually lost heat during the 1990s, at a rate of about -0.26 Watts per square meter of ocean surface area. By contrast, the ocean gained about 1.19 Watts per square meter in the first decade of the 21st century, most in the top 700 meters. That gain, Trenberth says, is associated “with changes in the winds and changes in the ocean currents that are associated with a particular PDO pattern that has dominated in the 2000s.”
Does anyone have access to their paper? “Distinctive climate signals in reanalysis of global ocean heat content”
Appell again? Author of some of the most opinionated arrant nonsense the modern world has ever seen? That David Appell?
Over what lateral distance does an ARGO buoy move during a 3 month period?
If we were to measure ocean temperature (say SST, 10m 50m 100m and thereafter every 100m right down to 2000m) say in 10 equidistance locations between the extremes of the lateral distance referred to above, what temperature differences would be obtained?
I would be very surprised if temperature measurements taken at each of those locations was the same to within one hundredth of a degree.
There are only 3300 ARGO buoys covering the vast volumes of the oceans. These buoys are free drifting and are never measuring temperature at the same location twice. They are never making like for like measurements and the idea that one can measure real temperature changes to 100th of a degree is fanciful.
We do not know whether these temperature changes are simply a facet of taking a temperaturement in a different location, especially given the short period of data available.
Indeed, we do not know whether drifting causes a temperature bias. The buoys inevitably drift with currents. Currents are facets of temperature differentials. Since the buoys drift with currents there is every reason to suspect that some temperature bias (whether this be a cooler or warming bias) will creep into the measurements obtained. A study would need to be carried out to see whether this is happening.
The bottom line is that as is so typical in climate science, there has been no proper assessment of the margin of errors and no realistic error bars are presented accompanying this data which would help keep it in its proper perspective.
Kadaka comments – ‘Your Figure 3, 0-2000m, going by the slope line, at the start of 2005 there was 10.5*10^22 Joules Global Heat Content. By the start of 2013 it was up to 16.75*10^22 Joules, a 60% increase.’
Has anyone got an answer to this?
Averages, averages, averages. This is the bain of climate science.
Where is the detail? Without detail, one cannot possibly begin to understand what is going on, and why.
Bob is right to point out the North Pacific and north Atlantic. Each ocean should be examined individually, and the data with respect to each ocean presented. Since the oceans are so large, they should be further sub-divided at least into North, South, East,West and central.
It would also be a good idea to look at the data broken down into 100m sections.
Is each ocean warming at the same rate, if not why not? Obviously, each ocean receives differing amounts of solar, has different current circulation patterns etc. We need to identify what is causing the warming and how it is being brought about.
If we were to subdivide the data not simply into 0-700m and 0-2000m, but instead to parcel it in 100m bands, and look for changes within each band that may tell us something of interest.
Doug Proctor speculates (May 26, 2013 at 9:11 pm) that it may be warmer water from the MWP re-surfacing. If we were to analysis the data in discreet bands we may be able to answer whether it is warm water coming up from depth rather than the descent of warmer water from above. Perhaps there is even something to do with more undersea volcanic activity. But we will not be able to answer such questions whilst the detail is hidden within the average.
As in most things in life, the devil is in the detail. We need to get away from average data and start examining the detail.
Obviously warmists will switch their focus onto whatever is moving upward at any given point in time. I fully expect the BBC to follow – they always do. They have tools to use in their chest which include ocean ‘acidification’ (actually less alkaline). Thus when things are slow on the warming surface front, they can switch over to something that is ‘positive’. Expect ocean heat content to figure high on arguments.
Big Jump in Ocean Warming, .
As soon as I saw this, this weekend, I cried cheats or idiots. How the hell does a mass of water suddenly jump in heat content ?
Thank you, Bob.
Your last paragraph says it all.
“Hay Festival 2013: global warming is ‘fairly flat’, admits Lord Stern”
http://www.telegraph.co.uk/culture/hay-festival/10081250/Hay-Festival-2013-global-warming-is-fairly-flat-admits-Lord-Stern.html
“He said the reasons were because of quieter solar activity, aerosol pollution in certain parts of the world blocking sunshine and heat being absorbed by the deep oceans.”
“mwhite says:
May 27, 2013 at 1:48 am”
Lord Stern, a major contributor to climate change policy in the UK in 2006 too. He’s is also out in his “global warming has been fairly flat for a decade” claim by at least 7 years making the “fairly flat” period closing nearer to TWO decades.
“richard verney says:
May 27, 2013 at 1:00 am
Averages, averages, averages. This is the bain of climate science.”
I could not agree more. But it extends further to weather/climate reports in the MSM where actual daily measured temperatures are compared to an average (I presume a monthly average, but I don’t really know). It’s simply a mindless, completely misleading and useless process.
Steven says: “What type of data management is done?”
For that answer you’ll have to refer to the series of papers and webpages about the NODC ocean heat content dataset by Levitus et al and others. The reason I’m providing the series is, they tend to refer to the earlier papers in the newer ones. Working backwards in time:
http://data.nodc.noaa.gov/woa/PUBLICATIONS/grlheat12.pdf
And:
ftp://ftp.nodc.noaa.gov/pub/data.nodc/woa/DATA_ANALYSIS/3M_HEAT_CONTENT/PDF/heat_content_differences.pdf
And:
ftp://ftp.nodc.noaa.gov/pub/data.nodc/woa/PUBLICATIONS/grlheat08.pdf
And:
ftp://ftp.nodc.noaa.gov/pub/data.nodc/woa/PUBLICATIONS/grlheat05.pdf
And:
ftp://ftp.nodc.noaa.gov/pub/data.nodc/woa/PUBLICATIONS/ijc_manuscript.pdf
And:
ftp://ftp.nodc.noaa.gov/pub/data.nodc/woa/PUBLICATIONS/nesdis40.pdf
Others can be found here:
http://www.nodc.noaa.gov/OC5/indpub.html#pub2013
Steven says: “The second question I have is why isn’t a 3 month moving average applied to figure one?”
Figures 1 to 6 present quarterly data, not monthly data, so I can’t smooth it with a 3-month filter, unless I change it to a monthly format. And I don’t want to do that because the intent of Figure 1 is to show the change in the quarterly data so that we can easily see that the most recent change is not unusual.
At the KNMI Climate Explorer, they take the quarterly data and present in on a monthly basis. That is, for example, the value of the 1st quarter 2012 data is listed in January, February and March; and the value of 2nd quarter 2012 data is listed in April, May and June; and so on. If you plot the monthly data as is, it presents itself as a series of 3-months steps, which looks funky, so I smoothed it with a 3-month filter in Figures 6 through 9.
The Bishop Hil blog is carrying a story that in the UK Parliamentnt, the UK Government has now confirmed that the Met Office essentially acknowledges that the warming since 1850 using Met Office data is not statistically significant.
See: .http://bishophill.squarespace.com/blog/2013/5/27/met-office-admits-claims-of-significant-temperature-rise-unt.html
Quite a significant concession!
Incidentally, the Max Planck Institute has also recently pulled back on the certainties surrounding projected warming, and of course, the Germans are pulling back from their green energy production and are building coal powered generators and are pushing Europe to embrace shale gas exploration.
Times may be changing. Or perhaps that is just wishful thinking.
sceptical says: “So the oceans continue to warm.”
According to the much-modified NODC data, yes. However, the unadjusted data represented by the UKMO EN3 data shows cooling for depths of 0-750 meters through March 2012:
http://bobtisdale.files.wordpress.com/2013/03/04-argo-era-raw-v-adjusted-ohc.png
And for depths of 0-2000 meters, the warming rate of the unadjusted data is very low:
http://bobtisdale.files.wordpress.com/2013/03/30-ukmo-ohc-0-2000m-v-models-to-750m.png
Both of those graphs are from the following post:
http://bobtisdale.wordpress.com/2013/03/11/is-ocean-heat-content-data-all-its-stacked-up-to-be/
kadaka (KD Knoebel) says: “The global oceans have 60% more energy in just eight years! Soon they’ll boil, we’re all going to die!”
The NODC presents OHC anomalies, not absolute values. I used to identify them as anomalies but the NODC argued against calling them that, saying that it was redundant. They write:
“[3] We use the term “ocean heat content” as opposed to ‘ocean heat content anomaly used by some authors because ‘ocean heat content’ is an anomaly by definition. OHC is always computed with a reference mean subtracted out from each temperature observation. Otherwise the OHC computation depends on the temperature scale used.”
See the first page of Levitus et al 2012:
http://data.nodc.noaa.gov/woa/PUBLICATIONS/grlheat12.pdf
spen says: “Has anyone got an answer to this?”
Yup, see my reply to kadaka (KD Knoebel) above. It’s not a 60% increase. We’re looking at anomalies with OHC data.
“…since the introduction of the ARGO floats, there are ‘issues of missing and erroneous data and calibration’. ”
Some elaboration would be appreciated.
Brian H says: “Appell again? Author of some of the most opinionated arrant nonsense the modern world has ever seen? That David Appell?”
Yup, that David Appell. My other encounter with him was over at Steve Goddard’s blog. Steve enjoyed my comment so much that he turned it into a post:
http://stevengoddard.wordpress.com/2013/02/01/comment-from-bob-tisdale/
BTW, I had to check to make sure it wasn’t the Dave Appell who was associated with Bruce Springsteen–now moonlighting as an alarmist. It’s not.
Eustace Cranch says:
May 26, 2013 at 7:37 pm
….Can someone explain to me in layman’s terms why some AGW scientists seem to think that heat is moving to (hiding in?) the deep oceans when it wasn’t, say, 15-20 years ago?
I really don’t understand this. What is the mechanism? What has supposedly changed?
>>>>>>>>>>>>>>>>>>>>>>>..
The change is the atmospheric temperatures are not warming. They global temperature has been stable for 15 – 17 years depending on the data set. Heck, I am freezing here in sunny south with a temp of 46F. Normally we have several days of over 90F in April and May but this year we have barely hit the eighties for a couple of weeks. People in Europe are also complaining of the cold weather. This means an explanation is needed. So heat ‘Hiding’ in the deep oceans where it can not be measured was whipped up as the explanation and every major weather event is “Caused by Global Warming” is now hit the headlines.
In other words the scammers are trying to keep the con going long enough to make a fast exit with all the loot and without an angry mob chasing them with tar and feathers.
Bob Tisdale: My comment about why a 3 month moving average and figure one was simply presented to drive home the lack of actual data needed to present (8 years and a 3 month moving average would provide a rather silly graph when talking about earth process that evolved over thousands of years). I was being a smart ass. I wasn’t criticizing your graphs but the overall process of gathering source data and it’s management. I am new to getting involved at this level but the idea of AWG really is preposterous. I will however look into the papers you presented. I am always amazed how the climate change folks can bring certainty out of relative uncertainty. Isn’t Dave Appell a Comedian?
For anyone interested, I just posted the Very Preliminary sea surface temperature update for May 2013:
http://bobtisdale.wordpress.com/2013/05/27/very-preliminary-may-2013-sea-surface-temperature-sst-update/
Regards
stacase says:”Some elaboration would be appreciated.”
There’s a good overview of the problems with ARGO that Trenberth was talking about in the following 5-part article from NASA:
http://earthobservatory.nasa.gov/Features/OceanCooling/
Bob Tisdale:
In reference to: ftp://ftp.nodc.noaa.gov/pub/data.nodc/woa/PUBLICATIONS/nesdis40.pdf
and this is one of the thigns I was looking for. Did you see the standard deviations for this data set? OK. Let’s be real here for just one moment. In one of the papers there was a stated total mean temp change in the period 1955-1998 of 0.037 degrees c. That amounts to roughly 0.009 deg C per decade, yet for the same data sets in the paper above they are reporting standard deviations of a minimum of 0.5 degrees to 2 degrees C. Mind you, I only looked through about 5 of the graphs and it seems that they listed several. My guess is that the standard deviations decreased as a function of depth.
This is why I am not a fan of climate scientists. You can’t have accurate data with a standard deviation that is 10 to 100 times the mean you are targeting. It is almost preposterous mathematically. Also, I didn’t see what percentage of the data were thrown out. That should be reported. I realize this is the climate and things are tricky, but this is not a good data set at all. At BEST I think that the mean average over this entire period might serve as ONE data point for a data set encompassing a period of 1000 years plus. I also didn’t see much for an expose into system analysis (heat in/heat out), but that could be just because this was cover long ago and there is a consensus on what constitutes this system and the flux variables have already been determined. Same with the “tossing of data” and “correcting of data”. I could just be late to this game, and not really sure I want to be in it as I know that, in the end, this will all be looked at as human folly and that is not how I want to be rememebred.
Thanks for gathering those papers for me. That was kind of you.
This answer is for Eustace: As stated above, the reason some climate alarmists feel the need to announce that heat is being hidden in the deep ocean is political. The earth has not warmed in nearly 20 years, and they need to find a place to stash that (non-existant) heat, metaphorically speaking, that is very difficult to measure accurately. The deep ocean is a perfect place–it can hold a lot of heat, the current measurements are short duration and limited, and past measurements close to non-existant. So they announce the heat is going to the deep ocean (since it’s clearly not going to the atmosphere). Add in some great scientific sounding mumbo-jumbo, and no layperson could begin to dispute what they say. That is politics at its finest.
All that being said, I appreciate all the work Bob and Willis have done analyzing the Argo and other data. I have learned a lot. You guys don’t speak mumbo-jumbo.
While there is some warming of the oceans, it is very very small. It is only 0.49 W/m2 in the Argo era while GHG forcing is 2.86 W/m2 right now. So, compared to what is thought to be the extra warming provided by GHGs, the ocean heat uptake is only 17% of that amount.
Some perspective is needed.
http://s9.postimg.org/cwz2zl70v/OHC2000_M_GHG_Forcing_Q1_2013.png
And then another perspective might be comparing the ocean temperature changes versus the surface temperatures.
The 0-700 metre ocean is warming at 0.024C per decade and the 0-2000 metre at 0.021C per decade in the Argo era. Hadcrut4 surface temperatures by contrast are declining at -0.057C per decade in the Argo era.
http://s13.postimg.org/iiu9nju0n/Temps_Surface_2000_M_Ocean_Q1_2013.png
This warming comes from below as well as above, does anyone have numbers for the heat from underwater volcanoes and fissures etc.? Temperature changes would reflect all sources, periods of intense or sparse underwater heating must occur.
On that note C.M Carmichael, I am not seeing a factor for the heat of evaporation factor. Like I said before, maybe this system was long ago defined and I just don’t get it, but considering the fact that the Heat of Vaporization is a big number for water, it needs to be included in this type of system analysis.
“With ocean heat content data before the ARGO era, the measurements are so sparse we are unable “to observe the motions of thermal anomalies in the mid- and high latitude oceans” [Raymond Schmitt], and since the introduction of the ARGO floats, there are “issues of missing and erroneous data and calibration” [Kevin Trenberth]. Phrased other ways: ocean heat content is not a reliable dataset—and—it’s not a dataset in which we should have confidence.”
Yeah, but c’mon Bob –
You’ve obviously cherry-picked quotes by skeptical “d-ers” who are actively working against CAGW.
/sarc
C.M. Carmichael says:
May 27, 2013 at 5:55 am
“This warming comes from below as well as above, does anyone have numbers for the heat from underwater volcanoes and fissures etc.?”
Average continental crust internal heat loss is 0.07watts/m^2; average oceanic crust loss is 0.1watts/m^2.
http://en.wikipedia.org/wiki/Geothermal_gradient#Heat_flow
However, the eastern Pacific ocean floor, mainly off west coast South America is up to 0.3+watts/m^2 due to continental “plates” riding over the oceanic crust with attendant earth quakes and volcanism.
http://anquetil.colorado.edu/szhong/papers/Zhang_Zhong_Heatflux_EPSL2011.pdf
See map on page 2. I’ve commented in the past on the possibility of the equator bound California Current (south flowing) and Peru Current (north flowing) would gather this heat on a continuous basis and convey it to the equatorial zone, perhaps modifying ENSO. but there have been no takers. Geothermal has been looked at and rejected (possibly prematurely). The big argument regarding the Antarctic Peninsula warming from CAGW has been a little quieter since active sub-marine volcanoes were discovered offshore a few years ago.
http://www.sciencedaily.com/releases/2004/05/040527235943.htm
Kadaka comments – ‘Your Figure 3, 0-2000m, going by the slope line, at the start of 2005 there was 10.5*10^22 Joules Global Heat Content. By the start of 2013 it was up to 16.75*10^22 Joules, a 60% increase.’
Thank you for your response Bob where you say the figures are not absolute but an anomaly. However its still a 60% increase. Could you clarify your response.
Thanks
From Bob Tisdale on May 27, 2013 at 3:12 am:
Then you have allowed yourself to become complicit, as any “idiot passerby looking at your bare graphs without context” sees only the 60% OHC increase. I know not to worry, but anyone finding your graph by itself in the wild doesn’t. The lack of a zero on the Y-axis, a sure sign of anomalies since there wouldn’t be negative OHC, doesn’t help.
Some more context would be greatly appreciated, namely the base value the anomalies are calculated from. If the absolute value of total ocean heat content from 0-2000m is of the order of 10^24 Joules, these changes are very worrisome. If the base is 10^38 Joules, much less worrisome.
There seems to be a misunderstanding of the nature of Science Fiction. Science Fiction is fiction based on solid science, not science based on solid fiction.
@ Jim Steele
The Balmaseda-Trenberth-Källén paper
http://thingsbreak.files.wordpress.com/2013/03/distinctive-climate-signals-in-reanalysis-of-global-ocean-heat-content.pdf
What should they be doing? There are only three possibilities … warming, cooling, nothing. Please choose one.
Considering we are currently in three separate overlapping warming periods simultaneously: Holocene post-Glaciation, post-LIA, post-1970’s, how can it be expected to be doing anything except warming?
@ Blade.
Now that was funny. Seriously.
http://news.yahoo.com/blogs/sideshow/plants-zombies-400-old-plants-show-signs-life-224450940.html
I couldn’t help but think. Gee, 400 years ago the glaciers were right where they are today? Must have been some stupid humans and their gas guzzling suv’s tooling around back then too. Oh wait, was that an ice age they were talking about? I wonder what other kind of cool things they are going to find !
Everything is driven by money these days. The whole concept of AGW is based on money?
Trillions of dollars made with this Bull-S:
1. Y2K Computer virus the biggest BS of the century
2. CFC’s causing ozone layer to deplete
3. Freon refrigerator gas changed to A134
4. Carbon footprint
5. AGW
6. “Fossil” Fuel………
Anyone else notice Bobs graphs are getting wider rather than maintaining the same aspect ratio.