OVERVIEW
This post presents the annual cycle in sea surface temperatures for the hurricane main development region in the North Atlantic. It also presents the sea surface temperature anomalies for three regions: (1) the Main Development Region, (2) the Gulf of Mexico and (3) the Coastal Waters north of the tropics along the East Coast of the United States, which is the extratropical portion of Hurricane Sandy’s path. Those three subsets are presented in weekly and monthly formats using the satellite-based Reynolds OI.v2 sea surface temperature dataset, and I’ve also shown them based on NOAA’s ERSST.v3b long-term sea surface temperature reconstruction. And since tropical storm development is inhibited by El Niño events, I’ve also presented the weekly NINO3.4 sea surface temperature anomalies. As an afterthought, I’ve added the weekly data for the Caribbean.
INTRODUCTION
The 2013 hurricane season is fast approaching. Last month, Klotzbach and Gray of Colorado State University published their Extended Range Forecast of Atlantic Seasonal Hurricane Activity and Landfall Strike Probability for 2013. The opening page reads:
We anticipate that the 2013 Atlantic basin hurricane season will have enhanced activity compared with the 1981-2010 climatology. The tropical Atlantic has anomalously warmed over the past several months, and it appears that the chances of an El Niño event this summer and fall are unlikely. We anticipate an above-average probability for major hurricanes making landfall along the United States coastline and in the Caribbean. Coastal residents are reminded that it only takes one hurricane making landfall to make it an active season for them, and they need to prepare the same for every season, regardless of how much or how little activity is predicted.
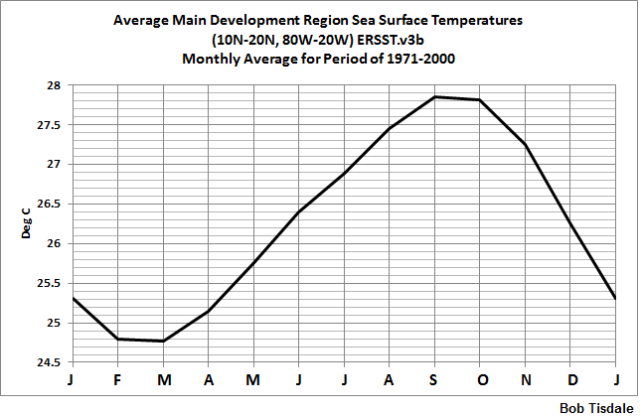
Figure 1 – Annual Cycle in Main Development Region Sea Surface Temperatures
Sea surface temperatures are an important component of hurricane development. Tropical storms need a lot of warm water to grow. The following is a paragraph from Chapter 4.18 [ENSO Influence on Tropical Cyclones (Hurricanes)] from my book Who Turned on the Heat?
The recipe for a tropical cyclone has three primary ingredients. The first is warm water—waters in excess of 26 deg C. Because the tropical storm feeds off the warm water, it cools the sea surface, so the warm water has to reach depths of about 60 meters in order to support the development of the tropical cyclone. The second ingredient is moisture and lots of it. The moisture has to cover a large area and be thick, normally extending from the sea surface to altitudes to 20,000 feet (about 465mb). The third ingredient is relatively light winds. That’s where an El Niño spoils the recipe.
An El Niño event in the tropical Pacific causes stronger-than-normal high level westerly winds in the Main Development Region of the tropical North Atlantic, and those strong high level winds can cause wind shear.
Figure 1 shows the annual cycle in sea surface temperatures for the Main Development Region in the North Atlantic, which is bordered by the coordinates of 10N-20N, 80W-20W. It’s easy to see why the official Atlantic hurricane season lasts from June through November. Sea surface temperatures in the Main Development Region are coolest in February and March and warmest in September and October.
So where do we sit this year? And what about the Gulf of Mexico? And the waters off the east coast of the U.S. where Sandy tracked last year before making the left turn into New Jersey?
WEEKLY SEA SURFACE TEMPERATURE ANOMALIES
Weekly sea surface temperature and temperature anomaly data (deviations from the average monthly values of the period of 1971-2000) based on the Reynolds OI.v2 dataset are available from NOAA NOMADS website—as are the short-term (November 1981 to present) monthly data that follow. The Reynolds OI.v2 dataset is based on satellite data and from ship inlets and buoys (fixed and floating). The weekly data is centered on Wednesdays and begins in January 1990.
Figure 2 shows the weekly sea surface temperature anomalies for the main development region through Wednesday May 8, 2013. I’ve also highlighted the current value in red as the horizontal line. Klotzbach and Gray were obviously correct with, “The tropical Atlantic has anomalously warmed over the past several months…”
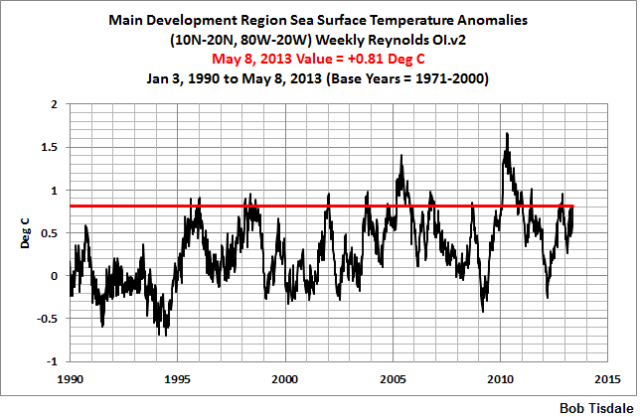
Figure 2
Those living along the Gulf Coast are always concerned about the sea surface temperature anomalies in the Gulf of Mexico. At present, sea surface temperature anomalies there are below the 1971-2000 average by a significant amount. See Figure 3. That’s not to say that the Gulf won’t spawn any hurricanes this year. This is simply an indication that sea surface temperatures in the Gulf, as a whole, are cooler than normal now.
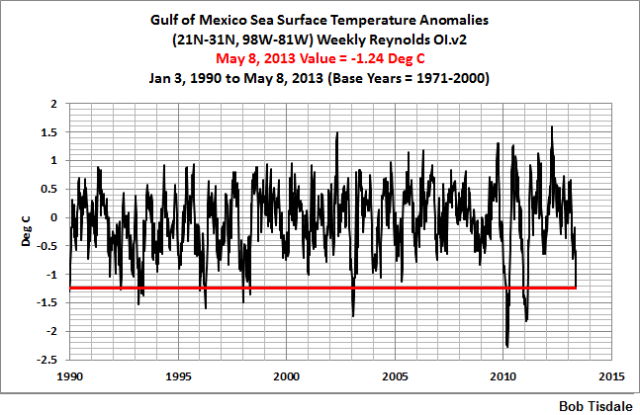
Figure 3
And those living along the Eastern Seaboard are concerned about the sea surface temperatures along the East Coast. I’ve used the same coordinates in Figure 4 that I used for the discussions of sea surface temperatures along the extratropical portion of Sandy’s storm track in two posts last year. See here and here. At present, sea surface temperature anomalies are below the average of the base period of 1971 to 2000.
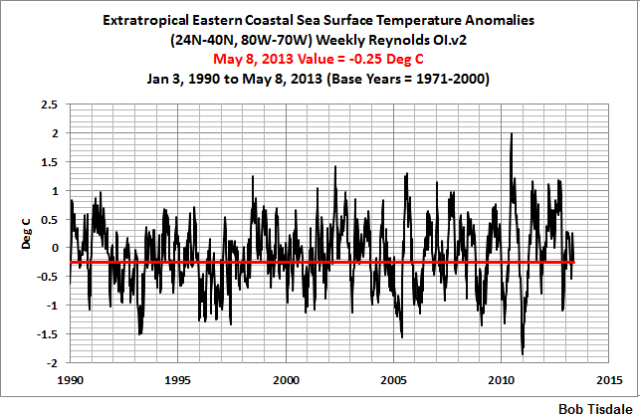
Figure 4
And, yes, that severe drop toward the end of 2012 occurred the week of Sandy. While sea surface temperatures were not exceptionally warm last year along the extratropical storm track, Sandy did pull a lot of heat from that portion of the Atlantic. I’ll let you decide if that will impact the storms this year.
SATELLITE-ERA MONTHLY DATA
For those interested in a longer-term look at the data, Figures 5, 6 and 7 present the monthly sea surface temperature anomalies for those regions, again using the Reynolds OI.v2 dataset. The monthly data starts in November 1981 and runs through April 2012. I’ve also included the most recent values as red horizontal lines for easier comparisons.
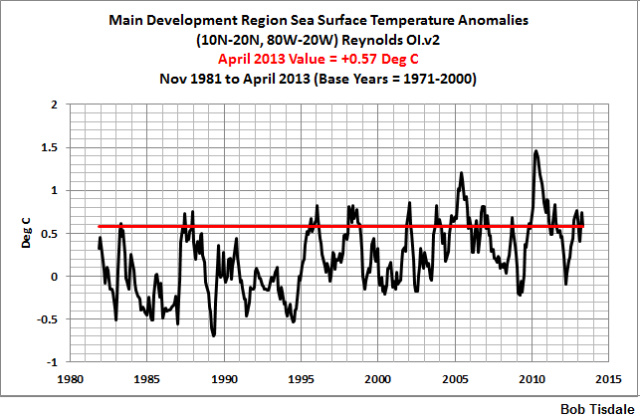
Figure 5
#############
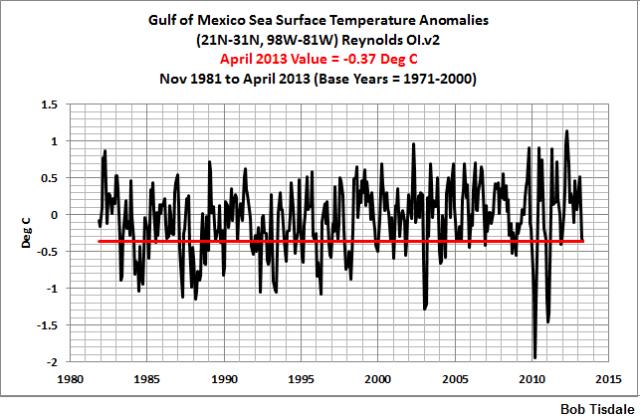
Figure 6
#############

Figure 7
MONTHLY LONG-TERM RECONSTRUCTION
And for those wanting a further look back in time, Figures 8 through 10 show the April 2012 sea surface temperatures highlighted in red for the 3 regions, using NOAA’s ERSST.v3b dataset, which starts in January 1854. The ERSST.v3b data is available through the KNMI Climate Explorer. Due to the number of corrections before 1950 and the severity of them, the early data has to be looked on with a pinch of salt, especially when looking at relatively small regions as we are with Figures 9 and 10.
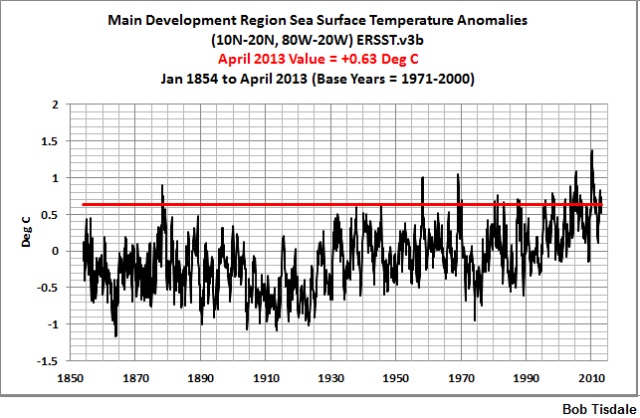
Figure 8
#############
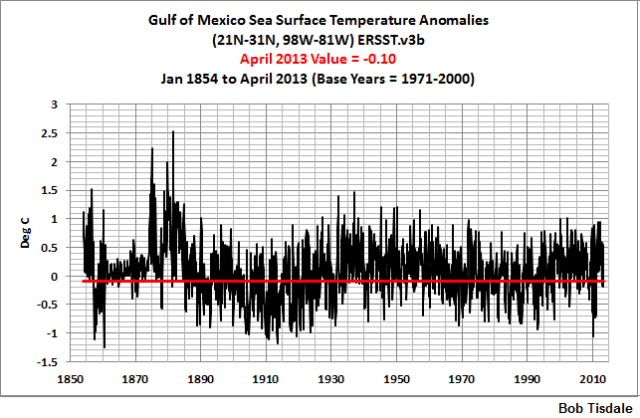
Figure 9
#############
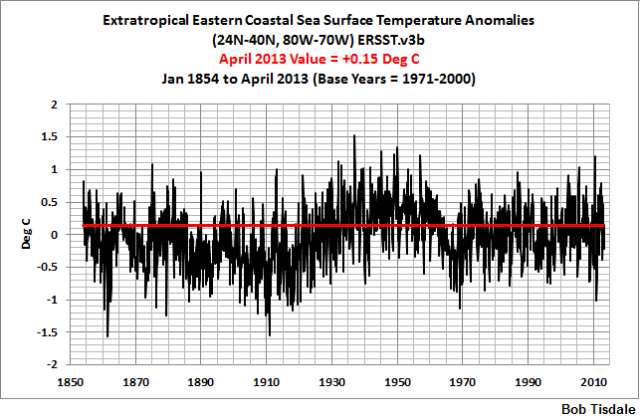
Figure 10
What I did find surprising, Figure 11, was that the main development region data remained relatively flat from 1930 to 1995. That is, according to the ERSST.v3b data, there was little warming there for 6 ½ decades. In Figure 11, the red line is the linear trend as determined by EXCEL.
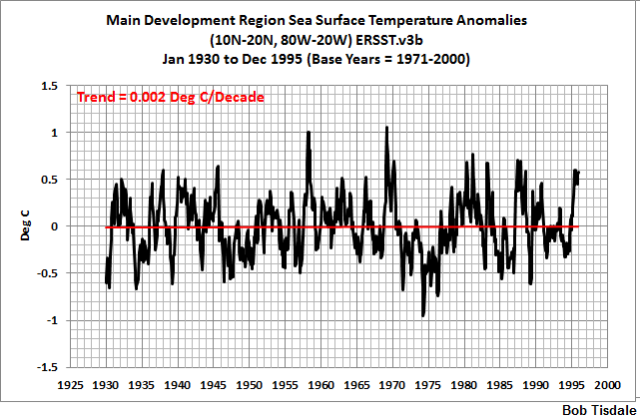
Figure 11
EL NIÑO-SOUTHERN OSCILLATION
As noted earlier, El Niño events in the tropical Pacific cause increased wind shear in the North Atlantic and that suppresses hurricane development there. The ENSO forecasting models are not predicting an El Niño event this season, see pages 25 through 27 of NOAA’s weekly ENSO update, so Klotzbach and Gray considered the absence of El Niño conditions when making their hurricane season predictions.
Figure 12 presents a graph of the weekly sea surface temperature anomalies for the NINO3.4 region in the east-central equatorial Pacific. NINO3.4 sea surface temperature anomalies are a commonly used index of the strength, frequency and duration of El Niño and La Niña events. According to NOAA, El Niño conditions exist when the sea surface temperature anomalies are warmer than +0.5 deg C. As of last week, the NINO3.4 data was showing an anomaly of effectively zero.
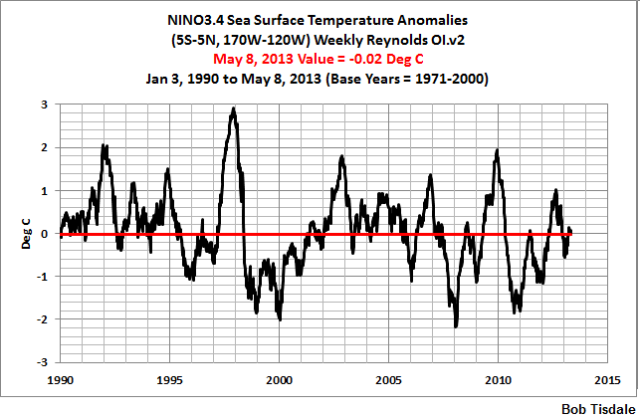
Figure 12
OOPS FORGOT TO ISOLATE THE CARIBBEAN
The Main Development Region is quite large, extending from the Caribbean Sea to almost the coast of Africa, and sea surface temperatures can differ quite a bit from west to east. Figure 13 shows the weekly sea surface temperature anomalies for the Caribbean Sea, using the coordinates of 10N-20N, 84W-60W. Sea surface temperatures there are also above normal, but not as high as they are toward the eastern portion of the main development region.

Figure 13
CLOSING
For four years, I’ve been illustrating and discussing how ocean heat content and satellite-era sea surface temperature data indicate the oceans warmed naturally. That doesn’t stop climate change alarmists from making all sorts of nonsensical claims. If the natural warming of the oceans is new to you, refer to the illustrated essay “The Manmade Global Warming Challenge” [42MB].
Figure 14 is a sea surface temperature anomaly map of the North Atlantic, for the week centered on May 8, 2013. Just because sea surface temperature anomalies are below normal along the Gulf and southeast coasts right now, that doesn’t mean they’re going to remain there for the 2013 hurricane season. Also, hurricanes don’t care about anomalies. Sea surface temperatures can be below normal, but if they’re warm enough (in absolute terms), they’ll support a hurricane.

Figure 14
As Roger Pielke, Jr. reminded us last December in his post Record US Intense Hurricane Drought Continues:
When the Atlantic hurricane season starts next June 1, it will have been 2,777 days since the last time an intense (that is a Category 3, 4 or 5) hurricane made landfall along the US coast (Wilma in 2005). Such a prolonged period without an intense hurricane landfall has not been observed since 1900.
While this fact counters many claims by global warming enthusiasts, it also indicates we’re long overdue for one.
“Also, hurricanes don’t care about anomalies. Sea surface temperatures can be below normal, but if they’re warm enough (in absolute terms), they’ll support a hurricane.”
Exactly!
I understand the concept of overdue as hurricanes are not random occurrences but I have a question. Is making landfall as a major storm equally overdue, is it too impacted from past patterns? I get the feeling that hurricanes don’t know if there is land ahead unlike hurricanes knowing that there is shear and warm water along their path.
Thanks for the information, Bob. I’ll take data over a model any day.
I really like listening to Joe Bastardi share his insights about hurricanes. He seems to pay less attention to long term “trends” and more attention to current conditions. While he does put some stock in the idea we are returning to a part of a “cycle” like the 1950’s, he attends more to the reality of the “now.”
To me this is the difference between “counting cards,” (and thus knowing a little about what cards are likely to be dealt,) and seeing the actual cards that are actually dealt.
He pointed out a difference in the air and water temperatures between the Caribbean and Africa. Last year they were cooler, and, in the process of warming, the air became drier, and took time to “moisten up.” This year the same area is warmer and therefore more moist to begin with, which increases the likelihood of long-track storms.
For other reasons he says there is an increased likelihood of storms up the east coast.
While a “likelihood” is not the same thing as a “certainty,” Joe was so correct about where storms would develop, and how they would move, last year, that I’ll heed him this year.
RE: Rob Dawg says:
May 19, 2013 at 5:17 am
Hurricanes may not “know” land is ahead, however their structure is influenced by land in a number of ways. The most obvious is that they usually weaken over land, as they are fueled by hot water. Only under perfect conditions can a storm get stronger, usually because it is weak to begin with. Also, when they are moving slowly near land like Irene was, the air they suck in from the overland areas tends to be dry. This was part of what collapsed Irene’s eye-wall. The 1938 hurricane was very different, and rushed north so swiftly land and cold water had less time to weaken it. Land also has another interesting effect on some storms wherein the eye-wall “tightens” at landfall, which can briefly increase the winds. And I’m sure land has other effects I don’t know about.
(“Honestcal” is me. It’s a name I used in the past which I can’t get my computer to forget.)
It appears that North Atlantic Hurricanes’ occurrence and intensity as measured by the ACE are related to the past Arctic atmospheric pressure
http://www.vukcevic.talktalk.net/NAHs.htm
What is Gray’s record at this time? Shouldn’t any of his pre-season predictions include his record on such predictions? Along with some error analysis – i.e. how accurate and how precise? Or would it be just as useful to use a random number generator limited to ranges of 7 – 15 named storms and 2 – 5 storms making landfall?
Though by means a Meteorologist, I have seen a correlation between SAL numbers and the proliferation of storms within any given season, though I cannot profess an understanding of a total correlation I will note that this year, as opposed to each of those as a comparative since 2006 is markedly lower, and most significantly resembles 2004.
http://tropic.ssec.wisc.edu/real-time/salmain.php?&prod=splitE&time
*By NO MEANS a meteorologist… cursed keyboard and slow responding coffee..
I like to think of it like a coin flip. (Disclaimer: I may not be right, this is just how I think of it.) I have a 50% chance of getting heads on each flip and a 50% change of getting tails. This does not mean that every time I flip a coin it will follow the heads-tails-heads-tails pattern. Suppose I flip a coin three times in a row and it comes up heads each time. On my next flip, I am statistically overdue for a tails but I still have only a 50% chance of getting tails. When I flip a coin, no matter how many times I get a heads in a row, eventually I must get a tails, and vice versa.
Weather is more complex than a coin flip. But study it enough and you can see trends. For example, most north Atlantic hurricanes occur in summer and autumn. You also notice that certain places experience more hurricanes than others. Florida finds itself in more danger than Georgia, North Carolina is struck more than South Carolina and Virginia. Look at those trends long enough and you can get a good idea of how often a certain place is struck by a hurricane. When it goes significantly beyond that average, then it is overdue. Look at the link above for Roger Pielke Jr’s current intense hurricane drought. Today, on average it is about 500 days between major hurricane strikes on eastern US coast. We are currently about 5 times beyond the average. Hurricanes don’t have personalities and thus they do not pick and choose where they want to go. But, like a coin flip, the law of averages will take over and the current trend will come to an end. The trend may not break this year or next year or the next decade. But it will break one day.
My take on Eastern seaboard hurricane damage potential. Sandy should give us plenty of information that tells me it isn’t what a hurricane IS when it meets the Eastern Seaboard, it’s what it meets up with that ups the anty for damage potential. A strong hurricane meeting the Gulf of Mexico seashore disintegrates and dies rather quickly. A weak hurricane meeting an Eastern Seaboard Nor’easter has an afterlife!
So Bob. What is the potential this season for strong weather systems coming from the other direction and shaking hands with a weak hurricane coming from the other?
Let’s see now 1900 had low solar cycles and low AMO. That is in reference to the end of the post referring to Roger Pielke, Jr. I suppose the important thing is the incidence of the record streak and not the exact number or even that it ends.
Must solar issues invade EVERY thread? The current prediction is based on weather pattern variations set up by oceanic and semi-permanent atmospheric pressure system oscillations. Tiny solar variation is not a concern nor teleconnected anymore than the trace amount of CO2 is.
So what is the potential for Nor’ Easters developing during this hurricane season? If the two types of storms have sets of parameters that predicts an uptick in occurance, the chances increase that one will meet the other.
Thank goodness, my worry that no one of the sceptical persuasion was going to start “expecting” a resurgence of hurricanes has been mollified. The cooling conditions, like that of the 1950s (la nina conditions) is bound to let hurricanes develop and strengthen (SST must have still been high enough despite entering the cooling phase back then). All though we seem to be entering a cooling phase, it remains at the plateau of strong late 20th C warming. Conditions are ripe for a resurgence of stronger hurricanes until the cooling phase pushes SST below 25-26C when one of the necessary conditions disappears. I’d like to see hurricane stuff by Ryan Maue and Joe Bastardi predicting these developments before they are taken possession of by a desperate, hungry global warming community (presently they have to make do with warming causes cold winters, droughts in Namibia, rough air travel and other less savory fare).
Bob, the sea temperature map provided in the El Niño / La Niña pages of WUWT seems to have begun showing the Atlantic equivalent of a cold tongue of water extending west from the African coast at the equator. THis is similar to the cold tongue of water extending across the Pacific at present at the equator. THe extent and intensity of this tongue relates to / creates the El Niño / La Niña effect (if I read your posts and information correctly). Is the Atlantice effect important?
Pamela Gray says:
May 19, 2013 at 9:15 am
…………….
Must solar issues invade EVERY thread? The current prediction is based on weather pattern variations set up by oceanic and semi-permanent atmospheric pressure system oscillations. Tiny solar variation is not a concern nor teleconnected anymore than the trace amount of CO2 is.
….
Sun is the ultimate source of all climatic changes, even those attributed to the CO2.
North Atlantic is the primary source of decadal (9.1 years) and multidecadal oscillations, and by some indications of the ~5 year ENSO periodicity.
http://www.vukcevic.talktalk.net/GSC1.htm
Without the sun’s 11 year cycle none would exist, most of people may not know it; not knowing it is not good enough reason to deny the existence.
Keith says: “Is the Atlantice effect important?”
According to NOAA, “..it is not of much consequence…”
David Enfield’s FAQ webpage on ENSO includes the following QnA:
“Is there an El Niño in the Atlantic Ocean?
“There are two kinds of El Niño phenomena in the Atlantic. One is a spin-off from the Pacific El Niño, due to transmission through atmospheric fluctuations. This atmospheric signal from the Pacific El Niño is the same phenomenon that causes the Atlantic to experience fewer hurricanes during El Niño years. The result of that ‘teleconnection’ is that the tropical Atlantic usually experiences a smaller but anomalous warming several seasons after the maximum warming in the Pacific (which usually occurs in December).
“The other ‘Atlantic El Niño’ effect is a non-synchronous and aperiodic warming that occurs along the equator, entirely due to internal Atlantic dynamics. It is only ‘El Niño-like’ in the sense that those dynamics are similar to the Pacific case, but it has no correlation with Pacific events. Moreover, the magnitude of the warmings is much smaller, as is the typical period between events. Hence, it is not of much consequence and should probably not be called ‘El Niño’, as this would create unnecessary confusion.”
Regards
Pamela Gray says: “So Bob. What is the potential this season for strong weather systems coming from the other direction and shaking hands with a weak hurricane coming from the other?”
Pamela, sorry. I am not the person to answer hurricane questions.
http://www.vukcevic.talktalk.net/NAHs.htm
Yes it is worth noting the ACE has been high even though there has been a fortunate drought of land-falling storms. It may be worth investigating what is preventing landfall when there is a lot of energy out there in the recent max period.
http://climategrog.wordpress.com/?attachment_id=215
(I should update that graph)
The way that AO keeps sticking it’s nose in is getting very curious.
It correlates with Mauna Loa CO2 even better than SST does !
http://climategrog.wordpress.com/?attachment_id=231
Vuk: Sun is the ultimate source of all climatic changes, even those attributed to the CO2.
North Atlantic is the primary source of decadal (9.1 years) and multidecadal oscillations, and by some indications of the ~5 year ENSO periodicity.
http://www.vukcevic.talktalk.net/GSC1.htm
Without the sun’s 11 year cycle none would exist, most of people may not know it; not knowing it is not good enough reason to deny the existence.
===
The circa 9.1 periodicity is prevalent in most of N. Pacific and N. Atlantic see figure 4:
http://climategrog.wordpress.com/2013/03/01/61/
However, Scafetta makes a fairly convincing case for it being lunar in origin rather than solar. see fig 5
http://climategrog.wordpress.com/?attachment_id=217
Two main peaks in N Atl are ~9 and ~10.6 , they will coincide about every 64 years.
The can tentatively be attributed to lunar and solar respectively.
Now what is the long period seen in AMO and ACE climate records?
Looks like Zen Buddhism know more about climate than super computers . LOL.
Atlantic hurricanes, esp. of the land-fall variety, are more frequent in periods of global cooling than in periods of global warming.
http://members.westnet.com.au/jonas1/hurricanes.jpg
(from “FORECAST OF ATLANTIC SEASONAL HURRICANE ACTIVITY, AUGUST MONTHLY ACTIVITY AND U.S. LANDFALL STRIKE PROBABILITY FOR 2008”, by By Philip J. Klotzbach and William M. Gray, http://hurricane.atmos.colostate.edu/Forecasts/2008/aug2008/aug2008.pdf)
Patrick B asks “What is Gray’s record at this time?“. There is a table “Verification of Previous Forecasts” in the above paper. The most recent forecast can be found at http://hurricane.atmos.colostate.edu/.
alexwade says: …When I flip a coin, no matter how many times I get a heads in a row, eventually I must get a tails, and vice versa.
Not necessarily, Alex. After you’ve gotten 12 or more heads in a row, you’d be wise to examine the coin and see if it does have a tail side. It might have belonged to a climate scientist.
Bob Tisdale, what I think is the most amazing thing about your article and which immediately got my attention was your Figure 1 graph of average sea surface temperatures in the North Atlantic from 1971 thru 2000.
And I say that because I have been looking for such a creditable graph for several years now and “BINGO”, there it was when I looked at your article.
And assuming that you are curious about my excitement, the fact is, your Figure 1 graph confirms my learned explanation of the bi-yearly cycling of atmospheric CO2 ppm as defined by the Mona Loa ppm measurements and plotted on the Keeling Curve Graph.
Your Figure 1 graph also confirms the fact that the “causes” being touted by the proponents of CO2 causing AGW for said bi-yearly cycling of CO2 ppm are bogus, false and/or “junk science” based.
Given my above, Bob Tisdale, for your assessment of my above claims, please “click” on the following url link to a Keeling Curve Graph and note the small “inset” graph at the lower right that defines the Annual CO2 Cycle. To wit:
http://mpe2013.org/wp-content/uploads/2012/11/Climate-Data-Mauna-Loa-CO2-1024×665.png
Bob Tisdale, that Annual CO2 Cycle graph ….. is a polar-opposite of your Figure 1 temperature graph of the ocean water in the North Atlantic (Northern Hemisphere) …. which confirms Henry’s Law and the fact that the temperature of the ocean water in the Southern Hemisphere is the driving force of the bi-yearly cycling of atmospheric CO2 ppm.
The Spring and Fall equinoxes pretty much dictates the “start” of the bi-yearly rise and fall of CO2 ppm. See ref: http://i1019.photobucket.com/albums/af315/SamC_40/keelingcurve.gif
On a related note, urban aerosols are known to suppress hurricane processes substantially. The widespread reductions in urban aerosols in recent decades makes a severe hurricane strike on a major east coast city significantly more likely.
Google ‘aerosols hurricane intensity’ for several papers on the subject.
Aerosol seeding of hurricanes is regularly floated as a way of reducing hurricane intensity and even steering hurricanes away from urban areas.
For sub-equatorial North Atlantic SST (NOAA data available since 1948) two extreme years are 1974 (low) and 2010 (high), the monthly ‘divergence’ of 2012 shows that a new regime of climate change in the N. Atlantic may be underway
http://www.vukcevic.talktalk.net/NA-SSTs.gif
I also found that the CET (land temperatures further north) which are strongly influenced by the N.A. SST, also appear to show that a significant change is on the cards
http://www.vukcevic.talktalk.net/CET-Dmax.htm
Greg Goodman says:
May 19, 2013 at 12:19 pm
………
Hi Greg, I’ve looked superficially at tides, and only thing I could find is this (related to N. Atlantic and the AMO) http://www.vukcevic.talktalk.net/AMO-T.htm
E.M.Smith (Chiefio) did lot of good work on tides factor, I recommend it.
Mike Jonas – Thank you but that still isn’t useful. What Gray needs to do is show average hurricane data, what a typical distribution of that data is AND that his forecasts are more accurate. He is not doing that. This area of science seems woefully deficient in proper statistical analysis.
Classic! Love it. And so true.
All of the assurances above referring to weather anomalies which are naturally occurring, may not mean Jack Squat!
Inland hurricanes reported to have winds as high as 300 miles per hr. are obviously intensified by weather modification/weather weapons. dutchsinse on youtube shows the HAARP return images and scalar weapon square images, in turn, becoming an adept weatherman. His father was a radar expert, ‘Dutch’ correctly forecasted the Joplin inland hurricane and also showed how Sandy was steered and intensified with HAARP, the ionospheric heating device. (double powered up in 2010) Tesla technology which by the way many other countries have been using now.
Nick Begich of Alaska, wrote the book on it and has been interviewed on Coast to Coast. (found on youtube)
Yes, Agenda 21, corp land grabs and bankruptcy etc. etc. etc. etc. etc. etc. Soros, blah blah blah
Wild fires are another aspect of terror. Look it up, Homeland unsecurity warns us about it! ha
“tropical storm development is inhibited by El Niño events”
And this is because weakened easterlies therefore increased westerly’s cause wind shear? If this relationship is real it is very important and begs a far more fundamental explanation.