by Bob Tisdale
It’s difficult to express how enormous El Niño and La Niña events are. Often, when discussing them, I’ll display a map of the tropical Pacific (see example here) and write something to the effect of, the equatorial Pacific or the tropical Pacific stretches almost half way around the globe. But that really doesn’t show up very well with a map.
I was cleaning out a catch-all drawer in my desk recently and happened on a protractor. (I even have a pocket calculator and a slide rule in there. No abacus, though.) It occurred to me that maybe a graduated half-circle would help to put the equatorial Pacific and El Niño-Southern Oscillation (ENSO) events into perspective for some readers.
Figure 1
(As a reference, the same illustration with the NINO3.4 region identified is here.)
To create Figure 1, I borrowed the image of a protractor from a website, started the longitudes with 110E to the left and ended with 70W to the right, and added a couple of blobs to indicate Indonesia in the west and South America in the east. If we consider this a partial cross-section, we’re looking north. I’ve also identified the longitudes for the region used in the Cold Tongue Index (180-90W) and the longitudes I typically present for the western equatorial Pacific (120E-165E). The sea surface temperature anomalies for the Cold Tongue Region (known as the Cold Tongue Index) are a commonly used index for the strength, timing and duration of El Niño and La Niña events. I used the Cold Tongue Index for this post in place of the more commonly used NINO3.4 sea surface temperature anomalies because, as you can see, the Cold Tongue Region stretches ¼ of the way around the globe. The longitudes for the western equatorial Pacific stretch half that—or 1/8 of the length of the equator.
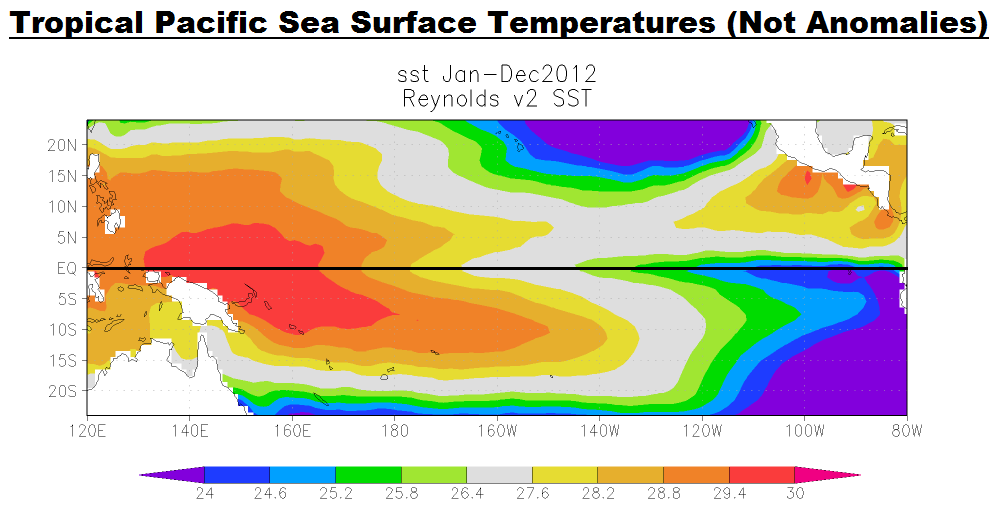
A graph of the sea surface temperature anomalies of the western equatorial Pacific (6S-6N, 120E-165E) and the Cold Tongue Region (6S-6N, 180-90W) is shown in Figure 2. A huge volume of naturally created warm water is transported from the western equatorial Pacific eastward to the Cold Tongue Region during an El Niño. We can see that sea surface temperatures in the Cold Tongue Region warm drastically during El Niños and cool during La Niñas—nothing new with that. During the evolution of the1997/98 El Niño, so much naturally created warm water was transported east that sea surface temperature anomalies for the Cold Tongue Region (which stretches ¼ of the way around the globe) warmed more than 3.0 deg C (about 5.4 deg F) from January to December 1997.

Figure 2
On the other hand, the sea surface temperature anomalies for the western equatorial Pacific cool during El Niños and warm during La Niñas. But as we can see in Figure 2, the cooling in the western equatorial Pacific is much less than the warming in the Cold Tongue Region during El Niños, and there’s much less warming in the western equatorial Pacific than there is cooling in the Cold Tongue Region during La Niñas. So the cooling (warming) in the western equatorial Pacific is not enough to offset the warming (cooling) in the Cold Tongue Region, especially when we consider the Cold Tongue Region is twice the size of the western equatorial Pacific. That’s one of the indications that much of the warm water that fuels an El Niño comes from below the surface of the western tropical Pacific.
In Figure 2 above, the magnitude of the variations in the eastern equatorial Pacific (Cold Tongue Region) mask something that happened in the western equatorial Pacific during the 1995/96 La Niña. So in Figure 3, I’ve scaled the Cold Tongue Region data by a factor of 0.25 and smoothed both datasets with 13-month running-average filters. Now, standing out quite clearly is the upward shift in the sea surface temperature anomalies of the western equatorial Pacific that happened in response to the 1995/96 La Niña. Other than the dip and rebound associated with the 1997/98 El Niño, the sea surface temperatures of the western equatorial Pacific have been relatively flat since 1996.
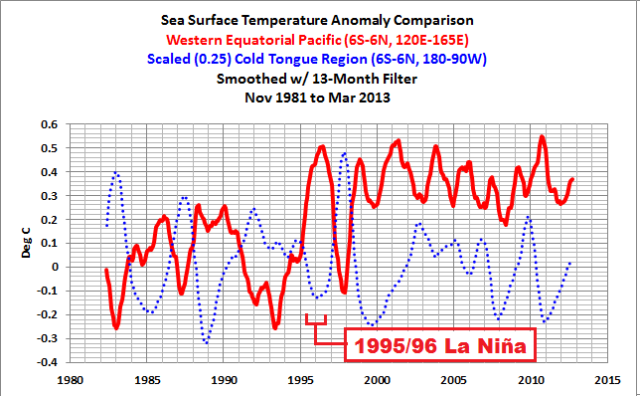
Figure 3
I’ve been showing the same upward shift in the ocean heat content data of the tropical Pacific for more than 3 years. I’ve added scaled tropical Pacific ocean heat content data (24S-24N, 120E-90W) for the depths of 0-700 meters to the comparison graph in Figure 4. (The ENSO-related variations in tropical Pacific ocean heat content take place in the top 300 meters, so we’ve captured them with this depth.) In response to the major El Niño and La Niña events, the larger variations in the sea surface temperature anomalies of the western equatorial Pacific and the ocean heat content for the entire tropical Pacific mimic one another. But there appears to be an additional seasonal component in the sea surface temperature anomalies of the western equatorial Pacific.
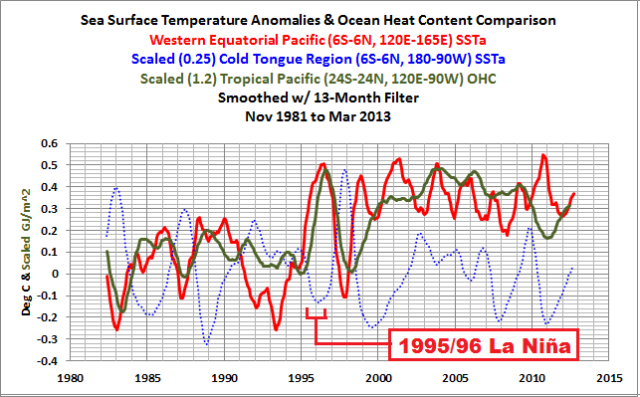
Figure 4
A REMINDER ABOUT THE 1995/96 LA NIÑA
As you’ll recall from earlier posts, when looking at the sea surface temperature anomalies of the Cold Tongue Region, the 1995/96 La Niña was not strong, but there were unusually strong trade winds in the western equatorial Pacific. According to McPhaden (1999) The Evolution of the 1997/98 El Niño:
For at least a year before the onset of the 1997–98 El Niño, there was a buildup of heat content in the western equatorial Pacific due to stronger than normal trade winds associated with a weak La Niña in 1995–96.
Stronger trade winds reduce cloud cover, which allows more sunlight to warm the tropical Pacific. All of that warm water then collects in the west Pacific Warm Pool.
And as you’ll further recall, the 1995/96 La Niña created the warm water that fueled the 1997/98 El Niño. In turn, the 1997/98 El Niño released enough of that naturally created warm water from below the surface of the western tropical Pacific to temporarily raise the sea surface temperatures of the East Pacific (90S-90N, 180-80W) about 0.5 to 0.6 deg C. See Figure 5. Keep in mind the East Pacific from pole to pole covers about 33% of the surface area of the global oceans. And there was enough naturally created warm water left over from the 1997/98 El Niño to cause the sea surface temperatures of the Atlantic, Indian and West Pacific oceans (the rest of the global oceans) to warm about 0.19 deg C, Figure 5—where they remained until the next strong El Niño in 2009/10.

Figure 5
##########
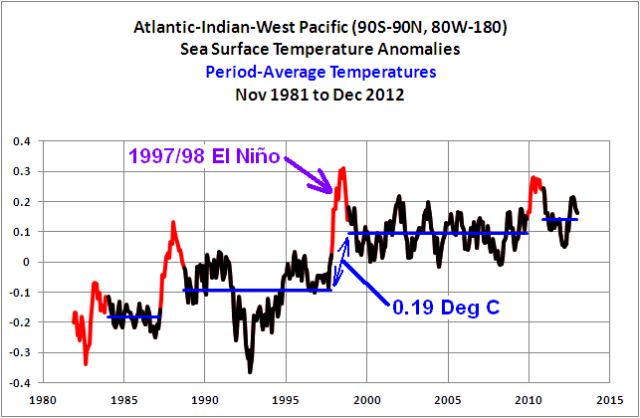
Figure 6
FURTHER INFORMATION
If this subject is new to you, refer to my illustrated essay “The Manmade Global Warming Challenge” [42MB], which was introduced here.
For a much more-detailed discussion, refer to my ebook Who Turned on the Heat, (US $8.00), which was introduced in the post here.
SOURCES
The Reynolds Optimum Interpolation sea surface temperature data (v2) is available through the NOAA NOMADS website and the KNMI Climate Explorer. The KNMI Climate Explorer is also the source of the NODC Ocean Heat Content data (0-700m) used in this post.
Stronger trade winds reduce cloud cover, which allows more sunlight to warm the tropical Pacific.
Once again it’s clouds. It looks like the circulation speed of the Hadley Cells regulates the tropical/subtropical climate, which in practice means the entire climate.
Your science is more interesting than all the models and proxy studies that mainstream climate science, so-called, has created to date. Your work is revealing the natural regularities that are ENSO. Of course, those natural regularities are made up of many lesser natural regularities. I wish some climate scientist with the big bucks would undertake serious empirical research on some aspect of what you are revealing.
Now, my mind is cloudy, trying to remember what drawer my slide rule is in.
I keep my slide rule in an old trunk in the basement. I know right where it is, even though I haven’t looked at it in 20 years. I have an HP48gii that’s more convenient.
I’m interested in the speed that the warm water (accumulated in the Western Pacific from equatorial sunshine and trade winds during La Nina events) must travel at in order to cross from the west to east Pacific during the course of an el Nino event.
As Bob reminds us, the Pacific is about half the world wide, i.e. 20,000 km (sorry I’m from Europe!) Let’s say it travels on average just half that distance, 10,000 km, to transfer that warmth from west to east Pacific. Then, depending on how much time it takes for an el Nino to develop, that hot west water actually travels at quite impressive speeds.
How fast the water travels depends on how long the el Nino takes to develop.
(a)1 month: then the water travels at 10,000 / 30 days = 13.9 km / hr (human fast running speed)
(b) 2 months: 10,000 / 60 days = 6.9km / hr (human jogging speed)
(b) 3 months: 10,000 / 90 days = 4.6 km/hr (human walking speed)
Plus this is against the direction of the trade winds. OK – the trades are weakened in an el Nino but not quite non-existent or in reverse.
The reason I’m saying this is that I am doubtful that the entire of the east Pacific surface warming during el Nino is due to immigrant warm water from the west. Some is, certainly, but some is also due to the interrupted upwelling in the east Pacific, cutting off the east Pacific surface from the normal supply of deep cold water. The isolated surface water is more static and can be warmed by the sun.
THE SUN!! You’ve forgotten that the entire east Pacific is blackened by cloud during an El Nino so that being at the east Pacific in an el Nino is the same as being at the south pole in June i.e. total darkness. But again I find myself doubtful of this. My guess would be that the odd chink of sunshine occasionally peeked through the apocalyptic el Nino cloudbanks and did slightly warm the east Pacific.
I wonder if its possible to surf from Australia to Peru during an el Nino?
The greatest thing I learnt in a degree in Earth Sciences is just how damned big the planet is. It still awes me though, to consider the Pacific Ocean, or a continental plate, or a mountain range.
phlogiston says: “I’m interested in the speed that the warm water (accumulated in the Western Pacific from equatorial sunshine and trade winds during La Nina events) must travel at in order to cross from the west to east Pacific during the course of an el Nino event.”
An equatorial Kelvin wave typically moves at about 2.8 meters per second (about 6.3 miles per hour) and can travel the distance between New Guinea in the west and South America in the east in about two months.
Obviously the climate/weather swings as a result of the ENSO cycle dwarfs any anthropogenic effect. The climate has “run-away” and ended up in a zone dominated by the pacific ocean oscillations.
To get an idea of just how large the Pacific Ocean is and the role it consequently plays on the world climate and weather and on a biological and humanity’s social scale with it’s immense size and consequent separation of continents, biospheres and peoples.
Take one of those World globes on it’s tilted stand.
Place the globe so the equator is at or just above eye level with the North Pole tilted directly away from you.
Turn the globe until you have the full Pacific Ocean facing you and stand back a couple of metres.
The only land mass you will see in it’s entirety is New Zealand along with a scattering of the Pacific Islands .
Partial land masses seen will be the Pacific facing half of the Antarctic continent, the eastern half of Australia and the eastern tip of New Guinea on the left / western side of the Pacific.
And the south western side of South America and the very western edge of North America on the right hand / eastern side of the Pacific Ocean.
The rest is water.
Looking at the global map in this way I find is a very humbling experience when I realise just how large the Pacific Ocean is in global terms and just how insignificant and pathetic all our human hubris really is when measured against the immensity of nature..
An immensity of ocean at our back door and almost literally under our feet but which we know less about than we do about the Moon. .
OK…I’ve seen Bob make this statement several times; “…And there was enough naturally created warm water left over from the 1997/98 El Niño to cause the sea surface temperatures of the Atlantic, Indian and West Pacific oceans (the rest of the global oceans) to warm about 0.19 deg C…” without a joining explanation of *how* the water in the Pacific jumps across to the Atlantic. Now, I’m being a bit sarcastic, but an explanation as to how this phenomenon occurs would be helpful.
Also, I think it would be very interesting to see an animation of a combined El Nino/La Nina cycle with the surface winds, ocean surface temps & ocean surface currents overlapped to see how each correlates with each other.
Jeff
Thank you Bob,
I have found that it always helps understanding to have different views of any physical phenomenon.
Our dear Director of the Climate Institute, Mike MacCracken, a computer model geek has today offered his enlightened views on atmospheric circulation in the Yahoo skeptic group:
“Well, probably both. The colder air from high latitudes spreads out due to it density, spreading to middle latitudes, overall reducing the pressure in high latitudes, so pulling air north. Yes, the warm air at lower latitudes needs to move as well, so it pushes into the higher, cooler latitudes.
Mike”
Illuminating. And this guy lectures about climate…
JKrob says: “’…And there was enough naturally created warm water left over from the 1997/98 El Niño to cause the sea surface temperatures of the Atlantic, Indian and West Pacific oceans (the rest of the global oceans) to warm about 0.19 deg C…’” without a joining explanation of *how* the water in the Pacific jumps across to the Atlantic.”
Hi JKrob: Sorry to direct you to an earlier post, but please refer to the discussion of the North Atlantic, for example, below Figure 22 in the following post:
http://bobtisdale.wordpress.com/2013/01/25/untruths-falsehoods-fabrications-misrepresentations/
Regards
JKrob, PS: The only animation I know of that fits the bill deals with the 1997/98 El Nino:
Thanks, Bob T.; well done.
~~~~~~~~~~~~~~~~~~~
ROM says:
April 14, 2013 at 5:17 pm
“Take one of those World globes on it’s tilted stand.”
No need to encourage theft!
You do realize folks that own slide rules likely have World globes somewhere in the house. Others not so much.
Some years ago at a summer school workshop for public school teachers the local collage instructor had the Geography Department buy a half dozen such globes. No one thought to lock them up at the end of the week and when the teachers left town – the globes went with them – allegedly!
Here’s a look; best I could do on short notice.
http://www.weatheroffice.gc.ca/data/satellite/goes_gwdisk11_1070_100.jpg
Philip Bradley (April 14, 2013 at 2:39 pm) quoted Bob…
“Stronger trade winds reduce cloud cover, which allows more sunlight to warm the tropical Pacific.”
…and then added:
“Once again it’s clouds.”
Check out how the Warm Pool lights up:
Takahashi, Y.; Okazaki, Y.; Sato, M.; Miyahara, H.; Sakanoi, K.; Hong, P.K.; & Hoshino, N. (2010). 27-day variation in cloud amount in the Western Pacific warm pool region and relationship to the solar cycle. Atmospheric Chemistry and Physics 10, 1577-1584.
http://www.atmos-chem-phys.net/10/1577/2010/acp-10-1577-2010.pdf
Speaking of warm water heading east, I have noticed the ENSO needle on this page finally has moved to the El Niño side of the neutral section.
Always good stuff, Bob.
What amazes me is that NASA can produce such an informative video (Tisdale 6;34 pm) and at the same time engage in such outrageous data tampering as noted in Don Easterbook’s rebuttal to the WWU cabal, and referenced at http://stevengoddard.wordpress.com/data-tampering-at-ushcngiss/
Is this a case of the right hand not knowing what the left is doing, or just a spectacular case of cognitive dissonance?
Fascinating animation, btw, and I’m curious what you think of this site and their presentation of the ENSO phenomenon: http://www.srh.noaa.gov/jetstream/tropics/enso_patterns.htm it seemed rather helpful to me at least.
JKrob: the waters warmed in the pacific wind up circulating through the indian and atlantic distributing heat as they go.
Hmmm, I’ve seen it mentioned that the closing of Panama was one of the most significant changes in the past several million years, given how fascinating it seems to me, I wonder how much you’d give to see those conditions yourself, Bob?
peterg says:
April 14, 2013 at 4:37 pm
“Obviously the climate/weather swings as a result of the ENSO cycle dwarfs any anthropogenic effect.”
The signal to noise ratio can be very low, but the secular trend of a relatively small rising signal will eventually “dwarf” the noise. So to say ENSO “…dwarfs ANY anthropogenic effect…” is not correct. In the long term, it could only dwarf a tiny “anthropogenic effect”. Given enough time, it couldn’t even do that.
Question for Bob Tisdale: Does ENSO add or subtract energy from Earth’s climate system, or does it just move energy around within that system? JP
“It’s difficult to express how enormous El Niño and La Niña events are. Often, when discussing them, I’ll display a map of the tropical Pacific (see example here) and write something to the effect of, the equatorial Pacific or the tropical Pacific stretches almost half way around the globe. But that really doesn’t show up very well with a map.”
=========================
You might want to look into equal area projections. In particular, I think the second map in thie Wikipedia article at https://en.wikipedia.org/wiki/Lambert_cylindrical_equal-area_projection might be suitable for properly illustrating the size of the waters affected by El Nino. How, as a practical matter, do you transform a Mercator projection into an equal area projection? I haven’t a clue.
Does this wave actually move warm water in its direction of propagation at 2.8m/s ?
John Parsons says: “Does ENSO add or subtract energy from Earth’s climate system, or does it just move energy around within that system?”
ENSO adds heat to the oceans at depth. The ocean heat content data for the tropical Pacific and the tropics indicate that the 3-year La Nina events of 1954-57, 1973-76 and 1998-01, along with the freakish 1995/96 La Nina, are responsible for the warming there. Without the 1973-76 and 1995/96 La Ninas, the tropical Pacific would cool over the long term:
http://oi47.tinypic.com/2coogo7.jpg
I should also be able to create a similar graph for the tropical ocean heat content, though I haven’t done so yet. Refer to the negative trends between the 3-year La Ninas:
http://oi50.tinypic.com/egaj4w.jpg
Réaumur says: “Does this wave actually move warm water in its direction of propagation at 2.8m/s ?”
Downwelling Kelvin waves carry warm water east along the equator. If an El Nino results and the Equatorial Counter Current strengthens to carry more warm water east, I’m not sure about the speed of that current. It should depend on the strength of the westerlies.
The two Kelvin waves that preceded and initiated the 1997/98 El Nino show up very well in the following sea level anomalies animation from JPL. They start at about the 0:50 time mark:
Also, the Rossby wave that carries the leftover warm water back to the western tropical Pacific (at about 10N) after that El Nino travels considerably slower. (It forms at about the 1 minute mark.) If memory serves, it takes about 6 months for it to cross the Pacific from east to west.
Regards
This made me revisit the AGU poster from Chiodi and Harrison on “OLR-based El Niño and La Niña indices”. The paper was discussed here: http://wattsupwiththat.com/2013/02/19/noaa-demonstrates-that-el-nino-has-more-impacts-than-climate-on-winter-weather-in-the-usa/ and a (heavy!) PDF from the poster is here: http://fallmeeting.agu.org/2012/files/2012/12/OLR-LN-EN.pdf
However, the 95/96 La Niña didn’t have enough clear sky days to meet their criteria for an “OLR La Niña”.
ROM says: “Take one of those World globes on it’s tilted stand. Place the globe so the equator is at or just above eye level with the North Pole tilted directly away from you. Turn the globe until you have the full Pacific Ocean facing you and stand back a couple of metres.”
If you have Google Earth, you can do the same. Simply enter the coordinates of 0,-160, and the globe should be presented similar to the following:
http://i48.tinypic.com/34q8rp0.jpg
Bob, I’d say you’ve done a particularly good job on this post. This has triggered some insights that are probably better discussed elsewhere. Regards.
Bob Tisdale says:
April 15, 2013 at 2:18 am
If an El Nino results and the Equatorial Counter Current strengthens to carry more warm water east, I’m not sure about the speed of that current. It should depend on the strength of the westerlies.
==============
The Equatorial Counter Current is sufficiently fast that it has been proposed as a method for sailboats to travel east along the equator. By deploying a drogue at depth on a line, it has been proposed that sailboats could travel east at speeds greater than could be achieved under sail.
A cruising sailboat averages about 100 nautical miles a day. Less in adverse winds. More in favorable winds.
Bob Tisdale, Thanks for taking the time to address a few questions. Above, I asked:
“Does ENSO add or subtract energy from Earth’s climate system, or does it just move energy around within that system?”
You replied: “ENSO adds heat to the oceans at depth.”
Can I conclude from that answer that ENSO does NOT add energy to Earth’s climate system, but rather just moves energy around within that system?
Thanks Again for your interesting post(s).
JP
phlogiston says: “I’m interested in the speed that the warm water (accumulated in the Western Pacific from equatorial sunshine and trade winds during La Nina events) must travel at in order to cross from the west to east Pacific during the course of an el Nino event.”
Bob Tisdale says: “An equatorial Kelvin wave typically moves at about 2.8 meters per second (about 6.3 miles per hour) and can travel the distance between New Guinea in the west and South America in the east in about two months.”
Having taken a purse seiner from Solomon Islands to Guam, equipped with a machine that could measure the speed and direction of water at various depths via doppler, (this was needed to prevent “roll-ups” of the enormous net used in equatorial waters) I was fascinated to see that the current could be (say) 0.9 knots and heading 045 degs at the surface, and 6 (!) knots and 090 at 150 metres down, in the waters north of Bougainville. Sometimes the surface water was travelling in the opposite direction to the deeper water. From memory, the Doppler went down to about 300 metres.
BTW, Bob, excellent post!! Fascinating.
Bob, do you know of any animations of these maps to which Bill Illis has previously drawn our attention?
http://www.cpc.ncep.noaa.gov/products/GODAS/mnth_gif/xy/mnth.anom.xy.u15m.1997.10.gif
http://www.cpc.ncep.noaa.gov/products/GODAS/mnth_gif/xy/mnth.anom.xy.u15m.1998.05.gif
(Too bad they don’t go back further in time to illustrate the ~20-year-spaced recurrences you’ve listed above.)