Alternate Title: On Pinker et al 2005 and the Positive Trend in the NCEP-DOE Reanalysis-2 Surface Downward Solar Radiation Flux
Over at Tallbloke’sTalkshop, Tallbloke has a post about the Pinker et al 2005 paper “Do Satellites Detect Trends in Surface Solar Radiation?” I’ve included (cross posted) that post in this one. Second, a positive trend also appears in the NCEP-DOE Reanalysis-2 Surface Downward Solar Radiation Flux data that’s available through the NOAA NOMADS website, though the positive trend is not as significant. Not too surprising, the multi-model ensemble mean of the climate models prepared for the IPCC’s upcoming 5th Assessment Report (AR5) do not show an increase in downward solar radiation at the surface. Another model failure to add to the ever-growing list?
First, Tallbloke’s post: Keep in mind, the satellite-based surface solar radiation flux “data” presented in Pinker et al is not based on direct measurements. It is calculated primarily from ISCCP cloud amount data. [I’ve added figure numbers to the following illustrations for my post.]:
Pinker et al: Do Satellites Detect Trends in Surface Solar Radiation?
Errrmm, why I have not heard of this 2006 [sic] paper before? 1.6W/m^2 per decade is a not insignificant trend. Did the IPCC ignore this?
Do Satellites Detect Trends in Surface Solar Radiation?
R. T. Pinker,1 B. Zhang,2 E. G. Dutton3
Abstract
Long-term variations in solar radiation at Earth’s surface (S) can affect our climate, the hydrological cycle, plant photosynthesis, and solar power. Sustained decreases in S have been widely reported from about the year 1960 to 1990. Here we present an estimate of global temporal variations in S by using the longest available satellite record. We observed an overall increase in S from 1983 to 2001 at a rate of 0.16 watts per square meter (0.10%) per year; this change is a combination of a decrease until about 1990, followed by a sustained increase. The global-scale findings are consistent with recent independent satellite observations but differ in sign and magnitude from previously reported ground observations. Unlike ground stations, satellites can uniformly sample the entire globe.
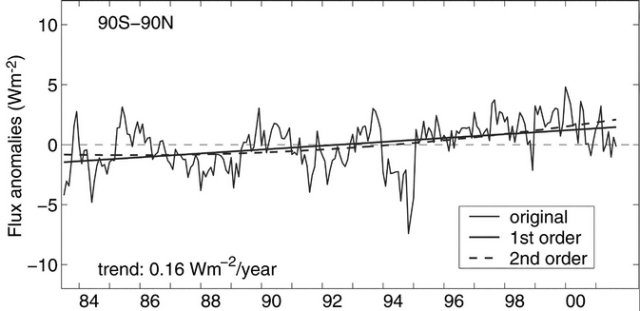
Figure 1 (Figure 1 from Pinker et al)
[END OF CROSSPOST]
As blogger Roger Andrews noted in his April 11, 2013 at 3:29 am comment at Tallbloke’sTalkshop:
According to Pinker et al’s Figure 5, reproduced below for reference, solar radiation over the oceans increased by about 5 w/m2 between 1983 and 2001 while solar radiation over land areas decreased slightly. How does this happen?
Figure 2 (Figure 5 from Pinker et al)
Also, does anyone have an explanation for the abrupt +/- 10 w/m2 downward excursion in the ocean record in 1994?

INTRODUCTION TO THE NCEP-DOE REANALYSIS-2 SURFACE DOWNWARD SOLAR RADIATION
The NCEP-DOE Reanalysis-2 is discussed in the 2002 Kanamitsu et al paper NCEP-DOE AMIP-II Reanalysis (R-2). The reanalysis begins in 1979 and at present runs through March 2013. Surface Downward Solar Radiation (radiation from the sun at the surface of the Earth) is one of the NCEP-DOE Reanalysis-2 fields available through the NOAA NOMADS website here, where it’s identified as “DSWRFsfc * surface Downward solar radiation flux [W/m^2]” in the drop-down “Fields” menu. Kanamitsu et al identifies Chou (1992) “A solar radiation model for use in climate studies” and Chou and Lee (1996) “Parameterizations for the absorption of solar radiation by water vapor and ozone” as the bases for the surface downward solar radiation flux outputs.
The NOAA NOMADS website allows users to select global coordinates for the desired outputs, so we’ll look at a few subsets in addition to the global values. The outputs are presented by the NOAA NOMADS website as absolute values, so I’ve converted them to anomalies using the base years of 1981-2010.
Keep in mind, this reanalysis is the output of a computer model—one that includes measurements (data) as inputs. It’s is not “raw” observations-based data.
GLOBAL
Figure 3 shows the global surface downward solar radiation flux anomalies from January 1979 to present, based on the NCEP-DOE Reanalysis-2. I’ve also included a linear trend line, which shows that the global values increased at a rate of about 0.22 Watts/m^2/decade since 1979, which is significantly less than the trend for the shorter period presented by Pinker et al (2005). The output includes lots of variability, what some would consider noise, so I’ve smoothed the output values with a 13-month running average filter in Figure 4.

Figure 3
##########

Figure 4
MODEL-REANALYSIS COMPARISON
Surface downward solar radiation is one of the variables from the CMIP5-archived climate models that are available through the KNMI Climate Explorer. Refer to the Radiation Variables, where it is identified as “rsds”. As you’ll recall, the CMIP5 archive is being used for the IPCC’s upcoming 5th Assessment Report (AR5). According to the multi-model ensemble mean of the CMIP5-stored models, using the RCP6.0 scenarios, the downward solar radiation at the surface should have been flat (decreasing slightly) during this period, if manmade greenhouse gases were responsible for global warming. But based on the Pinker et al (2005) paper and the NCEP-DOE Reanalysis-2, surface downward shortwave radiation increased significantly. The linear trends of the CMIP5 multi-model mean and the NCEP-DOE reanalysis are compared in Figure 5. Both model outputs have been smoothed in Figure 6.
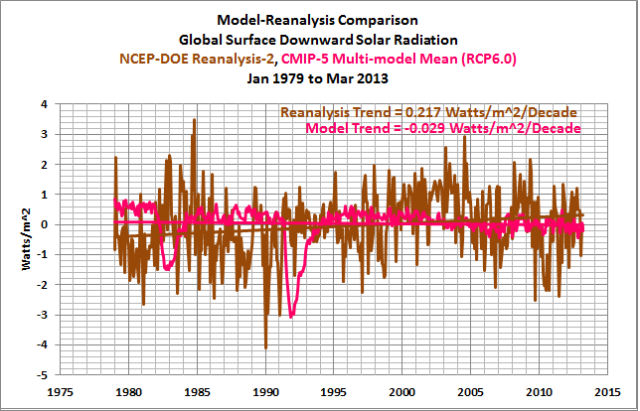
Figure 5
##########
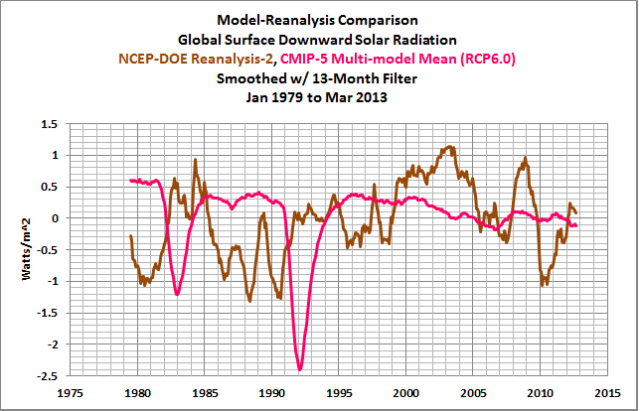
Figure 6
REANALYSIS COMPARISON – TROPICS VS EXTRATROPICS
In this preliminary look at the surface downward solar radiation outputs from the NCEP-DOE Reanalysis-2, I’ve also broken down the globe into 3 subsets: the Tropics (24S-24N) and the Extratropics for the Northern and Southern Hemispheres (24N to 90N and 90S to 24S, respectively). The Northern Extratropics show little trend in surface downward solar radiation, Figure 7, while Tropics at 0.28 Watts/m^2/Decade and Southern Extratropics at 0.32 Watts/m^2/Decade both show significant increases in downward solar radiation at the surface. I’ve smoothed the outputs for the three regions in Figure 8.

Figure 7
##########
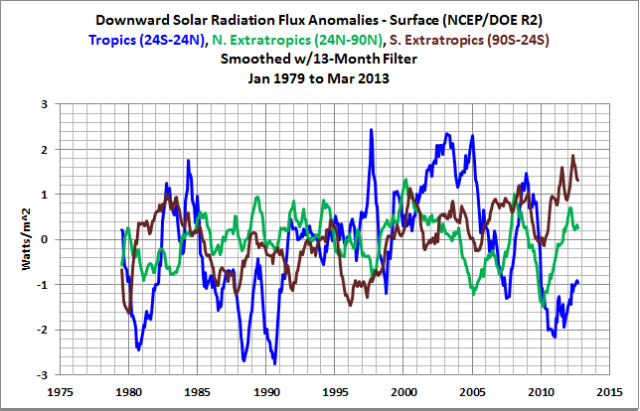
Figure 8
The tropical and extratropical regions are presented individually in Figures 9 through 11 for anyone interested.

Figure 9
##########

Figure 10
##########

Figure 11
ADDITIONAL READING
On the thread at Tallbloke’sTalkshop, blogger Ned Nikolov in his April 10, 2013 at 11:37 pm comment also recommended Wild (2009) Global dimming and brightening: A review, and Pallé et al (2009) “Interannual variations in Earth’s reflectance 1999–2007”.
CLOSING
If there has been a rise in surface downward solar radiation since the late-1970s, early-1980s somewhere between the magnitudes presented by the NCEP-DOE Reanalysis-2 and Pinker et al (2005), then the hypothetical impacts of manmade greenhouse gases have obviously been overstated—especially when one considers that the IPCC’s climate models used for the attribution of global warming failed to simulate this rise in downward solar radiation at the surface over that period.
Another climate model failure comes as no surprise. In our earlier model-data comparisons, the CMIP5-archived models failed to properly simulate:
1. Satellite-era Sea Surface Temperatures
2. Global Land+Sea Surface Temperatures Since 1900
3. Satellite-Era Precipitation
To paraphrase Edwin Starr’s song “War”:
Climate Models. What’re they good for? Absolutely nothing.
‘Climate Models. What’re they good for?’
Telling one how little one understands about climate?
No matter that the forecasts are wrong. The UN needs them for planning purposes.
Frankly, I doubt if there is any significance to the trend lines on any of these charts. I don’t see any error bars or uncertainty statements, but as noisy as these charts look, I will bet dollars to donuts that the slopes are not statistically significantly different from zero.
Are the ‘First’ and ‘Second’ points in the opening two paragraphs transposed just to filter for people still drinking their coffee this morning? 😉
Excellent work Bob, thanks for taking this up. The calculation I did a few years ago of the extra forcing on the ocean required to achieve the 1993-2003 increase in sea level due to the steric component shown by the Colorado.edu satellite altimetry was around 4W/m^2. On WUWT, other commenters were convinced I’d made an order of magnitude error and that it should be 0.4W/m^2
I note that the Palle et al, Wild and Pinker papers go a long way to vindicating my position. Clearly the Colorado dataset is biased high for the seal level rise rate, but equally clearly, the biggest cause of the increase in rise rate was diminished cloud cover, not increased airborne co2.
Another convincing piece of research suggesting greenhouse gas warming effects could have been overestimated. But will our government’s scientific advisors draw it to their master’s attention? I wonder.
Geoff Withnell:
Huh? The error bars you refer to lie on an intra-yearly scale, not a multi-decadal scale since drift has never been reported as an issue. The climate system is noisy…are you expecting otherwise? If the data set were not noisy, I would be concerned.
Baseless assumptions like yours above do not further scientific understanding.
It has no sense to compare Pinker trend until 2005 with the trend of the longer record until 2012, when there is a clear peak around 2005. The peak in solar matches well with North Atlantic SST/OHC.
“clearly, the biggest cause of the increase in rise rate was diminished cloud cover, not increased airborne co2”
Yeah but, no but, yeah but, what if it were the CO2 wot dun it, ‘cos ti sucked up the extra ‘eat and wotsits and like it made the clouds go down and all?
“Also, does anyone have an explanation for the abrupt +/- 10 w/m2 downward excursion in the ocean record in 1994?”
No explanation by a layman’s guess. It could be the combination of Mt Pinatubo’s (persistent) aerosols increasing low cloud cover: http://www.sciencestew.com/articles/climate/CloudCover.jpg
I am willing to bet that equatorial DSR has predictive capabilities of global DSR. If that is the case, the most important measure we need to focus on is equatorial DSR. I would concentrate on seasonal measures to determine which set of 3 to 4 month running averages or just a seasonal set of months (IE AO-style), turns out to be the most powerful (IE MJJ? JJA? MJJA? etc). This would be an important addition to El Nino/La Nina measures since many times these measures are in neutral territory. However, figuring out with the equatorial clouds are doing during “neutral” conditions should be very useful.
philr1992 says:
April 12, 2013 at 6:46 am
Geoff Withnell:
Huh? The error bars you refer to lie on an intra-yearly scale, not a multi-decadal scale since drift has never been reported as an issue. The climate system is noisy…are you expecting otherwise? If the data set were not noisy, I would be concerned.
Baseless assumptions like yours above do not further scientific understanding.
I’m not skilled enough in the art of climate science not to make some of Mr. Withnell’s baseless assumptions. The plots look awfully noisy. When I see data like that and am doing chemstry or process studies, I tend not to draw any conclusions until I have reduced the noise. When I have my environmental hat on and start to make data quality assumptions, I usually drink until I get over it. It sometimes seems that climate science is best taken with a good single malt.
Could opposing conclusions be drawn from the same data?
I like that- “Clearly the Colorado dataset is biased high for the seal level rise rate”- lol!
Great post Bob, looks like yet another huge hole in the IPCC ‘zombie conjecture’ of CO2 driving our climate – just a shame their conjecture is unfalsifiable. Nothing much left of it now, apart from a few threads of bandage blowing in the wind, and lots of corrupt politicians with their fingers in their ears shouting “La..la..la….” at the top of their voices.”
It’s time they called time on this scam, otherwise the public are likely to take matter into their own hands and get rid of the lot of them!
Geoff Withnell April 12, 2013 at 6:08 am
Frankly, I doubt if there is any significance to the trend lines on any of these charts. I don’t see any error bars or uncertainty statements, but as noisy as these charts look, I will bet dollars to donuts that the slopes are not statistically significantly different from zero.
OT but strangely, just as I was reading the words “dollars to donuts” a speaker on the radio said “dollars to donuts”. Douglas Adams would have enjoyed the moment.
Bob: Yes the plots are noisy, as they should be. The climate system is very noisy, removing noise is essentially just smudging/blurring reality.
Notice how variations in tropical/northern subtropical cloud cover precede variations the ONI by 6-18 months. This clearly demonstrates the fact that angular momentum (tied to Rossby wave amplitude and the annular modes) drives the pressure/circulation fields that modulate ENSO.
quote
Also, does anyone have an explanation for the abrupt +/- 10 w/m2 downward excursion in the ocean record in 1994?
unquote.
Yep, that’s surely a mystery. A real problem. Looks like the ocean areas are short of aerosols and something supplied them. Pinatubo, maybe. But why is the whole plot falling? That’s a mystery right enough. It’s almost as if there’s a shortage of aerosols over the oceans. Now whatever could cause that? You’d need to think of a mechanism that stops the waves breakling and reduces phytoplankton DMS production. Or something.
Nope, can’t think of anything.
JF
[sigh] Google NASA shiptracks.
Read the source paper, Pinker 2005. The “data” are so heavily processed that they have estimated errors in the 10 to 30 watt per square meter range. The errors are larger than the entire Y-scale ranges on these plots. Show some error bars, or at least give some indication of the real world variances. You need much larger Y-scales and try to apply some real world common sense to this.
For now, Withnell is just stating the obvious. There is not enough information to say anything, except that the trends are zero until shown otherwise.
bw:
re your post at April 12, 2013 at 9:41 am
http://wattsupwiththat.com/2013/04/12/the-sun-was-in-my-eyes-was-it-more-likely-over-the-past-3-plus-decades/#comment-1273391
I would not go there if I were you. The same is true of almost all climatological time series.
Almost nothing used as data in climatology has been measured to be significantly different from zero at 99% confidence, and – upon investigation – most claims of 95% confidence turn out to be unjustifiable.
Richard
I’m unable to open the paper, what is the spectral range of the instruments involved?
Solar dimming and brightening isn’t a new or obscure issue, there are many papers on the subject. For instance, Martin Wild, JGR 2009, “Global dimming and brightening: A review.” The article just before the Pinker article in Science is titled “From Dimming to Brightening:
Decadal Changes in Solar Radiation at Earth’s Surface.”
Human emissions of SO2 is the precursor for tropospheric ammonium sulfate due to human activies (volcanos are also a major, though intermittent, source of sulfate). Sulfate relects sunlight (as a whitish haze) on reasonably clear days, and causes clouds to become whiter than they would otherwise be on cloudy days, also increasing amoungs of sunlight reflected. Sulfate is not the only human emission which affects how much sunlight gets through to the earth’s surface, but it is the most important one. Coal and oil both have sulfur to varying degrees, depending on source and type of coal and oil. Power plants can remove virtually all sulfur emissions with the use of “scrubbers,” but scrubbers didn’t begin to be used in the US until the 1970s. Refineries can remove the amounts of sulfur in residual oil, gasoline, diesel, etc. So the amount of SO2 emissions in a given year depends upon how much of each fuel is burned, and the degree of SO2 controls at different parts of the system.
SO2 emissions from human activites rose and then stabilized for much of the 1970s through early 1980s. When the Soviet Union (and eastern Europe) governments fell, very dirty, heavily subsidized industries could no longer be heavily subsidized. So from 1989 through about 1991, there was a large drop in tropospheric sulfate from industrial activities. Throughout the 1990s, sulfate in the US and Western Europe fell because of acid rail laws. The 1990s is the decade when dimming stopped and brighening occured.
Sulfate levels began to climb again around 2000, as China began its long ramp up of coal use (with no SO2 controls) to power their economy. See figures in “Anthropogenic and natural contributions to regional trends in aerosol optical depth, 1980–2006”, by Streets et al, JGR 2009.
Another paper is “Aerosol and cloud effects on solar brightening and the recent rapid warming” by Ruckstuhl et al. GRL, 2008. Here is the Abstract:
“The rapid temperature increase of 1 degree C over mainland Europe since 1980 is considerably larger than the temperature rise expected from anthropogenic greenhouse gas increases. Here we present aerosol optical depth measurements from six specific locations and surface irradiance measurements from a large number of radiation sites in Northern Germany and Switzerland. The
measurements show a decline in aerosol concentration of up to 60%, which have led to a statistically significant increase of solar irradiance under cloud-free skies since the 1980s. The measurements confirm solar brightening and show that the direct aerosol effect had an approximately five times larger impact on climate forcing than the indirect aerosol and other cloud effects. The overall aerosol and cloud induced surface climate forcing is ~ +1 W meter squared per decade and has most probably strongly contributed to the recent rapid warming in Europe.”
There is also a 2010 collection of 23 articles which appeared in AGU journals on the issue of solar dimming and brightening:
http://www.agu.org/contents/sc/ViewCollection.do?collectionCode=DIMBRIGHT1
I’m also unable to open the paper, giant crabs, fattened on CO2, are attacking me…. great discourse by the way, thanks for posting!
Jean Parisot and CRS, Dr.P.H., let’s try another link:
http://tallbloke.files.wordpress.com/2013/04/science-2005-pinker-850-4.pdf
Please advise.
John says:
April 12, 2013 at 9:54 am
So do you also then agree that the EPA Clean Air Act has led to global warming and, since asthma rates have also exploded since the act, asthma attack too?
Pamela Gray says: “I am willing to bet that equatorial DSR has predictive capabilities of global DSR.”
Tropical and global DSR anomalies have a correlation coefficient of 0.89.
To DD More at 1:09 PM.
I think that most people who have spent some time in the climate field think that the reductions in sulfate have increased warming. There is debate about how much.
Asthma is a different subject, as far as I can tell, nothing to do with sulfates. But some percentage of asthma incidence and increases in asthma attacks appear to be related to intensity of exposure to vehicular emissions. See:
http://www.ncbi.nlm.nih.gov/pmc/articles/PMC2920902/
“Childhood Asthma and Exposure to Traffic and Nitrogen Dioxide,” Gauderman et al., Epidemiology, 2005
http://www.ncbi.nlm.nih.gov/pmc/articles/PMC2569108/pdf/ehp-116-1433.pdf
John:
In your post at April 12, 2013 at 1:32 pm
http://wattsupwiththat.com/2013/04/12/the-sun-was-in-my-eyes-was-it-more-likely-over-the-past-3-plus-decades/#comment-1273574
You say
“I think”
“most people who have spent some time in the climate field think”
Aha! So it is pure climate science.
How could anybody doubt such evidence?
Richard
On the original Tallbloke’s Talkshop, I have a long comment in which I detail inferred details, but I’ll summarize them here. From 1983 – 2001, Pinter says
1) there was a 0.16 W/m2-year rise in SI detected at surface. That is a gross 2.88 W/m2 over 18 years.
2. An amount detected at surface means that there was an additional, non-detected,portion absorbed by clear air that also leads to atmospheric heating; if this is a 20% of non-cloud SI (general literature),
3. then the total SI that is heating the atmosphere since 1983 is 3.6 W/m2 (2.88/0.8).
4. This number is that averaged over the surface of the Earth, though all SI only comes in on 50% of the Earth, the sun-lit side. Therefore,
4. The sun-lit side has increased the portion heating the atmosphere by 7.2 W/m2 on the sun-lit side. Some of this will be immediately reemitted, perhaps 50% or 3.6 W/m2 .
5. Whatever energy received BUT NOT REEMITTED on the sunlit side has to be reemitted on the dark, sunlit side if temperatures are to remain unchanged, i.e. the other 3.6 W/m2. Whatever is not reemitted by dawn the next day leads to warming the planet.
6. Stability will be reached and temperatures will stop rising when the re-radiation of both sides equals the increase in SI on the sun-lit side.
7. The 7.2 W/m2 increase in heating on the one side less the combined increase in re-radiation on both sides equals the portion that is warming the planet: only three measurements are needed for this, they need only to be relative to earlier times, but all must be planetary in coverage.
8. The SI vs GHG models are then falsifiable with energy balancing data. The darkside of the planet is the key: either the re-radiation increases (with SI) from the beginning or decreases initially (with GHGs) and then rising but with a continuing deficit, whole Earth deficit.
9. Under GHG increases, temperatures rise when more SI is absorbed than previously. Reradiation decreases initially from prior amounts, rising later, as temperatures rise, until the higher temperatures cause a higher rate of reradiation and stability occurs. If the GHGs continue to rise faster than the system can equalize temperatures, a reradiation deficit will increase.
10. With Pinter’s estimate of surface SI increases, the amounts under investigation are far of the 3.6 W/m2 level, greater thatn Trenberth’s missing 0.58 W/m2 (or some small number).
philr1992 says: “Notice how variations in tropical/northern subtropical cloud cover precede variations the ONI by 6-18 months.”
Looking at the extra wiggles in the DSR anomalies, there’s something other than ENSO influencing the variations, but when they’re in synch, for the Northern Extratropical DSR anomalies for example, I don’t see the 6-18 months:
http://i45.tinypic.com/28t9zc2.jpg
Regarding variables preceding sea surface temperature responses to ENSO events, changes in the trade wind anomalies in the western tropical Pacific (a function of ENSO) lead the variations in NINO3.4 sea surface temperature anomalies (ONI) by 3 months. NINO3.4 sea surface temperature anomalies also lag the Southern Oscillation Index by a couple of months. I have yet to find a variable that consistently leads NINO3.4 sea surface temperature anomalies by 6-18 months. Tropical DSR leads at times, but not consistently:
http://i46.tinypic.com/2j4suig.jpg
Regards
Some interesting cloudiness time series here:
http://www.climate4you.com/ClimateAndClouds.htm
Even Der Spiegel, ardent believers in the demonic properties of CO2, had an article telling their believers that according to DWD data Germany had in the interval 1980 – 2009 103% sun hours compared to the interval 1961 – 1990 (notice the overlap).
http://www.spiegel.de/wissenschaft/natur/neue-daten-fuer-alle-regionen-deutschlands-wahres-klima-a-700267-14.html
They were too stupid to realize that more sun hours just MIGHT be contributing to warming…
I’ve talked about my work calculating the difference between the daily increase in temperate and the following nights falling temp. I calculate this difference value for each station that has a valid measurement for the 2 days in question, and average this value across all of the station in the area I’m looking at. When you look at this change on a daily basis, by say North of 23 lat, you can see the change in this difference as the ratio of day and night change over the year. If you look at this rate of change from spring to fall, and fall to spring, you can derive a slope of this rate change, as shown in this chart.
Sorry, wasn’t done.
If you look at this rate of change from spring to fall, and fall to spring, you can derive a slope of this rate change, as shown in this chart.
If you compare this chart to your figure 10, the peaks seem to line up.
To Richardscourtney at 1:58 PM:
I answered the question about sulfate cooling colloquially, as if I was talking to the person who asked. You felt it wasn’t adequately scientific. So let me now be precise in my answer.
Increased sulfate in the atmosphere does cool the planet, whether the sulfate goes into the air because of volcanos or because of burning fuels with sulfur. The only question is about how much cooling.
Decreased sulfate causes the planet to get warm, again, the only question is about how much warming. No questions about the direction of the effect.
These effects occur, are true, whether or not the planet is in a cooling or warming phase. If earth is is warming, the sulfate effects don’t care what ever the cause of the warming might be. The sulfate effects are not a question of models, and are unrelated to CO2 effects. Sulfate in the atmosphere is pretty simple atmospheric physics, compared to the kinds of issues usually debated on WUWT.
Now, back to colloquial speaking. We got a pretty good sense of how much cooling from a major volcano eruption, after Pinatubo blew. From memory, earth cooled for about a degree F, for about 18 months, because the sulfate from Pinatubo went into the stratosphere, where it was able to stay aloft for a year or more. But human emissions don’t get nearly that high, and stay in the air about a week. The cooling effects from sulfate in the air from human activies are continuous, however, as new emissions go up every day to replace the emissions that are rained out or deposited every day. The result is a steady state of sulfate in the atmosphere. In contrast, if there hasn’t been a big volcano in the last year or so, there isn’t much sulfate in the air from volcanoes.
Richard;
Indeed. At 95%, what is being referenced? All tests of all factors, reported and published, or possible and not performed? Given a few of the above, it is inevitable some will look like significant results at the 1 in 20 chance level. The 95% standard is a statistical abomination, and I cringe every time I see it.
John:
Thankyou for your post addressed to me at April 12, 2013 at 3:43 pm.
http://wattsupwiththat.com/2013/04/12/the-sun-was-in-my-eyes-was-it-more-likely-over-the-past-3-plus-decades/#comment-1273683
Firstly, and very importantly your post changes the subject..
For the convenience of onlookers, I copy all of my all of my original post at April 12, 2013 at 1:58 pm
Clearly, my comment addressed the issue of opinion being presented as evidence.
It is NOT cogent evidence to say what you and “most people who have spent some time in the climate field think” about sulphate aerosols or about anything else.
More people than all those “in the climate field” think Santa Claus comes down the chimney to give them presents. And they can show you the presents as evidence. But all people “in the climate field” lack physical evidence for most of their assertions about sulphate aerosols.
Secondly, your post I am replying makes unreferenced and unsubstantiated assertions about sulphate aerosols.
Unfortunately, John, I know a little about sulphate aerosols. In fact everybody knows a little about them because nobody knows much about them. And things you claim are known are not. For example, you say
If you have any evidence that sulphate aerosol definitely causes cooling and not warming, then publish it. The IPCC would like to have it because they say they don’t know: their estimates are a range from slight warming to large cooling.
Indeed, sulphate aerosol combined with black carbon (i.e. soot) is estimated to have greater cooling effect than methane. If you had visited China then you would know that soot in the air is a serious pollutant, so your assertion about Chinese sulphates definitely causing cooling are especially problematic.
I strongly suggest that before making dubious assertions about sulphate aerosols you get up to speed by – as a first step – reading Chapters 2 and 7 of the IPCC AR4 Working Group 1 Report. You can access it at
http://www.ipcc.ch/publications_and_data/publications_and_data_reports.shtml
Richard
John:
I made a serious typo when I wrote to you
“Indeed, sulphate aerosol combined with black carbon (i.e. soot) is estimated to have greater cooling effect than methane.”
The correct statement is
“Indeed, sulphate aerosol combined with black carbon (i.e. soot) is estimated to have greater WARMING effect than methane.”
Sorry.
Richard
Just look at the cloud data, a 5% decrease between 1987 and 2000,
It explains 75% of the observed warming in the satellite period.
As mentioned above have a look at climate4you.com under clouds and climate!
Lots of figures an wriggly lines. What do they mean? Here are my guesses. Please tell me if any are right.
1. This is about the sunlight/heat that hits the surface of the earth, not the amount the sun emits.
2. Between 1983 and 2001, the amount hitting the land went down. The amount hitting the sea went up. (This answers the Walrus’ question about why the sea is boiling hot. His other question remains moot.)
3. From 1983 to 1990 the total went down, and then from 1990 to 2001 it went up. (But there is a lot more sea than land. If the amount hitting the sea went up during that period, the amount hitting the land between 1983 and 1990 must have been very low.) (And the Warmists can say that it wasn’t the sun that caused any global warming during that period.)
4. From figs. 5 and 6, the models get the amount of sunlight/heat hitting the surface of the earth completely wrong.
5. Skeptical Science will publish a piece showing that the models are right.
6. None of this will ever be mentioned on the ABC*. (Unless the answer to the Walrus’ second question turns out to be positive.)
(*The real one, not the American one.)
A Question: Since the satellite viewed the Earth’s surface and most of the ultraviolet spectrum that changes, approximately 6 percent, during solar minimum, was absorbed by the atmosphere; does this mean that most of the solar cycle changes were not recorded?
Bob Tisdale (or anyone),
I was trying to find your professional biographical information. Any help? JP
To Richardscourtney:
Black carbon is a very complicated subject. You probably saw a post on WUWT about a new study, about two months ago, which found that black carbon actually is the second most important greenhouse emission by humans, about 3 times more powerful in causing warming that previously thought. That was a 231 page journal article with 31 co-authors. The study counted all the interactions black carbon has, not just with sulfate (as you point out) but with organic carbon, and also taking into account changes in albedo when black carbon lands on white surfaces, like arctic sea ice.
Sulfate is complicated, too, but the complications only have to do with quantification of the cooling effect when sulfates are increased, or the warming effect when they are decreased. I stand by my statements.
John:
I am not pleased at your method of discussion.
At April 12, 2013 at 4:26 pm my post complained that you had changed the subject.
http://wattsupwiththat.com/2013/04/12/the-sun-was-in-my-eyes-was-it-more-likely-over-the-past-3-plus-decades/#comment-1273720
You had made assertions based on opinions and I complained that opinions are not evidence.
I also pointed out that those opinions concerning the certainty of sulphate cooling are plain wrong.
Your reply at April 12, 2013 at 6:51 pm changes the subject again.
http://wattsupwiththat.com/2013/04/12/the-sun-was-in-my-eyes-was-it-more-likely-over-the-past-3-plus-decades/#comment-1273806
You now want to deflect onto “complexity”.
Your recent post says to me
Oh, indeed I did. It is at
http://wattsupwiththat.com/2013/01/15/a-bit-of-a-bombshell-from-the-agu-igbr-black-carbon-is-a-larger-cause-of-climate-change-than-previously-assessed/
Had you read that thread then you would have seen this post from me.
/////////////////
richardscourtney says:
January 15, 2013 at 11:31 am
Anthony:
Your article says
and
Yes, it is precisely “a factor of two higher” and the IPCC were pressed into mentioning the smaller value in its 2007 Report. For example, this was one of my review comments.
Richard
/////////////////
John, do you see what I meant when I said I knew a little about this?
I will summarise by saying you are plain wrong.
1.
Opinions are not evidence.
2.
Sulphate aerosol probably cools but – as I pointed out – the IPCC admits the uncertainty includes warming.
3.
Sulphate aerosol combined with soot induces strong warming.
4.
China emits much sulphate aerosol and soot simultaneously and from the same sources.
John, you say
It is good that you choose to stand BY your comments because if you were to stand ON them then you would fall off.
Richard
To facilitate the solution of a multi-variable physical problem it is advisable to summarize the problem situation, including all observations, which might be related to the solution of the problem. We are currently focusing on the current climate change and have been pushed/anchored with the hypothesis that the 20th century warming was caused by atmospheric CO2 increases. It has been known for some time that the planet cyclically warms and cools, Dansgaard-Oeschger (D-O) cycles.
The following graph – Greenland ice temperature, last 11,000 years determined from ice core analysis, from Richard Alley’s paper – shows some of the past D-O cycles. As the graph indicates the past D-O cycles were not caused by changes to atmospheric CO2 and curiously it appears planetary temperature did not for the period shown in the graph correlate to atmospheric CO2.
http://www.climate4you.com/images/GISP2%20TemperatureSince10700%20BP%20with%20CO2%20from%20EPICA%20DomeC.gif
http://www.climate4you.com/
The D-O cycles have a periodicity of roughly 1450 years plus or minus 500 years. The late Gerald Bond tracked 23 of the D-O cycles – through the current interglacial period and into the last glacial cycle – and found that there is a significant solar magnetic cycle change at each and every D-O cycle. Interesting, the regions that warm the most during the past D-O cycles are the same regions that warmed in the 20th century. Let’s hypothesis that the 20th century warming is a D-O cycle and let’s hypothesis that the past D-O cycle and current D-O cycle were caused by solar magnetic cycle changes.
http://www.solen.info/solar/images/comparison_recent_cycles.png
http://www.solen.info/solar/images/cycles23_24.png
It has been known for some time that mid 1990 there is a reduction in planetary cloud cover.
Prior to 1994, planetary cloud cover more or less tracked changes to galactic cosmic rays (GCR) which are mostly high speed protons and solar wind bursts. The GCR create ions in the atmosphere which causes more low level clouds to form particularly over the ocean which is ion poor. (There are more ions over the continents as the crust is slightly radioactive.) The solar wind bursts create a space charge differential which removes cloud forming ions.
In 1994 something changed, there is a more or less step reduction in planetary cloud cover. The researchers thought initially the fairly sudden reduction in planetary cloud cover has a satellite measurement problem, after 20 years of work they have eliminated the instrumentation problems and confirmed there is believed to be a real reduction in planetary cloud cover during the period. Palle’s paper and the next review paper provides a partial explanation, however, there appears to be something fundamental that has been missed.
http://solar.njit.edu/preprints/palle1264.pdf
The possible connection between ionization in the atmosphere by cosmic rays and low level clouds
Fig. 3. Global monthly mean low cloud cover derived from ISCCP data for the period July 1983–September 2001 (dotted blue line). Superimposed are the same data filtered with a 12- month running mean (blue) and the detrended and filtered (red). The Climax station GCR flux is shown in black. All data are plotted as deviations from the mean for the full period and the cosmic ray flux is arbitrarily scaled.
This review paper Tinsley and Yu discusses the mechanisms by which changes to the solar heliosphere and changes to solar wind bursts modulate planetary cloud.
http://www.albany.edu/~yfq/papers/Yu_CR_CN_Cloud_Climate_JGR02.pdf
As geomagnetic field specialists have found that unexplained geomagnetic field changes correlate with past climate change events, the following is interesting.
There is an unexplained sudden change in the earth’s North magnetic pole (NMP) drift velocity and direction that coincides with the sudden reduction in planetary cloud cover. Based on long term measurement of the geomagnetic field for the last 144 years the geomagnetic field has meander, moving in no particular direction at 10 to 15 km/year. In 1994 the NMP drift velocity suddenly increased by a factor of 4 to 5 to 50 km/year and started to move in a more or less straight line towards Siberia. The geomagnetic field specialists are looking for an explanation for the factor of 4 to 5 sudden increase in the NMP drift velocity and hypothesis that there must be some hidden deep core plume that is moving up to the surface in the North pole region. The very high NMP drift velocity and direction of motion has continued for 19 years and is now starting to slow down, correlating with planetary temperature changes. The problem with the plume explanation is what would suddenly cause the plume to start up and what is now causing it to stop?
What Caused Recent Acceleration of the North Magnetic Pole Drift?
http://onlinelibrary.wiley.com/doi/10.1029/2010EO510001/abstract
“During the 1990s the NMP drift speed (William: NMP is an abbreviation for North Magnetic pole drift) suddenly increased from 15 kilometers per year at the start of the decade to 55 kilometers per year by the decade’s end. This acceleration was all the more surprising given that the NMP drift speed had remained less than 15 kilometers per year over the previous 150 years of observation. Why did NMP drift accelerate in the 1990s?
https://ams.confex.com/ams/pdfpapers/74103.pdf
The Sun-Climate Connection by John A. Eddy, National Solar Observatory
Solar Influence on North Atlantic Climate during the Holocene
A more recent oceanographic study, based on reconstructions of the North Atlantic climate during the Holocene epoch, has found what may be the most compelling link between climate and the changing Sun: in this case an apparent regional climatic response to a series of prolonged episodes of suppressed solar activity, like the Maunder Minimum, each lasting from 50 to 150 years8. (William: There is warming before the cooling events.)
Bob
I noticed a dramatic change in NH SST relative to SH SST after 2003 . A similar pattern happened during two previous global cooling periods ,namely 1880 -1910 and again 1940 to 1970. Could this be a common signal for the start of another global cooling as we have blogged about here many times . The NH SST starts to fluctuate significantly as the ocean temperatures drop and ultimately in a lagged way the atmosphere also cools . Then they come back together and move more in unison?[like 1970-2000]
http://www.woodfortrees.org/plot/hadsst2nh/from:1880/to:2014/plot/hadsst2nh/from:1880/to:2014/trend/plot/hadsst2sh/from:1880/to:2014/plot/hadsst2sh/from:1880/to:2014/trend
herkimer says:
April 13, 2013 at 8:27 am
There is a large cold spike ~1970-73 shown here in NCDC’s surface temperature data set. For a long time I thought this was just a series of bad data. A couple months back I went looking for it in the data, I didn’t find it per say, but I did find it in most of the records in northern Eurasia, across a number of countries (Russia, Siberia, and I believe Mongolia and China). far to many be be generic instrument error.
MiCRO
I don’t think it is an error as it covers a long period . You can see it better on this chart . The NH SST is shown in red . Notice the appearance of sudden series of sst tempertaure spikes after about mid 2003 . Are these just El Nino spikes ? Yet usually El Nino spikes show up quite similar in NH and SH[like 1997/1998 El Nino]
http://www.woodfortrees.org/plot/hadsst2nh/last:312/to/plot/hadsst2nh/last:312/to/trend/plot/hadsst2sh/last:312/plot/hadsst2sh/last:312/trend
Mi Cro
These NH SST spikes since 2003 look like annual or seasonal temperature spikes that did not exist during the previous decade before 2003 . What would cause the Northern Hemisphere SST to be nearly 0.3 C higher than SH SST. Is it because more heat is being drawn to the North pole . The ARCTIC SST seems to have the same pattern recently . Further evidence of where all the heat is going and why the rest of the globe is actually cooling while the Arctic is still warm.
Thanks Bob, I was able to open the second link.
After a quick, late night look – they don’t define the spectral range of their adsorbed energy. Is it normalized across all of the differing sensor platforms and experiments? Is it normalized at the radiant data center?
My original interest is in the spatial distribution of the data, but the radiation being measured (and modeled) also of interest to me.
Definitely imagine that that you said. Your favourite reason appeared to
be at the internet the simplest factor to be mindful of.
I say to you, I certainly get irked at the same time as other folks consider worries that they plainly don’t realize about. You controlled to hit the nail upon the highest and also outlined out the entire thing with no need side effect , other folks can take a signal. Will probably be back to get more. Thank you