Guest post by Nancy Green
Tamino claims he has added 3 spikes to the Marcott et al proxy data and the Marcott et al process detects them.
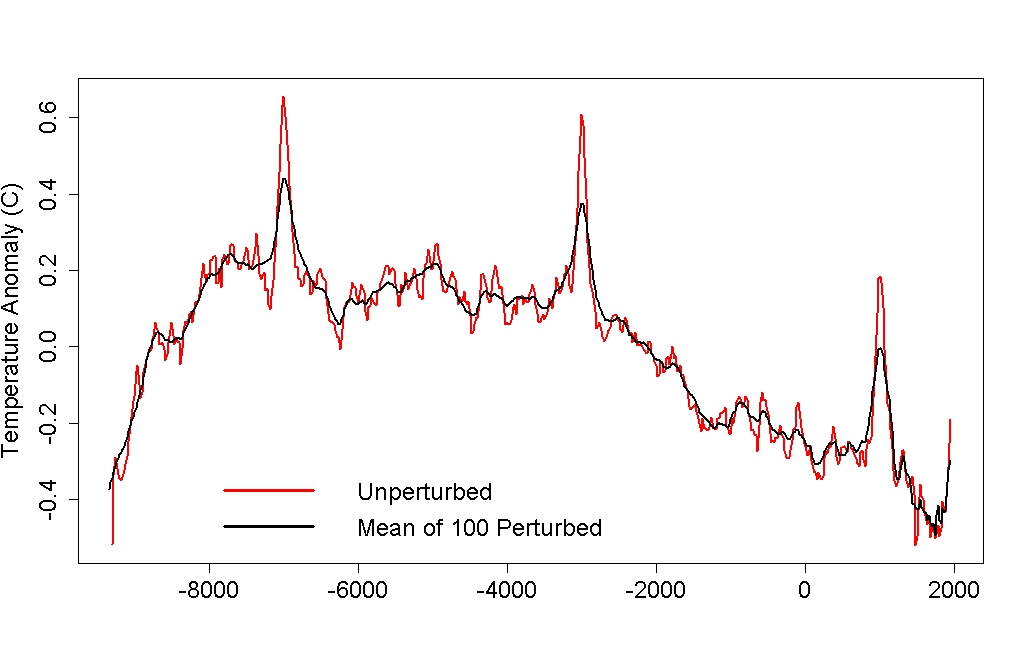
Source: http://tamino.files.wordpress.com/2013/04/many_vs_unpert.jpg
This, he then proposes, is proof that there are no 20th century spikes in the Holocene. This claim appears to run counter to a prediction I made recently in a WUWT post; that as you increase the proxy resolution you are more likely to find spikes.
See:
http://wattsupwiththat.com/2013/04/03/proxy-spikes-the-missed-message-in-marcott-et-al/
Having had my reply disappeared at Tamino’s site, I thought readers at WUWT might be interested. I don’t believe Tamino’s conclusion follows from his results. Rather, I believe he has demonstrated the truth of my original prediction. What needs to be understood is that adding a spike to the proxy data is not the same as adding a spike to the proxies. This is where people get confused.
The proxies are ocean cores or similar sitting in some repository. They are real, physical objects. To truly add a spike to the proxies you would need to travel back in time and change the temperature of the earth. This would then affect the proxies in some fashion, depending on the resolution of the proxies, how they respond regionally, including lags, gain or damping. The proxy response might also be affected by other unknown factors at the time that are not visible in the proxies. In other words, the spikes that you add to the proxies would have all the resolution problems that the proxies themselves have.
However, adding spikes to the proxy data is an entirely different animal. The proxy data is an abstract representation of the proxy. It is numbers drawn on a sheet of paper or electronic equivalent. Now you are adding (drawing) high resolution spikes onto low resolution proxy data, with no accounting for regional affects, lag, gain, damping or confounding factors. It should be no surprise at all that these high resolution spikes jump out. If they didn’t, it would point to a serious flaw in Marcott et al.
An analogy might help better understand the problem. Imagine for a moment that we are not dealing with temperature, but rather trying to detect planets around stars. We have before us a photograph of a star taken by a telescope on Earth. We look at this under the microscope. However, we find no planets because the telescope lacks the angular resolution to distinguish them from the star itself.
Now let’s go out to the star in question and add planets around the star and take more photos with our telescope. These planets are real objects. We know they exists. However, it will make no difference; we still can’t see the planets with our telescope. In this example we have added a spike to the actual proxy and it has made no difference.
Now let’s add a spike to the proxy data. Instead of placing planets around the star, take the photo from the telescope and draw a picture of a planet on it. This is an example of adding a spike to the proxy data. The photo is an abstract representation of the star and its planets, equivalent to the proxy data. Now examine the photo under a microscope and voila, the planet (spike) will now be visible.
What we are seeing in action is actually a form or misdirection used in stage magic. It fools us on the stage just as it does in science. It is our minds that create the confusion (illusion) between what the proxies actually are and what the proxy data actually is. The proxies are ocean cores – they are real objects. The proxy data is an abstract representation of the real object. However in our minds we are so used to dealing with real objects as abstract representations that we are fooled into thinking they are one and the same.
If anything, what Tamino has actually done is to prove the point of my original article. He has added high resolution spikes to the low resolution data and as predicted they are detectable. To conclude however that this somehow proves there are no 20th century type spikes in the Holocene makes no sense. As we have seen in this example, no matter how many planets you physically add around a star it makes no difference if you lack the resolution to detect them. This is no proof that they don’t exist. It is only after you examine them at sufficiently high resolution that they become visible.
Odd. It looks fine though my Foster Grant polarized lenses …
/sarc off
Tamino again demonstrates that he doesn’t understand what thinking people object to with regards to the CAGW hypothesis, and has faulty logic when it comes to analyzing scientific concepts. Sad, really.
Again: the kind of proxies being used record only long-term averages, NOT year by year temperatures. They are incapable of recording spikes, either upward or downward. Only someone either rather dense or deliberately obtuse could fail to understand this concept.
Same as failure to comprehend how UHI affects temperature records…
Tamino compares apples to oranges and comes up with a lemon.
If I understand, then temperature spikes during the formation of the core would be hidden due to the natural resolution inherent in that type of core. The spikes, though real, would not cause spikes in the data. So adding an artificial spike in the date afterwards tells us nothing about finding real spikes.
What Nancy says rings true. I’m not sure, but another example of what Nancy is saying might be to add a short-duration spike (inherently broadband) to broadband noise before lowpass filtering as opposed to adding a short duration spike to the broadband noise after it is lowpass filtered. In the former case, the high frequency components of the short-duration spike will be removed resulting in a smoothing over time of the spike; whereas the short-duration spike added after lowpass filtering contains all its original high frequency components.
In trying to defend press release statements about the Marcott paper, Tamino is effectively calling Marcott a liar. Tamino’s claim that 100-year-long temperature spikes would be preserved and detected in the Marcott reconstruction completely contradicts what Marcott said in his FAQ:
“We showed that no temperature variability is preserved in our reconstruction at cycles shorter than 300 years, 50% is preserved at 1000-year time scales, and nearly all is preserved at 2000-year periods and longer.”
Cute headline, and Tamino is indeed “out!”, but mostly because he butchered the calculation. Any data person knows that the spikes must spread when doing x-axis perturbations but Tamino’s did not — it’s an in-your-face flub and an embarassment to Tamino’s acolytes. But see Clive Best’s site for an authoritative demolition: http://clivebest.com/blog/?p=4833
Here is a chart of the Marcott-2013 cores – Elevation vs ProxyType & Core Name.
Color is by Category (NH, SH, Tropics), Shape by Proxy Type.
http://i47.tinypic.com/w7bfbc.png
Horizontal lines at sea level, -700 meters, and -2000 m. (key Argo depths)
There are 18 proxies from below -2000m,
29 proxies from -700m to -2000m
11 proxies from 0 to -700 m
10 proxies from 0 to +1000m
4 Proxies from above +2800 m. (Antarctic ice cap)
Knowing what we know of the thermal profile of the -2000m to -700m to sea level ranges of the ocean depths from the Argo Floats, How reasonable is it to expect that that the 47 proxies (out of 72) that come from below -700 m water depth are going to be able to see an atmospheric temperature spike of any kind? The Ocean’s heat capacity itself is one huge low pass filter.
Nancy Green says: “Having had my reply disappeared at Tamino’s site, I thought readers at WUWT might be interested.”
I had a look at Tamino’s site. It says that there are “166 Responses to Smearing Climate Data.” Yet there are only approximately 20 comments published.
Looks like there’s been a lot of comments disappearing without trace!
This is what I mean about the alarmists. They keep doing this sort of thing and, seriously, no one in their right minds can continue to claim they are doing so by mistake or by delusion. That would be like claiming the magician on the stage accidentally fools his audience with a trick he thought was real (therefore it’s science). Too much attention and hard work goes into this for it to be a genuine attempt at anything but conscious, deliberate misdirection.
Many of us are already calling “FRAUD”. When will everyone else see these alarmist “scientists” for what they clearly are?
AndrewS: your browser malfunctioned, I see all 166 comments. Mind you, I made 3 comments on that thread, all of which disappeared, and many others have said that all or most of their comments disappear. With Tamino’s butchery of the simple perturbation calculation, I’m no longer interested to go there — I require competence.
Another way of looking at the star analogy is to ask ‘what size planet would we need for it to show up in our telescope?’ given the resolution we have. Answer: a very big one, perhaps 100 times larger than Earth. Thus it still gives no answer as to whether there could be an Earth-sized planet.
Returning to Marcott, to get a proxy spike of +0.9 even before perturbation, the global temperature would eiether have had to have been +0.9 for a very long time (say 150 to 200 years), or MUCH higher for s shorter time (say +2 degrees for 80 years, or +3 degrees for 40 yrs). Such condititions are not representative of what we see in 20th C. If 20th C were included in Marcott, it would show a proxy value of around zero on their scale.
Thus, Tamino’s work still tells us nothing about whether 20th C scale changes ocurred during the past 11,500 years. Its main achievement is to give the ‘right’ answer for warmists – which of course is his aim.
Tamino’s friends are people who know him well but like him anyway. You can’t undo that with logic and precise science. None of them are interested and you are left preaching to the choir who are also unmoved. The only way to win is to not play the game – WOPR
I think you need to be a little careful with your Astronomy analogy. What you’re referring to (I believe) is astrometry in which you attempt to measure the motion of a star (by observing it’s position change on a photographic plate or CCD) around the center-of-mass of its planetary system. The problem is that the typical angular movement of a star about the center-of-mass of its planetary system is orders of magnitude smaller than the typical resolution of a telescope today. The correct analogy (in my opinion) would be trying to detect a temperature perturbation with a period of a few years. I completely agree that it is not possible to detect such signals in the Marcott et al. data. Given that the instrumental data suggests that we’ve been undergoing warming for the last 120-130 years, we’re interested in signals with a period comparable to the resolution of the data in Marcott et al. and so we would expect such a signal to have some noticeable effect even if we can’t actually determine its precise structure.
It’s like to be on a ship that’s sinking or running aground. A group of scientists and egineers are on the ship trying to figure out why it is sinking. They have trends and formulas. They argue day and night about facts left out,history charts, computer programs with wrong data, why it’s sinking and on and on it goes…
Then you have the ones on board that always denied the fact that it can sink and they are caught with their pants down.
You also have a smaller group that is prepared, acknowledge the fact, acts fast and survives.
(-:
Friends:
Grant Foster is unwilling to put his own name to what he does and, therefore, posts on his blog under the alias of Tamino. People don’t act under false names without reason, and it has always been clear that Foster is not proud of what he does on his blog.
Acting under the alias of Tamino, Foster has been pretending he has expertise in time series analysis and signal processing. And he has acquired a few acolytes who believe he has such expertise.
Foster’s attempted ‘defence’ of the Marcott paper demonstrates complete ignorance of fundamental principles of resolution and smoothing as they apply to time series data. This can only indicate that
(a) Foster is incompetent at time series analysis
or
(b) Foster is sure his acolytes are so devoted to him that they will accept blatant falsehood from him
or
(c) both (a) and (b).
Personally, I think it is (c).
Richard
Surely it’s easy for Tamino and otehrs to prove that the spike would appear on proxy data.
Just stop pretending history stopped in 1950, and show up-to-date proxies that really do show the 1950-2013 temperature traces with corresponding spike.
Since Marcott et al themselves tell us that this isn’t possible as the proxy resolution is too poor, why would anyone believe Tamino can detect a similar spike from 1000’s of year ago?
“What we are seeing in action is actually a form or misdirection used in stage magic”
Misdirection indeed. Grant Foster is competent enough to understand what he is doing is incorrect, yet he wilfully uses it to mislead people…
AndrewS says: ” had a look at Tamino’s site. It says that there are “166 Responses to Smearing Climate Data.” Yet there are only approximately 20 comments published.”
… and when anyone challenges his pseudo-scientific BS he just deletes the comment. If the author persists he bans them from posting.
This creates his own little microcosm of blog space where he is always right (even when he’s knowingly wrong) and he gets applause from a small fawning crowd of clapping seals that want to be reassured that we are indeed heading for ecological collapse of the biosphere.
Before his audience of intellectual toddlers he gets ooo’s and aaaw’s and much applause with his slight of hand tricks. When one of the audience shouts out “I can see the string” , he gets sent out of the room.
He is the majestic king In his little fantasy world, where none have the right to question him.
Someone suggested here recently this probably reveals a narcissistic character disorder. It certainly has nothing to do with science.
http://climategrog.wordpress.com/2013/03/11/open-mind-or-cowardly-bigot/
For the sake of argument, let’s accept that Tamino found 3 other spikes in the temperature record. What that proves is that what he is calling the present spike is not unusual. It’s happened at least 3 times before in the past 10K years, and with even higher amplitudes. Just means that the present spike, if there is one, is not unprecedented.
Thanks, NZ Willy. I tried again later and all the comments downloaded ok.
I can see why they ignored your comments – you clearly know what you are on about. Keep up the good work.
Kind of like goblins, isn’t it. The fact that no-ones seen them and they don’t leave a trace doesn’t mean they aren’t real.
Not even Tamino believes this carp. It’s just throwing sand in the face.
Actually we know there is at least one (cold) spike in the data, an abrupt relatively short cooling episode known as the “8.2 KA event”. It is well documented in a large number of high-quality proxies, but invisible in the Marcott et al. curve.
When “Tamino” made this bonehead mistake, I presume that he had no inkling that it was a mistake at all. The eco-leftists don’t even think in terms of whether they are right or not. They just look for ways to make an argument that seems to support their desired conclusion, and by this criterion (the only criterion that exists in Tamino’s head) the argument is right, or it seems to be.
But now that he has had his error pointed out to him, just watch, he will not admit the mistake and issue a retraction but will try to deny it, proving that, even though he did not originally know that he was making a mistake, he is indeed willing to affirm what he knows to be mistaken arguments, and how could it be otherwise? A person who was looking for the truth rather than to arrive at a pre-determined conclusion would have easily caught the error to begin with.
Not to deny the insightfulness of Nancy’s elegant expose, but it’s a very simple mistake, and for anyone writing on the significance of the time resolution of a proxy data set, there is nothing more basic than the difference between a spike in the proxy data and a spike in what the proxy is being used as a proxy for. To miss it you have to not be looking for truth in the first place, but for a particular result, so the priority of preferred conclusions over truth is already present when the mistake is first made, even though Tamino probably wasn’t aware he was making a mistake.
The whole idea of trying to make sense, rather than trying to arrive at a particular conclusion, is alien to Foster, which makes it particularly perverse that he calls himself “Tamino.” That was the name of the pure hearted seeker of truth in Mozart’s Die Zauberflote. In abstract nature, Foster is the polar opposite of Tamino.
Do you think he does this simply to obfuscate or does he really believe what he has done is legitimate?
Has he not applied his brain as to what underlying geological/climatic activity would have to take place to generate a spike of the level shown in a core sample.
I am sure he is not that stupid, so I can only conclude that he is deliberately making false claims. The stupidity then lies with the people who accept what he publishes.
What Nancy says is correct.
Tamino has not properly taken into account the variable time sampling resolution of individual proxies. The average resolution is 120 years, with while some are as high as 500 years. When you add even a modest sampling jitter of 20% of the resolution the peaks disappear see graph here. Marcott’s paper even says: “The result suggests that at longer periods, more variability is preserved, with essentially no variability observed at periods shorter than 300 years.”
The original narrative implicit in the Marcott paper was that the Hockey Stick had been vindicated by Marcott’s uptick and that today’s temperature increases are unprecedented since the last Ice Age. Perhaps this may even be true, but you still need hard scientific evidence to support it.
The Marcott uptick has now essentially disappeared. This means that the narrative now relies on the instrument data. This is also fine by me provided we can be sure the two “anomalies” actually line up properly? This then depends on re-normalizing average temperature from 5000 years ago to the instrument anomalies normalized to 1961-1990. In my case I just simply added 0.3 C to the proxies to normalise them to Hadcrut4, but I have seen no convincing evidence to support why this should be the case. I interpreted the paper this way but perhaps someone can enlighten me on the evidence for this.
The second key assumption of the proposal that today’s temperature rise is unprecedented, is the necessity to demonstrate that something similar didn’t happen in the past. Hence the importance to provide evidence that Marcott would have detected such changes had they happened. Therefore you need to determine the sensitivity of the proxies to short to medium term climate excursions. I think it is important to show that the raw measurements would be able to detect such changes, rather than some Monte-Carlo interpolations based on those measurements.
The conclusion is that there is insufficient resolution in the proxies to see any past temperature excursions up to 1C which lasted less than ~400 years.
Nancy Green, that was a really instructive post well presented.
Andor says:
April 7, 2013 at 11:55 pm
“It’s like to be on a ship that’s sinking or running aground. A group of scientists and egineers are on the ship trying to figure out why it is sinking. They have trends and formulas. They argue day and night about facts left out,history charts, computer programs with wrong data, why it’s sinking and on and on it goes…
Then you have the ones on board that always denied the fact that it can sink and they are caught with their pants down.
You also have a smaller group that is prepared, acknowledge the fact, acts fast and survives.
(-:”
No, what you are referring to is those people who jump in the life boats the first time a storm splashes water onto the deck, crying ‘we’ve never seen a storm like this, we’re all gonna die!’. Or even worse, they just dive into the shark-infested sea.
@Stephen Rasey:
The sediments were derived from plankton in the euphotic zone which sank upon death to the depths. It’s not a problem that such great depths don’t in themselves record temperature changes to any extent.
There are issues with some of the plankton-based proxies though – the plankton bloom in spring (and to a lesser degree in autumn) and probably therefore record the temperature of the bloom phase if anything – and the bloom is in consequence of increasing availability of light acting on well-mixed surface ocean layers, not increasing temperatures.
Not sure might be going on in the tropical plankton cores – without seasonality and big blooms, the layers can’t be very thick – would be an interesting exercise to examine these.
Not sure *what* might be going on…
It is getting more evident as time passes on, that Tamino is not very good at basic stats.
This is reflected in his published literature as well, so should come as no surprise.
Skeptical Science Snydrome is a contagious disease, and he has a very bad case of it.
Andor says:
April 7, 2013 at 11:55 pm
Not at all correct. Let me help you a bit:
It is like being on a ship that is rocking slightly in the waves.
The honest engineers and true scientists (more than 31,000 of them!) have signed their names to a document that says “The ship has been rocking in the past, it is rocking now , and it will continue rocking in the future. Keep as many passengers as healthy as possible by using energy wisely by heating the ship, cooking their food, cleaning their clothes, and keeping the lights on.”
The government-funded CAGW alarmists and theocratic so-called “climate scientists” are screaming “The ship is rocking and so it might turn over and so we must turn off the engines and turn out the lights and flood the bilges to prevent the exhaust fumes from coming back into the engines when it turns over.”
The government-funded enviro extremists hear that warning – that they paid for! – and are creaming ” The ship is rocking violently and it will turn over and kill everybody therefore we must take everybody’s money and clothing and food and then throw everyone overboard into the icy water because otherwise a few of them might get cold if we don’t do anything. (But first I must go back to the first class lounge for my next environmental meeting and lobster dinner.) “
We’re arguing about the placement of the deck chairs on the Titanic. As has been pointed out early on with the Marcott release, that “scythe” graph is sobering.
Nancy Green’s analogy is very appropriate. If you put the 20th century spike into one of the marine sediment cores, it would be resolved as a single data point.
I demonstrated this here…
http://wattsupwiththat.com/2013/03/11/a-simple-test-of-marcott-et-al-2013/
The same principle also applies to the CO2 resolution in most of the Antarctic ice cores.
“However, adding spikes to the proxy data is an entirely different animal. The proxy data is an abstract representation of the proxy. It is numbers drawn on a sheet of paper or electronic equivalent.”
By adding an artificial signal to the time series gained from the proxies that does not have the same spectral characteristics as the original time series (one could as well say, not the same statistical properties), Tamino has created an entirely artificial time series that serves no scientific purpose at all; only a propagandistic purpose.
He must know that.
DonK31 says:
April 8, 2013 at 12:14 am
“For the sake of argument, let’s accept that Tamino found 3 other spikes in the temperature record. What that proves is that what he is calling the present spike is not unusual. It’s happened at least 3 times before in the past 10K years, and with even higher amplitudes. Just means that the present spike, if there is one, is not unprecedented.”
What? Tamino has created an artificial time series. He hasn’t “found” ANYTHING. Pay attention.
To the left of centre says:
April 7, 2013 at 11:51 pm
“…”
Are you sure?
http://www.politicalcompass.org
I found Tamino’s analysis breathtaking.. Triangular pulses 200 years long in a system with a maximum frequency response of 300year-1? No attentuation? Using proxies in environments with different temperature time constants? This seems to be completely wrong.
One thing that I find baffling is that it takes 20 minutes to compute 100 iterations of his “model”. Is he using an abacus?
The problem is that Tamino’s most delusionally devout and adoring acolyte is Grant Foster.
perhaps this has already been said but I believe a good way to summarize this is to say that Tamino has demonstrated that the *data reduction process* would not in and of itself eliminate high frequency spikes; however, the *proxy formation process* does.
A well-reasoned argument.
Anyone who still can’t grasp the point would do well to study this painting by Magritte.
http://en.wikipedia.org/wiki/The_Treachery_of_Images
Here’s a response from a warmy friend on another blog to me:
“No wonder you and your ilk assault the Marcott study, which conclusively shows that what we are seeing in our llfetimes is indeed unprecedented during the past 11 millenia. Oh, and smoke this while you’re at it: Tamino has shown that Marcott would indeed have detected any similar past spike in temperature. As he states, “Let’s find out, shall we?” (Tamino URL)
I’m done with your nonsense.”
At that point on April 5th, I decided to waste my time and look at Tamino’s analysis. At that time he made the claim that his added signal was 1/2 of the 0.9C to account for signal “loss”. Now that silly claim seems to have been deleted. Did anyone else read his original post before editing?
In one of his responses he says “Irregular time sampling enables you to get information at frequencies much much higher than the mean sampling rate, or even the maximum sampling rate. Those who don’t understand the impact of uneven time sampling often make your faulty claim” That is followed by completely inapplicable comments about nonuniform sampling of periodic signals. Looks like Tamino’s friends (if not Tamino himself) want us to believe that the climate signal is truly periodic, something they have been denying for years!
I have contemporary climate/weather observations for Britain covering the last 1000 years from which I am reconstructing CET back 1000AD -so far I am back to 1538.They are derived from a great number of sources and through extensive prersonal desk research.
These give a resolution of 1 year. However they are considered ‘anecdotal’ and greatly inferior to so called ‘scientific’ material deriving from such things as tree rings.
I can give the temperature spikes both upwards and downwards then link them to a likely event. For example Icelandic volcanoes that caused great cold were subsequetly noted in the archives of our great cathedrals who gave poor relief, or from crop records whereby famine might ensue.
It is very difficult to see that such events were long lasting.
tonyb
Well I posted a comment on Tamino’s blog when I first saw it, I don’t usually post comments on sites where I know I’m being critical of what is being said in case it comes across as trolling. The way I read the post the artificial addition of the spikes was being used to validate the Marcott uptick that we know is not robust. I said:
“I’m confused didn’t they say the 20th century reconstruction isn’t robust? To me you could introduce any amount of data flips you like if you’re using something that isn’t robust to start with you are just going to finish up with a diminished argument not something that somehow strengthens your beliefs.”
I got the following response from someone called Bern:
“Tamino’s point is simple: the premise that the analysis wouldn’t catch a spike of the magnitude we’re seeing in the modern instrumental record is false. As usual, the denialsphere made the claim without bothering to test it analytically. Understand?”
Further responses I made didn’t show up which is probably just as well because they exposed my rather lacking understanding of what was being discussed. This post provided the necessary clarity on the issue, thank you.
Where did these spikes come from if there were no people burning fossil fuels. And doesn’t the data show that the temperature of the planet was far warmer than it is now?
Louis-
“In trying to defend press release statements about the Marcott paper, Tamino is effectively calling Marcott a liar.”
Yup. I made this point over at Dot Earth-
“So, apparently Tamino argues that Marcott’s spectral analysis of Marcott’s reconstruction is wrong, in order to defend Marcott’s initial claim that modern temperature trends are unprecedented, even though Marcott later backed off that claim. Who’s on first again…?”
Here’s an analogy of Marcott’s argument, this time using music instead of Ms. Green’s planets (keep in mind that the lowest frequency component of chimes is 500 Hz):
A very old, degraded recording of an orchestra has a frequency limit of only 300 Hz.
I do not hear chimes when I play the recording.
My ears are capable of hearing chimes.
Therefore, if chimes were played by the orchestra, I would have heard them.
This is clearly a non sequitor.
Can someone tell me if the Climate Rapid Response Team ™ has been summoned to correct Mr. Grant’s errors…oh yeah, I forgot…
What possible mechanism could produce a spike that was that thin and hard to detect in the proxies? Do we have any reason, at all, to believe that such a spike exists? If it does exist how does that make the modern manmade spike any less threatening? Couldn’t it just stack with this mythical second spike mechanism, making it even worse?
And, most importantly, how do you disprove the existence of these past temperature spikes? It looks like that bottom-dwelling undying creationist argument that until someone builds a time machine nobody can know anything about the past and all opinions are therefore equal.
Anthony, the biggest and most obvious message of the study is being overlooked by sceptics. CAGW proponents have actually pulled much different stage magic here than pointed to by Nancy, getting everyone to debate useless details of the multi-millennial temperature trace as a diversion tactic. I’ve raised this before and so far no takers:
ONE LOOK AT THE MARCOTT ET AL GRAPH and what does one see. A temperature proxy that shows (assuming proper science) A SCARY, INEXORABLE SLIDE TOWARD THE NEXT ICE AGE!! This is what the Hockey Team saw at once. This is what motivated the apparently successful attempt to divert sceptics away from it and ruined the study in the process. Someone will do another study – maybe using the same proxies, get the same type of results and get a PhD concluding an approaching end to the Holocene – the reverse of the CAGW predictions.
The fact that Marcott et al didn’t even see the obvious is a measure of the remarkable blindness of the CAGW committed. Does anyone else here see this?
Reminds me of the before and after affects of getting glasses in 5th grade. Turns out the greenish black wall in front of the classroom had writing on it! WHO KNEW?!?!?!
RACookPE1978, your Freudian enviro-extremistic “creaming” slip is HILARIOUS!!!!
Even with high resolution proxie data such as the Greenland O18 depletion from ice cores, the magnitude of spikes decreases exponentially with increasing depth. http://www.kidswincom.net/climate/pdf.
I think this model manipulation also proves the Vikings never settled in Iceland and Greenland, as it was clearly too cold 1,000 years ago.
Models are like that, when your conclusion is pre-determined and the data manipulated, then the facts are guaranteed to go out of the window
So what was Tamino’s point? That the 20th century spike shown in Marcott was NOT unprecedented? If true, it still exposes the Marcott paper’s unabashed agenda-driven alarmism and the media’s blind embrace of CO2 Armageddon.
DirkH I’m afraid your comment (which I think was aimed at me) was a little too subtle for me to quite understand what you were suggesting. Maybe you could clarify.
clivebest says:
April 8, 2013 at 1:04 am
“Therefore you need to determine the sensitivity of the proxies to short to medium term climate excursions. I think it is important to show that the raw measurements would be able to detect such changes, rather than some Monte-Carlo interpolations based on those measurements.”
I would like to ask a question which might be off topic. Please tell me if it is.
It seems to me that climate scientists have played fast and loose with proxy data and that they have been a bit too imaginative in attaching instrument data to proxy data. Don’t they have the responsibility to test their proxy data against instrument data? If the last proxy data point was collected 60 years ago, isn’t the scientist duty bound to get in the mud and collect additional data to the present time? By doing so, one might learn that the proxy in question is no longer a reliable substitute for instrument records. (As an aside, isn’t this exactly what Mann, Jones, Briffa and the team had discovered about their tree ring proxies but then chose to hide the decine?)
It is very dissatisfying to read studies such as Marcott’s and learn that no justification is offered for the proxies that they used. One gets the feeling that there is a proxy cafeteria somewhere and climate scientists choose their proxy series according to individual taste. In addition, the folks who run the cafeteria never talk to their customers. As regards any individual series, the attitude seems to be something like “tree rings have long been accepted as proxies for temperature.” Surely, scientists are duty bounrd to do better.
NZ Willy says:
April 7, 2013 at 10:28 pm
But see Clive Best’s site for an authoritative demolition: http://clivebest.com/blog/?p=4833
==========
Agreed. I read Dr Best’s article in preparation for publishing this paper. Not only does it show Tamino’s spikes would be significantly attenuated, it shows that Marcott’s method does reveal small spikes at known warming periods.
Steve M at his site makes an interesting point. Marcott is using a “home grown” statistical method. It hasn’t been put forward in a Mathematical or Statistical journal. In effect it is invented mathematics. Yet it has been accepted uncritically by the Climate Science community without regard for its accuracy. (where have we seen this before?)
This begs the question. Why not use well researched and accepted statistical methods to analyses statistical data? Mathematics wasn’t invented yesterday. Some pretty sharp minds have been at work on the subject for a couple of thousand years. Why assume your “new” method is somehow superior?
There is also an amusing post at Steve M’s site in which a medical researcher re-invents calculus and had 75 citations for his “new” method. Went so far as to name this “new” method after himself. Evidently medical students don’t take much math as part of their curriculum. Might Climate Science suffer from the same problem?
Richard Briscoe says:
April 8, 2013 at 5:03 am
Anyone who still can’t grasp the point would do well to study this painting by Magritte.
http://en.wikipedia.org/wiki/The_Treachery_of_Images
============
A powerful example of the ability of the mind to confuse us. When I first looked at the painting my mind immediately said “but of course it is a pipe”. I had to consciously will myself to say no, it is a painting of a pipe.
The famous pipe. How people reproached me for it! And yet, could you stuff my pipe? No, it’s just a representation, is it not? So if I had written on my picture “This is a pipe,” I’d have been lying!
To the left of centre says:April 7, 2013 at 11:51 pm
I think you need to be a little careful with your Astronomy analogy. What you’re referring to (I believe) is astrometry in which you attempt to measure the motion of a star (by observing it’s position change on a photographic plate or CCD) around the center-of-mass of its planetary system.
Stellar dislocation by planetary orbital perturbations are a usual way of detecting planets that are beyond the resolution of your telescope. That is not what is being discussed here, rather the actual detection within resolution, if you have the resolution. Not a proxy for resolution, ie. perturbation.
Historical records of the Egyptian, Roman and Chinese societies should show 50 year warm and cold periods. Cherry blossoming dates have been kept for perhaps two thousand years, and a correlation with the temperatures of recent and the blossoming dates should show – or not show – the value of this proxy.
Or not. That is the point, I suppose.
Over how many years do the 3 spikes last, approximately what year on the time does each spike occur? The interval between the spikes looks uniform, is it? Does anyone have an idea on what coincides with the timing of the spikes?
Finally, the obvious overall negative trend/curve over 10,000 years is troubling as it looks like it is following the downward fall in earth’s obliquity. The rapid rise in the trend corresponds to the earth’s maximum obliquity of 24.2 degrees approximately 10,000 years ago.
Ironic, setting aside the hub bub over spikes, Tamino and Marcott actually proved obliquity is the major driver of earth’s climate… Ask the wrong question and you get the wrong answer.
Gary Pearse says: April 8, 2013 at 5:56 am
“ONE LOOK AT THE MARCOTT ET AL GRAPH and what does one see. A temperature proxy that shows (assuming proper science) A SCARY, INEXORABLE SLIDE TOWARD THE NEXT ICE AGE!!”
Agred. Very important point – the whole debate glosses over the fact that at least 25% of the Holocene was warmer than today (and incidentally, mankind flourished in that time) and the Marcott work points to an inexorable slide in temperature.
Steve Keohane Maybe you could clarify your point. I understand quite well how planets are detected around stars and suspect you may be confusing radial velocity measurements (which require good spectral resolution) with astrometry (which requires good angular resolution). The point I was trying to make is that if what you’re trying to detect has a motion (in wavelength space, or real space, or temporal) that is much smaller than the resolution of your data, then indeed you will not see it in your data. On the other hand, if it is comparable, you will still see an effect even if you don’t have the resolution to characterise it in any specific way.
At what point did they remove stats from the climatology curriculum?
To the left of centre says:April 8, 2013 at 7:48 am
I believe this discussion is about being able to resolve by actual observation, in this analogy, resolution of reflected light from the planet, not some gravitational perturbation that indicates one or more planets are likely there.
Seems to me perhaps Tamino asks the wrong question, and uses a generously inflated measure by tacking a huge proxy signal onto what should have been a damped signal, and then assumes a little too much about 20th century warming to come up with his “answer”.
The recent warming has been approx 0.7 C (not 0.9 C) over about 120 years, and it has not necessarily been above the mean. (We need accurate proxies to tell us that! … and therein lies the problem.)
The question is, is this a normal fluctuation, and would this scale of fluctuation have been detectable about the mean of Marcott et al’s result using the proxies Marcott used.
So lets assume there was an actual warming peak starting at 0.35C below the mean and over a 100 year period this extended to 0.35 above the mean of Marcott’s proxy average (to match the recent warming average and Tamino’s calculation).
Marcott points out these proxies naturally ‘smear’ the data due to leakage into adjacent time brackets.
I assume perhaps only 80% of this 0.7 C spike would be ‘recorded’ by the proxies, if temperatures prior to and after the “spike” oscillated in a similar manner about the mean, and proxy evidence leaked into the adjacent time brackets.
So now we would have a total spike of 0.56 C, with a 0.28 degree spike above the proxy mean. Furthermore, not all of the proxies would show it.
Considering that the some of the proxies are deep ocean measures, and our top 2000 metres of ocean have (supposedly) warmed a total of 0.09 degrees C over the last 56 years I’m sure quite a few proxies would miss it by their nature, and certainly others would do so by their resolution/timing.
Very possibly this sort of fluctuation could have been occurring throughout the whole timespan.
So this leads me back to the question – Would a 0.7 degrees C fluctuation in atmospheric temperature about the mean really be detectable in the Marcott proxy data?
eric1skeptic says:
April 8, 2013 at 5:04 am
Here’s a response from a warmy friend on another blog to me:
“No wonder you and your ilk assault the Marcott study, which conclusively shows that what we are seeing in our llfetimes is indeed unprecedented during the past 11 millenia. Oh, and smoke this while you’re at it: Tamino has shown that Marcott would indeed have detected any similar past spike in temperature. As he states, “Let’s find out, shall we?” (Tamino URL)
I’m done with your nonsense.”
I think everyone is missing the point of Tamino’s exercise. It’s not to prove anything at all; it’s simply to provide talking points to the scientifically-illiterate followers who need to be reassured that they’ve not been led down a garden path all these years. The example above is a perfect illustration of his success. And, of course, such a strategy absolutely requires the “disappearing” of contrary opinions, lest those being led (misled) begin to wonder. The average person avoids events that generate cognitive dissonance. As eric’s friend said above, “I’m done with your nonsense.” Thus is another follower captured for the cause.
Gary Pearse at 5:56 writes:
ONE LOOK AT THE MARCOTT ET AL GRAPH and what does one see. A temperature proxy that shows (assuming proper science) A SCARY, INEXORABLE SLIDE TOWARD THE NEXT ICE AGE!! This is what the Hockey Team saw at once. This is what motivated the apparently successful attempt to divert sceptics away from it and ruined the study in the process.
It didn’t ruin the study at all, from their point of view. The believers still believe in the hockey stick, no matter how discredited it’s become, and they’ll also now continue believe that the Marcott study shows how dramatically humans have changed the earth, converting a steady cooling into a dramatic warming in just 100 years. They don’t need science to convince them; just unchallenged verbiage, unchallenged, that is, in the popular press and on the warmist blogs, due in both cases to censorship of opposing views. Marcott is not likely to ever be cited in serious research papers, but the original press reports of the study will be parroted by hundreds of thousands of followers for years.
Science is not the purpose of any of these studies. Think propaganda, nothing more.
To the left of centre says:April 8, 2013 at 7:48 am
Perhaps a better way of presenting my point is to say that Marcott says they are using a 60mm telescope, Tamino claims it’s really 300mm.
When climate scientists create their low resolution proxy data do they throw out any spikes or are we looking at all of “raw” data that just doesn’t have any spikes? While I agree with this post (the planet analogy was great) I wonder if there isn’t some “editing” going on before the temperature proxies are released so that we never see the spikes. After all what is the difference between a spike and a bad data point?
Okay, I see. Still not convinced it’s a great analogy. In that case you have resolution plus contrast issues. Planet much fainter than the star. If, however, you assume the contrast isn’t an issue, then my point still stands. If your resolution was close to what you’d need to directly detect a planet, then the planet could have a noticeable influence on the observation, even if you couldn’t actually characterise it.
It didn’t ruin the study at all, from their point of view. The believers still believe in the hockey stick, no matter how discredited it’s become, and they’ll also now continue believe that the Marcott study shows how dramatically humans have changed the earth, converting a steady cooling into a dramatic warming in just 100 years.
Except one wee little problem with that explanation, what caused the three previous and very similar spikes of GREATER increase than the current one? Which begs the real question, what caused the spikes in the first place?
did Marcott splice air temperature records onto sea temperature proxies ? if so that seems to be clearly an apples to oranges comparison …
What appears to be lost in many posts critical of Marcott is that whether or not an individual spike can be resolved is a related, but still different question, than what the distribution of temperatures was. The distribution is what Marcott used in their Figure 3. It, in conjunction with the instrument record, led to the main conclusions of their paper:
Notice they have widened the distribution by adding missing high-frequencies (sentence highlighted in bold) . The histogram they use to make their conclusions is the widened one, not the one directly from their proxy reconstruction. The details of the widening are found in the supplementary materials. Two different methods were used and checks were done to assess the sensitivity of the temperature distribution (which their conclusions were based upon) to different amounts of lost high frequencies. Part of this was creating a simulated pseudoproxy temperature stack where they
This is doing what Nancy Green is saying should be done – modifying what the proxies themselves would look like, not modifying the proxy data – when they did their cross check.
Regardless of what Tamino did or didn’t do, Marcott’s conclusions are not based on whether a spike could be resolved after smoothing, nor do they depend on knowing the answer to this. They are based on a statistical widening of the overall temperature distribution, something which is not very sensitive to individual spikes. Their primary conclusions based on this still seem to be robust.
Leo Geiger says:
April 8, 2013 at 8:59 am
Re Marcott et al. Their primary conclusions based on this still seem to be robust.
Yes, true enough, and the debate has become complicated.
No doubt the overall chart of the Holocene temperature is useful and interesting work, once the uptick artifact was dealt with. Very interesting to see it shows at least 25% of the Holocene was warmer than today, a point sometimes disputed.
But some of their discussion compares “their” Holocene temperature averages with 20th century warming, and this point is in contention.
The question naturally arises, have they in fact show that and is this a valid discussion point taking into account their methodology and data?
Ask Tamino why the proxies don’t pick up the spike in the 20th century in Marcott’s PHD thesis. Without the redating to create the ‘scythe’ the proxies can’t find the current spike so how would they detect past spikes?
Leo Geiger says:
April 8, 2013 at 8:59 am
———
Maybe there’s a dichotomy between the primary conclusions of the paper and why the paper is important and interesting press wise. If Marcott et al doesn’t speak to the absence of spikes in the past, then the claims about the uniqueness of the current temperature spike lose their basis. Maybe the primary conclusions stand; the ‘popular’ conclusions don’t.
Ryan:
I am replying to your post at April 8, 2013 at 5:53 am.
I am writing this reply on the assumption that your questions are genuine. However, I state that your iteration on WUWT of your questions without reference to the full answers you have been given to those questions on WUWTT implies that your post is trolling.
Your questions were answered fully and in detail to you when you and Thomas raised those issues on the previous thread where Nancy Green first provided her analogy (prior to the above refinement).
That thread is at
http://wattsupwiththat.com/2013/04/03/proxy-spikes-the-missed-message-in-marcott-et-al/
Answering your questions would require copying and pasting the answers you were given to those questions, and that would be wasted effort because you have failed to understand those answers.
So, I ask you to read that thread again and to itemise the issues you failed to understand. Having done that then you can post the matters you have failed to understand to here for additional explanation.
Richard
Good point Gary; and I see that one or more above agree with you; I would also like to point out that one should not take the absence of posts specifically indicating agreement (or disagreement) as _not_ reaching more than just a few folk. Many like myself will ‘take in’ such an observation and mentally file it away for future reference.
.
Mark Bofil says (similar to markx):
April 8, 2013 at 9:37 am
“Uniqueness” is too strong a word. What the Marcott reconstruction provides is context:
It can’t be said if this is unique based solely on Marcott, but we have clearly gone from near the bottom to near the top of the 11,000 year range in a short amount of time. It becomes one more piece added to the puzzle, and helps us understand the broader picture being built up. It is a shame that this is getting lost in the eagerness by some to tear Marcott down.
I imagine the question of ‘uniqueness’ gets into what higher resolution proxies (with more limited time spans or spatial coverage) can say directly, statistical estimates of the probabilities of ‘spikes’ based on signals in smoothed proxies, limits on plausible natural physical mechanisms for temperature changes, and other things which I don’t know enough about to comment further on in any detail without doing some careful reading.
Leo Geiger
And we went from near the coldest to near the warmest in a few decades from 1690 to 1710
And near the warmest to near the coldest from 1560 to 1590
And near the warmest to near the coldest from 1220 to 1250
And….but you get the picture, there are numerous drastic swings in temperature which can be picked up in climate observations that may not be seen in the low resolution proxies that such as marcott use.
Tonyb
@Jit 1:33 am
I agree that the proxies grow in the shallower, photic zones. But just what is the mean and std dev of the distribution of descent times to the ocean floor 3 km down of a proxy bug? The mixing of waters in the deep is surprising. Just how broad is the atomic testing spike?
Furthermore, as you point out, the temperature that is recorded by the proxy is in large measure weighted toward the conditions of the maximum growth period rather than an unbiased average temperature throughout the year. The maximum growth period will be a function of fertile conditions based upon non-temperature factors such as nutrients from run-off and floods or even schooling of fish.
Finally, I wanted to point out that these proxies were a mixed bag of ultra-deep water, Shelf, photic, lacustrine, and high-Antarctic desert plateaus. Each one of them trying to measure a 1 part in 100 anomalous temperature of the surface air. I’m skeptical of the 8000 year temperature decline much less the 100 year spike.
climatereason says: April 8, 2013 at 11:02 am
Which proxy reconstruction stacks show decadal global mean temperature changes of similar magnitude that are reliable enough after accounting for errors? Or to borrow Nancy Green’s analogy, which telescope is resolving those planets?
How about the 8.2k event in the Marcott data?
http://www.geo.arizona.edu/palynology/geos462/8200yrevent.html
It should have been a 3°C sudden difference much above the modern warming swing?
Leo Geiger:
It seems that you have joined this discussion late.
Nancy Green first raised her analogy for a previous thread where the limitations of the paper by Marcott et al. were discussed. This thread is about Foster’s incompetent assessment of the paper by Macott et al..
I respectfully suggest that you read the previous thread. It is at
http://wattsupwiththat.com/2013/04/03/proxy-spikes-the-missed-message-in-marcott-et-al/
The main point you seem to not understand is that
absence of evidence is not evidence of absence.
Also, ‘one black swan demonstrates that not all swans are white’.
As Lars P. says at April 8, 2013 at 12:54 pm, we know of a ‘black swan’ that Marcott et al. fails to detect.
I commend you to read the previous thread because I see nothing in your posts which was not covered in the previous thread.
Richard
I have read Green’s earlier post. The problem with argument by analogy is analogies are imperfect and they can be pushed too far. This
is doing that. A “spike” in the 20th century, by itself, tells you nothing about whether or not more would be expected earlier.
The point is that Marcott is able to make a reliable statement based on a temperature distribution that has been widened to account for lost high frequencies. Using that approach is relatively insensitive to whether or not there are individual spikes. I realize this thread is about Foster, but none of the threads seem to acknowledge the actual approach Marcott used.
It is hard to keep up with the quantity of posts being churned out here. They have the shelf life of a souffle left in the sun on a hot summer day.
You seem unable to understand that the three spikes shown in the graph at the head of this post are “fakes”, deliberately introduced by Tamino in his bumbling attempt to prove the proxy records of Marcott are capable of resolving 20th century-type temperature excursions. There is nothing to explain.
Leo Geiger says: April 8, 2013 at 10:50 am
“….we have clearly gone from near the bottom to near the top of the 11,000 year range in a short amount of time….”
Leo, how can we possibly know that from Marcott?
This is the point of the whole debate. Do Marcott’s smoothed and smeared and then averaged proxies show the range? In a further 10,000 years the 20th century uptick very well may be invisible in similar proxies.
Lars P. — Thank you for the link to the 8200 year event. I realize I am not explaining this clearly, since it does not seem to be understood that I agree Marcott’s reconstruction would not fully resolve such an event. That is what Marcott said too. I am pointing out that the method they used to make their concluding statements takes into account their inability to resolve this type of event. Green and others posting here never seem acknowledge this, always giving the impression that Marcott used the unmodified low resolution signal for their statements.
As an aside, I see from that link there is a physical mechanism to explain that particular event:
Obviously something like that isn’t happening all the time. It certainly doesn’t make for a very good ‘natural’ explanation for the modern “spike”…
Regardless, the presence of unresolved spikes is accounted for in their widened temperature distribution histogram.
markx says:
Look at Marcott Figure 3. Do you understand why there is a distribution with a dashed black line and another with a solid black line, what the difference between the two is, and which one Marcott used to make their statements?
Leo Geiger says:
April 8, 2013 at 3:37 pm
A “spike” in the 20th century, by itself, tells you nothing about whether or not more would be expected earlier. The point is that Marcott is able to make a reliable statement
==========
The spike is not “by itself”. I have already explained why the circumstances surrounding the spike allows one to made predictions. Tamino has demonstrated that my prediction is correct.
Marcott has used an unproven statistical method without citation. The divergence between his thesis and later paper in Science suggests the results are anything but reliable. In this regard I am in strong agreement with the Dr Pielke.
http://rogerpielkejr.blogspot.com/2013/03/fixing-marcott-mess-in-climate-science.html
There have been at least three well known warm spikes in the earth’s very recent past; the Minoan Warm Period, the Roman Warm Period and the Medieval Warm Period.
No one knows the cause of these warming and there is no indication they are substantially different than the Modern Warm Period. As with our current time, they represent a period of food abundance and relative prosperity for the average person. These warm period were well documented by previous generations of researchers.
note: Contrast this to the miserable existence of humans 90k years ago, where the genetic record shows we were the endangered species of the day, Things got so bad that polar bears were out taking donations to “save the humans”,
However, the recent generation of researchers has sought to minimize these warm periods and the prosperity they brought. Instead they have claimed these warming spikes were regional, or not significant. However, I submit to my readers that it is a simple matter to test the accuracy of these claims for yourself.
Ask yourself this simple question. What would happen if a proxy was found that showed that the previous proxies had been wrong, and CO2 levels were not stable during those times? Rather that CO2 had increased rapidly around the time of these past warming spikes – perhaps due to a great belch of CO2 released every 1500 years or so by the deep oceans.
Would climate science continue to claim that the these warming spikes didn’t exist? Or would climate science overnight change its story? That in fact these past spikes were global and in combination with the CO2 record were certain proof that CO2 was driving climate?
What would Climate Science do?
There might also be a dampening of ancient data by osmosis of the various chemical markers to layers of surrounding ages. Chemicals constantly move toward equilibrium.
If I understood the original paper correctly; A single proxies datum of information, represented a climate temperature smeered over a 300 year period.
So adding a spike to the proxie data and testing their algorithm, does nothing to show how sensitive the original proxie data is to detect spikes.
When a single proxie datum represents 300 years of weather at a location, there will be no spikes in the data. It is self-smoothing by vertue of what it is.
Nancy Green asked: “Evidently medical students don’t take much math as part of their curriculum. Might Climate Science suffer from the same problem?”
CRU climatologists do have a math teacher cum aide, whom I’ve met. At least, I presume this person is still on the staff – by tacit mutual agreement we have not mentioned the job since Climategate reared its head; our friendship is in another context.
Nancy Green:
You said this in your earlier post:
Fine, except they did not use the low resolution signal to make their concluding statements (warmer than 72%…cooler than 95%…). But that is what is being implied over and over again in posts like yours. They modified their low resolution distribution into a wider one to account for the lost resolution.
I suppose the next step, after acknowledging this, is then to suggest they didn’t widen it properly, which I see you have now done:
But at least that implicitly recognizes they weren’t using the low resolution signal directly (I hope). I am not sure what criteria you have used to decide that their method is unproven and without citation, since it is explained over multiple pages, including various tests, all with citation, in the supplementary material. Do you have a specific issue with what they did? That would be more interesting to hear than a casual dismissal.
That depends entirely on understanding why there are ‘divergences’. Yes, there was a problem with how the ends of the proxies were handled in the stacking, creating that exaggerated proxy uptick at the end. No, that can not be an issue in the rest of the reconstruction where most records are not ending. Nor does the uptick change the overall distribution. Bootstrap arguments of the form “if we can’t trust that, how can we trust anything” are inherently weak.
Simple? I would think testing this is a not so simple matter of doing a careful analysis of the individual proxies, the methods used to convert them to global means, and the errors present in that procedure right from data collection at the start to stacking into global means at the finish. I don’t think rhetorically asking about some scenario and presuming cynical flip-flops yields any real answers.
Oddly enough, I don’t actually disagree that the general media coverage could have been done much better on this one. But that applies to what this site is doing too.
Leo Geiger says:
April 8, 2013 at 9:39 pm
Fine, except they did not use the low resolution signal to make their concluding statements (warmer than 72%…cooler than 95%…).
============
It is a mathematical nonsense to try and compare a high resolution spike against the low resolution average. It makes the conclusion extremely misleading.
In this regard I am in strong agreement with the Dr Pielke.
http://rogerpielkejr.blogspot.com/2013/03/fixing-marcott-mess-in-climate-science.html
If anything, what Marcott shows is that we are at risk of slipping into an ice age and this risk is accelerating.
Leo Geiger says:
April 8, 2013 at 5:11 pm
Lars P. — Thank you for the link to the 8200 year event. I realize I am not explaining this clearly, since it does not seem to be understood that I agree Marcott’s reconstruction would not fully resolve such an event. That is what Marcott said too.
I am not sure I understand what do you understand under partially resolved? Is it 0.05%? It should be a 3°C that goes way out of the scale.
I am pointing out that the method they used to make their concluding statements takes into account their inability to resolve this type of event. Green and others posting here never seem acknowledge this, always giving the impression that Marcott used the unmodified low resolution signal for their statements.
From the above it is clear that a 200-300 years excursion are not captured by their method, however the chart is justified to defend the hockey stick:
http://pressrepublican.com/0205_columns/x1916524832/Climate-change-A-clear-and-present-danger
“Both the new Marcott data and the Mann data, where they overlap on the right, agree very well. Note that the temperatures today are higher than at any time in at least the past 4,000 or more years”
As an aside, I see from that link there is a physical mechanism to explain that particular event:
…
Obviously something like that isn’t happening all the time. It certainly doesn’t make for a very good ‘natural’ explanation for the modern “spike”…
How that event happened is irrelevant to this conversation.
There are “could have produced” in the explanation that you embrace so gladly which may very well be wrong. It is the explanation that current models can give, but we know that these models cannot reproduce even the warming from the first part of the century (1910-1940) which is actually ironically the warming part in Marcott’s not robust hockey stick.
As Marcott’s chart missed that excursion it is clear that it misses also the MWP and LIA which are similar in time frame but not so dramatic in amplitude, therefore any discussion about grafting actual temperature data on that chart is totally irrelevant and leads to wrong conclusions.
We know from a great deal of data that MWP and LIA were global events
http://www.co2science.org/data/mwp/mwpp.php
Leo Geiger says: “Fine, except they did not use the low resolution signal to make their concluding statements (warmer than 72%…cooler than 95%…). But that is what is being implied over and over again in posts like yours. They modified their low resolution distribution into a wider one to account for the lost resolution.”
They correcly used red noise in Fig 3, but drew Fig 1B with incorrect white noise to create the blue error bar. Using a correct error bar (e.g. like Fig 3) the 1 std dev blue area would make the 20th century rise invisible. Obviously depicting white noise there is deceptive since few people read the number and understand the context: 72% is less than 84% which is 1sd, thus making the rise and current temperatures completely normal for the Holocene. OTOH many people look at the hockey stick with the incorrect white noise 1sd shaft and incorrectly conclude “abnormal warmth compared to the last few thousand years”. Along with the problems with the final proxy data point, it is likely that the penultimate 1900-1909 point is too low due to proxy deposition and measurement problems.
Like MBH98, this paper is flawed and breaks new ground in incorrect analysis and depiction of data for purely political purposes.
eric1skeptic:
I write to support your point in your post at April 9, 2013 at 3:45 am.
And I hope to ‘clear the mist’ for those who do not understand the correct technical statements you make.
The method adopted by Marcott et al. cannot determine short-term variations in global temperature such as the recent rise in global temperature. But a ‘statistical trick’ was used to create a recent ‘up-tick’ in their graph. If that trick were valid then the graph would also have provided the ‘down’tick’ reported by Lars P. (at April 8, 2013 at 12:54 pm), but it does not.
Marcott et al. have admitted in their FAQ that the ‘up-tick’ in their graph is “not robust”; i.e. it is an artifact of their statistical trick.
Leo Geiger, Tamino and others are trying to obscure the fact of that statistical trick which can only be either gross incompetence or a deliberate attempt at deceit.
Richard
Thank you a lot for giving everyone such a superb opportunity to read critical reviews from this site. It is usually so excellent and as well , packed with a good time for me and my office colleagues to visit your blog more than 3 times weekly to see the fresh issues you have got. And of course, I’m so usually motivated considering the amazing points you give. Some two facts in this article are unequivocally the simplest we have had
Nancy Green says:
April 8, 2013 at 11:16 pm
“If anything, what Marcott shows is that we are at risk of slipping into an ice age and this risk is accelerating.”
Thank goodness, more are getting to notice this. I had been largely ignored on this point that I’d tried to make on several occasions on two threads, until the last several commenters.
Gary Pearse says:
April 8, 2013 at 5:56 am
“ONE LOOK AT THE MARCOTT ET AL GRAPH and what does one see. A temperature proxy that shows (assuming proper science) A SCARY, INEXORABLE SLIDE TOWARD THE NEXT ICE AGE!! This is what the Hockey Team saw at once. This is what motivated the apparently successful attempt to divert sceptics…”
I even proposed that someone could get a PhD for a similar study with the conclusion that we appear to be coming to the end of the Holocene. It also was the basis for a question to Marcott et al at the NYT (not yet answered) as to why this most obvious of features WASN’T the principal conclusion of the study.
Gary Pearse says:
April 9, 2013 at 5:30 am
Thank goodness, more are getting to notice this.
==========
From the paleo records, one of the warning signs of an approaching ice age is temperature spikes. Also, our current interglacial has already run longer than the average.
So, based on the trend seen in the “robust” portion of Marcott’s work, coupled with the modern temperature spike following on the heels of the Little Ice Age, the most logical explanation is that we are seeing the calm before the storm. We are seeing a temperature spike upwards to regain some of the previous warmth of the Holocene, ahead of a another Little Ice Age, almost certainly worse than the last. This would be an extremely dangerous development for Northern countries in a time of increasing energy costs.
While Climate Science has enjoyed great financial rewards by painting CO2 as the cause of the current warming, it cannot explain the past cycles of warmings and thus tries to minimize them to hide its limitations. CO2 as a cause of warming is inconsistent with the release of CO2 by the oceans as they warm. This process alone should make the cycle of ice ages and interglacials impossible. By GHG theory, once in an ice age, the loss of CO2 from the atmosphere should lock us in permanently. Once in an interglacial the CO2 released by the oceans should prevent the next Ice Age. This contradiction with observation, coupled with the lag in CO2 versus temperature shows clearly that CO2 is not driving temperature, no matter how rewarding it is politically and financially to say it is.
History shows that science and authority have been routinely led astray many times in the past as to cause and effect. Human activity is the single most common cause blamed for weather and climate change throughout the records of human civilization. Human sacrifice is the universal cure. The search for witches as the cause of Natures woes continues to this day. Only today’s witches drive SUV’s, not broomsticks. They burn coal to heat their magic brew, not wood.
richardscourtney says:
April 9, 2013 at 4:46 am
Leo Geiger, Tamino and others are trying to obscure the fact of that statistical trick which can only be either gross incompetence or a deliberate attempt at deceit.
===========================
Tamino …. deliberate deceit ?? As if ….
eric1skeptic says:
Thank you eric1skeptic. Your comments were to the point.
Yes, they did. And that is why statements in Marcott based on Figure 3, such as in the conclusion (warmer than 72%…) are reasonable. People can certainly argue about other details in the paper, or wider significance, or press coverage. But they shouldn’t think those particular concluding statements are wrong because the distribution only reflected the low frequency (since it didn’t) or because there was an exaggerated proxy uptick at the end (since that doesn’t change the shape of the Figure 3 distribution).
This is probably too technical a discussion to be having here. I should have used a planet analogy involving Death Stars or something…
Leo Geiger:
I write to thank you for your post at April 9, 2013 at 8:08 am addressed to eric1skeptic.
I always enjoy a good laugh, and that post gave me a very good laugh.
It pretends to agree with eric1skeptic who had cogently explained you were plain wrong. Then it pretends you were right. And finally you try to demean the forum in which you were shown to be wrong.
Having declared you ‘won’ I assume you will now ‘take your ball home’.
OK. You can do that, but don’t be fooled into thinking the misleading presentation of the Marcott et al. paper has not been exposed for what it is.
Richard
Certain criticisms of Marcott apply to some things but not others. I thought it might be worthwhile to highlight why this is so. I understand now there is little interest in this. So no Richard, no one has ‘won’ anything here.
Leo said: “And that is why statements in Marcott based on Figure 3, such as in the conclusion (warmer than 72%…) are reasonable.”
Reminds me of “And that is why you should never let a robot do your homework” http://wealldraw.tumblr.com/post/19004731367/and-that-is-why-you-should-never-let-a-robot-do
Or
“And that is why Wikipedia is not so great: because a huge amount of space is devoted to meaningless articles maintained by control freaks.” http://en.wikipedia.org/wiki/Wikipedia:Why_Wikipedia_is_not_so_great
Most claims in the Marcott paper are spurious or unreasonable. And that is why picking one more or less reasonable claim is not a valid defense of the paper.
The one I “picked” is one of the three items listed as the primary results of study. One of the primary results is “more or less reasonable”. Not a valid defence? Odd.
Leo Geiger says:
April 9, 2013 at 4:48 pm
One of the primary results is “more or less reasonable”
============
You are confusing the specific with the general in an attempt to misdirect. As already explained a finding in science is not confirmed by the number of times it is found to be correct. A broken watch is correct hundreds of time each year. More than some people.
Nancy Green: Here’s fodder for another Marcott post for you. Dana1981 over at SkepticalScience has a new post about the paper, where he continues to splice the instrument temperature record onto the end:
http://www.skepticalscience.com/marcott-hockey-stick-real-skepticism.html
Bob Tisdale says:
April 10, 2013 at 2:34 am
Dana1981 over at SkepticalScience has a new post about the paper
===========
Here is the last line of the post:
and that despite the contrarians’ best efforts to argue otherwise, we’re not yet doomed to catastrophic climate change.
So, there we have it. Even SKS recognizes that Global Warming is saving us from catastrophic climate change. Otherwise as Marcott shows, we’d be steadily accelerating into the next ice age.