Guest Post by Willis Eschenbach
There’s an interesting measure of atmospheric CO2, called the “airborne fraction”. The airborne fraction is the fraction of the CO2 emitted each year which remains in the atmosphere. When humans emit say 9 gigatonnes of carbon, only about half of that remains in the air. The other half of the emitted carbon is absorbed, “sequestered” in some semi-permanent fashion, by various carbon sinks in the land and the ocean.
Dr. James Hansen of NASA, another in the long line of climate alarmists who don’t mind shafting the poor with expensive energy, has come out with a most surprising statement in his latest paper, Climate forcing growth rates: doubling down on our Faustian bargain, hereinafter Hansen 2012. The statement involves Hansen et al.’s explanation for a claimed recent decrease in the airborne fraction. Here’s their graphic showing the changes in the airborne fraction since 1960.
 Figure 1. Hansen 2012 Figure 3. I’ve added a vertical line highlighting June 1991.
[ORIGINAL CAPTION] Fossil fuel CO2 emissions (left scale) and airborne fraction, i.e., the ratio of observed atmospheric CO2 increase to fossil fuel CO2 emissions. Final three points are 5-, 3- and 1-year means.
I do wish people would show the underlying data and not just averages, but setting that aside, here are the authors’ claims about the drop in the airborne fraction (blue line) post 2000:
We suggest that the surge of fossil fuel use, mainly coal, since 2000 is a basic cause of the large increase of carbon uptake by the combined terrestrial and ocean carbon sinks. One mechanism by which fossil fuel emissions increase carbon uptake is by fertilizing the biosphere via provision of nutrients essential for tissue building, especially nitrogen, which plays a critical role in controlling net primary productivity and is limited in many ecosystems (Gruber and Galloway 2008). Modeling (e.g., Thornton et al 2009) and field studies (Magnani et al 2007) confirm a major role of nitrogen deposition, working in concert with CO2 fertilization, in causing a large increase in net primary productivity of temperate and boreal forests.
This is an interesting argument, but it has a few moving parts. Let me list them.
1) Increased coal use leads to increased net primary productivity (NPP) .
2) Increased NPP is evidence of increased carbon absorption.
3) Increased carbon absorption leads to increased biologically driven carbon sequestration.
4) Increased biologically driven sequestration explains the post-2000 decrease in airborne fraction.
I’m good with claims number 1 and number 2, but from there they get increasingly unlikely for various reasons. I’ll go get the data and show the actual airborne fraction, but first, let me quote a bit more from Hansen 2012, this time regarding Pinatubo.
Remarkably, and we will argue importantly, the airborne fraction has declined since 2000 (figure 3) during a period without any large volcanic eruptions. The 7-year running mean of the airborne fraction had remained close to 60% up to 2000, except for the period affected by Pinatubo.
and also …
Thus we see the decreased CO2 airborne fraction since 2000 as sharing some of the same causes as the decreased airborne fraction after the Pinatubo eruption (figure 3).
I looked at the chart, and I looked at the dates. Pinatubo was in June of 1991. Here’s what I get from the data:
 Figure 2. Annual airborne fraction (red line), along with 7-year average (blue). Green line shows theoretical airborne fraction assuming exponential decay of excess CO2.
So to start with, from both his graph and mine I’m saying absolutely no way to Hansen’s claim that there was a “decreased airborne fraction after the Pinatubo eruption”. Hansen seems obsessed with Pinatubo. He previously has claimed (falsely) that it represented a successful test of his GISS climate model. See here, here , and here for a discussion of how poorly the models actually did with Pinatubo.
He is now claiming (again falsely) that there is some drop in the airborne fraction after Pinatubo. I’m sorry, but that’s a totally false statement. There’s no sign of any unusual drop post-Pinatubo in this record at all, neither in the annual data nor in the average data. The majority of the drop he seems to be pointing to occurred well before Pinatubo occurred …
In passing, let me comment that any reviewer who let any of that Pinatubo nonsense past them should resign their commission. It was the first thing I noticed when I looked at the paper.
There’s a second problem with what Hansen et al. have done. They say regarding their 7-year average (blue line) that: Final three points are 5-, 3- and 1-year means. Sadly, this means that the final point in the 7-year average is forced to be equal to the last point in the raw data … easily the worst choice of ways to handle the final points of any average, almost guaranteed to have the largest error.
But that method does have one advantage in this case. It greatly exaggerates the amount of the recent drop. Note for example that had the data ended one year earlier, the final point in his average would have had a value 60% … here’s what the 7-year average figured their way would have looked like if the data had ended in 2010.
 Figure 3. As in Figure 2, but with the 7-year average ending in 2010 using their method. Note that the final point is forced to equal the 2010 value.
As you can see, their curious treatment of the 7-year average at the end of the data is the only thing that makes the trend look so bad. When changing the data length by one year makes that kind of change in an average, you can assume that your results are far, far from robust.
But neither of those is the main problem with their claim. The main problem is that the general slight decrease in the airborne fraction is an expected result of the exponential decay of the excess atmospheric CO2. As the green line shows, the actual results are in no way different from the value we’d expect to see. The green line shows the result of the exponential decay of the excess CO2 if we assume a half-life of about 46 years. The expected value decreases slightly from 1970 to 2011.
It’s worth noting that if CO2 emissions leveled off entirely, the airborne fraction would gradually decay to zero. This is because if emissions level off, eventually the excess CO2 level will be such that the annual sequestration will equal the annual emission with nothing to remain airborne.
To close, let me return to their claim:
We suggest that the surge of fossil fuel use, mainly coal, since 2000 is a basic cause of the large increase of carbon uptake by the combined terrestrial and ocean carbon sinks.
I must confess that I hadn’t looked at fuel use by type in a while, so I was unaware of a large spike in coal use.
 Figure 4. Carbon emissions by fuel type. Note the steady rise of natural gas, which will only increase with the advent of fracking.
So yes, coal use has indeed spiked since 2000, with a jump in coal emissions putting it back out in front of oil. I assume, although I’ve not checked, that this is the result of the huge increase in coal for electricity generation in India and China. And good on them, the folks in that part of the planet desperately need cheap energy.
Returning to the claims in Hansen 2012, it is true that the carbon uptake by the various sinks has constantly increased over time. This increase, however, appears to be much more related to the exponential decay of the CO2, and has less to do with the changes in the biosphere. We know this because the change in the amount sequestered is much larger than the change in the NPP.
Here are the figures. In 1960 the natural sinks were sequestering about 1 gigatonne of excess carbon annually. By 2011, this had risen to 4.5 gigatonnes annually. I agree that CO2 fertilization is real, but clearly this 4.5-fold increase in total tonnage of excess carbon sequestered cannot all be the result of increased NPP from CO2 fertilization.
So while I’m glad to hear that Hansen thinks that coal is good for something, I fear his explanation for the increase in the amount sequestered is not correct. The increases in the amount sequestered have been much, much larger (450% since 1960) than the increase in the amount of sequestration due to greater NPP.
Before I leave, let me remind folks what cheap electricity and energy from coal does for us all, rich and poor alike, every day of the year.
 Figure 5. Daily output of coal energy. SOURCE
That huge benefit to the poor and the rich is what Hansen is trying to get rid of … but he and others have very little with which to replace it. So all that happens is that the price of energy goes up, and the poor once again are impoverished the most.
Brilliant plan, that fellow Hansen truly cares about the future … he just doesn’t seem to care if he hurts people in the present.
My best to everyone,
w.
I look at the graphs, and here is what I see:
Fig. 3 shows its blue curve (mostly a 7-year-average) being set to a
single year (2010) at its endpoint. That was an El Nino year, with (by
some accounts, such as UAH) the greatest El Nino spike since 1998.
I look at the red curve (individual curves) in Fig. 2, and see that once
the world recovered from Pinatubo, the airborne fraction has had some
downward trend.
Furthermore, I see that the 1998 El Nino spike and the warm times
around 2004 bumped up airborne fraction. And since then, airborne
fraction largely decreased.
I suspect airborne fraction was higher when the ocean surface had
warming, and decrease of its ability to absorb CO2. Also, expansion
of fertile lands may have had an effect.
“When changing the data length by one year makes that kind of change in an average,
…blank…”
Unless you meant you’re left speechless with disgust (which seems a legitimate possibility), or my browser is misbehaving (always conceivable), this looks like a typo.
[I was speechless with incredulity … and I also forgot to finish the sentence. Thanks. -w.]
Thanks for your work, Willis.
I didn’t waste a lot of time on his paper, but from a quick scan it appeared, at first, he was somehow now seeing reality. That is, he realized more CO2 in the atmosphere means more “plant food”.
But, then I got to the last two paragraphs….Science out/”Mad Hatter” in.
Thanks Willis
In Our Energy Predicament, Gail Tverberg graphs China’s rapid increase in coal use. See Fig. 4. Gail lays out the requirements for the needed replacement fuel and electricity:
Their method of mass balance leads them to false conclusions. Natural emission and sink rates are at least an order of magnitude greater than anthropogenic emissions. Slight changes in these natural rates can easily account for the observed accumulation in the atmosphere. Trees grow faster at higher concentrations. Several years later, the extra leaf decay will add to the accumulation in the atmosphere. Anthropogenic emissions probably contributes less than ten percent to this ever changing cycle. http://www.retiredresearcher.wordpress.com.
Love the fact that the anti-coal brigade is being schooled. Just hope we can some how get rid of the “green” bio fuels which are starving people, destabilizing governments around the globe.
Instead of feeling smug about using 40%of our grain to make fuel, a fuel which requires more fossil fuel to process than any carbon savings it might be said to have, lets take that grain and feed people. That will help stabilize the globe.
Lets give people in areas that are energy deficient a way to cook their meals using biomass that is more energy efficient, rocket stoves.
Lets help restore land. Help Haiti. It has been denuded, all top soil washed away. A wasteland unable to support anyone. Almost all food was imported. That was before the earthquake.
Lets restore land and water resources. Lets make sure that the energy resources that made our country are available worldwide.
The dominant issue with regard to CAGW is whether feedbacks in our climate system are positive or negative, alarmists claim they are positive while skeptics claim they are negative
With respect to airborne CO2, what Hansen’s data is apparently showing is that as emissions continue, the atmospheric CO2 level does not continue to rise indefinitely but instead heads towards a new equilibrium level (that’s the implication of a decreasing airborne fraction). This is negative feedback (no feedback would be linear increasing airborne CO2 while positive feedback would be faster than linear rise for constant emissions). Further proof that skeptics are right, our natural system are dominated by negative feedback.
As to the mechanism, I would very much expect that the higher atmospheric CO2 would lead to greater plant growth and, that as that accelerated, it would absorb a larger and larger fraction of the CO2 emissions which if I understand the article correctly is what Hansen is claiming. Basically sequestering it into the biosphere.
The implication is that our CO2 emissions are greening the planet, increasing bio productivity and making the Earth more verdant. After all, what we are really doing is returning to the biosphere, carbon that got accidentally sequestered millions of years ago and during the age of the dinosaurs the Earth was apparently a pretty verdant place. Seems to me a pretty wonderful positive outcome which we should all be rejoicing.
I can’t believe I would ever agree with Hansen but if my interpretation of the article is correct he is well on the way to admitting the skeptics were right all along.
No one would try to run a closed greenhouse at 390 ppm….
..and even at 1500ppm it can drop to “limiting” in one light period
From looking at the red graph line it appears that the airborne fraction started decreasing in anticipation of Pinatubo.
I guess that is proof of Gaia at work…
I wonder if it ever occurred to Hansen, that maybe, just MAYBE, correlation isn’t causation.
What was the name of that paper from a couple of years ago, that concluded IT IS MUCH WORSE THAN WE THOUGHT because the airborne fraction was increasing? They claimed that the natural protective C sink was becoming saturated … wasn’t Hansen involved with that one in some way?
So where does the nitrogen come from? Would that be thermal nitrogen fixing? If so, why is this different for coal compared to oil or gas?
Oh dear
First we have a figure for fossil fuel emissions based on very unreliable assumptions of what is actually being burned around the world. Back of the envelope job really.
Next we have a supposed estimate, partly based on the initial assumption, of the proportion of fossil fuel emissions in the atmosphere. Needless to say the supposed methods of distinguishing between natural emissions and those produced by burning fossil fuels are highly questionable and wholly unproven.
No matter. All this speculative bunkum can apparently be quantified by mystical means and presented as a cheerful little graph in blue and red.
Except of course the graph does not quite agree with the notions of those who believe in the utter veracity of such vapoured imaginings.
So some mythical explanation, unsupported by any empirical evidence, must be conjured up to explain the difference: to the entire satisfaction of those who promote these fallacies.
Now what was that song again?
‘and you tell me
over and over and over again my friend
why you don’t believe
we’re on the eve of destruction’
With all respect to Anthony and his people who have done so much to bring some badly needed reason and logic to this hysteria of pseudo scientific charlatanism with it’s excreta tauri, balderdash and utter codswallop.
But this one is enough to make a cat laugh: or even that honourable member of the Union of Concerned Scientists the great Kenji himself: may his shadow never grow less.
Kindest Regards
I understand that by burning coal we are merely returning to the biosphere CO2 which was sequested eons ago and since CO2 is plant food, this additional CO2 is promoting plant growth, and thereby greening the biosphere, but I am somewhat confused as to what Hansen thinks that all that coal which was burnt in the late 1970s/1990s did.
In the 1970s/1990s, the majority of electricity was produced by coal (not gas), why did not all this coal burning green the biosphere?
Why did coal burning in the late 1970s/1990s lead to global warming whereas coal burning today has caused the present temperature hiatus?
Willis, you are right to observe that Hansen is obsessed with volcanic activity and Pinatubo, and I share your sceptism that that incident in some way validates the models. I consider that the Team over hype the effects of volcanoes. I consider it likely that the claimed forcings are over hyped.
consider Krakatoa, which we know from historical accounts did have global implications and led to a year without summer. I recall reading that the Team consider that Krakatoa may, for a few years after the eventt, have led to cooling of up to 1.2degC. That figure is a remarkable large figure, and if the aerosol emission forcing from that eruption truly depressed temperatures by about 1.2degC, it would mean that had Krakatoa not erupted, temperatures in the 1880s would have been at least 0.3 to 0.4 degC warmer than today! The Team when ascribing such large forcings to volcanoes may have overlooked that point.
In tomorrow’s newspapers there should be headline:
“Famous Government Climate scientist declares: Plants are now absorbing CO2 faster than humans can emit it”
But sadly there will not be.
Emissions are not carbon, they are carbon dioxide. The atmosphere is not a pool of gasses, it is a flow through system. Biology has been controlling the CO2 for over a billion years. Also the O2. Bacterial biology controls the N2. Respiration adds to the flow, photosynthesis removes.
If you call the annual CO2 fluxes 100 percent, then humans add 3.5 percent at most.
Annual turnover depends on the various component fluxes, but is around 20 percent.
The annual CO2 fluxes have reached 103 percent of pre-industrial. The photosynthetic removal will rapidly adjust to the available input.
Since the anthropogenic proportion of the atmospheric CO2 flow is .035, then thats
14ppm. Next year it will still be 14ppm.
There are so many sources that say natuaral CO2 fluxes are 33 times human that even the IPCC uses those numbers. Even relatively small ecosystem changes are overwhelmingly larger than any human additions. The IPCC assumption that natural CO2 fluxes are “balanced” is so unfounded that it’s bizarre beyond sanity.
The first the best link Hansen provides in his article is dead : http://www.columbia.edu/~mhs119/Emissions/Emis_moreFigs/ it is to illustrate Increased coal use occurred primarily in China and India.
This eternal myth that India and China are emitting in the same league 50/50 is not supported by numbers: 20/80 for India/China comes closer.
And let us not forget that crop plants (especially corn and sugar cane) fix CO2 at much higher rates than trees, so this “drop” in CO2 is a reflection of more agricultural production from cultivated land. Yes, much of what they fix will be recycled to CO2 again quickly, but this will not be included in Hansen’s anthropogenic fraction because it doesn’t come from fossil fuels.
Hansen is desparately trying to keep up his relevance in a world which is passing him by. Making stranger and stranger claims in order to keep up his ‘hit’ rates in the MSM while everyone else is ignoring him.
Perhaps this is Hansen’s twisted way of trying to explain away the lack of recent warming, “CO2 still has a drastic effect on the climate, it’s just that it’s temporarily being sequestered by natural sinks to later rear it’s ugly head in a catastrophic Venusian apocalypse!”.
Willis – you said correctly:
“There’s a second problem with what Hansen et al. have done. They say regarding their 7-year average (blue line) that: Final three points are 5-, 3- and 1-year means. Sadly, this means that the final point in the 7-year average is forced to be equal to the last point in the raw data … easily the worst choice of ways to handle the final points of any average, almost guaranteed to have the largest error.”
I agree – but by saying “worst choice” are you suggesting there exists a “good choice” for handling this final point? It seems to me that the endpoint problem is fundamentally unsolvable – an “uncertainty relationship” in time/frequency analysis. No criticism – Just curious.
Say, I know that the huge spike in CO2 emissions comes from coal fired power, and the bulk of that is indeed from China, but the Chinese are in fact seeking ways to limit those CO2 emissions by improving upon current coal fired power technology. They are in fact constructing huge new power plants that generate more electricity, do it more efficiently, and in the process, lowering CO2 emissions, and not by some piddling amount, but by an average of 15% when compared to equivalent older technology coal fired plants of the same Nameplate Capacity.
The Chinese are using USC (UltraSuperCritical) technology for their new plants, enabling them to run higher Power generators, in fact single units capable of generating 1000MW, previously only the province of large scale Nuclear Power Plants.
70s/80s technology plants will burn 330grams of coal per KWH delivered, and these new USC plants only burn 282 grams per KWH delivered, and by extrapolation 15% less CO2 emissions. It’s not theoretical, because they have been doing it for a number of years now.
Now, while you think 15% lowering of emissions may not be all that much, that’s around 2.6 million tons of CO2 lower per year than an equivalent sized older technology plant.
In fact the Chinese are actively working on ways to even further lower emissions by working towards Advanced USC.
The JoNova site has an article on this, and for disclosure purposes, I was the author of that Guest Post at her site, and the following is the link to that Post.
http://joannenova.com.au/2013/03/upgrade-coal-power-and-cut-15-of-emissions-will-the-greens-consider-coal/
Tony
How does this correlate with Atmospheric Carbon Dioxide recorded at Mauna Loa?
Shouldn’t the end result (either way) show some affect on the total amount of Atmospheric Carbon Dioxide?
http://www.esrl.noaa.gov/gmd/ccgg/trends/global.html
My preferred method for averaging trend lines is an exponential moving mean.
Modified moving average from the Wiki:
“A modified moving average (MMA), running moving average (RMA), or smoothed moving average is defined as:
” MMA(today) = {(N – 1) x MMA(yesterday) + price} /N
“In short, this is an exponential moving average, with alpha=1/N.”
Connections page 1
In re bofuels, readers may recall my recent comment abojut people in poor countries burining shit (!) and stripping the scanty remaining vegetation ar ound them, for fuel. Not a pretty picture for biomass.
However, I do recall reading some time back (unfortunateoly cannot recall where) of varieties of canola (so nasty tasting as food, but makes good diesel with few minor adjustments to engines, and burns cleaner) under development that could produce economic quantities at competitively low cost, on marginal land unsuited for food grains.
If anyone posting here has any more information on this, I’d like to know. Of course, grfowing canola for fuel woould have to pass the economics test, and it actually must be feasible to grow it on marginal land, before this would represdent anything more than the tinies supplement to petroleum. But an interesting idea.
Bernie Hutchins says:
March 29, 2013 at 8:32 pm
Good question, Bernie. In a piece I wrote a while ago but the !@#$%^ wouldn’t publish in the journals, I showed that for a given dataset it is fairly trivial to determine the resulting average error from a given method of handling the endpoints in a centered average. Then all you have to do is try the various methods, and pick the one that gives the lowest you know is the best of your known options for that dataset.
So yes, while there may not be a “good” choice, there is certainly an objectively determinable best choice for a given dataset.
Regards,
w.
Thornton et al 2009) and field studies (Magnani et al 2007) confirm a major role of nitrogen deposition, working in concert with CO2 fertilization, in causing a large increase in net primary productivity of temperate and boreal forests.
I thought that was the interesting part. After water, nitrogen availability is the biggest limiter of plant growth. Increase nitrogen availability and you increase biosphere productivity.
I hear today the USA has issued new vehicle emission rules that will substantially reduce nitrogen emissions (by converting nitrogen oxides to nitrogen).
This is part of an ongoing process since the 1970s of reducing emissions of nitrogen oxides. I have never seen any study calculating how much this affects biosphere productivity. The EPA and all the rest of the regulatory agencies tinkering with things they don’t understand the consequences of.
I’d add, N2O is 300 times more powerful a GHG than CO2. Add in the ozone depleting properties of nitrogen gases and you have a significant GHG potential as well.
TonyfromOz says:
March 29, 2013 at 8:53 pm
I agree, and they and the Indians are to be commended for their work in this area. I meant nothing derogative, and nothing beyond what I said—it is likely the post-2000 spike is mostly China and India.
All the best,
w.
AntonyIndia says:
March 29, 2013 at 8:09 pm
There appears to be a whole folder missing from the Columbia website. The link originally went to a folder on the website of Makiko Sato and James Hansen.
There is a document:
http://www.columbia.edu/~mhs119/EnergyConsump/
which shows a bit of it, China but not India. But the whole folder they reference has vanished, and as far as I can tell none of the documents in the folder is available anywhere on the web.
Go figure …
w.
No Stunad. CO2 is greening the planet.
The comment section in this article is priceless;
Sen. Inhofe ‘proud’ to be target of climate flick ‘Greedy Lying Bastards’
“Sen. James Inhofe (R-Okla.) sees criticism of him in a recent documentary about climate change as a badge of honor.
He’s among the targets in “Greedy Lying Bastards,” a recent film the claims to document fossil fuel industry-backed efforts to sow doubt about climate science and thwart emissions curbs.
“I was not surprised to see myself front and center on the promotional material for this climate-change movie, and quite frankly, I’m proud of it,” Inhofe told Tulsa World.
If the trailer is any indication, Inhofe appears repeatedly in the film. He’s also among the faces on one of the promotional posters, along with Exxon’s CEO and former Vice President Cheney.”
http://thehill.com/blogs/e2-wire/e2-wire/290961-inhofe-proud-to-be-target-in-climate-flick-greedy-lying-bastards
John –
A “true” moving average is generally understood to be non-recursive (FIR – Finite-Impulse-Response) AND Linear-Time-Invariant (LTI). In the case Willis mentions (dividing by 7, 5, 3, and eventually 1) the processing is not time-invariant (the “tap weights” are changing with time). In consequence, for example, any notion of “frequency response” loses it’s meaning. Your method is time-invariant but recursive. Nothing wrong with that – not-unlikely a better way here.
My concern is the notion of trying to exactly define a current value (energy if you will) while simultaneously exactly defining a time event (end of a time sequence). The “Uncertainty Relationship”, per Heisenberg, actually applies generally not just to quantum mechanics, but as a Fourier Transform property. Likely all it means here is that you can’t tell too much based on the last value(s). Willis pointed that fact out. Really this may be just saying that you actually DO need a LOT more data to speak of climate.
“The majority of the drop he seems to be pointing to occurred well before Pinatubo occurred …”
Willis,
I looked up, for the years 1990:1994,
CO2 growth ppmv 1.10 0.99 0.48 1.40 1.91
Total emissions Gton 6151 6239 6178 6172 6284
Airborne fraction: 0.395 0.350 0.171 0.501 0.671
There was a sharp drop in 1992, not sustained.
Willis says:
Because he can’t think of anything else?
Now, where are all those Warmists that said co2 is not plant food? Al Gore called it a pollutant. Here is that pollutant at work in a location near you.
http://youtu.be/P2qVNK6zFgE
I dont bother to read anything Hansen comes up with. The man has totally lost the plot and now lives in an Alice in Wonderland fantasy and the mad hatter’s world of logic.
Willis –
I would love to see your notes on treating endpoints and averaging. Is there a link somewhere?
Your comment really caught my attention as only 28 hours ago (although dated Mar 30) I posted a 24 page application note (AVERAGING – AND ENDPOINT GARBAGE) on my site. It is at:
http://electronotes.netfirms.com/AN395.pdf
Like you, I see that changing the length of the moving average enhances the error on multiple samples toward the end. I guess my main theme there was that engineers are likely good judges as to whether or not a time series corresponds to anything that is “real”. But when I suggest that engineers really should be running the world, I was told that “engineers don’t know anything – they just know how to make things work.” I am missing the insult here – somehow.
Bernie Hutchins
I wonder why they try so hard to make it complicated. Hansen needs to learn some basic chemistry and physical chemistry. The former tells us that stoichiometry determines how much carbon dioxide will be generated from a tonne of coal. The latter tells us how much photosynthesis will be affected by an increase in the partial pressure of carbon dioxide. Isn’t it ironic that Arrhenius determined much about the rates of chemical reactions? But then, I’m just a retired chemical engineer, what would I know?
It is important to note that during geologic times nature was able to remove over 3,500 ppm from the atmosphere. Does anyone know when the Earth is likely to see 1,000 ppm? My rough estimate certainly puts it well above 100 years and less than 220 years (based on last year’s annual rise). I am optimistic that humans will find (or have already found) reliable and abundant alternative energy sources by then. I am also optimistic about increased energy use efficiency through technology.
Hansen is getting closer, but is still hindered by overconfidence in a carbon cycle model with very large unknowns. And that’s just (his) known-unknowns that the IPCC also ignores.
To make progress, he needs to suspend his overconfidence in CO2-attribution based on the likely flawed treatment of isotope-ratios. They appear to take no account of NON-photosynthetic biochemical mediation of CO2 oceanic dissolution rates (coupled with temperature etcetera) and hence isotope ratios too. (Not that I believe they’ve got the photosynthesis sorted).
The oceanic diffusive boundary layer is populated with micro-organisms. Some even like to eat oil. Just because the human eye can’t see them, it doesn’t mean they aren’t going anything. This planet has had an ocean surface for quite a long time now. Those micro-organisms have accumulated a few fancy tricks.
Carbon dioxide diffusing across the bio-filmed atmospheric boundary layer into mildly alkaline sea water is hydrated and ionized to bicarbonate, which prevents it immediately diffusing back out again. This hydration step is actually much slower than a diffusion limited reaction. Which makes it not surprising that ~100% of all living species use the enzymatic catalyst carbonic-anhydrase to speed up the reaction by a factor of about ten million. We couldn’t get the CO2 out of our lungs quickly enough without it. To assert or pretend it has no effect at ocean surfaces strikes me as unlikely, to say the least.
When I look in the IPCC AR5 documents for answers to these kind of doubts, I discover pitiful phrases like
The only confidence I can draw from reading such statements of brazen ignorance, is that no organization celebrating such incompetence could be remotely capable of organizing a functioning conspiracy.
Of course it is greening the planet. The biosphere is carbon limited. Carbon is cash. It is the dollar in the biological economy. There are other currencies to be sure, but when cold catches Carbon… We conduct an inadvertent experiment. Near the peak of an interglacial we increase the money supply (I get closer to 5 than 3.5% but whatever).
Short term sequestration would be both biomass and carbonate. Biomass is a checking account, carbonate is burying it in the backyard. I don’t like to see the airborne fraction going down, it’s a bad economic indicator.
Mods, do I have a comment in the spam box ?
m.
[Reply: Not any more 😉 -ModE]
An “airborne fraction” where did that come from?
Thanks Willis. Hansen’s all over the place. I commented on his latest droolings on another blog (before your more reasoned analysis appeared) with the single word ‘Bizarre’. He seems to be revealing himself to be what he always was, an overeducated idiot.
It’s instructive to watch a scientific ‘consensus’ previously termed ‘robust’, ‘solid’ and even ‘settled’ now dissolving into a series of desperate excuses – Trenberth and his abyssal heat; Hansen and his aerosols and carbon sinks; climate sensitivity may be a tad less than we thought; clouds from all sides now, etc, etc.
Bizarro climate science RIP, 1988-201?.
” Hansen seems obsessed with Pinatubo. ”
Exaggerating the effects of volcanic emissions, esp. Mt P is the corner stone of exaggerated effects of CO2. The more volcanic emissions can rigged (model parameters) to produce an assumed cooling in late 20th c. , the more CO2 can be rigged (amplified by model parameters) .
This is why all GCMs, except the new Hadley model, quietly “announced” on Christmas eve, get post-1997 so badly wrong.
This game only works when you have enough volcanoes to keep up the pretence.
Well done for such a clear demonstration of how messy “runny” means can give totally false results.
NASA would not have got a man on the moon if they used running means in their calculations, yet it is rife in climate science. There is a large part of the “professional” climate science community that has not got beyond high-school level data processing. If they were not allowed to use running means and fit linear trends , they’d be lost as to where to start.
I would credit Hansen for explicitly saying what he did. Most just run their running means up to the end. where the window is half empty. and probably don’t even realise it’s not valid, or at best assume it “does really matter”. ( This what Pratt did in his AGU “poster” fiasco, it took a week of arguing before he even admitted he’s not done it correctly. )
“In a piece I wrote a while ago but the !@#$%^ wouldn’t publish in the journals, I showed that for a given dataset it is fairly trivial to determine the resulting average error from a given method of handling the endpoints in a centered average.”
Maybe you’d like to publish here ? I’d certainly be very interested see how to establish an error on something like that.
Are these the ones your looking for?
http://www.columbia.edu/~mhs119/Sensitivity+SL+CO2/
taken from this page
http://www.columbia.edu/~mhs119/
“I do wish people would show the underlying data and not just averages,”
An omission you also make 😉 Having gone to effort of finding the data to produce your figure 3, a data source link would be good.
Simple oversight I’m sure since you do link the source for the coal data.
TonyfromOz says:
“In fact the Chinese are actively working on ways to even further lower emissions by working towards Advanced USC.”
I disagree with what you say here Tony. I suspect the Chinese do NOT care about CO2 emissions and don’t buy into CAGW. Instead they are working towards Advanced USC because it is more efficient and thus you get more energy out of every ton of coal which potentially means lower cost overall!
Implying that the Chinese are more interested in lowering CO2 emissions than they are in getting the most energy out of each ton of coal is NOT substantiated in my opinion.
I wish the US would start building lots of these Advanced USCs as well. We really need cheap and abundant energy here in the US if we are to remain a leading world power and maintain a high standard of living. In addition, need to have a low cost alternative to natural gas to help keep prices low due to competition.
Jimbo says:
March 29, 2013 at 11:07 pm
It is important to note that during geologic times nature was able to remove over 3,500 ppm from the atmosphere…”
//////////////////////////////////////////////
The Paleo record is a real problem to the CAGW conjecture and tipping points.
During the times when Earth had high CO2 levels (possibly twice the level that you cite), it was often accompanied by warmth. That being the case, the warm oceans would have had a lesser capacity to act as a carbon sink. One major issues is how did the planet sequester these high levels of CO2? Precisely what were the sinks? It is probable that the oceans could only have begun to play a role in increasing the carbon sink, once ocean temperatures began to fall. Given the heat capacity of the oceans, it is likely, there would have been a significant lag before they themselves could have contributed towards the reduction of CO2 levels.
Willis:
Thankyou for this item which contains some important information. But you have accepted a dubious assumption which Hansen and others have introduced. That assumption distorts the entire discussion and provides severe doubt to its conclusions.
As bw says at March 29, 2013 at 8:05 pm, your entire discussion is based on adoption of an unfounded and very, very improbable IPCC assumption. You, Hansen and the IPCC say
NO! It is NOT.
The airborne fraction is the increase to atmospheric CO2 concentration which occurs in the air each year and is expressed as a proportion of the anthropogenic emission.
And you continue from that important mis-statement saying
NO! That is NOT true.
The accumulation rate of CO2 in the atmosphere (~ 1.5 ppmv/year which corresponds to~ 3 GtC/year) is equal to almost half the human emission (~6.5 GtC/year). However, this does NOT mean that half the human emission accumulates in the atmosphere, as you and others assert. There are several other and much larger CO2 flows in and out of the atmosphere. The total CO2 flow into the atmosphere is at least 156.5 GtC/year with ~150 GtC/year of this being from natural origin and 6.5 GtC/year from human origin.
Nature does not know whether a CO2 molecule was emitted from an anthropogenic or ‘natural’ source.
So, on the average, ~3/156.5 = ~2% of all emissions accumulate each year.
This is important because you, Hansen and the IPCC frame the discussion on the basis that the human emission is known to be responsible for the recent rise in atmospheric CO2 concentration, but that is NOT known.
It is extremely unlikely that the 97% natural CO2 emission is mostly back and forth cycling which can be assumed to be constantly in balance. This improbable balance may exist, but nothing else in nature is observed to be so in balance and constant.
An imbalance of less than 2% p.a. between the natural emission and sequestration would account for all of the observed rise in atmospheric CO2. And there are several possible reasons why such an imbalance may have occurred.
One example of such a possible cause of natural altered imbalance is variation to undersea volcanism centuries in the past. Increased undersea volcanism would release additional sulphur ions which travel with the thermohaline circulation until they reach ocean surface layer centuries later. The increased sulphur in the ocean surface layer would reduce the pH of the layer with resulting alteration to the equilibrium concentrations of CO2 in the air and ocean surface layer.
A change of only 0.1 in ocean average pH (which is much, much too small for it to be measurable) would induce a rise in atmospheric CO2 concentration which is larger than has been observed in the past century. Hence, undersea volcanism could be the cause of ALL the observed rise to atmospheric CO2 concentration. And there are other possible causes, too.
Please note that the human emission of CO2 would not affect this in any way: the changed equilibrium would be the same whether or not the human emission existed.
The unfounded assumption that
is important. It assumes the natural emission and sequestration is constant and in balance.
This improbable assumption of balance between the natural inputs and outputs provides the conclusion that emissions from humans are causing the rise in atmospheric CO2 concentration. And that unfounded conclusion is distorting energy and economic policies around the world.
I don’t know if the rise in atmospheric CO2 concentration is entirely natural, or entirely anthropogenic, or partly natural and partly anthropogenic. But I want to know.
The myth that natural emissions and sequestrations of CO2 are known to be in a constant balance needs to be dispelled if we are to determine the true causes of the recent rise in atmospheric CO2 concentration and, thus, to avoid distortion of energy and economic policies.
Richard
[Bolding fixed – I hope as you intended ~mod]
The next big thing that would answer all of the chemical imbalance problems of the Earth would be a method to atomically remove a proton and a neutron from an atom of Calcium converting it to an atom of Phosphorus, and if the process could be done with ground lime stone as the basic input, the output would be energy, water, CO2, and the neutrons being absorbed producing the energy.
If the process were net exothermic, use it to generate steam to drive generators.
Reblogged this on grumpydenier and commented:
Once again, there is more common sense contained in the comments section than the paper presented in the lead blog item. Never forget to read the comments, it’s a vital part of one’s education.
Nick Stokes says:
March 29, 2013 at 10:37 pm
Thanks, Nick. Unfortunately, I can’t replicate your figures. I used the CO2 emissions data from CDIAC, and the CO2 data from NOAA. I was able to duplicate Hansen’s figures quite closely using these, but the numbers are very different from yours.
Regards,
w.
Bernie Hutchins says:
March 29, 2013 at 10:57 pm
Well, as a result of your earlier comment I’d written it up already and sent it to Anthony. To be published in the next day or so.
w.
Good post Willis.
Greg Goodman says:
March 30, 2013 at 1:36 am (Edit)
Yeah, my bad, I thought I’d included them. See a couple of posts above for the data sources, CDIAC and NOAA.
w.
There are a lot of unknowns in the distribution of sinks and sources in the CO2 cycle, but there is a general understanding of the overall sink capacity of CO2 by the oceans and the biosphere. The latter is relative easy to know, as the biosphere captures CO2 with a huge preference for 12CO2 and at the same time delivers O2. Both the O2 and d13C balances can be used to estimate how much CO2 the biosphere captures (the O2 changes are a real analytical challenge!). The remaining sink capacity is mainly in the oceans, as other sinks are much slower in reaction to higher CO2 levels. Simple (physico-chemical) solution of CO2 in the oceans also changes the d13C level at the sea-air border, but that is far less pronounced than the biosphere and any ocean-air CO2 cycle still increases the d13C level of the atmosphere, due to the much higher d13C level of the ocean waters compared to the atmosphere. Here the estimates over the period 1993-2002:
http://www.bowdoin.edu/~mbattle/papers_posters_and_talks/BenderGBC2005.pdf
The sequestering was 1.7 ± 0.5 and 1.0 ± 0.6 GtC/yr for the oceans and biosphere resp.
The emissions in the same period were average 6.6 GtC/yr, thus the remaining “airborne fraction” was around 59%. Not the original molecules introduces by fossil fuel burning, but as increase in total mass of CO2 in the atmosphere.
John Andrews says:
March 29, 2013 at 9:10 pm
My preferred method for averaging trend lines is an exponential moving mean.
Modified moving average from the Wiki:
“A modified moving average (MMA), running moving average (RMA), or smoothed moving average is defined as:
” MMA(today) = {(N – 1) x MMA(yesterday) + price} /N
“In short, this is an exponential moving average, with alpha=1/N.”
===
Perhaps you should say why you “prefer” it and what you think “averaging trend lines” is and what it represents when you’ve done ?
All this too nitty gritty analysis on a yearly or a 7 years basis does not make a lot of sense. Climate, if changing, is not responding that fast. Also, the observations and balance calculations have a too large imprecision to allow for such hair-splitting analysis. Dismissed!
And nothing is said about seasonal emission and sequestration of huge quantities of carbon dioxide by biomass, a larger amount than what is emitted by fossil fuel burning.
The global atmosphere has a mass of approx. 5.3E+18 Kg or 1.82E+17 Kmole (weighted average molecular weight 28.97 g/mole).
Human fossil burning is at approx. 9.1E+12 Kg carbon per year or 7.62E+11 Kmole/a.
From Wikipedia (http://en.wikipedia.org/wiki/Biomass_(ecology) ) we learn that the annual biomass production from terrestrial and oceanic sources is estimated at 104.9 billion tonnes C, or 8.73E+12 Kmole/a.
In this competition Nature wins to Human with the score of 11.5 to 1.
Orders of magnitude matter!
Volcanic activity may come on top of this but the homeostatic nature of the climate system makes it return back to a stationary situation within a few years.
Since the beginning of the industrial age (1750-2011) a total of 364.5 billion metric tons of carbon (http://cdiac.ornl.gov/trends/emis/meth_reg.html) were emitted by burning fossils, or 3.03E+13 Kmole. Thus in 261 years humans have emitted 3.5 times what biomass is making in one single year.
These cumulated human made emissions would have increased the atmospheric CO2 concentration by 167 ppm. But it increased by only 390-280 = 110 ppm. Therefore, one can conclude that the equivalent of 57 ppm –or 34% of the total– have been absorbed as additional biomass or as carbonates in sediments.
In 2012, CO2 increased by about 2.50 ppm and the Airborne Fraction rose back up to 56% again so Hansen’s premise that it is declining is just wrong. It varies from year-to-year but has been close to 50% since about 1950.
In 2012, Human emissions were close to 9.5 billion tons and the amount of Carbon in the atmosphere increased by 5.35 billion tons.
The most up-to-date Mauna Loa and Global average CO2 numbers are here.
ftp://ftp.cmdl.noaa.gov/ccg/co2/trends
But the Airborne Fraction is not really the best measure. The question is how fast are the natural sinks absorbing the Excess Carbon out of the atmosphere. The equilibrium level is about 270 ppm to 280 ppm. The Natural Sources and Sinks have been in balance over the long-term at this level in interglacial conditions (it is lower in the ice ages by about 16 ppm per 1.0C decrease in temperatures in the ice ages but going back 24 million years in non-glacial conditions, 270 ppm to 280 ppm has been the long-term mean).
Since 1750, the Natural Sinks have been slowly increasing as the proportion of Excess Carbon in the atmosphere has increased above this equilibrium level. It is rising to about 2.0% per year of the Excess Carbon / CO2 in the atmosphere. I can’t say it will continue to rise but the trend has been increasing.
If we stopped emitting Carbon tomorrow, this sink rate would likely continue at this level, and in about 150 years, we would be back to close to 280 ppm.
http://s24.postimg.org/xk49n2x2t/Absorption_of_CO2_by_Natural_Sinks_PPM_1750_2012.png
Carbon in the atmosphere back to 1 AD.
http://s10.postimg.org/f7r79snft/Carbon_in_CO2_in_the_Atmosphere_1_AD_2012_Law_D.png
Ah I see now!
Half of man made CO2 warms the atmosphere, half goes into plants and the other half acidifies the oceans. Amazing stuff.
Willis,
“Thanks, Nick. Unfortunately, I can’t replicate your figures.”
That’s a puzzle. The figures I linked are from NOAA too. Here is the NOAA plot of them, showing the big dip in CO2 growth in 1992. Emissions didn’t change much.
What CO2 residence time is Hansen working on? The IPCC work on 200 years but research shows 5-7 years. It could be far less but it certainly is not 200.
If humans emit 9Gt of CO2 then this is small compared to the 291Gt emitted by natural producers.
Get real Hansen it is time for you to retire honourably now, but wait and it could get messy.
bw says:
March 29, 2013 at 8:05 pm
If you call the annual CO2 fluxes 100 percent, then humans add 3.5 percent at most.
What you do forget is that fluxes are not adding anything to the total mass of CO2 in the atmosphere, as long as the inputs equal the outputs. Humans add 3% to the natural inputs, but the natural input taken at 100% are exceeded by the natural outputs at 101.5%. The difference is the “airborne fraction”, a year by year growing increase of CO2 in the atmosphere.
Annual turnover depends on the various component fluxes, but is around 20 percent.
Right but irrelevant. It is the decay rate of the extra CO2 which is over 40 years half life time which is of interest (the 1.5% extra natural sink compared to the natural inputs), not the turnover.
The photosynthetic removal will rapidly adjust to the available input.
Ultimately it will, but it adjusts slower than you think: about 1 GtC/yr of CO2 was sequestered by the biosphere from the 6.6 GtC/yr extra CO2 input in the period 1993-2002. But because the human emissions and the increase in the atmosphere are slightly exponential, the net result over time is a slightly exponential increase in sequestering by the biosphere and a near constant airborne fraction.
Since the anthropogenic proportion of the atmospheric CO2 flow is .035, then thats
14ppm. Next year it will still be 14ppm.
Even with an exchange of about 20% of the atmospheric CO2 with other reservoirs, the growing emissions increased their fraction in the atmosphere over time. See:
http://www.ferdinand-engelbeen.be/klimaat/klim_img/fract_level_emiss.jpg
The accumulated fraction of fossil fuel CO2 in the atmosphere nowadays is around 9% of all CO2 in the atmosphere, that is about 70 ppmv. About 1/3rd of what was emitted by humans still resides in the atmosphere.
There are so many sources that say natuaral CO2 fluxes are 33 times human that even the IPCC uses those numbers. Even relatively small ecosystem changes are overwhelmingly larger than any human additions. The IPCC assumption that natural CO2 fluxes are “balanced” is so unfounded that it’s bizarre beyond sanity.
Again, fluxes are of no interest, the net gain or loss per year is what causes an increase or decrease of CO2 in the atmosphere.
The natural variability over the past 50+ years is not more than +/- 1 ppmv around the trend, mainly temperature dependent:
http://www.ferdinand-engelbeen.be/klimaat/klim_img/dco2_em.jpg
Humans emit about 4 ppmv/yr, the trend is 2 +/- 1 ppmv/yr. Thus human emissions are twice the trend and twice the natural variability around the trend…
Bernie Hutchins says:
Your comment really caught my attention as only 28 hours ago (although dated Mar 30) I posted a 24 page application note (AVERAGING – AND ENDPOINT GARBAGE) on my site. It is at:http://electronotes.netfirms.com/AN395.pdf
===
Interesting note but you have barely scratched the surface of the problems of using running means. I’ll wait to see Willis’s article rather than go into much detail here. However:
Averaging is a valid way to remove random variations. It can not be used to correctly remove cyclic variation or in the presence of cyclic variation. Runny means inherit this problem.
Runny means let through some frequencies, but worse still, they actually invert them and make them go the wrong way. This can lead the RM showing a peak when the data has a trough and vice versa. How much use is that?
Add to this the end zone problem when people try to run these filters (as Hansen does here) when there is not enough data to fill the window, and you can produce lots of pretty graphs that are totally misleading (as Hansen does here) .
This may just about get overlooked in high school but it is absolutely amazing that people with PhDs and a career history in what is claimed to be science are doing this kind of crap and getting it published.
Hansen must be about 85 by now. If he hasn’t learnt the basics yet, I fear it may be too late. 😉
This ‘airborne fraction’ or residual can only be calculated by adding known emissions into the equation. The problem is that emissions are largely guestimates, for example the world’s industrial emissions and per country emissions do not coincide due to gross differences in the methods of estimation (as indicated by a.jones earlier)
To me, this is one of the most interesting sides of the debate and the alarmists have all sorts of long range persistency estimates for anthropogenic CO2. But this graph and calculation method throws most of the alarmist persistency estimates out of the window, the ball should be thrown back at the alarmists with the message ‘sort out your settled science or we’ll continue laughing’
Nice work Willis (yet again). Related to this post is the work being done to quantify the number of people who die each year from coal-related pollution. In Canada there is a modelling program known as ICAP that relates smog levels to coal deaths. This is something you may want to pick apart as it has been relied upon heavily to phase out coal-fired generating stations in Ontario and the pressure is now on Alberta (where this model has been further quoted). Ross McKitrick took a run at testing ICAP and found it predicted more people would die from coal pollution than died in the entire year. This link gets you to a summary which links to Ross’ paper.
http://www.tomadamsenergy.com/2013/01/11/information-smog/
Ferdinand Engelbeen says on March 30, 2013 at 4:12 am, “Again, fluxes are of no interest, the net gain or loss per year is what causes an increase or decrease of CO2 in the atmosphere.”
Ferdinand Engelbeen, please could you clarify what you mean by “net”?
If a flux into the atmosphere increases but the other fluxes are unchanged then surely the “net” CO2 in the atmosphere will change?
How do you dissociate the “net gain or loss per year” from the movements of CO2 into and out of CO2 reservoirs?
Clipe says: March 29, 2013 at 9:21 pm
Connections page 1
(What happens when the electricity fails….)
___________________________________________
Ahhh, James Burke’s Connections. Wonderful. Those were the days.
Perhaps people might recognize from the technology, but this documentary was made 40 years ago (including music from 2001, A Space Odyssey).
These were the days of yesteryear, when the BBC made groundbreaking, interesting, educational and trustworthy news items and documentaries. These were the days of Raymond Baxter, Cliff Michelmore, Patrick Moore and James Burke – icons of broadcasting. People who not only covered the Apollo missions but understood the technology, unlike the vacuous commentaries we invariably get nowadays.
Whatever happened to the BBC? Who were the brain-dead politicos who took it over and destroyed 50 years of tradition, and turned it into the Biased Broadcasting Corporation (and the Brain-dead Broadcasting Corporation)? Where did they come from? Who let them do it?
.
@Nick Stokes. The annual airborne fraction (Figure 3 – early to mid 1970s) shows changes over two years from 100% to 25%. There is no way to identify a single event (such as 1992) using this data set. If there are rapid swings from one year to the next these will be averaged out (with the 7 year filter) while a few low years will be smoothed into the “low” you are looking for. Again, totally meaningless. You can confirm the low around 1992 is not related to Pinatubo because it started well before the eruption.
Moderator:
Thankyou for correcting my formatting error to precisely what I intended. That was very clever and is greatly appreciated.
Richard
Oh the irony – it seems that mankind is Gaia’s way of liberating locked-away CO2 and returning it to the biosphere from which it was lost.
climatefraudwatcher says:
March 30, 2013 at 4:22 am
The problem is that emissions are largely guestimates, for example the world’s industrial emissions and per country emissions do not coincide due to gross differences in the methods of estimation
The human emissions are somewhat better than guestimates, as these are based on fossil fuel sales and burning efficiency. Sales are of high interest for the financial income of states and therefore rather well known. Maybe somewhat underestimated by under the counter sales…
What is far less accurate are the extra CO2 emissions from land use changes, but that is only additional to the industrial emissions. If one adds these to the total human emissions, the airborne fraction sinks from 55-60% to 45-50%.
“I’m saying absolutely no way to Hansen’s claim that there was a “decreased airborne fraction after the Pinatubo eruption”
Pinatubo obviously was the main player like the other large eruptions around 63 and 83, but there were also two VEI4 eruptions in 1990 as possible contributers.
http://virakkraft.com/co2-fraction-nino.png
Bill Inis says: The equilibrium level is about 270 ppm to 280 ppm.
Equilibrium for what? There is no equilibrium in such a dynamic system.
This would seem to be a reference to the _supposed_ pre-industrial level. So (accepting that value) that would be the “equilibrium” value for global temperature over a degree 1 cooler than today in the process of coming out of the LIA.
Why do you think that is a suitable “equilibrium” figure for today or in 150 years?
Greg Goodman says:
March 30, 2013 at 4:15 am
“Averaging is a valid way to remove random variations. It can not be used to correctly remove cyclic variation or in the presence of cyclic variation. Runny means inherit this problem.
Runny means let through some frequencies, but worse still, they actually invert them and make them go the wrong way. This can lead the RM showing a peak when the data has a trough and vice versa. How much use is that?”
It is necessary to distinguish between asymmetric and symmetric moving averages here. A symmetric moving average does not introduce phase shift (what you describe as inverting some of the oscillations depending on the frequency). Of course it has the disadvantage that you can only use it until its right shoulder hits the present; that’s how BEST managed to show a nice growth to the end by using a symmetric 10 year running average. The graph they sent to the newspapers ends in 2000 while the data they processed probably goes to 2005, and they can use the 5 year shoulder of their symmetric moving average as valid excuse. Which is a nice trick that no journalist can see through.
richard verney says:
March 30, 2013 at 2:29 am
That being the case, the warm oceans would have had a lesser capacity to act as a carbon sink. One major issues is how did the planet sequester these high levels of CO2? Precisely what were the sinks?
Have a look at the white cliffs of Dover, UK (and most of South England) and their counterparts in Normandy, France. All carbonates, the remains of countless numbers of tiny coccolithophores:
http://www.soes.soton.ac.uk/staff/tt/eh/
Be aware that the Cretaceous did need some 60 million years to reduce its CO2 levels…
Willis Eschenbach says:
March 29, 2013 at 10:03 pm
AntonyIndia says:
March 29, 2013 at 8:09 pm
……………………..There appears to be a whole folder missing from the Columbia website. The link originally went to a folder on the website of Makiko Sato and James Hansen.
……………………..But the whole folder they reference has vanished, and as far as I can tell none of the documents in the folder is available anywhere on the web.
Go figure …
w.
———————————
I try as they say, to never attribute to malice that which can be attributed to stupidity or ignorance.
But sometimes it gets hard to “Go figure” otherwise when malice is so obvious elsewhere.
Hansen is not stupid, Gleick is not a moron, Mann is not a dunce and Jones is not ignorant (Excel excluded). They have to know what they are doing to the poor of the world so about the only thing I have left is malice or greed on their part. It seems everything they know will bring harm.
They lie, cheat, steal, whitewash, stop fuel development, hide declines, destroy data, delete communications, control peer review, withhold information etc, all for the Cause. And who knows what we haven’t caught them doing, as yet?
These are the people in leadership and this is their Scientific Method.
Thanks
cn
And to help the guy here because it appears he does not know….there is NO fossil fuel. Hdrocarbons are everywhere, even oceans of it on Titan and Saturn etc etc…..
A-biotic oil? Oil is here on this planet forever and Mother Earth generates oil all the time…
How does mankind control the prices of diamants? The same they do with Crude.
Ferdinand Engelbeen:
I do not intend to engage in another of our interminable debates which get nowhere, but your comment at March 30, 2013 at 3:32 am is so wrong that I write to correct it.
You say
The sequestration of the biosphere is not “relative easy to know” because the bulk of the world’s biota is in the oceans. Oceanic microorganisms sequester CO2 and lose CO2 (e.g. by decomposition of dead organisms). Each year, orders of magnitude more CO2 are pumped in and out of the oceans than the anthropogenic CO2 emission of any year.
Furthermore, the anthropogenic emission is mostly from burning fossil fuels which – being derived from biota – have similar isotope composition to biological CO2.
The observed change to the carbon isotope ratio is consistent with it being caused by the anthropogenic emission. But there is a 50:50 chance that it would be in the right direction. Importantly, the magnitude of the isotope change is WRONG by a factor of 3 if the increase to atmospheric CO2 has a purely anthropogenic cause from accumulation of emitted CO2 from anthropogenic sources.
Simply, the magnitude of the isotope change indicates the opposite of what you claim. Most of the change is observed to NOT be anthropogenic so it cannot be known if any of it is anthropogenic.
I repeat, I don’t know if the cause of the recent rise in atmospheric CO2 is entirely anthropogenic, or entirely natural, or partly anthropogenic and partly anthropogenic. Nobody can know because there is no available data capable of resolving the matter. Some people think they know but that is belief and not science.
Richard
Nature had it worked out so that CO2 was in balance before humans started burning fossil fuels. Or at least that is what we are told.
If nature is able to balance 100% of total CO2 emissions in 1850, it seems most illogical to assume that nature will not be able to balance 104% in 2013. (human CO2 emissions are 4% of natural emissions)
What apparently escaped Hansen and others is the lag in Nature’s response. CO2 levels must increase first before Nature can respond and balance them once again.
The truly faulty logic by Hansen and others was to assume that plant life could not increase in response to more CO2. That “sinks” were already saturated. That is completely illogical because it was already well known that plants grow faster when CO2 is raised above 1850 levels and continue to grow faster even when CO2 levels are increased above the levels predicted if we were to burn all known fossil fuel reserves on the planet in a single day.
From the graphs one could just as well argue that the change in CO2 rates coincides with the leveling of global average temperature and what we are seeing is the result of a change in the rate of out-gassing of CO2 from the oceans and noting to do with humans or plants.
WIllis, thanks for your (as usual) interesting and eminently readable analysis. When I have one of my (frequent) discussions with my AGW believer friends, they always say that CO2 is resident in the air for 50 – 100 years. Now that sounds like a BS argument to me but what have actual studies shown the free CO2 residency to be and what do GCM’s assume it to be?
An open discussion of climate issues was why I came to WUWT, after experiencing the censorship and intolerance of Real Climate to alternative and competing theories. I am disappointed to see this intolerance raise its ugly head on WUWT.
If I could para-phrase James Delingpole substituting Hansen for Beddington:”what I actually be doing is retiring to my study with a bottle of whiskey and my trusty service pistol, there doing the only proper thing a chap should do when he has brought shame on himself and brought untold suffering to millions.”
richardscourtney says:
March 30, 2013 at 2:37 am
===========
Richard, I agree with you 100%….and I call bullocks on the whole thing
First, 390 ppm is not high…….it’s low enough it would be considered limiting to plant growth….
….when some greenhouse of pot grower jacks their CO2 levels up into the thousands ppm…only to have it drop back to limiting within one light period…and they have to constantly keep adding CO2 just to keep levels up to where they can even grow plants
If that few plants can drop CO2 levels that far…….
Ferdinand Engelbeen says:
March 30, 2013 at 4:12 am
Error? The current concentration of CO2 in the atmosphere is just over 395 ppmv. 9% of that is just over 35 ppmv. Where did you get double the calculated amount for your 70 ppmv? Are you saying all human-contributed CO2 (because half has been sequestered) historically comes to 70 ppmv?
Nice analysis Willis, as we’ve come to expect from you. I’d make a couple of small modifications that don’t effect your analysis much. 1) Re Pinatubo, there is an inflection downwards at 1991 to a sharp (annual mean) minimum and then a rebound – perhaps a small concession to Hansen. Certainly, the trend was down already before Pinatubo but it does have a modest signature. 2) although global temps have flattened over the past 15 years or so (assuming the same for the ocean itself), they are sitting at a plateaued high for the present rather than rising and increasing amounts of CO2 to the atmosphere. The temperature record does seem to be reflected with little lag unless the 1998 high El Nino coincidentally coincides with the large spike in “airborne” CO2. What happens over the next few years may reinforce this apparent rapid response to change in CO2 airborne. The overall ocean temperature is, of course, not changing quickly, so this should be seen as high SST “blocking” rate of solution of CO2 into the ocean.
richardscourtney says:
March 30, 2013 at 2:37 am
It is extremely unlikely that the 97% natural CO2 emission is mostly back and forth cycling which can be assumed to be constantly in balance.
Dear Richard,
As we have discussed before, it was near constantly in balance before humans started to emit huge quantities of fossil fuels. The ice cores show a quite constant ratio between temperature and CO2 levels of about 8 ppmv/°C over the past 800 kyrs, with a high correlation and a lag of CO2. Even today, one can see a change of about 4-5 ppmv/°C around the trend over the seasons and the year by year variations, again with a lag of CO2. Of course, the ice cores are smoothing the past variability, but the current CO2 records are not.
The quite small variability of CO2 levels around the trend, despite huge hemispheric temperature changes over the seasons maybe caused by the counteracting fluxes between atmosphere and oceans at one side and atmosphere and vegetation on the other side. Anyway, over the past 50+ years, natural variability was not more than 1 ppmv around the 2 ppmv/yr trend, while humans emitted 4 ppmv/yr.
Increased undersea volcanism would release additional sulphur ions which travel with the thermohaline circulation until they reach ocean surface layer centuries later.
As said before, all alternative explanations for the increase in CO2 violate one or more observations:
In the case of acidification of the oceans by SOx from undersea volcanoes (or more acidic discharge from rivers), the amount of total dissolved inorganic carbon (DIC, CO2 + bicarbonate + carbonate) would decrease over time, as acidification releases CO2 at the cost of bicarbonates and carbonates. But we measure an INcrease of DIC in all oceans over time as well as in a few long term series as with regular ship surveys… That is only possible if CO2 enters the oceans from the atmosphere and is the cause of the pH reduction, not the reverse.
Further, something else in nature should then increase its sink capacity, according to the mass balance:
If the oceans over time increased from a net sink to a net source of CO2, of let us say actually 6 ppmv/year into the atmosphere and humans are a net source of 4 ppmv/year, the total increase would be 10 ppmv/year. But we measure only a 2 ppmv/year increase. Thus some non-ocean natural sink increased its capacity with 8 ppmv/year and the total natural cycle still removes a net 2 ppmv/year out of the atmosphere. The only difference is that the natural turnover increased with about 6 ppmv or 12 GtC/year and still humans are responsible for almost all of the increase…
Its funny how common sense is so rare, one commentator asked why the increase in biomass was not instant? how long does he think it takes to green a desert? and at the same time there was wholesale loss of rain-forest hell man look at the whole picture! Then people say ethanol is a good fuel and give as an example the power some engines have made on it well they need to look at the size of the jets in the carburettors needed to run the rubbish, the jets are several times the size needed for gasoline imagine the fuel consumption! it seems no one on the “green” side ever thinks of side effects do they? The warmist crowd are looking increasingly desperate do we need to be cautious near cornered rats? I would think so, common sense again!
richardscourtney says: March 30, 2013 at 2:37 am
[…..] It is extremely unlikely that the {97% of CO2 emission which is natural} is mostly back and forth cycling which can be assumed to be constantly in balance. This improbable balance may exist, but nothing else in nature is observed to be so in balance and constant.
[…..]
An imbalance of less than 2% p.a. between the natural emission and sequestration would account for all of the observed rise in atmospheric CO2. And there are several possible reasons why such an imbalance may have occurred.
The myth that natural emissions and sequestrations of CO2 are known to be in a constant balance needs to be dispelled if we are to determine the true causes of the recent rise in atmospheric CO2 concentration and, thus, to avoid distortion of energy and economic policies.
Richard
That is a helluva good post by Richard…. very important points, very educational (to me, at least), and very well explained.
RockyRoad says:
March 30, 2013 at 7:05 am
Error? The current concentration of CO2 in the atmosphere is just over 395 ppmv. 9% of that is just over 35 ppmv.
You are completely right: I had calculated the 9% from the ~800 GtC in the atmosphere, but forgot to devide by the C/CO2 GtC/ppmv factor of 2.1 GtC/ppmv… Thanks for the correction!
Excellent piece. It’s always interesting to see other people’s take on the various papers. As I browsed the comments, I see that most have missed what I consider the most important part to rebutting the paper.
Hansen’s entire premise is based upon the idea that increasedhuman SO2 emissions are the cause for the warming hiatus. Well, is that true? Hansen focuses on China and India’s coal consumption. But, that assumes quite a bit. Is coal use up? Yep. But, worldwide, the burning of coal has changed. There’s a lot less SO2 being emitted from coal use today vs 30 years ago. Further, coal isn’t the only source for SO2, so while coal use may be increasing other behaviors are decreasing.
So, we’re back to the basis of Hansen’s premise. Are human global SO2 emissions increasing? Well, no. They’re not. From the most comprehensive and up to date information we have, SO2 emissions have generally declined since the 1990s. There was a bump circa 2003-2005, but has since declined because China employed newer technologies to decrease smog. SO2 emissions in 2011 were less than the emissions in 2000. The worse part of this is that even if one ends the emissions at 2006, as Hansen did, it is still less than what was being emitted in 1990.
http://iopscience.iop.org/1748-9326/8/1/014003/article
As Willis and others rightly point out, there’s plenty else wrong with Hansen’s paper, but, I think this information utterly destroys his premise, rendering his paper nothing but babbling nonsense.
I’ll be charitable and say Jimmy just wasn’t aware of this information. But, then, isn’t it science to endeavor to find such before they spew their idiocy? It would be really nice if our “scientists” actually started engaging in, …… well, science.
“Hansen is not stupid, Gleick is not a moron, Mann is not a dunce and Jones is not ignorant .”
Permit me to strongly disagree with these opinions.
M Courtney says:
March 30, 2013 at 5:18 am
Ferdinand Engelbeen, please could you clarify what you mean by “net”?
If a flux into the atmosphere increases but the other fluxes are unchanged then surely the “net” CO2 in the atmosphere will change?
How do you dissociate the “net gain or loss per year” from the movements of CO2 into and out of CO2 reservoirs?
Any unknown in an equation can be calculated if the other terms in the equation are known.
The unknown in this case is the net gain or loss of all natural fluxes together in/out the atmosphere. What is known are the human emissions with reasonable accuracy and the increase in the atmosphere with high accuracy. The net result is:
increase in the atmosphere = human emissions + natural releases – natural sinks
including the knowns for average recent years:
4 GtC = 8 GtC natural releases – natural sinks
or
natural releases – natural sinks = -4 GtC
Thus whatever the real height of natural fluxes in and out, individual or in total, the net change in atmospheric carbon from all natural fluxes together is a loss of about 4 GtC (or 2 ppmv) per year in recent years with the natural temperature caused variability of +/- 2 GtC (or 1 ppmv) per year. In the early years the sink rate was a lot less, but still over the past 50+ years in every year there was more natural sink than source:
http://www.ferdinand-engelbeen.be/klimaat/klim_img/dco2_em.jpg
****
TonyfromOz says:
March 29, 2013 at 8:53 pm
The Chinese are using USC (UltraSuperCritical) technology for their new plants, enabling them to run higher Power generators, in fact single units capable of generating 1000MW, previously only the province of large scale Nuclear Power Plants.
****
B&W was building 1300 MW super-critical-pressure coal-fired boilers back in the late ’70s. I’ve seen ’em. Later, the increased capital costs of new plants (caused mostly by new regulations) caused a reduction in the sizes built.
A very real problem is sorting out the biological and chemical components of the ocean “sink”. Carbon dioxide has a nearly magical affinity for water and distilled water equilibrates with ambient CO2 at astonishing speed. As Richard Courtney points out this sink is strongly modulated by pH and by no means is ocean pH all carbonic. The chemical sink is transparent to isotopes.
The ocean biological sink filters strongly for 12C, but it also produces vast amounts of 12CO2 in what I call the nano carbon cycle. I’m not yet prepared to calculate it nor conjecture about the proportions that remain entirely aqueous and involve the atmosphere, but the nano cycle is enormous.
It is tempting to draw an analogy to the enormous energy cycle (roughly 110% of SI) that takes place between the ocean surface and the atmosphere.
http://geosciencebigpicture.com/2013/02/13/the-nano-carbon-cycle/
richardscourtney says:
March 30, 2013 at 6:13 am
The sequestration of the biosphere is not “relative easy to know” because the bulk of the world’s biota is in the oceans.
It makes no difference for the calculations. The oxygen balance and the d13C balance are (near) equally changed by land or ocean biota: both land and sea plants discriminate similarly against 13CO2 and both produce O2 while sequestering CO2. Thus the O2 balance includes the growth and decay of organics both in the oceans and on land, including soil bacteria, insects, animals and humans. For the d13C balance, that needs more calculation, as the higher d13C of the oceans and the back and forth isotopic discrimination at the sea-air boundary need to be taken into account. But both calculations show similar results.
Furthermore, the anthropogenic emission is mostly from burning fossil fuels which – being derived from biota – have similar isotope composition to biological CO2.
Yes, you are right. But the oxygen balance shows that in current times (since about 1990) the total biosphere is a net sink for CO2. The measured O2 decline (compared to oxygen use for fossil fuels burning) means more CO2 sequestering than CO2 release from the biosphere and preferentially more 12CO2, leaving a higher ratio of 13C/12C in the atmosphere. But we see a constant DEcrease of the 13C/12C ratio, thus not caused by the biosphere. Neither by the oceans, as the oceans 13C/12C ratio also is higher than of the atmosphere, even including the water/air border isotopic discrimination.
Importantly, the magnitude of the isotope change is WRONG by a factor of 3 if the increase to atmospheric CO2 has a purely anthropogenic cause
You forget that each year 20% of all CO2 in the atmosphere is exchanged by CO2 from other reservoirs. That makes little difference for the 13C/12C ratio if the exchange is with the ocean surface or the biosphere, as most of the exchange is bidirectional in short time (seasonal to a few years). What makes a difference is the longer term sequestering in the biospere (humus, peat, roots) and the deep oceans. The latter absorbs the current 13C/12C ratio into the deep, but releases the 13C/12C ratio of many hundreds of years ago. That can be used to estimate the deep ocean – atmosphere exchanges:
http://www.ferdinand-engelbeen.be/klimaat/klim_img/deep_ocean_air_zero.jpg
The mismatch in the early years is interpretated as more CO2 release from the biosphere than sequestering.
Thus based on the 13C/12C changes and the oxygen balance, neither the oceans, nor the biosphere are the cause of the increase in CO2 and all other known sources (rock weathering, volcanic vents,…) have 13C/12C ratios above the current atmospheric ratio…
Hansen’s confusing some things. Fertilization is from NOx, which tends to come more from internal combustion than power plants. The cars are causing the trees to eat the CO2 from the power plants.
martha durham says:
March 29, 2013 at 6:17 pm
Martha, I agree. A true environmentalist knows that the way to save the Amazon rain forests is to industrialize Brazil( for example). Moving people into urban areas.
This has worked in North America.
This CAGW nonsense could be the death of true environmentalism.
Greg Goodman says:
March 30, 2013 at 5:58 am
Bill Illis says: The equilibrium level is about 270 ppm to 280 ppm.
Equilibrium for what? There is no equilibrium in such a dynamic system.
Why do you think that is a suitable “equilibrium” figure for today or in 150 years?
———-
280 – 285 ppm given it is perhaps a little warmer today.
CO2 back to 1 AD. The data is from the Law Dome ice cores which have a resolution ranging from 1 year to about 40 years in some periods and fit with a 20 year Cubic Spline fit.
ftp://ftp.ncdc.noaa.gov/pub/data/paleo/icecore/antarctica/law/law2006.txt
http://s7.postimg.org/893ubewnf/CO2_1_AD_2012_Law_Dome_Global.png
CO2 last 40 million years – all reliable estimates.
http://s13.postimage.org/pvmtijcw7/CO2_Last_40_Mys.png
Ferdinand Engelbeen says:
March 30, 2013 at 7:37 am
including the knowns for average recent years:
4 GtC = 8 GtC natural releases – natural sinks
Of course needs a + sign inbetween:
including the knowns for average recent years:
4 GtC = 8 GtC + natural releases – natural sinks
The half-life of CO2 in the atmosphere is about 10 years. We happened to perform the experiment by injecting 14C into the atmosphere through nuclear testing [1]. A spike of about 2x the natural concentration of 14C in 1963 has been decreasing since then, back toward normal levels. Quick and dirty analysis of the chart (190% in 1963, 145% in 1973, 122% in 1983, 111-115% in 1993) suggests 10 years is about right, and the 100% level may not be as constant as the chart implies. Too bad we can’t see a clear 14C variation that would likely be due to cosmic ray flux changes.
On the paper, if CO2 is taken up at a higher rate and converted to wood, or falls to the bottom of the ocean as sediment, then NPP-> greater sequestration in absolute quantity would be true. However, would ‘excess’ CO2 be taken up with the same efficiency? In other words, if there were 10% more CO2, would there be 10% more wood or diatom skeletons falling to the ocean floor? If this process is the basis of environmental homeostasis, then you would expect the efficiency to decrease if CO2 falls and increase if CO2 levels rise (negative feedback). Obviously, if CO2 levels fall too far, organisms die and CO2 will subsequently rise. So that part of the story seems likely. Eventually, there would be a level of CO2 too high for many organisms to survive, but that level is unlikely ever to be achieved in the atmosphere.
Regarding CO2 in the atmosphere, let it ride, baby.
1) http://en.wikipedia.org/wiki/File:Radiocarbon_bomb_spike.svg
Willis a simple question, where does the data for the annual airborne fraction percentage in figure 2 come from?
Hansen’s paper should have been titled ‘Biosphere is becoming more productive due to Increased Atmospheric CO2 level!!!’ and should have included a P.S. ‘Global warming has stopped need to re-examine GMC model assumptions something is fundamental incorrect !!!’ rather than ‘Climate forcing growth rates: doubling down on our Faustian bargain’
C3 Plants (trees, scrubs and cereal crops, all plants except for grasses lose roughly 50% of their water due to trans-respiration. C3 plants are gasping for CO. To get sufficient CO2, C3 plants must produce more stomata on their leaves, which increase water loss. When levels of atmospheric CO2 increase, C3 plants produce less stomata on their leaves which enables them to lose less water, which leaves more water at their roots. The increase in water at the plant roots increases the number of synergistic nitrogen fixing bacteria to live on the plant roots.
The fact that C3 plants including rice and other cereal crops can survive and thrive with less water will reduce the amount of water that is required for irrigation. Plant growth rates and yield increases by roughly 40% to 50% due to a doubling of CO2. One would think that would be a good thing as opposed to a Faustian bargain.
I do not see anything in the paper Hansen reference that provides a proof that the biosphere is expanding due to global dimming and SO2 and NO2 emissions from coal plants. It is odd Hansen’s paper completely ignores hundreds of peer reviewed papers concerning the benefits of increased CO2 on plant growth and health. Commercial greenhouses inject CO2 at 1000 ppm to 1500 ppm to increase plant growth rate and yield. Cereal crop yields increase by 30% to 50% when atmosphere CO2 increases from 280 ppm to 560 ppm.
http://www.omafra.gov.on.ca/english/crops/facts/00-077.htm
Carbon dioxide (CO2) is an essential component of photosynthesis (also called carbon assimilation). Photosynthesis is a chemical process that uses light energy to convert CO2 and water into sugars in green plants. These sugars are then used for growth within the plant, through respiration. The difference between the rate of photosynthesis and the rate of respiration is the basis for dry-matter accumulation (growth) in the plant. In greenhouse production the aim of all growers is to increase dry-matter content and economically optimize crop yield. CO2 increases productivity through improved plant growth and vigour. Some ways in which productivity is increased by CO2 include earlier flowering, higher fruit yields, reduced bud abortion in roses, improved stem strength and flower size. Growers should regard CO2 as a nutrient.
http://www.sciencedaily.com/releases/2003/05/030509084556.htm
Greenhouse Gas Might Green Up The Desert; Weizmann Institute Study Suggests That Rising Carbon Dioxide Levels Might Cause Forests To Spread Into Dry Environments
The Weizmann team found, to its surprise, that the Yatir forest is a substantial “sink” (CO2-absorbing site): its absorbing efficiency is similar to that of many of its counterparts in more fertile lands. These results were unexpected since forests in dry regions are considered to develop very slowly, if at all, and thus are not expected to soak up much carbon dioxide (the more rapidly the forest develops the more carbon dioxide it needs, since carbon dioxide drives the production of sugars). However, the Yatir forest is growing at a relatively quick pace, and is even expanding further into the desert…. ….Plants need carbon dioxide for photosynthesis, which leads to the production of sugars. But to obtain it, they must open pores in their leaves and consequently lose large quantities of water to evaporation. The plant must decide which it needs more: water or carbon dioxide. Yakir suggests that the 30 percent increase of atmospheric carbon dioxide since the start of the industrial revolution eases the plant’s dilemma. Under such conditions, the plant doesn’t have to fully open the pores for carbon dioxide to seep in – a relatively small opening is sufficient. Consequently, less water escapes the plant’s pores. This efficient water preservation technique keeps moisture in the ground, allowing forests to grow in areas that previously were too dry.
http://news.nationalgeographic.com/news/2009/07/090731-green-sahara.html
The green shoots of recovery are showing up on satellite images of regions including the Sahel, a semi-desert zone bordering the Sahara to the south that stretches some 2,400 miles (3,860 kilometers).
Comment:
It is interesting to note there are periods of millions of years when atmospheric CO2 was high and the planet was cold and periods when atmospheric CO2 was low and the planet was warm. The extreme AGW paradigm’s explanation for a lack of correlation of planetary temperature VS CO2 levels is climate was different in the past. Another explanation for lack of correlation, is there is something fundamentally missed in the modeling and basic theory for the upper atmosphere which explains why the greenhouse gas warming phenomena saturates higher in the atmosphere. If the planet were to start to cool now, everyone would be more receptive to listening to an explanation as to why.
William Astley says:
March 30, 2013 at 9:59 am
Commercial greenhouses inject CO2 at 1000 ppm to 1500 ppm to increase plant growth rate and yield.
=============
exactly William, and they have to keep adding CO2 to keep it from becoming limiting again…..all 100% correct
..there is absolutely no way that the miniscule amount of CO2 added by man….is responsible for this increase
David Schofield says:
March 30, 2013 at 3:53 am
Ah I see now!
Half of man made CO2 warms the atmosphere, half goes into plants and the other half acidifies the oceans. Amazing stuff.
===============================================================
Half plus Half plus Half is 150%…
?? Have you been going to those alarmist sites again… they exaggerate everything.. LOL
Nick Stokes says:
March 30, 2013 at 4:00 am
Thanks, Nick. Here’s your numbers that I had problems with:
The emissions are very, very different from the CDIAC numbers I used. In addition, the data from the website you reference above gives the following values:
From those, I get the yearly growth in ppmv …
The problem is … none of these look like your numbers for the annual CO2 growth in ppmv …
What am I missing?
w.
Andor says:
March 30, 2013 at 6:11 am
Yes, I suppose the thousands and thousands of plant fossils in the coal beds around the planet are just pretty pictures and not real fossils …
Andor, climb down off of your high horse. While there certainly may be abiotic coal, we know damn well that there is biotic coal. We know that coal is a fossil fuel because coal is FULL OF PLANT FOSSILS, which is why we call it a “fossil fuel”, and why we make what to you is a foolish claim, that coal is made out of plants … crazy, huh?
And while there may also be abiotic oil, we also know damn well that there is biotic oil. We know that because we can see physical examples of all of the different stages of biotic oil formation, and we understand the physics and chemistry of the biotic pathway by which the oil was formed.
w.
Hoser says:
March 30, 2013 at 9:02 am
The half-life of CO2 in the atmosphere is about 10 years. We happened to perform the experiment by injecting 14C into the atmosphere through nuclear testing [1].
Half lifes of different items. The half life of the bomb spike is based on the exchange of CO2 from the atmosphere with CO2 from other reservoirs. That exchange is huge, about 150 GtC from the 800 GtC present in the atmosphere. Or near 20% per year that is exchanged between the reservoirs. Or a residence time of about 5 years for any individual CO2 molecule in the atmosphere, whatever its origin. As part of the 14C spike returns in the next season from fallen leaves or the ocean surface, it takes more than 5 years to halve the spike than expected from the residence time, but that is not the main point.
The main point is that the residence time has nothing to do with the half life of some excess amount of CO2 above equilibrium: the extra amount of CO2 sequestered from the atmosphere is about 4 GtC/year (2 ppmv) from the near 210 GtC (100 ppmv) that we are currently above equilibrium, whatever the cause of the increase. That gives an e-fold reduction of 210/4 or 51.5 years, or a half life time of about 40 years.
Thus two completely different half lives… The IPCC uses a half life of 100 years and beyond, based on the Bern model, which is a combination of half lives for sequestering in different reservoirs, but that takes into account a saturation of different sinks, which may be true if we burn all available oil, gas and a lot of coal (10 to 20 times the current total human carbon emissions since 1850), which is by far not the case…
Björn says:
March 30, 2013 at 9:19 am
Good question, Björn. Airborne fraction is annual emissions (CDIAC) divided by annual atmospheric CO2 increase (NOAA) expressed in gigatonnes. To convert ppmv of atmospheric carbon to gigatonnes, multiply by 2.18
Regards,
w.
Here are the figures. In 1960 the natural sinks were sequestering about 1 gigatonne of excess carbon annually. By 2011, this had risen to 4.5 gigatonnes annually. I agree that CO2 fertilization is real, but clearly this 4.5-fold increase in total tonnage of excess carbon sequestered cannot all be the result of increased NPP from CO2 fertilization.
Have you, or has anybody, calculated the increase in NPP? I seem to remember reading something, but I have forgotten details.
johnmarshall says:
March 30, 2013 at 4:01 am
John, you are conflating two measures, the residence time and the half-life. The residence time is how long an average CO2 molecule stays in the atmosphere. As you indicate, this is about 5-7 years.
The half-life is totally different. It is how long it takes for a pulse of emitted CO2 to decay back to the pre-emission level. It has nothing to do with the residence time. I estimate the half-life to be somewhere on the order of 40-60 years.
w.
Hoser says:
March 30, 2013 at 9:02 am
Hoser, you, like John above, are conflating residence time with the half-life. What you quote is the residence time.
w.
ferdberple says:
March 30, 2013 at 6:50 am
Ferd, if you’d give an example of the alleged “intolerance” you’re disappointed by, you’d look a lot less like a refugee from some kind of institution. What is it about quoting someone’s words and providing details that people find so hard?
What I’m trying to say, Ferd, is that I don’t have a clue what “intolerance” you are babbling about. It certainly might be something real, but from your pathetic lack of information it’s impossible to tell.
Quotes, dear friends. Facts. Citations. Details. That’s what we need. The kind of nonsense Ferd is retailing above is just meaningless accusation and handwaving. If you have a question or a complaint, SPELL IT OUT or don’t bother.
w.
wws says:
March 30, 2013 at 7:35 am
“Hansen is not stupid, Gleick is not a moron, Mann is not a dunce and Jones is not ignorant .”
Permit me to strongly disagree with these opinions.
—————————–
There were not really opinions but rather ass u me (tions).
Bad move in science, eh?
cn
Great article, Willis, but I have a nit to pick. It’s mostly just a terminology quibble, but CO2 doesn’t “decay,” exponentially or otherwise. “Decline” would be a better word. The rate of dissolution of CO2 in water increases with atmospheric CO2 concentration (partial pressure), and the rate of CO2 uptake by plants increases with atmospheric CO2 concentration due to carbon fertilization, causing CO2 levels to decline.
So, yes, excess CO2 levels do “naturally” decline toward equilibrium on a roughly exponential curve, but part of that decline is due to carbon fertilization greening the planet.
One other interesting bit is this “moving part” that you quoted: “One mechanism by which fossil fuel emissions increase carbon uptake is by fertilizing the biosphere via provision of nutrients essential for tissue building, especially nitrogen, …”
Nitrogen! When I argue with warmists over on ClimateCrocks (the only warmist blog site I’ve found that doesn’t censor me), they pooh-pooh CO2 fertilization, claiming that its efficacy is generally limited due to water & nutrient depletion, including nitrogen. But Hansen says the opposite: that burning fossil fuels “especially” fertilizes the biosphere with biologically-available nitrogen through generation of NOx & consequent nitrogen deposition.
Matthew R Marler says:
March 30, 2013 at 12:01 pm
The NASA website shows some estimates of the carbon cycle, where human emissions have increased the uptake by plants with about 3 GtC/yr over the estimated 120 GtC/yr of photosynthesis. That is a 2.5% increase in CO2 uptake for a 30% increase in CO2:
http://earthobservatory.nasa.gov/Features/CarbonCycle/
The extra growth in greenhouses by injecting high levels of CO2 shows an average 50% increase in carbon uptake for a 100% increase in CO2. But that is in the most optimal conditions of light, temperature, water, minerals, fertilizer and soil.
Many of these conditions may be the limiting items for plant growth in the real world, not CO2.
More on half life and residence times here: – perhaps useful.
http://web.viu.ca/krogh/chem302/residence%20time.pdf
Sigh — I rewrote the last four lines of this poem. Bad poets rewriting their work is the same as beating a dead horse. Nevertheless I post.
Old Death Train Hansen —
Always Good For A Laugh
More holy-than-thou
He warns us of Venus
The only thing now
That hardens his penis
He rants at the crowds
A coot with the hypers
Him mind in the clouds
A load in his diapers
He quotes from the Greens —
We work for the many!
(Diversity means
The colors of money)
He quotes from the Reds —
Consensus is dictum!
(Good socialist heads
Are all up one rectum)
From manic to funk
He’s always alarming!
His science is junk —
There’s no global warming.
Eugene WR Gallun
Ferdinand Engelbeen:
I said I would not engage in another of our interminable debates. Some of those have been on WUWT so anyone who wants to know the totality of our mutually respectful but severe disagreement can refer to the archives to read it.
However, at March 30, 2013 at 7:15 am you have replied to my saying at March 30, 2013 at 2:37 am
Your reply begins by saying
No, your claim is an unsubstantiated assertion which cannot be justified. Your assertion is supported by the dubious ice core data (which you cite) and refuted by the sparce stomata data (which you do not mention).
This sums-up the difference between those – including me – who look at the totality of the available data and say,
“We don’t know what has caused the recent rise in atmospheric CO2”
and those – including you – who make statements of certain knowledge about the cause based on selecting only the data which fits what they want to be true.
The remainder of your post is similar. It asserts
That is simply false. Indeed, your dismissal of the example I provided relies on an assumption that observed carbonate change
The ocean surface layer is mostly governed by biotic activity and not simple inorganic chemistry. In another post in this thread you mentioned that the Dover White Cliffs are an end result of biological sequestration of CO2 in the ocean surface layer. Nobody knows how the postulated additional volcanic sulphur would affect DIC because few if any of the biological interactions are adequately understood.
The whole edifice is constructed from assumptions. I repeat that I don’t know if the cause of the recent rise in atmospheric CO2 is entirely anthropogenic, or entirely natural, or partly natural and partly anthropogenic but I want to know. And I will know when the edifice of assumptions is replaced by empirical evidence.
Richard
It’s not just CO2 or NOx that plants enjoy. Most have an absolute requirement for some sulfur in their diet. There is a marvellous example of what happened when the Brits equipped their coal-fired power stations with flue-gas desulfurization. Suddenly the French bread developed problems. It transpired that the wheat fields, particularly in the French north, were no longer receiving free sulfur via atmospheric transport from Britain. The wheat was therefore low in gluten, a sulfur compound. The French farmers had to buy gypsum from the British coal plants to spread it on their fields and get bread quality back up.
Willis,
I see the problem. Your table is of annual averages. So if you subtract the average value through 1991 from the average value through 1992, you get a different result from subtracting Dec 1991 from Dec 1992. The latter is what is shown in the plot and table that I linked here. Subtracting the annual averages means that you smooth over the 1992 post-Pinatubo dip in rate.
I think the emissions issue is units – I also linked this CDIAC Table from which I took the numbers in the second column. The units are megaton C (I wrongly wrote Gton). Your units may have been Gton CO2 (=3.666* Gton C). That comes out when you convert to airborne fraction using the appropriate factor.
“if you subtract the average value through 1992 from the average value through 1991”
I mean, of course, subtract 1991 from 1992.
[Fixed. -w.]
It should be noted that the C13/C12 ratio of petroleum and particularly “natural” gas does not match plants. That fact is one of the reasons why Thomas Gold and Russia/Ukraine geologist assert that the source of the earth’s hydrocarbons is from a deep earth source.
That theory is relevant to the discussion, as it explains (when details of the mechanism is worked out) why atmospheric CO2 varies in geological time and during the glacial/interglacial cycle.
(See this simplified explanation Thomas Gold/Russian/Ukraine theory.)
http://origeminorganicadopetroleo.blogspot.ca/2011/01/thomas-gold-professional-papers.html
Comment: The Thomas Gold/Russia/Ukraine deep earth theory explains why: 70% of the planet is covered in water, provides the reason why there are massive concentration of hydrocarbon such as the 1.2 Trillion barrel heavy oil concentration in the Canadian province of Alberta (that oil flowed to the cover sand picking up heavy metals during the flowing process, the puzzle with the biological theory is why the massive concentration, what is source of the pressure and so on), the reason why Saudi Arabia was 25% of the world’s oil with a single field that has 50% of their total, explains why the solar wind has not stripped off water from the planet (i.e. CH4 is continually released from planet core which disassociates to form H2O and CO2), explains the composition of the atmosphere, explains why the atmosphere C12/C13 has remained constant with geological time (there is constant new source of high C12 from the core contained in CH4.)
There are two theories to explain how water and hydrocarbons came onto the earth: the late veneer theory and the deep CH4 theory. Roughly 100 million years after the earth was formed a Mars sized object struck the earth. That event formed the moon and stripped the mantel of light elements. There are two theories to explain why there are light elements on now on the earth’s surface. The late veneer theory hypothesis: Comets struck the early earth after the big splat event covering the very hot earth with hydrocarbons. The late veneer hypothesis requires that the earth had a Venus like atmosphere (atmospheric pressure of say 60 atmospheres) for the early earth, except with methane.
There are multiple problems with the later veneer hypothesis (See Thomas Gold’s Book Deep Hot Biosphere for details. One of the key problems is the observation that the percentage of heavy gaseous elements in the earth’s current atmosphere does not match that of comets (Comets are residues of the early solar systems. The comet elemental composition does match that of the sun). The late veneer theory’s explanation for the miss match of isotopes in the earth’s atmosphere to that of comets is that the early solar system had a close encounter with another solar system which temporary provided a limited source of comets to cover the earth but not significantly change the element composition of the sun.
The second hypothesis is the deep earth hydrocarbon theory. This theory hypothesizes that massive amounts of hydrocarbons (5% of the total core mass) are located in the earth’s core. As the core cools these hydrocarbon (CH4) are released. At very high pressures the CH4 forms longer chain molecules. The release of CH4 is still occurring as the upper surface of the ocean is saturated with CH4 which indicates that CH4 is being released from some source.
http://origeminorganicadopetroleo.blogspot.ca/2011/01/thomas-gold-professional-papers.html
Interpretations Based on the Carbon Stable Isotopes
The study of the distribution of the carbon isotopes in relation to petroleum and natural gas has a very extensive literature. We shall discuss here only one aspect of it: can isotope measurements determine whether a hydrocarbon compound was derived from biological material or whether it is primordial? Because many petroleum geologists have considered that such a distinction can be made, and that petroleum and natural gas appear on that basis to be usually of biological origin, it is clear that we must address this aspect here.
A selection process that enriches one or other isotope is usually referred to as a process of “fractionation.” The resulting fractionated material is referred to as isotopically light or isotopically heavy, depending on the ratio of the lighter to the heavier isotope. Measurements of the slight variations in the carbon isotope ratio in different samples is usually not done in absolute terms, but by comparison with a norm, and the small departures from this norm are then the quantities noted. The norm that has been selected for this purpose is a marine carbonate rock called Pee Dee Belemnite, or PDB, and this norm has a carbon isotope value that is about in the middle of the distribution of all the marine carbonates. The measurements are then quoted as the departure of the 13C content of the sample from that of the norm, and the figure is usually given in parts per thousand (permil) and referred to as the d13C value of the sample.
See Carnegie Institute of Sciences Deep Carbon Workshop presentations if you interested in this subject.
https://www.gl.ciw.edu/workshops/sloan_deep_carbon_workshop_may_2008
http://www.sciencedaily.com/releases/2009/09/090910084259.htm
http://www.nature.com/ngeo/journal/v2/n8/abs/ngeo591.html
In reply to
Ferdinand Engelbeen says:
March 30, 2013 at 8:11 am
richardscourtney says:
March 30, 2013 at 6:13 am
The sequestration of the biosphere is not “relative easy to know” because the bulk of the world’s biota is in the oceans. … ….You forget that each year 20% of all CO2 in the atmosphere is exchanged by CO2 from other reservoirs. That makes little difference for the 13C/12C ratio if the exchange is with the ocean surface or the biosphere, as most of the exchange is bidirectional in short time (seasonal to a few years). What makes a difference is the longer term sequestering in the biospere (humus, peat, roots) and the deep oceans. The latter absorbs the current 13C/12C ratio into the deep, but releases the 13C/12C ratio of many hundreds of years ago. That can be used to estimate the deep ocean – atmosphere exchanges:
http://www.ferdinand-engelbeen.be/klimaat/klim_img/deep_ocean_air_zero.jpg
The mismatch in the early years is interpretated as more CO2 release from the biosphere than sequestering. Thus based on the 13C/12C changes and the oxygen balance, neither the oceans, nor the biosphere are the cause of the increase in CO2 and all other known sources (rock weathering, volcanic vents,…) have 13C/12C ratios above the current atmospheric ratio…
William: Thank-you your comment was insightful.
Why is it that the “airborne fraction” becomes a topic for Alarmists only when Alarmist climate science faces an imminent train wreck of epic proportions? For years, I have attempted to get Alarmists to discuss the airborne fraction but found not one taker. Is it because Alarmists, true to form, make presumptions about such matters and refuse to investigate them empirically?
One good outcome of Alarmists’ new found interest in empirical investigation of the airborne factor is that some more of them are now looking at the role of some natural processes in climate. I hope all of them send a note to Trenberth explaining that it is not possible to reverse the Null Hypothesis.
Yes, manmade CO2 does influence the airborne fraction but the natural processes which mostly determine the airborne fraction must be understood through empirical investigation if scientists are to make sense of the manmade influence.
Nick Stokes says:
March 30, 2013 at 1:55 pm (Edit)
Ah, I see. The problem is that we’re discussing the airborne fraction. Since we don’t have monthly emissions data, we can’t use monthly CO2 figures. We have to average them to annual values to match the emissions data.
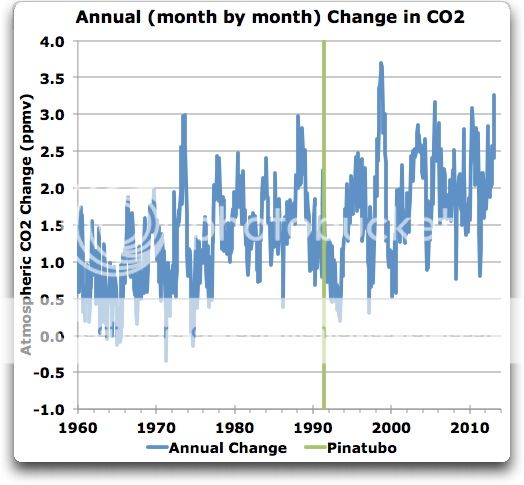
Here’s my problem with your claim. I’ve graphed the month-over-month changes in the manner you suggest, e.g. subtracting Dec 1991 from Dec 1992 and so on for all the months. Here’s that result:
If you can distinguish between the pre- and post-Pinatubo drops, you’ll have to explain how. In fact, the post-Pinatubo period is not in any way different from a host of other drops at other times.
Actually, I was simply looking at the wrong years, your emissions figures were correct.
w.
Ferdinand Engelbeen says:
March 30, 2013 at 12:51 pm
….
Many of these conditions may be the limiting items for plant growth in the real world, not CO2.
And in many cases it is CO2.
The greening effect of CO2 can be measured and greening of the planet is observed by satellites.
Willis,
Please read Tommy Gold on the subject before being so dismissive of abiotic hydrocarbons on Earth.
Gold doesn’t dismiss the idea that some hydrocarbons may be formed by biological action.
richardscourtney says:
March 30, 2013 at 1:36 pm
Your assertion is supported by the dubious ice core data (which you cite) and refuted by the sparce stomata data (which you do not mention).
Come on Richard, I have defended the reliability of the ice core CO2 data several times here at WUWT against who believes the claims of the late Jaworowski, as good as the unreliability of the stomata data which have the same problems as many of the pre Mauna Loa chemical measurements on land midst huge sources and sinks…
The ocean surface layer is mostly governed by biotic activity and not simple inorganic chemistry.
The biotic activity as well as the variations in inorganic carbon are monitored at a few places since a few decades, where Bermuda represents most of the North Atlantic. That shows that the average increase in total inorganic carbon in the mixed layer in the North Atlantic over the past decades was about 0.6 +/- 0.3 GtC/yr. The +/- 0.3 GtC/yr variability in sink rate is partly a result of biotic activity, partly winter mixing depth and partly sea surface temperatures.
Moreover, any substantial CO2 release from the oceans (even more with high biotic activity) would increase the d13C level of the atmosphere, but the ocean surface d13C level follows the steep d13C decline of the atmosphere… See:
http://www.sciencemag.org/content/298/5602/2374.abstract
And I will know when the edifice of assumptions is replaced by empirical evidence.
The oxygen balance is empirical evidence that the biosphere as a whole is a net sink for CO2 and thus not the cause of the 13C/12C ratio decline in the atmosphere or the oceans. The higher 13C/12C ratio of the oceans and practically all other CO2 sources compared to the atmosphere proves beyond doubt that the oceans can’t be the cause of the CO2 increase in the atmosphere. Thus the scientific evidence lies before you that no known natural source is the cause of the increase. Do you really want to know? Or don’t you want to admit that humans are the cause of the increase, because that is one of the pilars of the AGW case?
Dudes, I’m not conflating anything. I’m only concerned about half of the equation. Did I say anything about equilibrium regarding 14C? You can infer anything you want, and actually, that could lead to an interesting part 2. I was beginning to get into that a little in the second paragraph.
The point is, whatever WE put into the atmosphere, now we know it must pass through another reservoir, via a natural process, with a half life of 10 years. Knowing half of the equation allows us to put constraints on the other half. Humans certainly injected CO2 into the atmosphere from burning fossil fuels. We know the increasing ppm CO2 is not due to CO2 failing to pass through a biologically mediated reservoir, e.g. alkalinity in water. If there is more CO2 in the air, it is because the equilibrium shifted. It isn’t there because it can’t go anywhere else. Why the equilibrium shifted is the interesting question.
Why should Hansen care if the poor suffer? He is not poor, he has made no effort to reduce his use of energy towards the levels of those of us of modest means even, let alone the poor. He will not even have to see them suffer, for they are black people in Africa, and he is a white man in America.
att Mr Willis Eschenbach
allow me to quote your article:
“He (Hansen) is now claiming (again falsely) that there is some drop in the airborne fraction after Pinatubo. I’m sorry, but that’s a totally false statement. There’s no sign of any unusual drop post-Pinatubo in this record at all, neither in the annual data nor in the average data. The majority of the drop he seems to be pointing to occurred well before Pinatubo occurred …”
“In passing, let me comment that any reviewer who let any of that Pinatubo nonsense past them should resign their commission. It was the first thing I noticed when I looked at the paper.”
dear Mr Eschenbach,
here you are quite negative about Hansen, his article and his scientific statements;
however, in my opinion you are not fair here, to me you seem seem a litlle biased and/ or uninformed:
in his article Hansen is referring in this matter to reference 12 (Gloor, Sarmiento and Gruber) who in their paper adress the effect of Mt Pinatuba eruptionr;
this is very interresting reading from which I take just one quote:
“The onset of increased land uptake in the early 1990’s is actually before the Pinatubo eruption as noticed by Keeling et al. (1995). To our knowledge the mechanism for this early onset remains unclear.”
I am sure Hansen noticed the importance of this statement, so he provided us with a link to this article, with the best will of the world, I don’s see here any false statement by Hansen;
next to that,
Gloor et al are referring to Keeling et al (1995)
here is also interesting reading about the Pinatubo matter:
for instance, you can see here the basics of Hansen’s figure 3 (CO2 airborne fraction) ;
next to that, its would probably be nice for your readers to know that the blue Pinatubo line you draw in YOUR Figure 2 seem to be copied from Figure 2a from the Keeling article (Nature June 1995);
It would be nice if you mention such a ‘citation’, especially while you are complaining about Hansen and “any of that Pinatubo nonsense” while these scientists including Hansen already saw in 1995 the difficulty with the Pinatubo vs CO2 decline timing,
let me quote again:
“Is the Pinatubo vulcanic eruption of June 1991 implicated in this dramatic downward anomaly?”
Keeling et al (and Hansen) were and are well aware of the fact that the decline started in 1989 and that it kept on going declining after Pinatubo, at least until 1994 (according to figure 2a from Keeling et al)
Mike Borgelt says:
March 30, 2013 at 4:46 pm (Edit)
I read Gold when it was first published … how about you?
I did not say anything “dismissive” about abiotic hydrocarbons.
Great. And I don’t dismiss the idea that some hydrocarbons may be formed by abiotic action. Makes us about even.
Look, here’s the thing. We know that through the application of heat and pressure organic materials can be turned into oil. Not only that. We know what each step in the process both looks like and what is happening chemically. We have examples of the rocks at all stages of the process. It’s a whole field of scientific study, we understand the processes involved quite well.
And using that knowledge has allowed us to reap an immense bounty, and correctly identify and utilize huge stores of oil.
So that’s the biotic side. We’re quite clear that exists and how it works.
We also know that methane is fairly commonly created in nature. It exists on many planets and moons. In addition, we know that under extreme heat and pressure, in the presence of natural catalysts such as iron oxide methane will form heavier hydrocarbons. These processes are likely to be responsible for the discovery of oil in areas which are NOT included in the normal biotic pathway for oil, although there are competing hypotheses.
So that’s the abiotic side. There is no evidence that most of the oil harvested to date is abiotic. There is evidence that some abiotic oil exists and can be brought into production.
As a result, I see the whole IS/ISN’T argument about oil as a fool’s quarrel. Yes, there appears to be some abiotic oil out there … so what? Nobody’s found any huge deposits, and people have looked, it won’t affect things for a long time if it is found, it will be deep and hard to get at … so what?
w.
Studies have shown that at 1,000 ppm CO2, many plants use significantly less water and yields are higher. Very interesting why this is never mentioned. Below 200ppm, plant life stalls.
Perhaps humans were put on this earth to recycle the Carbon buried beneath the earth during the Carboniferous Era?
Martin van Etten says:
March 30, 2013 at 5:51 pm
Thanks, Martin, but I’ll pass on other people’s words. I’m discussing Hansen’s words. I’m sure that others are more careful and more accurate than Hansen, so it’s of little use to refer me to the words of others. Instead I refer you again to Hansen’s words, viz:
and
You see anything in there about the decrease starting well before Pinatubo? Because I didn’t.
As you point out, someone else noticed a change in land uptake before Pinatubo … so what? Read Hansen’s statements above. He ascribes the whole depression in airborne fraction to Pinatubo.
You go on:
First, you haven’t presented a scrap of evidence that Hansen either saw, or if he did see that he understood, that the decline started well before Pinatubo. He certainly makes no reference to that in the paper, so if he knew it, why was he ascribing the dip to Pinatubo?
More important, you accuse me of bad faith for not citing the “blue Pinatubo line” that I draw in my figure. You say I should acknowledge that I copied it from Keeling, come clean and confess my wrongdoing …
My friend, I have no clue what Keeling paper you’re on about, never seen it. I got the “blue Pinatubo line” by cleverly utilizing the following arcane method.
1. I remembered that the Pinatubo eruption was in June 1991
2. I checked the date on the web so I didn’t bite myself through lack of due diligence, and yes, I was right.
3. I drew a blue vertical line on the graph at June of 1991, and labeled it “Pinatubo”.
… and you want me to confess to copying it from Keeling? That’s your best shot? It’s the freakin’ DATE of the Pinatubo eruption, Martin, it’s not “copied” from anywhere.
You continue:
Hansen may have been aware, although you provide no evidence to support that claim.
Either way, his statements in this particular paper make absolutely no mention of that. Instead, he ascribes that depression in airborne fraction all to Pinatubo. I don’t see the evidence in the record that Pinatubo did much of anything like what people claim …
Look again at Figure 1. That’s Hansen’s graph … except he left out the vertical line. Are you seriously claiming that there was some significant post-Pinatubo depression in the airborne fraction?
w.
Sometimes poets have difficulty letting go. One more time.
Old “Death Train” Hansen
Always Good For A Laugh
More holy-than-thou
He warns us of Venus
The only thing now
That hardens his penis
He rants at the crowds
A coot with the hypers
His mind in the clouds
A load in his diapers
He quotes from the Greens —
We work for the many!
(Diversity means
The colors of money
He quotes from the Reds —
Consensus is dictum!
(Good socialist heads
Are all up one rectum
A fascist he cries —
This Goebbels of weather —
The truth is in lies!
The bigger the better!
So just like a skunk
His sight is alarming
His science is junk
There’s no global warming
michaelwiseguy says:
March 29, 2013 at 10:19 pm
No Stunad. CO2 is greening the planet.
The comment section in this article is priceless;
Sen. Inhofe ‘proud’ to be target of climate flick ‘Greedy Lying Bastards’
“Sen. James Inhofe (R-Okla.) sees criticism of him in a recent documentary about climate change as a badge of honor.
A bit OT but please someone tell me how to pronounce Senator Inhofe’s name. It is not obvious and as a UK citizen who admires him I cannot say his name with any confidence.
Thank you
Ferdinand Engelbeen:
I am replying to your post addressed to me at March 30, 2013 at 4:55 pm as a courtesy to show that I have not ignored it.
As I said, others can assess the totality of our disagreement by searching WUWT and I do not intend to yet again repeat the arguments to no purpose. Our difference is summarised by your post I am answering so others can assess our different views by considering it.
There fore, I quote from your post and provide you with the ‘last word’.
At March 30, 2013 at 1:36 pm I said those who claim they know the cause of recent rise in atmospheric CO2 concentration are selective of the data they consider, and I wrote to you
Your reply to that says in total
Happy Easter.
Richard
Willis,
My comment was based on your assertion that we know coal is of biotic origin because it is full of plant fossils. IIRC Gold addresses this and shows that this does NOT prove that coal is of biotic origin.
Maybe I’ve read Gold more recently than you have.
att Willis Eschenbach
maybe it is a good idea that should read those articles Jim Hansen is referring to, before you start breaking Hansen down;
they are part of the discussion;
by the way, Hansen writes ‘affected’ ; you are probably a native English speaker, so you know what is ment by ‘Affected’
Hoser says:
March 30, 2013 at 5:27 pm
The point is, whatever WE put into the atmosphere, now we know it must pass through another reservoir, via a natural process, with a half life of 10 years.
All we know from the 14C bomb spike is that there is a huge exchange between the different reservoirs, but that says next to nothing about what happens with an excess amount of CO2 above equilibrium. The 14C bomb spike was in a 10^-12 ratio to 12C in the atmosphere, thus didn’t add any substantial amount to the CO2 mass in the atmosphere.
It only says something about the exchange rate between the reservoirs and the distribution of CO2 over these reservoirs. The 14C bomb spike, CFC’s and other human made stuff is used as tracer in a lot of investigations of ice cores, ocean flows, plant absorption, etc.
In contrast, the human addition in total mass is about twice the increase in the atmosphere since about 1850. Thus whatever the actual exchange rate, it seems that the exchange rate is hardly influenced by the extra mass (and thus partial pressure) of the extra CO2, because the app. 150 GtC exchange fluxes in equilibrium only changed to 150 GtC in and 154 GtC out (or 148 in and 152 out, doesn’t matter at all, only the difference is known with reasonable accuracy).
The equilibrium setpoint didn’t change that much over time. We know the ratio between temperature and CO2 levels over the past 800 kyr: a change of 8 ppmv/°C with a lag of CO2 after temperature changes at a – for a natural process – high correlation (0.87). The resolution of the oldest ice cores (500-600 years) is not sufficient to exclude any more rapid cycle, but sufficient to exclude the current increase of 100 ppmv in 150 years, if that is a one-sided event.
More recently, the Law Dome ice core over the past 1000 years has sufficient resolution (about 20 years) to show the effect of the LIA: a drop of about 6 ppmv for a drop of ~0.8°C with a lag of about 50 years. Again near 8 ppmv/°C.
The setpoint change caused by the warming since the LIA thus is good for a maximum 8 ppmv CO2 increase in the atmosphere, if we may assume that the temperature increased with maximum 1°C.
The rest of the measured 100+ ppmv increase is by something else, whatever that may be…
att: Willis Eschenbach
I take back the accusation of plagiarism, (I thought you did read the articles Hansen is referring to under reference 12)
Ferdinand Engelbeen says:
March 31, 2013 at 3:19 am
Mostly I agree with what you are saying. However, it is doubtful ice actually has the resolution you are looking for in terms of the rate of change. Ice is far more fluid than people imagine. Hydrogen bonds are forming and breaking all the time in ice, even more so around non-water molecules. Thus, diffusion is an important process, which is likely not well characterized in ice. Others have discussed whether the bubbles seen in ice are properly associated with the age of the ice layer in which they are found today. Extending that argument, it is very likely there is exchange of gasses in and out of the ice and bubbles, It would not surprise me if we determined the bubbles shrank over time while moving up. Consequently, ice core data may be blurred and dimmed with short term changes on the order of a century or more not clear and not accurately representing the gases present at the time the water was deposited as ice.
Clearly, a 100 ppmv increase from 300 ppmv indicates the equilibrium has not shifted by much. Our production of CO2 is a tiny fraction of the total in the various reservoirs. I’m trying to remind people the CO2 we produce passes through other reservoirs with a half-life of 10 years. It could be trapped there, but it isn’t. Why not? Equilibria are established by a balance of on-rate and off-rate from the source pools. Knowing half of the equation means we can place limits on the behavior of the other half. If 14CO2 spike leaves the atmosphere with a half-life of 10 years, then any CO2 emitted on say any particular day will pass into another CO2 reservoir at the same rate. I’m not saying anything about the total amount of CO2 in the atmosphere, except 1) the last century rise doesn’t seem remarkable, 2) there is nothing particularly worrisome about it.
I am very concerned about the attempts by governments to use this phenomenon in writing regulations and laws to control people and getting away with it by generating unfounded fear in the population. No one has been a stronger voice of reason against government-backed climate alarmism than Vaclav Klaus (http://www.klaus.cz/clanky/2266).
How’d the peer reviewers miss it too?
Mike Borgelt:
At March 31, 2013 at 2:54 am you say to Willis,
I am not competent to discuss formation(s) of oil but I operated a lab. which conducted maceral analysis of coal for several years.
Coal is certainly comprised of fossilised plant material and forest fires with some addition of soil (i.e. ash minerals) and nothing else. Maceral analysis uses microscopy to examine coal samples, and identifies the observed extremely compressed components of plants to determine the source and nature of a coal
Each and every stage of coalification of each and every type of coal is observed to be happening in the world now.
Coal is biogenic: all of it is.
Richard
Willis Eschenbach says:
March 30, 2013 at 12:15 pm
What I’m trying to say, Ferd, is that I don’t have a clue what “intolerance” you are babbling about.
=============
Apologies. nothing to do with you or your article Willis. for technical reasons the posting ended up in the wrong article.
to me, one of the best features of WUWT is that it allows what on the surface might appear to be preposterous theories to be discussed, because that is typically when we see the greatest advance in ideas. when we discuss what is already agreed, then advances are small at best.
By intolerance I was referring to the practice of limiting or censoring comments, as routinely practiced at RC. I think there is a danger to WUWT in following the practice, no matter how good the reasons. the road to hell is paved with good intentions.
I forget the source, but a quote comes to mind, something along these lines: “we are here today to discuss your preposterous theory. the question before us is whether it is preposterous enough that it might actually be correct”.
richardscourtney says:
March 31, 2013 at 5:28 am
Coal is biogenic: all of it is.
============
given the large deposits of peat found on the surface, it is possible even likely they are the source of coal. the problem is that we don’t see comparable large reservoirs of animal remains that are proposed as the source for other fossil fuels.
limestone + water + iron + heat ===> methane + rock
the above reaction appears possible, even likely due to plate techtonics. limestone is fossilized CO2, so technically this would be fossil fuel. but not derived from animal or plant remains. active biology may be also play a part within the earth’s crust. providing the necessary enzymes to catalyze the reaction.
http://wattsupwiththat.com/2013/03/27/enivronmentalists-worst-nghtmare-gmod-frankenbugs-could-make-fuel-from-directly-co2/
Margaret Smith, take it from an Okie, it is pronounced In-hoff.
Burn that coal — help green our planet.
You’ve just got to love James Hansen’s new epiphany:
Burning old buried decayed trees is really better than burning our forests.
You’ve also got to love James Hansen’s next epiphany:
No, you really can’t accurately measure a temperature from 1200 kilometers away.
Making good progress in your treatment plan Jimmy, keep your chin up and out of jail.
Mike Borgelt says:
March 31, 2013 at 2:54 am
Thank, Mike. I’m sure you’ve read Gold more recently than I did. I have no recollection of Gold claiming that the plant fossils in coal meant that it was of abiotic origin … you’ll have to cite that one.
w.
Martin van Etten says:
March 31, 2013 at 3:04 am
They may be part of your discussion, Martin, but they are not part of Hansen’s discussion other than by accident.
Look, Martin, when Hansen makes claims that are garbage, they will still be garbage after I read the people that he cited but ignored. We’ve already agreed that he misrepresented the work of the cited authors as regards Pinatubo … perhaps after that it’s important to you who else’s work he’s misrepresented.
Me, I don’t care whose work Hansen is distorting and munging this week. I am quite content to point out Hansen’s own incorrect statements. I don’t care which authors he misunderstood to arrive at those misrepresentations.
If you think it’s important to find out just whose ideas Hansen is garbling, be my guest. The details of his lack of understanding might be of interest to you. To me, the putative sources of Hansens’s colossal misunderstandings are about as interesting as the nocturnal habits of banana slugs … but heck, Martin, report back to us on what you find, it should be good for at least a bitter laugh …
w.
Margaret Smith says:
March 30, 2013 at 11:28 pm
——————-
It’s pronounced In-Hoff
Spoken quickly it becomes In-Off.
Although his words on CAGW sound like he’s saying e-nuff.
cn
Martin van Etten says:
March 31, 2013 at 3:21 am
Oh, that’s great. Martin, you accused me of plagiarizing a damn vertical line representing a date. That’s the most asinine accusation of plagiarism I’ve heard in my entire life.
Now, instead of just taking it back, you are claiming that if I’d seen that vertical line before I would indeed have been guilty of plagiarism … but since I didn’t read that paper and see that line, I’m innocent. Phew, I was worried for a minute …
Thanks heaps for determining that I’m innocent, I feel much better now.
You have taken back your accusation of plagiarism, Martin. It was gracious of you to attempt an apology, and it is certainly accepted … but the stupidity of first making a ridiculous accusation, and now repeating (with qualifications) your accusation in your “apology” still remains. Plagiarism of a vertical line representing June 1991? Really?
You’ve truly lost the plot, my friend, that’s not plagiarism even if I’d seen that vertical line twenty times. A simple apology would have sufficed, but noooo, you had to keep digging …
Martin, you seem like a nice bright guy who has unfortunately grabbed the wrong end of the stick. Hang around, you might learn something.
w.
ferdberple says:
March 31, 2013 at 8:33 am
Thanks for the explanation, Ferd, that’s happened to me more than once, and with me the “technical reasons” usually involved brain lacunae. I appreciate your note.
w.
Hoser says:
March 31, 2013 at 4:22 am
Thus, diffusion is an important process, which is likely not well characterized in ice.
In fact, it is so low that it is near unmeasurable. There is one estimate, based on the migration around melt layers of the Siple Dome ice core:
http://catalogue.nla.gov.au/Record/3773250
The resolution of about 20 years at 2.74 kyr gets about 22 years, taking into account the migration and at full depth (70 kyrs) that increases to 40 years. Not a big deal for a “warm” ice core at average -23°C. For the “cold” inland ice cores like Vostok and Dome C (at average -40°C), the migration is orders of magnitude smaller.
Moreover, if there was substantial migration, over ice ages and interglacials the ratio between temperature and CO2 levels would fade away for each interglacial 100 kyr back in time. That is not the case for even the Dome C 800 kyr ice core.
Consequently, ice core data may be blurred and dimmed with short term changes on the order of a century or more
Depends of the accumulation rate: the two fastest accumulation ice cores of Law Dome (1.5 m ice equivalent per year!) have a resolution of ~8 years, including a 20 year overlap with direct measurements at the South Pole. But these do only go back some 150 years in time before hitting bedrock. See the discussion of ice core gas age distribution at:
http://courses.washington.edu/proxies/GHG.pdf
In these ice cores one can detect a one-year peak of 20 ppmv or a sustained increase of 2 ppmv over the full resolution period. As we have several ice cores with overlapping periods for the same average gas age (but with worsening resolution back in time), we may be confident that at least in the past Holocene, there were no sustained periods of more than a decade with 100 ppmv extra as we see today:
http://www.ferdinand-engelbeen.be/klimaat/klim_img/antarctic_cores_010kyr.jpg
I’m trying to remind people the CO2 we produce passes through other reservoirs with a half-life of 10 years. It could be trapped there, but it isn’t. Why not?
Different processes at work: the fast processes which exchange CO2 over the seasons are mainly temperature (and for vegetation also drought) controlled. The sea surface releases 16 ppmv CO2 for a hemispheric increase of 1°C in spring and reverse in fall. Land vegetation captures huge amounts in spring when the temperature reaches the necessary minimum and reverse in fall. But both (countercurrent) processes are limited in capacity. The overall global change in CO2 over the seasons is only 5 ppmv (10 GtC) for a 1°C change (mainly in the NH summer), while the total fluxes involved are about 150 GtC.
The processes of interest are slower: deep ocean exchanges are far less temperature dependent, but are CO2 partial pressure (difference) dependent. Longer term storage of carbon in roots, peat and humus needs time too. Both are enhanced by increased CO2 levels, but changing much slower than the fast processes (half life time app. 40 years). The advantage is that these processes are quasi unlimited in capacity.
The fate of the 14C spike is mainly a result of the fast exchanges and only in the second place of the slower processes.
Have a look at what happens if 100 GtC of human emissions were released at once some 160 years ago:
http://www.ferdinand-engelbeen.be/klimaat/klim_img/fract_level_pulse.jpg
The fate of the original “human” release (FA: human fraction in air) is the same as for the 14C spike: decreasing with a half life of about 8 years. The fate of the increased total carbon (tCA) is of a different order: a half life of about 40 years towards the old equilibrium. Despite that after a few decades all human CO2 disappeared into other reservoirs (exchanged by natural CO2, nCA), the excess above equilibrium still is 100% caused by the one-time pulse. FL is the human fraction in the upper ocean layer, not of interest here.
This was based on realistic exchanges between the different carbon reservoirs.
If you take the continuous increasing human emissions as input, that gives following trends:
http://www.ferdinand-engelbeen.be/klimaat/klim_img/fract_level_emiss.jpg
Thus in my informed opinion, based on all available observations, humans are responsible for the increase of CO2 over the past 160 years. If that is a problem is a complete different question and in my opinion, there are a lot of indications that a modest increase in temperature would be quite beneficial for biodiversity and humanity.
Chuck Nolan says:
March 31, 2013 at 11:00 am
wayne says:
March 31, 2013 at 9:23 am
Thanks folks
Margaret
ferdberple:
I am replying to your post addressed to me at March 31, 2013 at 9:12 am.
As I said, I am not competent to discuss the formation processes of oil and gas but I can state – for the reasons I explained – with absolute certainty that all types of coal are biogenic.
Hence, I fail to understand why those who wish to promote investigations of possible non-biogenic petrochemicals insist on including coal in their arguments.
Why not discuss oil and gas formation where they may have a case?
Why insist on including coal where it is easy to demonstrate that their assertions are wrong?
Whether or not coal is biogenic is not relevant to whether oil and/or gas are biogenic.
Richard
att Mr Eschenbach:
the point is not plagiarism, the only serious point is your NOT reading the references Jim Hansen has provided AND taking a slanderish position towards Hansen and breaking down his article on false arguments:
I’m quoting you:: “He is now claiming (again falsely ) that there is some drop in the airborne fraction after Pinatubo”
If you had read the Keeling-article Hansen is referring to, you would have noticed ‘your’ blue line and a discussion about the contribution of the Mount Pinatubo eruption to the decline of the airborne fraction of CO2;
you would have read on page 668: ” The inferred anomalous oceanic sink of 0,6 Gt C immediately AFTER the Pinatubo eruption…etc (Keeling)
and (this is also relevant for the discussion): ” Perhaps, however the Pinatubo eruption was only incidental to a declining CO2 anomaly;
I recall your quotation from Hansen:
“Remarkably, and we will argue importantly, the airborne fraction has declined since 2000 (figure 3) during a period without any large volcanic eruptions. The 7-year running mean of the airborne fraction had remained close to 60% up to 2000, except for the period affected by Pinatubo.
there is a second sentence immediately hereafter:
” The airborne fraction is affected by factors other than ….( – )…most notably by changes in the rate of fossil fuel emissions” (Here Hansen referring to Gloor, Sarmiento and Gruber – see the literature list);
than you come with this curious statement or should I say question:
“Hansen may have been aware, although you provide no evidence to support that claim .”
although you provide no evidence?”
Willis, think a moment about the question how did “I” or even “you” came to know about these articles (answer: finding the two references (11 and 12 in Hansens article, and running to the University library to READ what its all about ; (you could have used your online subscription , that’s even more easy….;
nevertheless: do you seriously claim that Hansen did not read his OWN references?
Willis, the main problem with your article is this remark (third alinea below figure 2):
“…..let me comment that any reviewer who let any of that Pinatubo NONSENSE past them should resign their commission…”
you have no argument at all for this expression: Pinatubo NONSENSE;
it is very much a pity that you are so eager to defamer and slander Jim Hansen, that you completely forget the motto of this weblog, the ambition to be the best ‘scientific’ weblog on climate change;
because while holding on to this position, you are avoiding the main points of the ‘Hansen 2013’ article, that is the discussion on the ” doubling down on the Faustian bargain” as Hansen calls it;
I quote you again:
“but heck, Martin, report back to us on what you find, it should be good for at least a bitter laugh …”
so I did!
How can one slander someone who is so disingenuous ? This so called scientist (Hansen) looks to me to have finally seen the wheels coming off the AGW bus and is trying to cover his own ass!
Im not a scientist so I cannot qualify Mr Eschenbach”s science but I can read and have a reasonable memory and can apply common sense, these skills, sadly lacking up to now in the corrupt research emanating from Hansen and cohorts are in abundant this and most of Escenbachs posts (I say most as I wont claim to have read them all) Perhaps you should look up the meaning of slander??
Martin van Etten says:
March 31, 2013 at 5:38 pm
Listen, you obnoxious little man. You accused me of plagiarism, which in my world is a damn serious charge, and confirms you as a dirty little worm for making the charge without a scrap of evidence.
So I responded in a manner appropriate to such seriousness.
Now you want to say that the point is not plagiarism? That your accusation of plagiarism wasn’t important, it wasn’t the point?
Maybe you plagiarize so much that such an accusation isn’t the point with you, Martin, I don’t know. But in my world, I don’t get accused of that because I don’t do it. You want to accuse me of plagiarism and then get all uppity like I’m the one at fault when I takes your nasty accusation seriously?
Go away, and don’t come back until you’ve learned some manners.
And as to you whining that I did not read some specific one or the other of the SIXTY-ONE references in Hansen’s paper? The obvious problem is not that I have not read them.
The problem is that HANSEN has not read them, or if he has, he is misrepresenting them.
On second thought, Martin, don’t come back when you’ve learned some manners. Come back when you’ve learned some manners AND you can tell us with a straight face that YOU have read all sixty-one of the references … you’ve busted me for not doing something you haven’t done yourself, Martin.
But given your other accusations, I suppose that should come as no shock. You’ve revealed yourself to be as lacking in morals and scruples as is Hansen, you’re willing to accuse a man of plagiarism with no evidence at all. So I guess it shouldn’t surprise me that you’re willing to bust me for not doing something you haven’t done … and you wonder why the AGW side is losing the argument?
w.
Please forgive me for being slow. If this airborne fraction is decreasing, does that mean that proportionally more CO2 is being sequestered in the oceans and land? And, if that’s the case, then hasn’t Hansen shot a hole in global warming alarmism? And knowing how those guys operate, that seems unlikely, so I must not be getting something.
I would by far rather have coal powered power stations than nuclear!
Tad says:
March 31, 2013 at 7:16 pm
Please forgive me for being slow. If this airborne fraction is decreasing, does that mean that proportionally more CO2 is being sequestered in the oceans and land?
You are completely right: Hansen is going opposite to the “mainstream” IPCC scientists who said for years that several of the fast reacting CO2 sinks in nature were saturating, thus that the airborne fraction would increase over time and the first signs were already there. Now Hansen says the opposite, according to him thanks to increased coal burning.
In reality, it seems that there is little change over time and the year by year variability (mainly temperature dependent) levels off to a near fixed ratio:
http://www.ferdinand-engelbeen.be/klimaat/klim_img/acc_co2_1900_2004.jpg
But I need to make an update for the past years…
From a process viewpoint, that means that nature as a whole reacts as a simple linear first order process against a disturbance (in this case the human emissions) and the near fixed airborne fraction is the result of the slightly exponential increase of the emissions over time. With fixed emissions, the airborne fraction would go towards zero and CO2 levels asymptotic towards a new equilibrium higher than the old (temperature controlled) one.
att Mr Willis Eschenbach
you have not commented on the AND part of the first statement;
references 11 and 12 concern your false allegation that Hansen blames the decrease of airborn fraction of CO2 on Pinatubo;
he did not make such a statement, you did put him these words in his mouth, and than started blaming him!
unforutnately you did not correct this false conduct and your nonsense comment about “Pinatubo Nonsense”;
you don’t have to read all references, just read these two the forst one of the respected scientist Keeling (maybe you remember his name…) and the more recent from Gloor, Sarmiento & Gruber
a little copy paste into Google and you will find easyly these articles; why are you s stubborn, I even went to the library to read them fully;
than this nonsense, (I’m quoting you): “The problem is that HANSEN has not read them, or if he has, he is misrepresenting them.”
I have been fair and nice with you, but now you make me angry! I may be a “worm”, you are just a stupid stubborn child that cannot admit that he did something wrong (defaming Hansen with false allegations)
Willes, please think!
if Hansen is trying to make a point that the use of coal is causing some nitrogen fertilisation and extra CO2 uptake by the vegetation, t(hat together with the cooling because of aerosols, is preventing temperatures to rise in the last decennium) – in a period without volcanism – why should he emphasize the role of volcanism in the Pinatubo period? Please try to explain yourself! WHY?
To my way of thinking, it you are presenting a 7 year moving average, you start with data, say A1 to A7 for years say, 2001 to 2007, add them and divide by 7, then put this against 2004 – the mid year. Ditto for subsequent years, A2 to A8, etc. Eventually your last set of data is A12 for 2012. So you add A6 to A12, divide by 7 and put this against 2009, and THEN STOP! Is this wrong or too difficult?
To throw another cat into the dog fight, Arrhenius was writing around 1896, I think, about the global warming potential of carbon dioxide and other gases. I believe that he calculated the earth was on average about 15 C warmer, due to the atmosphere, than it would have been without it. But only a few years before had radio activity been discovered and it was not then realised that the earth was warm because of the decay of uranium and other radioactive elements. How much does heat from radioactivity contribute to the earth’s normal temperature? I have read in Environmental Home type magazines that you can harness geothermal heat for your house by surrounding it with an insulating layer several metres wide, and provided your house is properly insulated you can obtain a house internal temperature of around 15 C just from the leakage of heat upwards.
A final point, all the carbon dioxide in coal and oil, and in chalk, limestone and marble, was at one time in the atmosphere, and was sequestered by trees, and by diatoms/foraminifera. Yet there was no “Venusian” runaway greenhouse catastrophe. Why then should we fear one now, especially as it would be impossible to use ALL the coal and oil, and why convert chalk, etc, to atmospheric CO2?