OVERVIEW
This is the fourth post in a series that presents myths and failed arguments created by proponents of manmade global warming about the El Niño-Southern Oscillation (ENSO). A list of the earlier (with links) and future posts follows the body of this one. I began the series of posts back in December 2012, but I got sidetracked with other matters. This is a return to that series.
INTRODUCTION
I have shown in numerous blog posts over the past 4 years and in my books published last year that satellite-era sea surface temperature data indicate the oceans warmed naturally. This, of course, raises the hackles of the promoters of manmade global warming. In attempts to spin what’s blatantly obvious in the data, those merchants of human-induced warming have created a number of myths and failed arguments about El Niño and La Niña.
This post presents one of their failed arguments. It includes a chapter from my book Who Turned on the Heat? It’s Chapter “7.10 Failed Argument – The East Indian-West Pacific and East Pacific Sea Surface Temperature Datasets are Inversely Related. That Is, There’s a Seesaw Effect. One Warms, the Other Cools. They Counteract One Another”.
This failed argument stems from the following animation, which was included in an earlier blog post. It’s also included as Animation 7-1 in Who Turned on the Heat? The animation is intended to help visually confirm that the warm water released from below the surface of the western tropical Pacific during a strong El Niño doesn’t just disappear after an El Niño. That leftover warm water initially winds up in the East Indian and West Pacific Oceans during the trailing La Niña.

Animation 7-1
Peddlers of manmade global warming claim the El Niño- and La Niña-caused variations in sea surface temperatures offset or counteract one another, so that El Niño and La Niña events cannot contribute to the long-term warming of the global oceans. What they overlook is the fact that a strong El Niño releases a vast amount of naturally created warm water from beneath the surface of the western tropical Pacific. The warm water sloshes to eastern equatorial Pacific, where it temporarily raises sea surface temperatures. Then after the El Niño, the warm water is returned to the West Pacific, where it warms sea surface temperatures in an obvious upward step. That leftover warm water is distributed poleward and to the East Indian ocean. That redistribution of warm water occurs during the transition from El Niño to La Niña and during the trailing La Niña event.
As you’ll see in the upcoming graphs, during the El Niño, the sea surface temperatures in the East Indian and West Pacific Oceans only drop a small amount in comparison to the warming of the East Pacific, so the East Indian and West Pacific cooling does not counteract the warming in the East Pacific during the El Niño.
But the argument is correct in one respect: the leftover warm water that is redistributed after the El Niño does counteract the effect of the trailing La Niña on global surface temperatures—sea surface and land surface air temperatures.
As an initial note: In early posts, I focused on the ENSO-induced upward shifts in the sea surface temperature anomalies of the East Indian and West Pacific oceans. And I used the latitudes of 60S-65N. See Map 1. That was where I first found them. With time, I’ve extended that discussion to show the ENSO-caused upward shifts in the Atlantic, Indian and West Pacific data, extending the data from pole to pole. Refer to the illustrated essay “The Manmade Global Warming Challenge” (42mb).

Map 1
The following is a reprint of Chapter 7.10 from Who Turned on the Heat?
7.10 Failed Argument – The East Indian-West Pacific and East Pacific Sea Surface Temperature Datasets are Inversely Related. That Is, There’s a Seesaw Effect. One Warms, the Other Cools. They Counteract One Another
This argument has been tried more than once. It’s typically voiced when I present a gif animation that shows the East Pacific warming and cooling in response to ENSO and shows the East Indian-West Pacific sea surface temperatures varying in the opposite direction. See Animation 7-1. The argument is, the seesaw effect between the East Pacific and the East Indian-West Pacific datasets—better described as their opposing warming and cooling—causes the two datasets to counteract one another. The argument is intended to downplay the importance of the variation in the sea surface temperatures of the East Indian-West Pacific subset.
The gif animation linked above is Figure 9 from the November 2009 post
More Detail On The Multiyear Aftereffects Of ENSO – Part 2 – La Niña Events Recharge The Heat Released By El Niño Events AND… The continuation of the title is, …During Major Traditional ENSO Events, Warm Water Is Redistributed Via Ocean Currents.
My blog posts are well illustrated, like this book. Many times those reading the post aren’t actually reading the text; they’re trying to get an overview by skimming through the notes on the illustrations. Those readers noticed the seesaw effect in that animation and spew forth their comment. If they had read the text, or had continued skimming through the illustrations, they would have realized I had answered their concerns a few paragraphs and illustrations later. For example, the following text and illustrations are from that post. I’ve changed the illustration numbers for the book, and replaced the acronym SST with sea surface temperature:
Figure 7-22 is a comparison of East Pacific sea surface temperature anomalies and the sea surface temperature Anomalies of the East Indian and West Pacific Oceans. I’ve also included scaled NINO3.4 sea surface temperature anomalies as a reference for timing. The 1986/87/88 and 1997/98 El Niño events and the initial portions of the subsequent La Niña events are highlighted. It is very clear that the two datasets are out of phase.
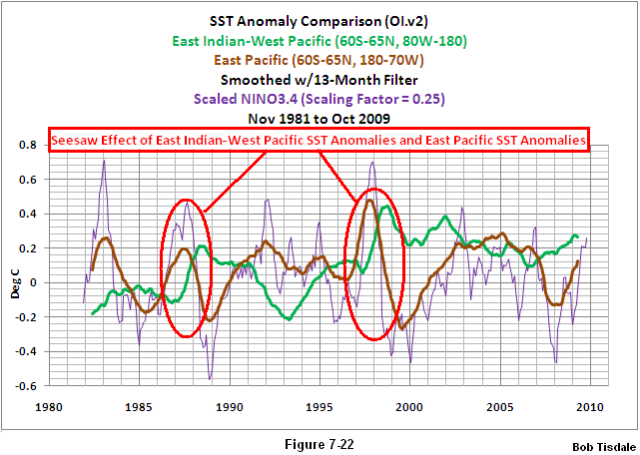
Figure 7-22
Figure 7-23 is the same comparison graph, but in it, I’ve highlighted a different portion of the data. The response of the East Pacific sea surface temperature anomalies to the major El Niño events of 1986/87/88 and 1997/98 is very visible in that comparison graph. On the other hand, note that the sea surface temperature anomalies of the East Indian and West Pacific cool very little (the area highlighted) while the sea surface temperature anomalies in the East Pacific are rising dramatically. This happens because El Niño events are fueled by subsurface waters from the Western Tropical Pacific, from depths to 300 meters in the Pacific Warm Pool. These subsurface waters are not included in sea surface temperature measurements.
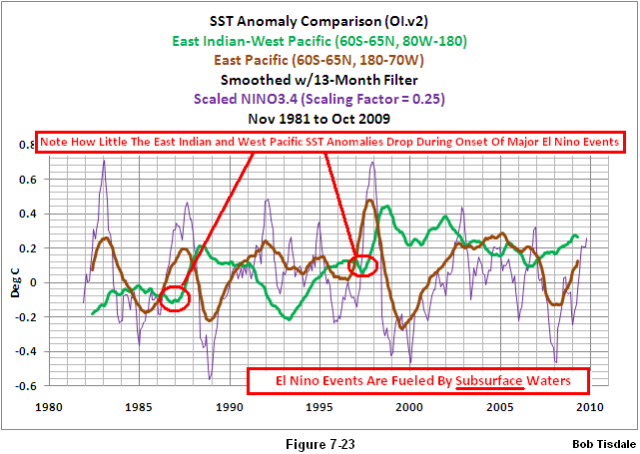
Figure 7-23
In summary, the seesaw effect only occurs during, and is caused by, the transition from El Niño to La Niña, when the warm water that’s left over from the El Niño is carried back to the western Pacific and eastern Indian Oceans. The seesaw effect does not occur to the same level during the evolution phase, when the sea surface temperatures of the East Indian-West Pacific data cool very slightly as the East Pacific warms significantly. The reason for this is, the majority of the warm water that fuels an El Niño comes from below the surface of the west Pacific Warm Pool.
RECAP
The seesaw effect basically shows the impact on the East Indian-West Pacific sea surface temperature data of the warm water from the El Niño that’s left over when the El Niño has ended in the eastern tropical Pacific. The seesaw effect does not occur during the evolution of the El Niño, because most of the warm water that fuels a major El Niño event comes from below the surface of the west Pacific Warm Pool. It is, therefore, not a true seesaw effect throughout the evolutions and decays of both phases of ENSO.
END OF REPRINT
ONE MORE ANIMATION
The animation above only compares maps of December sea surface temperature anomalies during (December 1997) and after (December 1998) the 1997/98 El Niño. The following animation adds the December 1996 map as a “before” reference.
December 1996, 97, 98 Sea Surface Temperature Anomalies (Before, During and After the 1997/98 El Niño)
WHY IS THAT IMPORTANT?
The warm water that was left over from the 1997/98 El Niño warmed the sea surface temperatures of the Atlantic, Indian and West Pacific oceans about 0.19 deg C in an upward step. See Supplement Figure 1. It’s really difficult to miss that step.

Supplement Figure 1
Looking back at the 1986/87/88 El Nino, the sea surface temperatures there shifted up about 0.09 deg C in response to the warm water released by it. And the 2009/10 El Niño bumped up the sea surface temperatures of the Atlantic, Indian and West Pacific oceans a little more. Without those three strong El Niño events, Supplement Figure 2, the sea surface temperatures there would not have warmed since 1984.
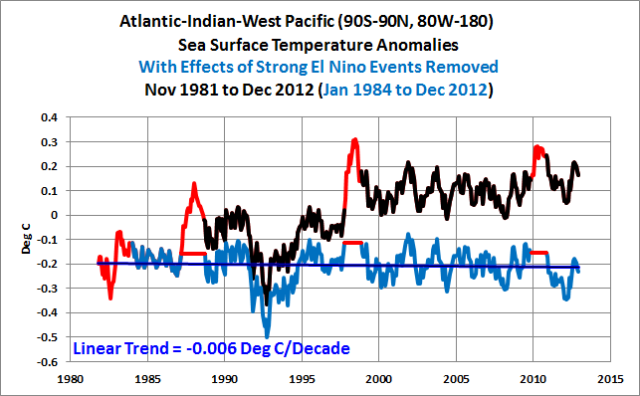
Supplement Figure 2
INTERESTED IN LEARNING MORE?
Why should you be interested? As noted in the post, the sea surface temperature records indicate El Niño and La Niña events are responsible for the warming of global sea surface temperature anomalies over the past 30 years, not manmade greenhouse gases. I’ve searched sea surface temperature records for more than 4 years, and I’ve searched ocean heat content records for more than 3 years, and I can find no evidence of an anthropogenic greenhouse gas signal. That is, the data indicates the warming of the global oceans has been caused by Mother Nature, not anthropogenic greenhouse gases.
I’ve recently published my e-book (pdf) about the phenomena called El Niño and La Niña. It’s titled Who Turned on the Heat? with the subtitle The Unsuspected Global Warming Culprit, El Niño Southern Oscillation. It is intended for persons (with or without technical backgrounds) interested in learning about El Niño and La Niña events and in understanding the natural causes of the warming of our global oceans for the past 30 years. Because land surface air temperatures simply exaggerate the natural warming of the global oceans over annual and multidecadal time periods, the vast majority of the warming taking place on land is natural as well. The book is the product of years of research of the satellite-era sea surface temperature data that’s available to the public via the internet. It presents how the data accounts for its warming—and there are no indications the warming was caused by manmade greenhouse gases. None at all.
Who Turned on the Heat? was introduced in the blog post Everything You Ever Wanted to Know about El Niño and La Niña… …Well Just about Everything. The Free Preview includes the Table of Contents; the Introduction; the beginning of Section 1, with the cartoon-like illustrations; the discussion About the Cover; and the Closing.
Please buy a copy. (Credit/Debit Card through PayPal. You do NOT need to open a PayPal account.) Simply scroll down to the “Don’t Have a PayPal Account” purchase option. It’s only US$8.00.
THE ENSO MYTH SERIES
ALREADY PUBLISHED
1. El Niño-Southern Oscillation Myth 1: El Niño and La Niña Events are Cyclical. Refer also to the cross post at WattsUpWithThat for comments.
2. El Niño-Southern Oscillation Myth 2: A New Myth – ENSO Balances Out to Zero over the Long Term. And please see the WattsUpWithThat cross post.
3. Myth – ENSO Has No Trend and Cannot Contribute to Long-Term Warming. The WattsUpWithThat cross post is here.
UPCOMING
Myth – The Effects of La Niña Events on Global Surface Temperatures Oppose those of El Niño Events
Failed Argument – El Niño Events Don’t Create Heat
Myth – El Niño Events Dominated the Recent Warming Period Because of Greenhouse Gases
Myth – ENSO Only Adds Noise to the Instrument Temperature Record and We Can Determine its Effects through Linear Regression Analysis, Then Remove Those Effects, Leaving the Anthropogenic Global Warming Signal
Myth – The Warm Water Available for El Niño Events Can Only be Explained by Anthropogenic Greenhouse Gas Forcing
Myth – The Frequency and Strength of El Niño and La Niña Events are Dictated by the Pacific Decadal Oscillation
SOURCES
The Sea Surface Temperature anomaly data used in this post for the animations and the graphs are available through the NOAA NOMADS website:
http://nomad1.ncep.noaa.gov/cgi-bin/pdisp_sst.sh
or:
http://nomad3.ncep.noaa.gov/cgi-bin/pdisp_sst.sh?lite=
North Germany: Coldest March since 130 years, perhaps since records began:
http://www.rga-online.de/index.php?&kat=120&artikel=110281528&red=1&ausgabe=62284 (german)
Another myth bites the dust. Thanks for another good post Bob.
I think the periodic nature of ENSO is more closely associated with the periodic upwelling of cold (and CO2 saturated) ocean bottom water off the coast of Peru. The rate of warming and evaporation as that surface water goes from East to West is a measure of the rate of energy uptake from the sun. In any case, temperature anomaly data do not tell the whole story. Also,the rate of natural emissions of CO2 from the Equatorial Pacific is a functrion of this rate of warming.
While on a map of the world it may appear to the layman and scientist alike that the Pacific and Indian Oceans are connected between Asia and Australia, this is largely an illusion. The waters of Indonesia for thousands of miles are about 200 feet deep, which is a substantial barrier to any significant volume of mixing between the Indian and Pacific Oceans along the equator.
What is more likely happening is the scientists are mis-interpreting the Indian Ocean Monsoon as a see-saw. The Indian Ocean is unique in all the world. For 1/2 the year the winds are westerly along the equator, the other half the year they are easterly. No other ocean experiences this. Instead ever other ocean has easterly winds year round along the equator and westerly winds year round in higher lattitudes.
An interesting consequence of the Indian Ocean monsoon is the trade routes it opens to travel by sail along the equator between Africa and Asia.
Bob,
If some other authors are reporting correctly, then some events seem to be happening quite fast, perhaps too fast. I’ve been trying to understand 1997-98 for a few years too, but on the side and not in great detail. The temperature layers of the atmosphere derived from satellites seem to heat up at about in unison, as do the deeper parts of the tropical oceans below hot SSTs (but here I see authors in conflict because of buoy problems, etc.) On your last animation above, in 1997 it’s not only the surface ocean west of Peru that got quite hot, there was also a hot red spot west of Western Australia and another one west of Gabon.
Please excuse this wild speculation, but have you considered that you are instead dealing with a couple of lagged systems that are about 5 years apart? I can get a reasonable story out of that speculation, but then there is probably a single piece of evidence that knocks it out of the ring.
The models you have been building up for the 1987-88 hot period give me an impression that much of the global system was placed in the oven for a few months, then taken out, with the exception of the track of the hot water from the western pool to the Peru area.
Can I ask if you accept a rise in ocean temperatures in the 700-2,000m band and the 2000+ m band at about the same time as the SST hot anomaly passes overhead? I don’t think it happens this way, some authors do seem to. If it is accepted, then the heat wave has to travel quite rapidly from one place to another in the vertical sense, just as it seems to travel quite fast vertically in the atmosphere.
I still don’t know what causes the heating of 1997-98. I can’t work out if it’s imported as a hot anomaly, or if it’s just another internal energy redistribution that got its act together in a shorter and hotter time than usual. The cooling is maybe even more interesting than the heating.
Looking forward to more in the series.
If alternate El Niño and La Niñas lead to a net warming of the oceans, what set of circumstances would lead to a cooling?
Always enjoy your posts Bob. You make a complex issue very easy to understand. Thank you!
Heads up
Typo in your link: More Detail On The Multiyear Aftereffects Of ENSO – Part 2 – La Niña Events Recharge The Heat Released By [La Niña] Events AND…..La Nina twice.
Geoff Sherrington says: “On your last animation above, in 1997 it’s not only the surface ocean west of Peru that got quite hot, there was also a hot red spot west of Western Australia and another one west of Gabon.”
Keep in mind I’ve used a very small contour level for those maps (0.2 deg C), so they exaggerate the color scaling of the anomalies. Also consider that the 1997/98 El Nino was monstrous in size, and it shifted “normal” jet stream patterns globally, slowed trades winds in some parts of the tropics, reversed them in others, all of which resulted in the variations in sea surface temperatures globally.
Bob, What are your thoughts about geothermal heat build up in parts of the oceans, caused by a sort of “inversion layer,” to be released in a large upwelling? A while back, I read a paper that supports this, but I cannot find it right now.
Thanks, Bob,
You have clearly shown the climatic importance of ENSO.
Bob
Do you have idea’s of what happened to El Nino and La Nina events in the LIA?? via proxy data and may be the 40s to mid 70’s cooling.And how strong do these events get in negative PDO,AMO years..many thanks
Bloke down the pub says: “If alternate El Niño and La Niñas lead to a net warming of the oceans, what set of circumstances would lead to a cooling?”
Strong El Niño events release vast amounts of warm water from below the surface of the western tropical Pacific, which causes sea surface temperatures to warm in the South Atlantic, Indian and West Pacific subset (represents about 53% of the surface of the global oceans). But the sea surface temperatures there cool between those strong El Niño events, or to look at it another way, that subset would cool without those strong El Niño events:
http://oi47.tinypic.com/24zgfgk.jpg
If we adjust the East Pacific data for volcanic aerosols, it also shows cooling:
http://bobtisdale.files.wordpress.com/2013/03/03-east-pacific.png
And the North Atlantic simply has an additional mode of variability called the Atlantic Multidecadal Oscillation as it rides on top of the natural warming of the other ocean basins. Eventually it will peak, and cool, as it has in the past.
The answer to your question “what set of circumstances would lead to a cooling?” is an absence of strong El Niños and a switch of the AMO in the North Atlantic.
wlf15y says: “Bob, What are your thoughts about geothermal heat build up in parts of the oceans, caused by a sort of “inversion layer,” to be released in a large upwelling?”
I’ve seen blog posts about it, but don’t recall any papers about it.
mycroft says: “Do you have idea’s of what happened to El Nino and La Nina events in the LIA?? via proxy data…”
I haven’t studied paleoclimatological ENSO data.
mycroft continues: “…and may be the 40s to mid 70′s cooling.And how strong do these events get in negative PDO,AMO years..many thanks”
Looking at the average of the NINO3.4 sea surface temperatures from 3 long-term reconstructions, the El Niño events were much weaker from the 1940s to the mid-1970s than they were during the 1980s and 1990s.
http://oi46.tinypic.com/11s36ua.jpg
Consider also that Giese et al (2009) found that the 1918/19 portion of the 1918/19/20 El Niño was underestimated in the NINO3.4 sea surface temperature reconstructions, and that it was likely comparable in strength to the 1982/83 and 1997/98 El Niño events. Giese et al (2009) also suggested that the 1912/13 and 1939/40/41/42 El Niño events were also under-rated.
http://www.cdc.noaa.gov/people/gilbert.p.compo/Gieseetal2009.pdf
The decrease in strength of the El Niños during the 1940-70s, along with a shift in sea level pressure caused the PDO to be negative during that time period.
wlf15y says: “Typo in your link: More Detail On The Multiyear Aftereffects Of ENSO – Part 2 – La Niña Events Recharge The Heat Released By [La Niña] Events AND…..La Nina twice.”
Thanks. I read that half a dozen times over the past few days and didn’t catch it. That’s actually a typo in the book. I’ve repaired in the posts here and at my blog.
Thanks Bob – indeed all quick generalisations about ENSO are inadequate (its noise, its just Kelvin/Rossby waves, its all in the stars, its just the trades, its just earth mother magnet, its the sun etc.). ENSO is a complex nonlinear oscillator, it is not driven slavishly by anything, granted it does receive energy and information input from outside but processes them by its own dynamic. Even reducing it to just “el Ninos” and “La Ninas” is an oversimplification and does not do it justice.
Bob Tisdale says:
March 27, 2013 at 12:12 pm
Bloke down the pub says: “If alternate El Niño and La Niñas lead to a net warming of the oceans, what set of circumstances would lead to a cooling?”
Strong El Niño events release vast amounts of warm water from below the surface of the western tropical Pacific
The oceans generally are characterised by strong vertical temperature stratification, warm water on top, cool water below especially below the thermocline. How then does a “vast amount” of warm water come to be below the surface in the western tropical Pacific? How does this anomalous inverse stratification come about?
I thought the ocean heating of el Nino was the combined result of interruption of Peruvian upwelling and concommitant weakening of the trades, resulting in strong solar heating of doldrum calm Pacific surface water. The following reactive La Nina with resurgent trades blows this warm water westward and (due to coriolis force) it moves clockwise round the Pacific – and some sieves through Indonesia to the Indian ocean.
Bloke down the pub says:
March 27, 2013 at 6:51 am
If alternate El Niño and La Niñas lead to a net warming of the oceans, what set of circumstances would lead to a cooling?
Apparently it seems to be connected with the phase of ENSO oscillation. Take a look at the curve of Nina3.4 SSTs over the last 2-3 of decades. When the Nina 3.4 peaks in summer, the peak ends higher (warmer) than it began, when it peaks in winter the waveform ends cooler than it began. A series of summer peaks marks a warming period, so a series of winter peaks would bring temperatures down.
phlogiston says: “The oceans generally are characterised by strong vertical temperature stratification, warm water on top, cool water below especially below the thermocline. How then does a “vast amount” of warm water come to be below the surface in the western tropical Pacific? How does this anomalous inverse stratification come about?”
The trade winds push the warm water up against Indonesia and it accumulates there. The sea surface height of the western tropical Pacific is about 0.5 meters higher in the west than in the east as a result.
phlogiston says: “I thought the ocean heating of el Nino was the combined result of interruption of Peruvian upwelling and concommitant weakening of the trades…
A weakening of the trade winds in the western tropical Pacific, not the east, initiates the El Niño.
Gravity causes the warm water to slosh to the east, causing an increase in the volume of the Equatorial Counter Current in the Pacific.
phlogiston says: “ …resulting in strong solar heating of doldrum calm Pacific surface water.”
Downwelling shortwave radiation (sunlight) decreases in the central and eastern tropical Pacific during an El Niño because the convection, cloud cover and precipitation accompany the warm water to the east.
Thanks Bob another fine post, I would note that reading comprehension drops in folks with preconceived ideas.
But in the defence of those who skim, sir your book is full, I am just starting my reread and already finding stuff I missed, the first time.
E.M Smith, @ the chiefio,and a few others have mused upon the tidal effects of the lunar cycles as a means of moving ocean waters around this globe, I am curious if you have considered this in connection with possible triggers for ocean state change?
The meanwhile up the air, the MJO’s mojo goes through ups and downs. A massive heat engine, the Earth is.
john robertson says: “E.M Smith, @ the chiefio,and a few others have mused upon the tidal effects of the lunar cycles as a means of moving ocean waters around this globe, I am curious if you have considered this in connection with possible triggers for ocean state change?”
I have not, as of yet.
PS: Thanks for the kind words about the book.
Bob Tisdale says:
March 27, 2013 at 4:24 pm
phlogiston says: “The oceans generally are characterised by strong vertical temperature stratification, warm water on top, cool water below especially below the thermocline. How then does a “vast amount” of warm water come to be below the surface in the western tropical Pacific? How does this anomalous inverse stratification come about?”
The trade winds push the warm water up against Indonesia and it accumulates there. The sea surface height of the western tropical Pacific is about 0.5 meters higher in the west than in the east as a result.
phlogiston says: “I thought the ocean heating of el Nino was the combined result of interruption of Peruvian upwelling and concommitant weakening of the trades…
A weakening of the trade winds in the western tropical Pacific, not the east, initiates the El Niño.
Gravity causes the warm water to slosh to the east, causing an increase in the volume of the Equatorial Counter Current in the Pacific.
phlogiston says: “ …resulting in strong solar heating of doldrum calm Pacific surface water.”
Downwelling shortwave radiation (sunlight) decreases in the central and eastern tropical Pacific during an El Niño because the convection, cloud cover and precipitation accompany the warm water to the east.
Its interesting whether the 0.5m Pacific sea level difference west-east leaves a signature on length of day.
I understand from your articles on ENSO that el Ninos and cloudy while La Ninas are sunny. However, somehow still the east Pacific surface is warm during el Nino despite the cloud. I accept that this hot water may well have hot-rodded all the way across the Pacific ocean from the west, however I would maintain that Peruvian coast upwelling plays a role in the east Pacific SSTs in both el Nino (less upwelling) and La Nina (more upwelling). I take the equally traditional view that upwelled water is cold. It was you after all who taught me about the Bjerknes feedback. The Peruvian fisherme experience big el Ninos as catastrophic failures of the anchovy fishery due to lack of upwelled nutrients.
@Bob Tisdale: For me to understand the great impact ENSO has had on the natural warming that occurred during the late 20th century, I needed to read your book. You take your time in the book showing and explaining a little bit at a time until finally, it sinks in. It’s so obvious where the heat comes from, but so many things are happening. I really think everyone should read your book. It will help a lot of people get off the fence with regard to who turned on the heat.
The warmists need us to feel like this stuff is confusing and just trust them.