INTRODUCTION
In the post Is Ocean Heat Content Data All It’s Stacked Up to Be?, we discussed and illustrated, for the depths of 0-700 meters, that the NODC’s pentadal ocean heat content had a significantly higher warming trend than the annual data. Refer to the discussions of Figures 5 to 7 under the heading of PENTADAL DATA IS NOT THE SAME AS DATA SMOOTHED WITH A 5-YEAR FILTER. For 0-700 meters, the pentadal data warms at a rate that’s about 19% higher than the annual data. I ended that section of the post with:
It really makes one wonder how strongly the warming rate of the 0-2000 meter data, which relies on much fewer observations below 700 meters, is impacted by the use of “running 5-year composites.”
In this post, we’ll present the same comparisons, but for the depths of 0-2000 meters. Somehow, the pentadal data adds about 36% to the warming trend of global ocean heat content above the warming trend of the annual data for the same depths.
THE ANNUAL DATA (0-2000 METERS) IS NO LONGER AVAILABLE FROM NODC
After preparing the post linked above, I remembered that I had presented the NODC’s quarterly ocean heat content data for the depths of 0-2000 meters in an October 24, 2010 post Introduction to the NODC Ocean Heat Content Data for the Depths of 0-2000 Meters. I still had the quarterly data, which was a good thing, because the NODC removed it as soon as they uploaded the pentadal data. Hopefully other bloggers had downloaded the 0-2000 meter data in annual or quarterly formats prior to its removal and can confirm the results of this post. I did a spot check, and the annual global data for 0-700 meters are the same now as they were in October 2011—with the exception of a minor correction to the 2010 value.
Note: I’m not the only person who has presented the NODC’s ocean heat content data for 0-2000 meters in quarterly or annual formats. It was referred to and plotted by a few bloggers at Skeptical Science. See their post Ocean Heat Poised to Come Back and Haunt Us. It was presented first by blogger JosHag at 20:17 PM on 15 October, 2011 in “Heat Uptake” form (The screen cap here, just in case SkepticalScience elects to delete it.). Then blogger Jsquared at 20:42 PM on 17 October, 2011 presented a comparison of annual Northern Hemisphere and Southern Hemisphere data for 0-700m and 0-2000m. (Screen cap here.)
PENTADAL VERSUS ANNUAL OCEAN HEAT CONTENT FOR 0-2000 METERS
Figure 1 compares the annual global ocean heat data (0-2000 meters) to the same data smoothed with a 5-year running average filter. The trends are basically the same, as one would expect.

Figure 1
Let’s delete the annual data and then compare the 5-year running mean of the annual global data to the pentadal data, Figure 2. Just like magic, based on the linear trends, the pentadal data increases the warming rate by 36%.

Figure 2
That’s an exaggeration of the comparison of the pentadal and annual data for the depths of 0-700 meters, Figure 7, from that previously linked post (here it is again).
CREATING SOMETHING FROM NOTHING
Figure 3 compares the annual global ocean heat content for the depths of 0-700 meters and 0-2000 meters. The warming rate for the depths of 0-2000 meters is about 21% higher than for the 0-700 meters data. But note, the two datasets are extremely similar from 1970 to 2003. There are some minor divergences during that period, but they appear to be warming at the same rate.

Figure 3
We’ll confirm that in Figure 4. The warming rates for the two depths are fundamentally the same for the period of 1970 to 2003. Could this be one of the reasons why the NODC removed the annual and quarterly data for 0-2000 meters?

Figure 4
The absence of warming from 700-2000 meters is consistent with the findings of Mauritzen et al (2012) Importance of density-compensated temperature change for deep North Atlantic Ocean heat uptake (paywalled). Refer to the discussion of that paper in the recent ocean heat content post (here), under the heading of SPEAKING OF STILL-TO-BE-DISCOVERED SUBSURFACE OCEAN PROCESSES.
And now for the comparison of the pentadal global ocean heat content for the depths of 0-700 meters and 0-2000 meters, Figure 5. The warming rate of the pentadal data for the depths of 0-2000 meters is about 36% higher than the data for 0-700 meters (compared to a faster rate of 21% for 0-2000 meters in the annual data, Figure 3).

Figure 5
Recall, there was no difference in the warming rates of the 0-700 meter and 0-2000 meter data in the annual data for the period of 1970 to 2003. Now, with the pentadal data, Figure 6, the 0-2000 meter data warms at a rate that’s 38% higher than the 0-700 meter data. With the pentadal data, the NODC has created ocean heat for the depths of 700-2000 meters during this period where none exists in the annual data.

Figure 6
ANOTHER CURIOSITY
Did you note that the warming rate of the pentadal data for the depths of 0-700 meters (Figure 2) was exactly the same as the trend for the annual data for 0-2000 meters (Figure 5)? Refer to Figure 7. The curves are different, but the trends are the same.

Figure 7
CLOSING
The NODC’s pentadal data at both depths don’t appear to be credible. That’s about as nice as I can phrase that statement.
If I can make a few recommendations to the NODC:
1. Post the annual and quarterly data for the depths of 0-2000 meters and toss the pentadal data. The pentadal data looks contrived—like you’ve tortured your ocean heat content data until it gave you the answer you wanted. It’s a sad thing to say, but that seems to be becoming standard operating procedure for the climate science community.
2. And looking at how well the 0-700 and 0-2000 meter data track from 1970 to 2003, you may want to look again at your climatologies, because the warming rates in recent years appear as though they still may be impacted by the significant increases in sampling with ARGO.
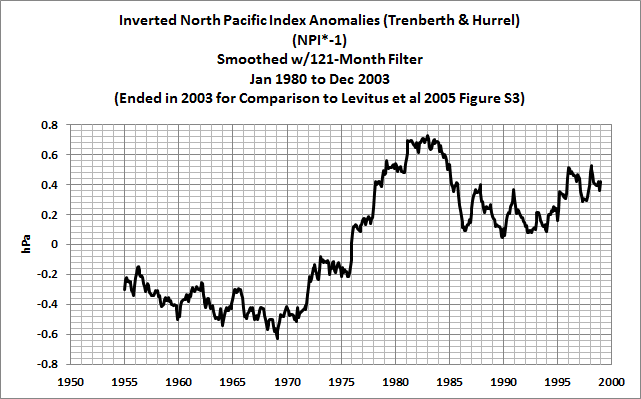
3. And, of course, you really should reexamine the 1970s to 1980s hump. As presented in my recent detailed discussion of ocean heat content data, the hump exists in other data—like sea level pressure. And I believe you’ll find the double “Bactrian camel” hump that appears in the 2005 version of the NODC ocean heat content data for the Indian Ocean is also present in the sea level pressure data of Indian Ocean.
I ‘m curious to see these charts on an annual basis, or even monthly, with no five year running mean. It would give a better picture of when the heat content actually jumps up or goes down in step with ENSO events.
Any Americans want to do a FOIA request about this?
It is good to point this out to the NODC. Climate “scientists” are determined to create graphs that show global warming. As you say, it looks contrived, and the world is getting sick of it.
Thanks for sharing the true facts. Good article, but I have to say that the intent behind the manipulation bothers me. It goes along all too readily with many other similar unsavory tactics from the hardcore group of agw supporters. I have followed this argument for 4.5 years. The increase over the last year in the intensity of the messages being “pushed” through mainstream outlets and by bloggers was easy to see. They must sense that it is do or die time for their theory; and their ability to sway enough of the population to their side may soon fade away.
The real answer to all this nonsense is that physical “heat” from the atmosphere can not enter the ocean it is blocked by surface tension. The only energy to enter the ocean is the sun’s radiation. Grab your wifes hairdryer and try heating water.
I’ve never thought reported ocean heat content was trustworthy, for the fundamental reason that the likelihood of data from activists being reliable is more or less proportional to how much it has to be to not get caught too extremely often, to how readily can it be cross-checked from other independent sources of the same data.
This highlights such sloppiness as to make adjustments blatantly noticeable. At the same time, there is no guarantee even the annual data wasn’t also more cunningly adjusted before, as it is not like there are many different global deep-ocean temperature networks measuring at the thousandth of a degree level to independently verify.
Atmospheric temperature history has closer to a multitude of data sources, in contrast, while worrying more about tenths of a degree than hundredths of a degree or less, making reported trends relatively far more reliable. But that is only relatively so. When even global atmospheric temperature history is known to be heavily fudged in common versions by Hansen’s GISS and the CRU of Climategate despite those relative safeguards, I can only imagine how much more fudging goes on without those limiting factors.
* I doubt many of any total audience really quantitatively realize the following, but, while average annual global ocean surface temperatures vary by tenths of a degree over a few decades, the superficially large heat content figures in joules all come from supposed super-fine measurement of the mere hundredths of a degree (at most) change in average temperature of deeper ocean waters over modern decades. (The first 2000 meters of ocean has astronomical thermal inertia and changes far less than the first meter).
Of course, if temperature trends in such ocean layers were reported in normal temperature terms directly, in degrees Celsius (as in tiny thousandths to hundredths of a degree change), rather than switching to joules to deliberately cloud the matter to the average superficial observer, too many people would inconveniently realize how much such unverifiable reports are almost like debating how many angels can dance on the head of a pin.
For instance, each imagined 1E22 joules may superficially seem large compared to measurement error and easily-done fudging, but it is nothing of the sort in context. Approximating as 3.35E8 km^2 global ocean area (3.35E14 m^2) and neglecting a few shallow ocean areas, the first 2000 meters of seawater is about 6.7E17 m^3, at least 6.9E23 grams, so, considering the specific heat of seawater, at least 2.9E24 J would be required for a 1K temperature rise.
So if deep ocean temperature graphs were not made in a very misleading form (switching to heat content to express in joules to hide the following), each 1E22 J would correspond to about a mere 0.0034 Kelvin, questionable to measure with such precision as a global average even if the originators were true objective scientists instead of their actual nature of being activists flocking to join environmental studies institutions.
But the general public is not supposed to know that (and very few are mathematically literate enough to figure it out), so there is hence the propaganda-suitable usage of joules to indirectly express temperature history as heat content, rather than just temperature history in Kelvin directly as done with everything else.
For instance, CAGW proponents commonly think of oceans warming up to decompose gas hydrates on the bottom seafloor, with fallacies including thinking as if deep ocean temperatures changed by whole degrees in a few decades instead of hundredths of a degree or less over such timeframes.
Next to nobody, aside from a few mathematically literate skeptics, understands just how minisculely little (if practically at all) average deep ocean temperatures ever change on timescales of decades, short of geological eons, and that ignorance is kept maintained by avoiding publication of Kelvin instead of Joule denoted deep ocean temperature graphs.
Thanks Bill.
johnmarshall says: “Thanks Bill”
Bill? Bob says, You’re welcome!
re henry barclay’s comment.
Can anybody show a plot of estimated free co2 against the graph of surface ocean heat content?
Why do some of the data have a hump in the 70’s when the other data have a decrease in temperature? Is this only in the anomaly? Or is it only in the pentadal data?
Quarterly OHC data still available at NODC, looks like the URL changed: 0-700m, 0-2000m.
Annual, too: 0-700m and 0-2000m.
Thanks Bob (or is that Billy-Bob ;).
BTW, Dr. Roy Spencer shows no changes in surface temps over the last 10 years.
http://www.drroyspencer.com/
I guess that deep heat must get there without ever appearing on the surface.
I remember when the Argo data first came out. There was a cooling trend reported. Then, the climate community become abuzz, and soon the data were corrected: a warming trend, then.
I’ve observed the same thing with satellite data and surface temperature data. People correct and adjust and homogenize this data to its death. Yet keep pronouncing it’s living.
In today’s government climate science, the expression:
Never attribute to malice that which is adequately explained by stupidity
has been replaced by:
Never attribute to stupidity that which is adequately explained by malice.
All this goes to William James pragmatism, which says that we can approach truth but never grasp it due to the limitations of our senses and our experiences. Not to exclude imagination.
Those who hold with the Unique Solution Syndrome cannot abide by this pragmatic “truth”. They will work to produce or find or use the NODC data and say it is True. These are the CAGW people: they have seen the light and Know.
Men and women with hammers and the belief they can nail everything to the floor.
Richard M says: “BTW, Dr. Roy Spencer shows no changes in surface temps over the last 10 years.”
And I show similar results with weekly sea surface temperature data, starting in January 2004:
http://bobtisdale.files.wordpress.com/2013/03/16-weekly-global.png
Looks like the’re becoming accustomed to 0.2 deg C. Maybe it’s the “new normal”.
The graph is from the February sea surface temperature update from a few days ago:
http://bobtisdale.wordpress.com/2013/03/11/february-2013-sea-surface-temperature-sst-anomaly-update/
Billy Bob? How’d you know my real name?
Regards
HaroldW says: “Quarterly OHC data still available at NODC, looks like the URL changed: 0-700m, 0-2000m.”
HaroldW, those links are only presenting quarterly data starting in 2005 for me. Are you gettiing data all the way back to 1955?
I hope that someone is making a list of the “AGW” supporters [contrivers], so that when the cooling is upon us we can ostracize them. If you have proven yourself to be a “bad” scientist, do you get another chance??
My simple Pacific Ocean heat model:
1) The North/South Trade Winds at the Equator are caused by heat rising then falling, and the rotation of the Earth.
2) The North/South Trade Winds push the surface water, at the Equator, from South America to Indonesia. This can be confirmed [now that we have satellites measuring ocean surface height] by the 2 foot Indonesian “bubble”.
3) The warm Indonesian waters then move North/South, via currents both deep and surface.
4) These warm waters move toward the Poles.
5) As the waters cool nearer the Poles, they down-well and eventually up-well at South America creating the El Nino/ La Nina.
The Ocean surface heat is driven by the Sun. Now that the Sun is “quiet”, expect the “warm Indonesian waters to cool [not being warmed]”. The North/South currents will still flow, but will be cooler, eventually cooling the North/South Pacific.
To determine the temperature of the Pacific at depth, measure the up-welling at South America. Of course, the up-welling temperature oscillates, but the average [over many years] should be a depth temperature indication.
Bill_W: Refer to Levitus et al (2009). They explained their reasons for eliminating the hump in it:
ftp://ftp.nodc.noaa.gov/pub/data.nodc/woa/PUBLICATIONS/grlheat08.pdf
I also dicussed the deletion of the hump in my last ocean heat content post: http://bobtisdale.wordpress.com/2013/03/11/is-ocean-heat-content-data-all-its-stacked-up-to-be/
Regards
tony nordberg says: “re henry barclay’s comment. Can anybody show a plot of estimated free co2 against the graph of surface ocean heat content?”
Tony, any agreement or disagreement in the curves is happenstance. Downward longwave radiation (infrared radiation) only penetrates the top few millimeters of the ocean surface and that’s where the oceans release heat through evaporation.
Bob,
Are you getting data all the way back to 1955?
On the NODC site, I see the 0-700m files as going back to 1955 for both quarterly and annual.
The 0-2000m files only go back to 2005.
The only comparable file I could find on my computer was the 0-700 one (and the figures matched except for a couple of minor differences), so that seemed fine.
I didn’t have any old 0-2000m file to compare against.
Bill_W: Short answer. The hump exists in the earlier data. Climate models couldn’t reproduce the hump, so they looked for and found an excuse to delete the hump.
HaroldW: Thanks for confirming that for 0-2000 meters you’re only getting quarterly and annual data back to 2005. There was a time (October 2011) when the quarterly and annual data extended all the way back to 1955. They deleted it from those 0-2000 meter webpageswhen they released the pentadal data.
Thanks.
robert barclay says:
March 14, 2013 at 1:36 am
The real answer to all this nonsense is that physical “heat” from the atmosphere can not enter the ocean it is blocked by surface tension. The only energy to enter the ocean is the sun’s radiation. Grab your wifes hairdryer and try heating water.
Which means that any increase is down to increased radiation?
Does the sea convert all radiation to heat whatever the wavelength?
Is that why light dosen’t penetrate very far because it turns to heat?
I’ve just found (in the other therad in discussion about ocean) this:
Phobos:
>> REPLY: “All chemical compounds have an acidity…”
Anthony:
> Congratulations! You win the “Stupid Comment of the Week” award.
> (…) Note where seawater is, pH is ~8 or basic.
> No matter how you slice it, it is still above 8.0, and well above 7.0 and NOT ACIDIC.
… and I see that what Anthony is writing is ridiculous.
It’s absolutely correct to say “ammonium hydroxide [NH4OH] is more acidic than sodium hydroxide [NaOH] even though both of them are bases (so none of them is an acid).
Identically it’s absolutely correct to say “Betty’s hair is darker than Merry’s even though both of them are blondes (so hair of none of them is dark).
Merc writes “Identically it’s absolutely correct to say “Betty’s hair is darker than Merry’s even though both of them are blondes (so hair of none of them is dark).”
Is it correct to say that Mary at 7 months pregnant is more pregnant than Nancy who is only 4 months pregnant? Not all states can be cast into shades of grey.
@TimTheToolMan
“Not all states can be cast into shades of grey.”
But acidity definitely could. It’s an indicator of amount of H+ ions the substance contains, as long as it contains more H+ (or similar like H3O+) ions than OH- (or similar) ions it’s called an acid, if it contains less H+ ions than OH- ions it’s called a base. But bases still contain H+ ions just the stronger base is the lower amount of H+ ions it contains (and higher OH-). Acidity is definitely not a discrete state.
Bob Tisdale, thanks for the comment. What I am getting at is whether there is any correlation between ocean heat content increase and CO2 outgassing .. which might be a component of the the steady rise reported by Scripps, as the workings of Henry’s law.
Bob,
I’m shocked that, in the run up to the deadline for AR5, new OHC has suddenly been found where none was before. Conveniently, just in time for the deadline and not enough time for disection or comment. Why it’s almost as though one can jump from unknown Phd candidate to fully tenured Prof if only one can help out with ‘the IPCC process’.
We need the MWP to dissapear again – done
We need confirmation of that bullshit hockey stick we used years ago – done
We need a upward trend in OHC where none existed yesterday. – done
AR5 – Done
AR5 (the ‘scence section’) will concentrate on Paleo and Play Station. They have no real world data to work with unless someone can turn sh*t into Gold (ARGO into trend). Flexibility in the data set is the core of ‘climate science’.
1254108338.txt (CG1) Flexibility of climate ‘data’ in the face of political pressure. Neither of them ever suggested that, as ‘Scientists’, they should deal with the data as is. Just a list of knock on effects should they ‘go for it’. Funnily enough the ‘1940s blip’ has now dissapeared – just co-incidence you understand
Now we have the same thing done to ARGO. I’m shocked. ‘Real’ Scientists wouldn’t lie and cheat would they?
tony nordberg says: “Bob Tisdale, thanks for the comment. What I am getting at is whether there is any correlation between ocean heat content increase and CO2 outgassing .. which might be a component of the the steady rise reported by Scripps, as the workings of Henry’s law.”
I’ve never seen it discussed with ocean heat content, but there are numerous discussions of outgassing versus sea surface temperature, primarily in response to ENSO events. Example:
http://www.pmel.noaa.gov/pubs/outstand/feel1868/text.shtml
Regards
Realclimate I conducted a debate with Gavin Schmidt on Realclimate in May 2012. The gist is this:
The jumps in the OHC charts published 1993-2009 (Trenberth 2010) and Lyman composite shown OHC gain in the period 2001-03 of about 7E22 Joules. This is a rate of about 350E20 Joules/year.
Trenberth’s 0.9W/sq.m TOA imbalance equates to 145E20 Joules/year. This is taken from Hansen’s modeled number of 0.85+/- W/sq.m from 2005. To get a 350E20 Joule/year increase in OHC, the TOA imbalance must have leapt from 0.9 to 2.4W/sq.m in the period 2001-2003. Satellite measurement (CERES and others) show NO such change in that period.
The period 2001-03 does coincide with XBT to Argo transition and the full deployment of 3500 Argo floats – so the conclusion if the satellites are right, is that the step jump in OHC for 2001-03 shown on the charts is an artifact of the transition, and the greater deployment of Argo since 2003 shows much flatter OHC increase.
Not only is the step jump bogus and should be removed from the charts, but it increases the linear trend slope nearer to Hansen’s 0.6W/sq.m, when the indicated number should be closer to 0.25W/sq.m – again nowhere near Trenberth and Hansen’s original 0.9W/sq.m which is still espoused by Trenberth who is still looking for the missing heat below 2000m. A link to some other interesting discussion can be provided.
THE NODC ANNUAL DATA (0-2000 METERS) is a National Secret covered by National Intelligence, Dept. of Justice and White House Secrecy rules. [snip . . we don’t like talk of killing here, not even in jest . . mod]
This is really great! So informative. It really pays to know all about this. Thanks for sharing!
@kenlambert, there were not 3500 Argo floats deployed in 2003. You overexaggerate.
I never said that 3500 Argo floats were deployed in 2003. In fact there were 773 in April 2003 and this rose to about 3000 in 2007, and 3500 since. Read my paragraph again “and the greater deployment of Argo since 2003 shows much flatter OHC increase”.