From the Nature abhors a vacuum department comes this note from RealScience showing that Arctic sea ice has made a stunning rebound since the record low recorded in the late summer of 2012.
With a few weeks of growth still to occur, the Arctic has blown away the previous record for ice gain this winter. This is only the third winter in history when more than 10 million km² of new ice has formed.
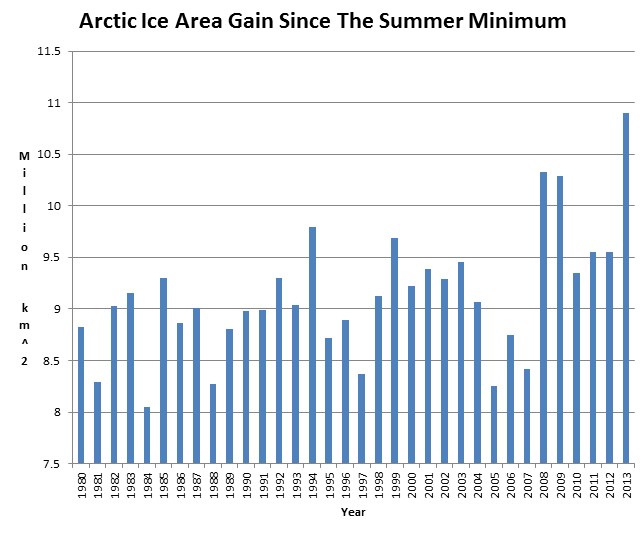
Source data: arctic.atmos.uiuc.edu/cryosphere/timeseries.anom.1979-2008
Of course, this is only a record for the satellite era data back to about 1980, and just like the much ballyhooed record low of 2012, we have no hard data to tell us if this has happened before or not.
Here’s the current Cryosphere Today plot, note the steep rebound right after the summer minimum, something also noted in Sea Ice News Volume 3 Number 14 – Arctic refreeze fastest ever:
![seaice.recent.arctic[1]](http://wattsupwiththat.files.wordpress.com/2013/02/seaice-recent-arctic1.png?resize=640%2C520) Source: Cryosphere Today – Arctic Climate Research at the University of Illinois
Source: Cryosphere Today – Arctic Climate Research at the University of IllinoisThe Arctic ocean is well filled with ice right now:
![cryo_latest[1]](http://wattsupwiththat.files.wordpress.com/2013/02/cryo_latest1.jpg?resize=640%2C640)
Source: Cryosphere Today – Arctic Climate Research at the University of Illinois
In other news, the Antarctic seems to be continuing on its slow and steady rise, and is now approaching 450 days of uninterrupted above normal ice area according to this data: arctic.atmos.uiuc.edu/cryosphere/timeseries.south.anom.1979-2008…which shows the last time the Antarctic sea ice was below normal was 2011.8932 or 11/22/2011.
![seaice.recent.antarctic[1]](http://wattsupwiththat.files.wordpress.com/2013/02/seaice-recent-antarctic1.png?resize=640%2C520)
This continued growth of ice in the Arctic Antarctic make the arguments for ice mass loss in Antarctica rather hard to believe, something also backed up by ICESAT data.
As always, you can see all the sea ice data at the WUWT Sea Ice Reference Page.
Perhaps the ice is flowing from Antarctica into the Southern Ocean 😛
Please; this is merely an attempt to be clever with statistics. If we keep seeing record gains since the summer minimum, why do we keep seeing lower minimums and lower yearly averages?
The hotter it is, the more ice we get. Don’t be a denier of basic physics. It’s like reverse condensation, like a refrigerator makes it hot in the room, a counter-intuitive thing certainly that is beyond the intellect of dumb deniers.
“If present trends continue, the world will be about four degrees colder for the global mean temperature in 1990, but eleven degrees colder by the year 2000…This is about twice what it would take to put us in an ice age.” -Kenneth E.F. Watt, Earth Day 1970
“Telltale signs are everywhere (regarding the coming of the next Ice Age) from the unexpected persistence and thickness of pack ice in the waters around Iceland to the southward migration of a warmth-loving creature like the armadillo from the Midwest. Since the 1940s the mean global temperature has dropped about 2.7° F.” -Climatologist George J. Kukla of Columbia U in Time Mag, 1974. http://www.time.com/time/printout/0,8816,944914,00.html
yep, no surprises there. The “catastrophic accelerating melting” ended in 2007 !
http://oi49.tinypic.com/xudsy.jpg
@Phobos
Isn’t “record” ice melt, temperatures, etc etc just an attempt at being clever with statistics anyway, especially when you consider all this “unprecedented” stuff has happened before
Eric Simpson – What did Fran and Ollie say?
Don’t get too excited. It just means there will be more first-year ice to melt next year.
The weather pattern in the US over the next few weeks will make many folks think they live in the arctic 😉
Also notable is snow cover. Earth may be moving into a different mode, something unseen during recorded history. One frightening second order effect is drought. Here in CA, with the true nature of negative PDO (and maybe some even longer term modulation in force) is really setting in. Our failure to invest in water storage and delivery infrastructure over the past 40 years is really going to be a hard lesson.
An excellent choice of metaphors Anthony. I understood it to mean “the mind wants to know”.
Presumably the record rate of ice growth is a consequence of global warming and is therefore something we should worry about, just like we are supposed to do when the ice is melting.
I know it’s new growth and unlikely to survive too well in the summer, but the rapid growth is encouraging (for the debate) as it shows the artic is feeling this cold as well.
Isn’t a bigger than normal recovery just spin on a lower than normal minimum?
Phobos says:
Please; this is merely an attempt to be clever with statistics. If we keep seeing record gains since the summer minimum, why do we keep seeing lower minimums and lower yearly averages?
No. It’s counter propaganda. If alarmists expect us all to wet ourselves everytime there’s an ice minumum in September, we should also be looking at the speed of recovery.
The annual ice minumum jamboree is like saying OMG it was dark last night a midnight, if the “trend” continues it will soon be dark 24 hours per day!
As my plot above showed, if you use ALL the data rather than just one day per year you start to get some understanding of what is happening.
http://oi49.tinypic.com/xudsy.jpg
And, yes, there is less ice now than 30 years ago, that means a lot of it is thin ice, so there will be a larger loss AND gain cycle each year.
It is blattently obvious from my plot that there is a strong cycle of 5.4 years.
There is also a strong linkage with Atlantic SST , which we know to have a strong 60 year cycle.
http://oi46.tinypic.com/r7uets.jpg
The “statistical trick” is the alarmist hugh and cry every year whilst ignore the clear signals seem by looking at the whole year and not just one day.
“Phobos says:
February 12, 2013 at 11:31 am
Please; this is merely an attempt to be clever with statistics.”
No just the inconvenient fact that, for some of the year at least, the Artic Sea Ice remains stubbornly high.
The sign of a well regulated system?
I see what you are doing, but why bother. Stooping to their low standards is easy but meaningless. Maximum and minimum have meaning, averages are just folk doing sums.
Phobos says:
February 12, 2013 at 11:31 am
“Please; this is merely an attempt to be clever with statistics. If we keep seeing record gains since the summer minimum, why do we keep seeing lower minimums and lower yearly averages?”
So record (of the last 30 years) lower minimums and record lower yearly averages are YOUR facts, but record gains are merely an attempt to be clever with statistics?? If you know the answer please tell us the WHY?
I am not a scientist, nor did I stay in a Holiday Inn last night, but Manhattan Island was under a few thousand feet of ice about 20K years ago. One could presume it melted because the earth has warmed, and has been warming almost continually for the last 20K years, not just the last 200 years.
But since you apparently know better, so please enlighten us.
Thanks and have a sparkling day…
I have to say that there is nothing very surprising in this.
Given that the temperature at the North Pole is around 40 below, it follows that large areas around there will have temperatures well below zero in mid winter. Ergo, the ice will reform in most places.
Perhaps the issues which will become more important in time are the areas with thickness greater than 1m, 1.5m and 2m??
Has anyone started looking at that yet, or is the data still too young for any meaningful analysis to be made?
Maybe this needs to be classified as one of the many small shifts at the margin of cooling climate from turning points and declines in ocean cycles and solar grand minimum. There are bound to be a lot of subtle shifts in this turn.
I have to join the “not impressed” crowd. You would expect a record rise following a record drop. Didn’t the previous record rise in 2008 follow a previous record low? Drop a ball farther and it will bounce higher. Ice melts and and ice forms. It’s warmer now, it was cooler then. It might get cooler again, or not — give it time. Here is my prediction – if the minimum ice level later this year returns to more “average” levels, we will see a corresponding drop in the recovery come next spring!
The thing to remember about Arctic sea ice loss is that – contrary to every generalization in the CAGW alarmist “doctrine” – reducing Arctic sea ice extents, at the time of their minimum extents in Mid-September near the equinox, means MORE heat loss from the Arctic waters! (That is, you can calculate more heat loss from the Arctic waters above 80 north latitude by radiation, evaporation, conduction and convection heat transfer when the sea ice is removed from those latitudes, than you gain from the increased solar heat that is absorbed into the newly exposed but “darker” Arctic waters.
Thus, LOSING 2 million square kilometers of sea ice in mid-September from the Arctic COOLS the Arctic, and – as Judith Curry reports – INCREASES the probability of increased land-side snow and ice accumulation in the next months!
On the other hand, down south at the edge of the Antarctic sea extents of 15.5 million sq kilometers – in a latitude band of 62 south to 63 south – INCREASING Antarctic sea ice extents DOES reflect more solar energy than the open water formerly exposed to the sunlight, and thus ALSO COOLS the southern seas around Antarctica!
This is because at 62 to 63 south latitudes, the sun is much higher in the sky at the equinox and so spreads out less than in the Arctic at the same day-of-year, has much less attenuation in the atmosphere during every hour-of-the-day as penetrates that less distance, and the water it hits has a much smaller albedo at those higher solar incidence angles.
Um, will the BBC report this remarkable rebound? Ha ha ha…..
Having said that, low sea ice in summer, big sea ice in the Arctic in Winter – so what – that’s winter in the NH.
Anecdotally speaking, here at 52′ N in dear old Blighty – winters are getting colder and man made emissions are nowt to do with it – its a cyclical thing and we are on the down slope, in the Alps the snow cover – is coming again and some Russian observers are talking about a real return to winters cold…..
http://notrickszone.com/2013/02/10/new-peer-reviewed-study-shows-climate-trend-reversal-in-swiss-alps-now-cooling-since-2000/
Why do alarmists persist in trying to have it both ways? If ice melts, it’s due to CAGW. If ice grows, it’s due to CAGW. Is it supposed to be one or the other, or maybe both at once, or does it takes turns? What triggers that? Again and again, they sound like they don’t know, but persist in being certain it’s CAGW.
Just when DO these guys question the meme? Oh, of course, they don’t – because if they did, they’d instantly stop being alarmists. Maybe they are too terrified of that possibility to dare question anything. Poor sods.
Phobos says:
take a look at global sea ice and you will see we are at either near normal or at record high levels I mean if you people are going to speak of this on a global level then look at it as a global level and don’t leave out the things that could ruin your propaganda.
Hmmm…Did Mann tweet anybody to confirm this is record? Guess not.
Does the DMI and NSIRDC consider the Hudson Bay, Denmark Straits, and Bering Sea and North Sea “part” of the Arctic sea ice extents in all of the sea ice page charts?
I wonder what it would take to ice over the GUIK gap? And how that would affect the Arctic vortex? I watched the wind fields this winter as Hudson Bay iced over. Once it iced over, this allowed much colder air to form and stabilize over Canada. I imagine that full ice cover over much of the GIUK gap would do the same thing. The Arctic would have a much larger reservoir of cold air to push around – and this would intensify the cooling of the mid-latitudes due to MPHs?
Has anyone plugged something like this into the current weather forecasting models to see what pops out?
Is this a tipping point?
@MangoChutney says:
“…all this “unprecedented” stuff has happened before.”
When? Not since 1900 http://www.arctic.noaa.gov/images/ice_extent.gif
“..we have no hard data to tell us if this has happened before or not.”
Have you tried the US Naval Oceanographic Office (formerly US Naval Hydrographic Office)? They likely have historical arctic sea ice extents dating long before satellite data was available. In the American Practical Navigator (1966), it mentions USNHO publication of monthly charts showing the average extent of various degrees of navigability in the northern and southern hemispheres throughout the year. Figure 3609 page 754 is an example.
An interesting observation for a 1966 publication, “There is evidence to indicate that the polar regions are becomming warmer. Nearly all the glaciers are receding; the ice shelves of the northern Canada and Greenland are breaking up; shipping off the Siberian has become possible; cod are found farther north along the Greenland coast.”
@PaulID says “take a look at global sea ice and you will see we are at either near normal or at record high levels.”
You mean this week? So what??? Were u asleep last september? Or sept 2007?
@RACookPE1978 — if you think losing arctic summer ice cools the artic, show the proof. rss and UAH both show a warming arctic LT.
A good reminder that claims of “lake effect type snow” in the northern hemisphere are bogus at least since January.
Um…the greater the area of open water at the summer minimum (~Sept 15), the greater the recovery once the sun goes down, which would start on Sept 21 at the North Pole. More than anything, this graphic is an illustration of summer ice loss, as the entire Arctic Ocean re-freezes every winter. There are declines in maximum extent driven at the southern margins (mainly), but, in general, the more that is lost in the summer, the more that is gained in polar night.
This appears to have eaten my previous comment–
Um…this graphic is really a proxy for maximum summer ice loss. The more that is lost at the northern margin the more that is gained in polar night. After all, the entire Arctic Ocean refreezes every winter (and will until the cows come home). Declines in maximum ice extent are driven at the southern margins in the Atlantic and Pacific. So the big gain after this summer’s lows, thanks to the refreezing of the Arctic Ocean is hardly surprising.
Phobos says:
February 12, 2013 at 12:39 pm
@MangoChutney says:
“…all this “unprecedented” stuff has happened before.”
When? Not since 1900 http://www.arctic.noaa.gov/images/ice_extent.gif
#########################################################
It’s too bad NOAA doesn’t include error bars on that graph. Ice extent data prior to the satellite era is iffy at best and the data prior to WWII is little better than pure speculation.
1. check volume.
2. check sat views of the condition of this ice.
3. go figure, lots of open water, lots of H20 given up to the atmosphere to fall in the NH in as snow in massive quantities.
4. faster ice buildup, but thinner and weaker than in the past.
2013 fall.. start predicting now
Anthony: We are aware that there was a bad storm that broke up the Arctic Sea Ice between 4th-9th Aug last year.
Question: Do we know the ice extent in the days leading up to the storm?…..if so how did it compare with previous years?
Thanks,
James
Phobos says:
February 12, 2013 at 12:44 pm
I was very specific in my statement, and in the LIMITS of that statement: “You” are the one extending it to the “Arctic” as a whole, and to the “summer months” as a a long period of time!
I said above, and will repeat – at the of MINIMUM Arctic Sea ice extents – at the LATITUDE of the EDGE of the Arctic sea ice at its MINIMUM sea ice extents, losing an additional 2 million sq kilometers of sea ice increases net heat loss from the Arctic Ocean.
You asked about temperature records: The only records that exist for that latitude show exactly the trend I mentioned: And, in fact, they do show that the daily DMI Arctic air temperature record for 80 north latitude shows NO warming since records began in 1959 during the summer months (the only time when direct solar radiation “might” be affected by increasing CO2 levels), but rather, the summer air temperatures at 80 north latitude have steadily DECREASED over the past 15 years as sea ice extents near 80 north have decreased – just as the calculations show they should.
Both Hansen’s NASA-GISS and the RSS/UAH “warming Arctic” reports are for the CENTRAL CANADIAN TUNDRA and forests around Great Slave Lake and the Hudson Bay at 60 degrees latitude! – NOT the Arctic Ocean sea ice edge between 72 degrees north and 80 north latitudes. You are trying to extrapolate NASA’s central Canadian temperature -which HAS increased due to the much lower albedo of 18 to 28% greater forest, bush, grass, and tundra growth as CO2 increased the past 60 years – 1800 kilometers north across the Arctic Ocean where the only temperature record that does exist shows cooling! Look again at Hansen’s “red blanket” of his supposed Arctic warming: the “blip” that is the station he is extrapolating from is in the middle of the “greenest” depths of the Arctic.
Look again at what I wrote about the increasing Antarctic sea ice extents: At THAT LATITUDE of the Antarctic Sea Ice Maximums, sea ice DOES reflect more solar energy and the net heat balance DOES cool the ocean. But this effect does NOT at the edge of the sea ice in the Arctic Ocean. Were there apprciable sea ice in the Arctic at 62 north in mid_September, losing sea ice would increase the heat gain. But there is NO Arctic sea ice that far south in September, hence the “problem” (crisis ?) of Arctic Sea Ice amplification does not – and cannot – exist.
Except in the minds of the CAGW theists.
Phobos says:
February 12, 2013 at 12:44 pm
@RACookPE1978 — if you think losing arctic summer ice cools the artic, show the proof. rss and UAH both show a warming arctic LT.
############################################################################
Likely a result of the open arctic water shedding heat to the atmosphere. The oceans have a much higher thermal mass than the atmosphere. There isn’t enough energy in the atmosphere for the atmosphere to drive ocean temps.
Sea surface temps for the arctic during the summers would be interesting to look at. It’s too bad ARGO doesn’t cover the arctic.
Phobos,
your chart conflicting with historic evidence
From 1957:
“Northpole ice has decreased by something as 40% in volume…this has been going on for 30-40 years”
Also predicting no ice in year 2000 if trend continues
http://i680.photobucket.com/albums/vv161/Radiant_2009/popularmechanics1957-2.jpg
From 1947
“The Arctic is melting says scientist”
http://trove.nla.gov.au/ndp/del/article/22429983?searchTerm=climate%20change&searchLimits=
From 1922
“The changing Arctic”
“The Arctic seems to be warming up…all point to a radical change in climatic conditions
http://docs.lib.noaa.gov/rescue/mwr/050/mwr-050-11-0589a.pdf
Various more references here:
http://www.real-science.com/new-giss-data-set-heating-arctic
Matt says:
February 12, 2013 at 1:03 pm
From the sea ice reference page, look at the very, very small standard deviation for the 50+ years of DMI temperature data since 1959. Day-to-day variations over the entire period are less than 1/4 of one degree!
Plot the summertime temperatures (winters do show a large change from day to day!) and you’ll see the declining daily temperatures at 80 north I mentioned.
At time of minimum Arctic sea ice extents, the Arctic sea ice is now varying between 7 million km square and 4 million km square: this corresponds to a “beanie” over the Arctic from the Pole down to [76.5] degrees latitude (at 7 million km sea ice).
Today, with a 3 million km square sea ice cap, the southern edge of the sea ice is right at 81 north latitude. [At 4 million km square sea ice, the southern edge is at 79.8 latitude.]
But.. but… but…. it’s a death spiral! A tipping point. Irreversible catastrophe. Ice-free Arctic will be the new normal. These are the alarms we have been inundated with – how dare you actually look at raw data?
Presumably (for what it’s worth) the new ice is not yet covered with black-carbon aerosols, the previous accumulations having been rinsed into the ocean.
After AMO, black carbon is the main driver of arctic sea ice and northern hemisphere glacier melt:
Reasons:
1. Bond et al 2012 landmark study doubled black carbon forcing to 1.1 W/m2
2. Surface effect on snow and ice average is 0.13 W/m2, but is much stronger on northern hemisphere multi year ice due to accumulated pollution. Multi year ice melt is central to glacier and sea ice variation.
3. James Hansen: “BC on snow warms the planet about three times more than an equal forcing of CO2″
4. P.K. Quinn: :Black carbon emissions from northern Eurasia, North America, and Asia have the greatest absolute impact on Arctic warming.”
5. However, black carbon emissions actually occurring within the Arctic (such as hords of NGOs and climate scientists travelling the arctic) have a disproportionately larger impact per particle on Arctic warming than emissions originating elsewhere.
http://en.wikipedia.org/wiki/Black_carbon
Forcing estimate black carbon on multi year ice > 3 W/m2
http://judithcurry.com/2013/02/08/open-thread-weekend-8/#comment-293710
You couldn’t add that this is to be expected because of the record melt?
Phobos
The USS Skate surfaced at or near the north pole several times during the summer of 1958. There are photos that show the Skate in open water and other pools of open water in the area. In the 1930’s, the British navy was reporting the rapid reduction in Arctic sea ice. Then in the 60’s & 70’s, the projection was we were heading into another Ide Age. There are natural cycles that produce temperature changes on decade, Millenia and longer time periods. Only looking at the past 30 years of data is like reading the last page of a book and believing you know the whole story.
Remember, the Arctic and Antarctic were ice free all the time some 3.5-4 million years ago before the formation of the Ismus of Panama blocked a deep ocean current and started the glaciation cycles. Geologist believe that Earth has come close to complete glaciation twice: 600 million and 2.4 billion years ago. CO2 concentration changes are a lagging indicator of Earth’s temperature swings, they are not a forcing, no matter what the CAGW crowd says!
Bill
And you can probably add 10% to the ice extent simply because, with an CAGW bias, there is room in the data to choose from a band of data. It is like IPCC and temp – they are not going to underestimate; they are going to choose the highest “sensitivity” they can get away with.
I can only assume this post is some sort of post-ironic joke. Of course the entire Arctic basin is going to refreeze every winter. Nobody expects anything else, at least for a good few decades yet. The only reason the area of new ice formed is a new record is that there was so much open water to start with! You’re just measuring last year’s summer minimum another way, and spinning it as a gain!
In re vacuum; There is no such thing as a vacuum, only very low pressure. Mean free path and molecules per cm^3 in interstellar space are >10^4 km and 1 cm^-1 (@STP are 66 nm and 2.5 x 10^19 cm^-3).
Even in intergalactic space, volume density of matter is not zero. Then there is ‘vacuum energy’.
I used a thousand cubic foot thermos of LN2 with a small diffusion pump to maintain ~0.1 Torr, ten orders of magnitude higher pressure than on the Moon.
Phobos says:
February 12, 2013 at 11:31 am
“Please; this is merely an attempt to be clever with statistics. If we keep seeing record gains since the summer minimum, why do we keep seeing lower minimums and lower yearly averages?”
Probably because the melting is caused by sooty ice. The ice melts, the soot sinks into the ocean then the fresh freeze starts off relatively clean. The more the ice lost in the summer the more sea area left to refreeze.
@ Mosher
1. check volume.
2. check sat views of the condition of this ice.
3. go figure, lots of open water, lots of H20 given up to the atmosphere to fall in the NH in as snow in massive quantities.
4. faster ice buildup, but thinner and weaker than in the past.
Ahh but ice takes a lot of energy just to melt. So it seems logical that lots of new ice would slow old ice melt. And then there is all that NH snow with high albedo AND high night time long wave emission for even more cooling. Looks down hill for temps to me.
Sad thing is the recovery record can’t get topped once all ice has gone in a future September.
Looks to me like the Arctic -0.694 million sq/km anomaly and the Antarctic +0.676 million sq/km anomaly cancel each other out and the world sea ice coverage anomaly is almost right at 0 (normal). Do Warmists take into consideration the amount of solar energy that the extra Antarctic ice is reflecting?
Naturally the ice gain is great considering the low starting point. Consider this: if aliens removed all Arctic ice in September, then the resultant “gain” to February would be record-setting for sure. But don’t get me wrong, I think yearly ice will trend upwards, and at the moment the “cold attack” on Svalbard is interesting as the ice closes up to the north of there.
Phobos says:
@RACookPE1978 — if you think losing arctic summer ice cools the artic, show the proof. rss and UAH both show a warming arctic LT.
You ask for proof but then ignore it when I show you some. Maybe looking at rate of change to see how fast things are changing and in what direction was a too complicated for you.
Take another look. (Hint : below zero means ice loss ; above zero means ice gain).
http://oi49.tinypic.com/xudsy.jpg
Now see the relation to warmer Altantic:
http://oi46.tinypic.com/r7uets.jpg
When N. Atl warmed there was accelerating ice loss. Reason for rightful concern.
At the end of 30 warming half of 60 y cycle N. Atl is warmer. But note, Arctic ice has stabalised.
No, I did not say recovered, I said stabalised, The melting has returned to it’s early oscillatory pattern about zero. No longer in accelerated melting.
Reason for joy to anyone pretending to be concerned about the fact it was melting before.
Oddly, those who pretend to be concerned about the melting now seem to refuse to accept the fact it has stopped rather than rejoicing an dheaving a sigh of relief.
What I don’t like about many of the sea ice charts is that they do not show the full range of events, only a mean for one time period or another and statistical measures of variance. The plots were you see all the years plotted together — though difficult to follow (especially by people who never did well with math, science &/or graphing — is how different each year can be from the several preceding and subsequent years.
Because it shows the complexity and wide variability, I believe this is a much better chart: http://www.ijis.iarc.uaf.edu/seaice/extent/AMSRE_Sea_Ice_Extent_L.png
I don’t about Nature Boy and what he hates,but this
Boy hates a vacuum.In fact my Wife wears out three
every year. A few years back my Wife and her sister
went on a trip to TX and CA to visit their brothers.
When they were gone about four days my daughter called
to ask about her mother. I said it has been nice here,
no vacuum for five days! Then I said, think of your poor
mother,no vacuum for five days! I’ll bet when she checks
into a motel, she runs to the house cleaning dept. and
pays them to let her vacuum the halls. ]; )
Alfred
Oh, I forgot the point you asked about, Phobos , [the] proof.
Seeing that the rate of change has returned to oscillate around zero, despite the warmer seas, shows that the fact that you asked for proof of: means that something is acting as a negative feedback.
Unless you have a better idea , I’d guess that it may be the open water allowing evaporation and emitting IR out into to space. Neither of which happens to any significant degree from ice and snow.
Marcos says:
February 12, 2013 at 1:57 pm
Not true: You are comparing – not apples to oranges – but reindeer to walruses.
The Antarctic sea ice (today’s values) is occurring in the Antarctic summer, at the latitude where solar exposure is 18 to 24 hours per day, at very high solar incidence levels (and thus at very low atmosphere reduction) , near the time of year of the MAXIMUM solar radiation exposure at top of atmosphere (just under 1415 watts/meter sq).
On the other hand, the Arctic sea ice “under” area is occurring at areas where solar exposure – if it exists at all – is less than 5 degrees over the horizon (even at noon) and for periods of the year when solar exposure is between zero and 2 hours per day!
Thus, there is “no” solar gain into the Arctic ocean, but a maximum of the sun’s (potentially absorbed) solar radiation that is being reflected back into space.
result?
A substantial NET cooling of the world, even if both sea ice extent areas were even, and even if the net sea ice showed “zero” losses or gains.
Hint: Ask some CAGW theist what the actual solar incident angles are for today’s sea ice at 10:00 am, 12:00, and 2:00 pm are at the edge of both sea ice areas. Ask what the air mass is for those six times.
“But it is thin ice!” It would be nice to compare the ice thickness image with this time last (saith the lazy man).
My take on RACookPE1978’s argument with which I agree is thus.
If reduced arctic sea ice at the minimum results in increased heat uptake by the arctic ocean AND that heat energy stays in the Arctic, THEN the the freezing of the Arctic is an indicator that the heat energy has all been dissipated by various NEGATIVE feedback mechanisms.
Anthony,
After a post like this, do you still want us to take your scepticism serioulsy?
Mjk
So many complaining. Jeesh!
Thanks Anthony for the post, this may be important news in the longer run.
This should also show a near-time record loss of heat to space up north. Don’t forget all that above normal heat-of-fusion that has already left, or is in the process of leaving this planet, as that much ice re-froze. Some notice that the ice sheet shows a degree or two above the mean but that is what ejects that released heat-of-fusion outward. We should see it’s effect later. Cooler summers ahead? Interesting times.
Wow, imagine how big the bounce back will be when we have no Arctic sea ice in summer.
Steven Mosher states, “go figure, lots of open water, lots of H20 given up to the atmosphere to fall in the NH in as snow in massive quantities.”
If you are referring to lots of open equatorial water whose attendant moisture laden air travels poleward, I agree with you, but it appears we are talking about different areas. Not certain. Your point is puzzling.
Reblogged this on ksrm92 and commented:
and I thought global warming was consuming us!
As my little ol granma used to say, they don’t make satellites like they used to. 🙂
It is amazing how homeostasis kicks in. The ‘Larmists have to latch onto arctic sea ice as their “evidence” that the earth is continuing to warm, even though that ship has sailed, and even though, much to their consternation, they’ve never been able to find a human fingerprint on what was only a moderate, and wholly benign warming.
Phobos ,
I’m not sure what the following means for albedo but let’s wait and see.
http://earthobservatory.nasa.gov/Features/ArcticReflector/
http://earthobservatory.nasa.gov/Features/ArcticReflector/arctic_reflector4.php
Also take a look at the effects of soot in the Arctic from Dr. James Hansen of NASA
http://pubs.giss.nasa.gov/abs/ha08900n.html
Also look at storm ‘wreaked havoc on the Arctic sea ice cover’ according to NASA.
http://wattsupwiththat.com/2012/09/24/nasa-on-arctic-sea-ice-record-low-storm-wreaked-havoc-on-the-arctic-sea-ice-cover/
Also take a look at – Arctic little warming since 1979
http://pielkeclimatesci.wordpress.com/2012/09/21/arctic-lower-tropospheric-temperature-trends-since-1979/
Also take a look at the historic Arctic ice variations
http://noconsensus.wordpress.com/2009/06/16/historic-variation-in-arctic-ice-tony-b/
Phobos,
How sure are you that the minimum Arctic sea ice extent is caused by air temperature?
A chart of gains since the summer minimum? What kind of chart is that? One designed to sell a story a bit more impressive than it really is? Lets not fall into the AGW chartaganda trap. We shouldn’t be impressed by a record gain after a records loss.
Ice levels are about normal for this time of year, relative to the last decade. Ice levels are lower than the 1990’s and lower than the 1980’s. And the 80’s had more ice than the 90’s. Exactly what we might expect with temps declining until 78 and increasing till 98 and holding flat since.
What I have noticed about WUWT, compared to say Real Climate, is that Real Climate’s moderators and Gavin respond a lot more that here on WUWT. It seems to me that WUWT mostly leaves commenters to deal with Warmists. I may be wrong, just my perception.
I have had comments snipped at Real Climate in the past and I told Gavin that he should leave my comments in and let his commenters deal with me. He never did. Just a thought.
[Yes, that is the policy: Mod’s do not, as a rule, offer comments (neither amplifications nor corrections) on specific statements. Mod]
Phobos says:
February 12, 2013 at 11:31 am
Please; this is merely an attempt to be clever with statistics. If we keep seeing record gains since the summer minimum, why do we keep seeing lower minimums and lower yearly averages?
Priceless, Phobos is an apt name. The point is these, “records” are meaningless either way and this “record” shows exactly that !
Its utter hubris, the satellite “record” only goes back to 1980 !
You may recall history when Roald Armundsum sailed the ice free Nth West passage in, I think 1903 or thereabouts and the Canadian Navy also did so in two summers in WWII.
So methinks that you are not acknowledging that the earth is not in some bizarre climatic “steady state” and so are alarmed by any divergence from a world of abstract averages, then scream alarm and implying weather events are homocentric in origin.
Like the basis of AGW alarmism, it’s as rational as the ancients, seeking and seeing portent and human origin in any uncommon natural event.
The biggest factor in the summer extent appears to be the spring/early summer winds. Last year they consistently blew ice towards the warm, open north Atlantic. That meant the extent would be low. So far this winter the winds have been more circumpolar. That is good for retaining ice however it’s still to early to be important. Watch the winds starting around the mid march. That will be key to this years minimum.
The other key factor is the AMO. It will a few years before it goes negative again. Don’t look for a complete recovery until that happens.
A faster refreeze is an indicator of declining sea ice minimums. It complements that trend.
The sun sets on the polar summer at the same time each year bringing on below-freezing conditions for the reforming of sea ice until March. If sea ice minimums continue to get smaller over the years, there will be a greater area of open water to freeze over. The refreeze may start a little bit later if the Arctic is warming, but that won’t be enough to prevent ice reformation, and as temps drop rapidly after the sun sets on Arctic summer, the rate of refreeze will increase roughly in proportion to the greater area of open water that can be refrozen. Record-breaking recovery will be most likely in the 6 months following record-breaking minimums. This is expected, not anomalous.
“This continued growth of ice in the Arctic make the arguments for ice mass loss in Antarctica rather hard to believe”
What does the reformation of Arctic sea ice this year have to do with Antarctic land ice mass balance over a number of years? Different hemispheres, different local dynamics, different periods for each case. What is being implied?
The fact is; the whole Arctic basin is covered in sea-ice, accumulated over a period of time that can be considered an extreme event. It isn’t climate, if this happens regularly at some point in time there is going to be more sea ice build up than sea ice loss.
After the July 2012 workshop on ICESAT data, some on that team (Zwally, Bromwich, Yi) co-authored a paper employing more data (published November 2012) on Greenland/Antarctic mass balance for the period 1992 to 2011. For that period, and for all sub-periods within, Antarctic mass balance showed an overall loss.
http://xa.yimg.com/kq/groups/18383638/836588054/name/Science-2012-Shepherd-1183-9.pdf
It’s much too soon to know if this increase is of any significance.
Last year, from late Feb to early May, the extent was comfortably in ’90s territory.
Look how that turned out.
http://www.ijis.iarc.uaf.edu/seaice/extent/Sea_Ice_Extent_L.png
One thing I noticed is that the maxima and minima seem to shift to a few weeks later in the year. The NOREX chart has the Maxima around Mar 11 for 1979 thru 2006, and more recent years seem to be first week in April. Anybody know why this is happening?
[snip – policy violation, language – mod]
barry says:
February 12, 2013 at 7:23 pm
“bla bla bla”
For some reason 2011 to 2012 both northern and southern hemispheres had a one point above normal sea ice.
Darn, I’m trying to remember who predicted this would get posted exactly.
Anyway, just another prediction that alarmists got right. Unlike arctic sea ice — they keep getting that one wrong; it’s significantly lower than predicted.
Ok, question. The CO2 absorption band is below the visible light from the sun. Then, wouldn’t reflected light not be absorbed by the CO2, hence a lower effect on the air temp? If true, then shouldn’t you see an increase in air temps as the ice melts exposing open water (and more IR being released) continuing through the winter months? Seems like you should see a shift in the peak of the air temps in the arctic as the summer ice decreases assuming CO2 is involved. Maybe too many other factors?
So they were worse than we expected…?
[Snip. You can be insulting of WUWT on your own thinly-trafficked blog. But here you need to be polite, or one of the mods will snip your entire nasty comment. — mod.]
So which radiates more LWIR EM radiation; the frozen ice or the open water, which is very near black body like.
So the water is going to cool much more than normal during the longer open water phase, so when the Temperature of the air drops, the water wll freeze much quicker.
Overall, an open arctic ocean will cool the planet more than an ice covered ocean will.
It is conjectured, that all that cold water and ice in the arctic has something to do with the fact that there is not much solar energy density up there, to warm things up.
[snip]
You do realise that the Arctic sea-ice area annual maximum is decreasing? The increase in area gained each freezing season is simply because the annual minimum is decreasing at a faster rate.
If you weren’t all a bunch of logic-bending denier misfits trying to hide the truth you would also plot the Arctic Sea Ice Area Loss Since Maximum (multiplied by -1 to use the same axes), which would show higher numbers, and also an increasing trend.
You don’t do that, because it would be an inconvenient truth for you guys.
numerobis, I’m pretty sure you saw that prediction on Dr Inferno’s blog.
Phobos says:
February 12, 2013 at 11:31 am
Please; this is merely an attempt to be clever with statistics. If we keep seeing record gains since the summer minimum, why do we keep seeing lower minimums and lower yearly averages?
If you reference any sine wave value and compare it to the maximum and minimum respectively then it will always be lower and that is precisely why we always see warming and low ice levels.
The whole climate science field displays an almost staggering inability to look at underlying patterns in the way anyone trained in electronics and data interception rather than climate science would do.
Clearly even to a casual look the anomaly is heavily dependent on sudden spikes of higher temperatures which have resulted in drop outs in the amount of ice, overlying a cyclic trend.
Looking at the NASA sea anomaly temperature data in AMSRE_SSTAn_M-MOD_LSTAD_M these drop outs in the ice coverage occur at the same times we see huge localised and by climate change theory utterly inexplicable localised hot spots. These hot spots to any non climate science trained observer would be attributed to volcanic activity at a first guess. The information would have driven these untrained individuals to ask for further information as to whether any evidence of hot gas sources were to be found and since even with no direct funding several articles are available these amateurs would suggest a research project to find if the ones discovered by chance were isolated cases.. Sadly it has however not even stirred climate scientists to question their beliefs the CO2 is the driver.
Even the use of anomaly shows little or no understanding of pattern analysis on the part of climate scientists. Comparing the average of a sine wave always produces an anomaly even on a steady state sine wave and comparing an average not equal to the duration of that sine wave gives a built in error depending which part of the cycle is chosen as the start time.
Nearly 11 million square km of ice formed? Gosh! Sea levels must have dropped hundreds of feet! (sarc.)
RE: misfratz says:
February 12, 2013 at 10:53 pm
And are you aware that the level of arctic and sub-arctic snow-cover set a record (for the short period these records (along with sea-ice records,) have been kept.) ???
If you weren’t a “logic-bending denier misfit trying to hide the truth” you would also plot the effect snow-cover has on albedo.
After all, albedo is what you are so frightened by, Right?
While you are at it, you would calculate the abedo of the southern hemisphere, where sea ice is increasing. You would notice that sea ice down under is much closer to the equator, and therefore has a greater effect on your precious albedo. In fact right now, at the low point in southern hemispehere sea ice levels, there is ice at a latitude of 60 degrees. That is like having sea ice nudging northern Scotland in August.
Put that in your pipe and smoke it.
BBC article online today. http://www.bbc.co.uk/news/science-environment-21437680 I must admit it seems logical to me that if Summer ice gets lower each year, but refreezes each winter due to temps being consistently below freezing, a record refreeze is bound to happen. It’s not good news in that sense, what would be good news is if the record low level of ice did not occur, so that the vast amount amount of refreeze did not take place. In that sense a record low expansion of ice would be good news.
I think that this graph shows it best. http://ocean.dmi.dk/arctic/plots/icecover/icecover_current.png
This shows that for this time of year the ice cover is the highest it has been for the whole of this record. i.e. since 2005!
Gareth Phillips says:
February 13, 2013 at 2:31 am
Precisely. I though I was missing something here. It’s obvious that if you get a record low summer minimum – there’s a good chance of a record freezeback. Note from the above graph that the previous 2 highest refreeze rates occurred in 2008 and 2009 following low summer minima. The trouble is the ice is likely to be fairly thin and will be vulnerable during the melt season.
numerobis says:
February 12, 2013 at 8:17 pm
Anyway, just another prediction that alarmists got right. Unlike arctic sea ice — they keep getting that one wrong; it’s significantly lower than predicted.
Thank you for pointing out yet another failure of climate models. The reason the get it wrong is they aren’t looking at the important factors. The Arctic sea ice is driven by winds and the PDO/AMO. If they had simulated the Earth properly they would have a much better chance of getting things like this right.
So, since they keep getting almost everything wrong in their simulations I assume you are calling them out everywhere asking why anyone believes a single projection they make.
Ice has a much higher albedo than open water, reflecting, rather than absorbing, sunlight. The Arctic has warmed much more rapidly than the globe over the satellite period, and has continued to warm while global temperatures have experienced a hiatus over the last decade or so, while this period has seen the greatest trend in reduced ice cover. That would seem to indicate that exposed-ocean cooling does not outweigh or much offset the warming from reduced albedo.
In the meantime, the BBC’s Science Correspondent, Jonathan Amos, has the following startling headline on the BBC’s website today:
‘Cryosat spots Arctic sea-ice loss IN THE AUTUMN…’ (my capitals)
This is what passes for ‘news’ at the BBC – expect a headline anytime soon which states: ‘The King is dead’…
I’ve got a better headline for them: ‘All satellites agree that Arctic sea ice has recovered to a completely average value for the time of year..’
No, I know they won’t use it…!
Steven Mosher says:
February 12, 2013 at 12:59 pm
1. check volume. I think the ice freezes down as well as out, hence an extra 2 million sq miles of surface extant will mean thicker ice [more volume ] in the less peripheral areas. The comments last year of a large extent meaning thinner ice is meaningless as every year the ice that forms last is always thin ice and will always melt quickly.
2. check sat views of the condition of this ice. Satellite views of the topography, show nothing of the depth[volume] of the ice [your first point]. So pick one or the other but not both as they contradict each other. I understand the ice looks unusual but I doubt surface appearance has a graphic to say it will break up faster.
4. faster ice build up, but thinner and weaker than in the past. So how far and fast does it have to build up before it becomes thicker and stronger? According to this logic if it builds up by say 13,000,000 sq miles it will be extremely thin .and weak and if it did not build up at all it would be extremely thick and strong. Logic would seem to dictate that the more ice that forms, the less likely warming is. Could you give a ballpark figure where you would say your current view is misguided
2013 fall.. start predicting now I have already made a prediction that the global sea ice would break through to the positive side [at Lucia’s] and Tallboys[not published]. I also feel the Arctic could still reach the positive side this year which it nearly did last year. so what would it take , 1 positive year, 5 positive years or 17 positive years.
Finally, I actually appreciate your comments and preparedness to interact on this and other sites
If you look at climate4you and the ocean page and the arctic ocean regions (east Greenland sea, west Svalbaard sea, Barents sea) there is no evidence of arctic ocean warming. In fact since 2006 there has been cooling. In these arctic ocean regions the phenomenon of the 8-year jump is particularly visible. Ocean heat appears to move forward in 8 year jumps. This is visible worldwide and has been largely ignored by the climate research community (some-one tell me if I’m wrong).
The ENSO as Willis Essenbach points out is a heat pump which pumps warm Pacific equatorial water toward the poles. Thus the warm water left over from the period of mid 1970’s – 2005 dominated by el Nino events, wil continue to wash toward the poles for some years, so Arctic ice extent might continue to drop for a few years.
Since 2007 there has been an abrupt increase in summer-winter range of sea ice. This is explainable as the combination of 2 things:
1. Air temperatures in the arctic cool as atmospheric climate starts its current down-swing
2. Warm water continues to wash into the Arctic as a legacy of the recent few el-Nino dominated decades.
Warm water flowing into a cooling Arctic produces the observed jump in magnitude of oscillation between deeper summer lows with faster recovery and robust ice and snow in winter. Note that this warm inflow is not necessarily enough to show up as warmer Arctic OHC overall, but does cause summer ice loss. This jump up in oscillation magnitude occurring sharply in 2007 is a marker of a phase shift.
John Finn says:
February 13, 2013 at 3:05 am
“The trouble is the ice is likely to be fairly thin and will be vulnerable during the melt season.”
The only problem with that thought is that Ice thickness seems to be fine also (and still the largest at current date since 2005).
http://www7320.nrlssc.navy.mil/hycomARC/navo/arcticictnowcast.gif
http://ocean.dmi.dk/arctic/plots/icecover/icecover_current.png
Here’s my prediction–when the summer sea ice extent finally goes to 1% or less (99% melted) we will see a record refreezing during the winter. After that, any changes in the summer minimum or amount of refreezing during winter will be negligible.
The record gains are a result of the record losses … one would expect that the more ice we lose in the summer the more is going to freeze in the winter!
“…this is merely an attempt to be clever with statistics.”
I’m curious. Would you describe Keith Briffa’s Yamal reconstructions in the same way? I certainly would. The later into the 20th century he got, the fewer trees he used in his plots, until one single tree core was providing about 1/2 of his hockey stick warming projection.
Most people are just interested in honesty and reality.It’s easy to mislead and to propagandize using “clever statistics.” Fortunately, though, our laws and traditions realize where the greater danger lies, and so we tolerate that some will spin and mislead and lie in their political speech.
That sea ice extent has crossed into the realm of being a political football for alarmists and activists, is beyond dispute. People have a right to mislead us, and claim that this is unequivocally due to human CO2 emissions, when they know no such thing.
But still, in the long run, I believe misrepresenting reality, spinning objective data, and even intentional lying (with or without using statistics) is bad policy. Because being too clever can fool the body politic into thinking a correlation is causal when it isn’t, or that the physics of some complex systems has been accurately described when it hasn’t, or that activists parading around as “experts” know more than an ignorant person about what will happen in the future, when they don’t. When the body politic is fooled in these ways, it might waste money and resources, both directly and through lost opportunity costs. It might surrender power to activists who want to dominate them politically, and lose some freedoms in the process.
And the only way I know of debunking such charlatanism is to design experiments that predict, observe and attempt to falsify theory, and then, if successful, to replicate, replicate, replicate (which implies archiving raw data, maintaining detailed records of methods, sharing data freely, and explaining adjustments and simplifications fully, etc, etc). This is a slow method, often times, it’s inconclusive. Activists hate that, because they can’t immediately get what they want, politically.
I could also talk about propagandizing by using “clever” statements about outputs from General Circulation Models (GCMs), but I trust you’ll get the point without additional verbiage.
I tend to see sea ice as more like this http://i46.tinypic.com/2ezgzk5.png
The ‘static’ value is around ~90KmSq with ‘central’ values occuring at ~21st May and ~14th Dec with small deviations year on year.
Sorry. Should be
I tend to see sea ice as more like this http://i46.tinypic.com/2ezgzk5.png
The ‘static’ value is around ~9KmSq with ‘central’ values occuring at ~21st May and ~14th Dec with small deviations year on year.
Richard LH says:
February 13, 2013 at 2:51 am
I think that this graph shows it best. http://ocean.dmi.dk/arctic/plots/icecover/icecover_current.png
This shows that for this time of year the ice cover is the highest it has been for the whole of this record. i.e. since 2005!
########
They reduced the data set for readibility.
Here you get the whole Sat data /since 1978).
2013 February: by far less than previous values.
Sorry. Should be
I tend to see sea ice as more like this http://i46.tinypic.com/2ezgzk5.png
The ‘static’ value is around ~9 MilKmSq with ‘central’ values occuring at ~21st May and ~14th Dec with small deviations year on year.
MFKBoulder says:
Your comment is awaiting moderation.
February 13, 2013 at 7:15 am
Richard LH says:
February 13, 2013 at 2:51 am
I think that this graph shows it best. http://ocean.dmi.dk/arctic/plots/icecover/icecover_current.png
This shows that for this time of year the ice cover is the highest it has been for the whole of this record. i.e. since 2005!
########
They reduced the data set for readibility.
Here you get the whole Sat data /since 1979).
2013 February: by far less than previous values.
Missed the link
http://arctic.atmos.uiuc.edu/cryosphere/arctic.sea.ice.interactive.html
and corrected the Year. please delete previous post, Thx
UAH trend for Arctic ocean temps from 2006 to December 2012 is 0.43C per decade. At almost half a degree C, how can that possibly be construed as cooling?
http://vortex.nsstc.uah.edu/public/msu/t2lt/uahncdc.lt
I doubt the trend is statistically significant, but there’s no way you could say that indicates a cooling trend.
While global trends have slowed for the last 15 years or so, the Arctic ocean trend since 1998 is 0.84C/decade. arctic sea ice decline is strong for this period. Hypothesised ocean cooling from exposed waters due to receding ice has no basis in the temperature record.
BillD, I can see the headline now: “Arctic ice melt stopped, say skeptics”, if we reach the point where there’s no more ice to melt. There’s always a favorable way to spin it, if you try hard enough.
This is all part of AGW – Anthropogenic Global Weirding. First the ice grows, then it shrinks, then it’s sort of normal for a while just to get you to lower your guard, then BAM!
This on the BBC News web site
http://www.bbc.co.uk/news/science-environment-21437680
Mike Jowsey says:
February 12, 2013 at 1:20 pm
But.. but… but…. it’s a death spiral! A tipping point. Irreversible catastrophe. Ice-free Arctic will be the new normal. These are the alarms we have been inundated with – how dare you actually look at raw data?
Perhaps if you looked at the raw data you’d see that that’s exactly what’s happening? The raw data indicates a substantially sea ice-free Arctic in a few years, when that happens we’ll doubtless break the current ‘record’ for regrowth in the following winter! This spring we will have more first year ice than last year (because we’ve had a ‘record’ regrowth). FYI is thinner than older ice because the thickness is controlled by heat loss through the ice, it’s also very fractured which doesn’t bode well for its survival next summer, I’d expect an even lower minimum next fall.
MFKBoulder says:
February 13, 2013 at 7:21 am
“They reduced the data set for readibility.
Here you get the whole Sat data /since 1979).
2013 February: by far less than previous values.”
Which still show that this is the highest value at this time of year since 2005. My comment implied that it was higher outside of that time range as you correctly observe.
http://i46.tinypic.com/2ezgzk5.png
peter laux says:
February 12, 2013 at 5:08 pm
Phobos says:
February 12, 2013 at 11:31 am
Please; this is merely an attempt to be clever with statistics. If we keep seeing record gains since the summer minimum, why do we keep seeing lower minimums and lower yearly averages?
Priceless, Phobos is an apt name. The point is these, “records” are meaningless either way and this “record” shows exactly that !
Its utter hubris, the satellite “record” only goes back to 1980 !
You may recall history when Roald Armundsum sailed the ice free Nth West passage in, I think 1903 or thereabouts
Indeed, I even have a copy of his description of his journey, strangely he was more concerned about being trapped in ice and never mentioned sailing in an ‘ice free NW Passage’, he did talk about sending a recon party the summer before his departure from Gjoa Havn, they used sleds and walked!
and the Canadian Navy also did so in two summers in WWII.
No they did it once, nowadays multiple boats make the trip every year.
phlogiston says:
February 13, 2013 at 5:39 am
…
Warm water flowing into a cooling Arctic produces the observed jump in magnitude of oscillation between deeper summer lows with faster recovery and robust ice and snow in winter. Note that this warm inflow is not necessarily enough to show up as warmer Arctic OHC overall, but does cause summer ice loss. This jump up in oscillation magnitude occurring sharply in 2007 is a marker of a phase shift.
I meant oscillation amplitude rather than magnitude.
This post is very… special. Summer ice area is declining. Winter ice area is declining more. Ergo, the difference between winter area and summer area is getting larger. I think budding young scientists a little way into their teens could understand that this does not mean there is “continued growth of ice in the Arctic”, but I suppose Anthony Watts is a little too old to learn now.
REPLY: Actually. That was a typo where it said “Arctic” in a paragraph about the “Antarctic”, but I guess you are too old to spot those things. Fixed now. Anthony
Pat K,
What is it about this chart that you cannot understand? Admit it, you didn’t even read the article, did you?
• • •
Phil. says:
“The raw data indicates a substantially sea ice-free Arctic in a few years…”
We can only hope that the Arctic becomes ice-free year round. It won’t happen, of course. But if it did there would be many benefits, and no downside.
Wow. This is an ultra classic WUWT thread … Even freakin’ Pat Michaels is calling bupkiss on this one.
@John@EF. Show where he calls “bupkiss”. He says “hardly surprising”. I don’t disagree. This is a news collection, showing things of interest. I found it interesting, Tough noogies if others don’t.
The main point though is this:
Of course, this is only a record for the satellite era data back to about 1980, and just like the much ballyhooed record low of 2012, we have no hard data to tell us if this has happened before or not.
Can you show that the big loss and regrowth has happened before? I can’t, I’m suspecting you can’t, and neither can science with no hard data. Point is we simply don’t know and 30 years of data isn’t but a tiny snapshot of the history of the Arctic.
Yet there’s lots of wailing about it as if there is significance to that 30 years.
Eric Simpson says: “It’s like reverse condensation, like a refrigerator makes it hot in the room, a counter-intuitive thing certainly that is beyond the intellect of dumb deniers.”
I’m shocked no one bit on this. Feeding a troll, perhaps. But I just gotta! This is a statement even a child could swat down. A refrigerator makes it hot in the room? Yeah, duh, it’s consuming a large amount of energy, by way of electricity, and excreting that energy in the form of heat – directly into your kitchen. And I’m curious. Is there really such a term as “reverse condensation,” outside of “The Great Soviet Encyclopedia,” that is.
Gotta love comments that include abusive language. The messenger shoots himself. I suppose there was no need for me to “reverse condensate” that comment. Still, I laughed out loud when I read it. WUWT provides a platform for some great entertainment along with the great debates.
george e. smith says:
February 12, 2013 at 10:18 pm
Your observation is correct – but it is a surprising complex heat transfer comparison. One, I am not too surprised to note, is one that no CAGW theist bothers to do. Rather, they “lock in” on the assumptions similar to one a university class in global warming saw in their mid-term exam: There, the “professor” required that: top-of-atmosphere average radiation levels be used for ice and water radiation comparisons (as if both were at the equator, above any atmospheric absorption!), to compare average albedo and using an incorrect equation for radiated energy! No wonder Phil (of a comparable .edu training) and others like Perlwitz and Barry are confused with the results of real calculations.
Look at the actual data for single area of Arctic Ocean water at 80 north latitude on September 21 – right at the period of minimum Arctic sea ice. We are at the equinox, that piece of water will see 12 hours of sunlight, sees 12 hours of near-total darkness. But that is only a very, very small part of the story. In open water, the water’s heat will be absorbed from the sun’s direct and indirection radiation for only12 hours, but will be lost via evaporation, radiation to the 265 K (-8 C) atmosphere, and forced conduction (from winds) to that same sub-freezing atmosphere for 24 hours.
According to the NOAA’s website, solar incidence angles will vary from .9 (at 06:00) to 10 degrees (at 12:00) and back to 0.27 (at 18:00). Air masses will vary from 25 to 6.5 and back to 29. (Look at the year and the equation of time to see why these are not exactly symmetrical about 12:00 noon.) Direct radiation from the sun will vary from 6 watts (at sunrise) up to 70 watts (wow!) and then go back to 4 watts at sunset, but will only be absorbed by a measured rough-water albedo of 0.30 to 0.48 at those very low angles.
Indirect radiation is even less than direct radiation (varying by the hour from 5 watts at sunrise to 18 watts (at noon) and then going back down to 4 watts), but will be absorbed by the “classic” open-ocean albedo of 0.07. 93% of 18 watts is … not much however: 16.74 watts absorbed at noon. Less at every other hour between 6:00 and 18:00.
But open Arctic water loses heat … A LOT of heat that area of ice covered water does not. (Assume a DMI average air temperature of -10 degrees on Sept 21 or 263 K. Arctic water temperature is 4 degrees or 277 K. then do the calculations.)
Heat is lost from the open Arctic water by radiation, evaporation, and forced convection. In every condition, more energy is lost from open Arctic water than from ice-covered water. Further, in every condition at this date, more energy is lost from from both open water or ice-covered water than can be absorbed from the sun.
At certain days of the year at certain latitudes, open Arctic water might absorb more energy than can be absorbed by ice-covered waters. Further, at some of these latitudes, more energy might even be absorbed than is lost by increased radiation, convection, and evaporation losses from open Arctic waters. This effect is, after all, the fundamental case – the only case actually! – for the CAGW religious zealotry about proclaiming/fearing a catastrophic “positive Arctic amplification” from melting Arctic sea ice.
But they have yet to show (by calculation) which days of the year at which latitudes they can actually show a “positive Arctic amplification” actually occurs.
A cynical and unforgivably cynical abuse of the statistics. Surely misleading articles like this verge on fraudulent. They certainly represent an immoral exploitation of data post-record low ice in 2012
“Arctic sea ice extent for January 2013 was well below average, largely due to extensive open water in the Barents Sea and near Svalbard”
Anthony Watts is ultimately a stooge of no consequence.
If this was in his mind a genuine post, he suffers from unbelievably extreme confirmation bias.
REPLY: Dear Mr. Wilkinson, thanks for your comment. Please, be as upset as you wish with my compliments. In the meantime, as I referenced in the story, you can see all the soothing other graphics here. – Anthony.
I would not be so happy to see the decrease in ice in the Arctic and the increase in Ice in the Antarctic, aka the bipolar seesaw. It has implications the Climastrologists are missing:
Ohter links:
Raw PDF: http://wattsupwiththat.files.wordpress.com/2012/10/cp-8-1473-2012.pdf
Highlignted PDF: http://wattsupwiththat.files.wordpress.com/2012/10/cp-8-1473-2012-hlt.pdf
WUWT discussion: http://wattsupwiththat.com/2012/10/02/can-we-predict-the-duration-of-an-interglacial/
Anthony is right about the reference. What we have in space is a dynamic ether ,not a vacuum, full of virtual and real particles and cosmic rays, quantum processes winking in and out of reality in fractions of nanoseconds. Nature abhors a vacuum but it sure loves the dynamic ether of space or there wouldn’t be so much of it!
@DavidG I found it humorous how this post got so many people wound up, if not for the “vacuum” quote, for the fact that the doomers can’t stand to see anything that shows sea ice rebounding in any way. I get the distinct impression they are all rooting for the ice to disappear for the sole reason of being able to scream “See we were right!”. They’d be dismayed if this all turns out to be a cyclic ocean currents event, or soot driven, rather than one driven by CO2.
It’s all entertainment, especially Tamino and his holier than thou machinations. – Anthony
Folks that are wailing and gnashing teeth here might like this story I just posted: http://wp.me/p7y4l-kHA
barry says:
February 13, 2013 at 7:36 am
If you look at climate4you and the ocean page and the arctic ocean regions (east Greenland sea, west Svalbaard sea, Barents sea) there is no evidence of arctic ocean warming. In fact since 2006 there has been cooling.
UAH trend for Arctic ocean temps from 2006 to December 2012 is 0.43C per decade. At almost half a degree C, how can that possibly be construed as cooling?
The point of my argument was that warm water from recent el Ninos is still washing into the Arctic. OK a climate4you figure suggested slight recent Arctic cooling. But if instead there is slight warming, as indicated by Bob Tisdale:
http://bobtisdale.files.wordpress.com/2013/02/13-arctic.png
then this only strengthens my argument. I’ll re-iterate is – warm water flowing into a cooling Arctic gives a big increase in summer-winter oscillation amplitude, clearly shown in this figure.
If you’re interested in ocean temperatures here’s an Jan 2013 update from Bob Tisdale:
http://bobtisdale.wordpress.com/2013/02/11/january-2013-sea-surface-temperature-sst-anomaly-update/
Most ocean basins including the Pacific, which according to AGW skeptics is bigger than the Arctic ocean, have cooled since 2006.
@AnthonyWatts
People aren’t wound up because of the Arctic sea ice rebound, but because they/we read your post as if you were saying that the rebound was evidence against AGW. (This is certainly how some of your commenters will interpret the rebound, at least).
As the ice rebound is obviously not evidence against AGW, you’d look pretty stupid under that interpretation of your post. Do you expect people not to get wound up when you post something that might be interpreted as massively stupid?
@Windchaser,
As is typical of the alarmist crowd, you have it exactly backward: declining Arctic ice is not evidence of AGW. In fact, there are no empirical measurements of AGW, which is simply a conjecture.
To use your own words, you look pretty stupid if you are interpreting declining Arctic ice as being caused by AGW. There is simply no scientific evidence supporting that nutty belief.
RACookPE1978,
If exposed-ocean cooling has a significant impact, why aren’t we seeing cooling of the sea surface in the Arctic? The skin temperature of the Arctic ocean (satellites measure the radiance of the ocean skin, as opposed to vertical kilometers of atmospheric radiance over land) has warmed significantly over the period sea ice has declined most rapidly. This indicates a stronger influence from albedo loss – or some other factor. Whatever the factor is, loss of heat from exposed sea surface as sea ice has declined is completely overwhelmed by it.
phlogiston,
Yes, it seemed that you were saying two different things – that the Arctic ocean surface had been cooling since 2006, yet “the warm water left over from the period of mid 1970′s – 2005 dominated by el Nino events, wil continue to wash toward the poles for some years, so Arctic ice extent might continue to drop for a few years.”
I see no evidence for ENSO influencing sea surface temps on the Arctic ocean. The pacific has the narrowest corridor to the Arctic of all the oceans. But more significantly, ENSO is an oscillating system of ~3-year phases. There is no reason to think it is a driver of multi-decadal temperatures. And the Pacific Ocean itself has warmed much less that the Arctic Ocean over the last 3 decades, so something else is providing the extra heat up there.
But if you are correct, that simply reinforces my original point in a different way. The hypothesised effect of radiation loss from ocean exposed by sea ice decline is too insignificant to overcome heat gain from other sources.
RACookPE1978,
The Arctic has warmed more rapidly than the whole globe over at least the last 3 decades. I can’t say that this resoundingly demonstrates Arctic amplification, but in simple terms it is a strong piece of evidence.
The amplification effect is meant to become evident in long-term temperature changes (multi-decadal climate phenomenon). You appear to be asking if it can be shown in weather data (days).
barry,
You are conflating a regional climate with the global climate. And there is no “amplification effect”. If there were, then the Antarctic would be affected, too. But as we see, it isn’t.
You’re probably thinking of Gareth Renowden at Hot Topic:
Fosters Open Mind has some comments about this here at WUWT that Lubos Motl makes hilarious fun about. Try to comment but Open Mind seem pretty closed.
D.B Stealy,
The amplification effect is purported to be extra heat gain mainly from lowered albedo sea ice loss and declining ice and snow cover on land. As the Antarctic ice sheet surface area and sea ice extent has changed very little over the satellite period (slight increase in sea ice), we should expect no extra warming there. Indeed, according to UAH, temps have dropped ever so slightly for the satellite period, even as sea ice has slightly increased. This is nominal evidence for the amplification effect (in reverse), but the changes are way too small to attribute the postulated phenomenon there.
In simple terms, the Arctic has warmed much faster than the globe over the satellite period. Arctic sea ice cover has declined significantly over the same period. These facts lend support to the notion of Arctic amplification.
@D.B. Stealey,
Regardless of whether the decline is evidence for AGW, it’s pretty clear that the rebound is not evidence against AGW. That’s all I’m saying, and it’s this position that people are giving Watts grief for. I’m unclear on whether this is actually Watts position or not.
But since you brought it up, as Arctic ice decline is predicted by AGW, the observed decline most certainly is evidence for AGW. In the same way, you might say that finding a motive for a murder suspect is evidence that he’s the murderer. It doesn’t rule out other causes (other suspects), but it’s a piece of evidence.
Any time a hypothesis passes a test that would have falsified or weakened it, you can call that evidence for the hypothesis.
So, it’s perfectly reasonable to say that the sea ice decline is caused by AGW + other factors. AFAIK, the relative contributions of different factors are still rather uncertain, as they’re hard to accurately model or measure. We’ll know more as the measurements and models improve.
Windchaser says:
“…Arctic ice decline is predicted by AGW…”
Not really. Polar ice decline was the prediction. You cannot cherry-pick half a prediction, and then claim the prediction was accurate.
Same argument covers barry’s polar amplification prediction. There are two poles; only one has any [putative] ‘amplification’. A half-right prediction fails, because it is also half-wrong.
D.B. Stealey says:
February 13, 2013 at 5:58 pm (replying to)
Windchaser says:
“…Arctic ice decline is predicted by AGW…”
Well, actually, both ends of his “arctic amplification” theory are wrong: In the Arctic, losing more sea ice at 76-80 north (even if you assume 2 degrees warmer air temperatures 1200 km south of the ice might cause ice loss while summertime air temperatures at 80 north where the actual ice actually is present remain steady!) in August and September will cause greater cooling of the Arctic Ocean.
On the other hand, in the Antarctic, gaining more sea ice at latitudes 63, 62, or 60 south will cause more reflection of the sun’s heat and cause …. more cooling.
And, as Gail pointed out far above, such counter cycles of increasing heat loss at opposite poles are likely the specific trigger of the next ice age.
Not really. Polar ice decline was the prediction. You cannot cherry-pick half a prediction, and then claim the prediction was accurate.
Link? Everything I’d heard predicted Arctic melt much faster than Antarctic melt, mostly because of the difference in ocean currents and where the ice sits (land vs. water).
Here’s an interview with Judith Curry, basically saying the same thing:
http://blog.chron.com/sciguy/2010/08/judith-curry-on-antarctic-sea-ice-climategate-and-skeptics/
Sea ice can melt from both above and below, either heating from the ocean below or the atmosphere above. In the case of the Arctic most of the melting is driven from the warmer atmosphere above. In the Antarctic most of the melting has been driven from the ocean below. …
At some point does this result in a net loss of ice rather than gains?
What happens in the 21st century projections is that the global warming signal begins to dominate. We still have the freshening of the upper ocean, but the upper ocean is getting warmer because of a warmer atmosphere. And the precipitation starts to fall more as rain than snow. Rain falling on ice speeds the melting from above.
Could you provide a citation to support your claim that the models predicted Antarctic melting by now?
Uh, the interviewer’s question is in bold, in case that wasn’t clear. Judith’s comments are the italics.
PS for the admins: a “preview comment” feature would be wonderfully useful.
Polar ice decline is what we’re seeing.
MacDonald is wrong again.
But thanx for playing.
That’s only sea ice, your terms of reference were “polar ice” and, as I understand it, “You cannot cherry-pick half a prediction, and then claim the prediction was accurate.“
MacDonald, you make it too easy: Arctic ice is both sea ice and Polar ice.
But thanx for playing.
Not all polar ice is sea ice, by excluding the ice shelves you are cherry picking; the very thing you would upbraid others for.
MacDonald is clearly fixated on me and feels a compulsion to nitpick every comment I make, but he is getting too boring doing it over and over again. Kevin needs to run along back to RealClimate, or to whatever thinly-trafficked blog he hangs out at, head-nodding with a handful of like-minded climate alarmists without a clue.
Every time I put MacDonald in his place, which is obviously simple as anyone can see, he responds like a puppy biting at my ankles. Sad to be such a fixated nobody — but I guess someone has to fill that niche. It’s a perfect role for MacDonald, no? He’s very good at it.
You can’t justify your cherry pick, hence this tragic ad hom. Accept it, both the Arctic and Antarctic regions are in negative ice mass balance.
The are two points in the year where the ice cover is changing much, much less than it is occuring during the rest of the year. http://i46.tinypic.com/2ezgzk5.png
These points appear to show the ‘natural’ balence that underlies current Arctic conditions are more complex than just looking for Max or Min or the delta between them.
barry says:
February 13, 2013 at 4:04 pm
phlogiston,
The point of my argument was that warm water from recent el Ninos is still washing into the Arctic.
Yes, it seemed that you were saying two different things – that the Arctic ocean surface had been cooling since 2006, yet “the warm water left over from the period of mid 1970′s – 2005 dominated by el Nino events, wil continue to wash toward the poles for some years, so Arctic ice extent might continue to drop for a few years.”
I see no evidence for ENSO influencing sea surface temps on the Arctic ocean. The pacific has the narrowest corridor to the Arctic of all the oceans. But more significantly, ENSO is an oscillating system of ~3-year phases. There is no reason to think it is a driver of multi-decadal temperatures. And the Pacific Ocean itself has warmed much less that the Arctic Ocean over the last 3 decades, so something else is providing the extra heat up there.
But if you are correct, that simply reinforces my original point in a different way. The hypothesised effect of radiation loss from ocean exposed by sea ice decline is too insignificant to overcome heat gain from other sources.
Maybe putting it in terms of just ENSO is too restrictive. The bigger picture is that the whole earth atmosphere-ocean system is a heat engine moving heat from equator to poles.
If – for the sake of argument – we accept a model of multidecadal oscillation, alternating 30-40 year periods of warming and cooling global climate, then during warming periods, more heat will be moved polewards. The largest and slowest component of this will be ocean currents. Thus when the phase changes from warming to cooling, there will be an inertia of warm water still moving polewards from the warming years.
For the Arctic, indeed the more significant component of this will be the Gulf stream, not ENSO (the Gulf stream could in fact be a consequence of what some describe as an “Atlantic ENSO”). How long does it take equatorial Gulf stream water to reach the Barents – probably a few years. Arctic ice might thus lag global climate trends / oscillations by a similar interval.
BTW Arctic ice extent today is the highest in 9 years according to DMI and NORSEX.
For the sake of argument…
In an oscillating system we expect fluctuation around a mean. Global Arctic temperatures, then, should be neutral over the very long term. The centennial trend is positive for both. Caveats apply – the Arctic data is very sparse before the 1930s. There appears to be a multi-decadal pattern, but the PDO (which I assume you are referring to, as it seems to be ENSO-related) has exhibited a cooling trend since before 2000. If by “a few years” you mean, say, 5 years, then we have not observed the Arctic responding to this hypothesised lag. Temperatures have risen since 2006 in the Arctic. The PDO oscillation does not seem at this point to have a significant effect on Arctic temperatrues.
But I digress. If summer sea ice decline is greater than the winter (which it clearly is), then the difference between them will increase, and the reformation of sea ice will continue to break records in some years. This is an obvious conclusion, and not in any way an argument against declining sea ice.
barry,
What is your problem with declining Arctic sea ice?
“With a few weeks of growth still to occur, the Arctic has blown away the previous record for ice gain this winter.”
Well, of course it has. The ice WILL grow back more in the winters where WINTER temperatures are still VERY COLD (Barrow, AK has an average February high of MINUS 11 degrees F in February, and an average February low of MINUS 25). Thin sea ice ABSOLUTELY will grow back more and more each winter…..because there is LESS and LESS ice at the end of each summer. In fact…..within a decade there will be almost NO SUMMER SEA ICE at the end of the summer. At that point….we will max out on the WINTER GROWTH of thin ice. But the ice cover will continue to come back IN THE WINTER for many decades as thin winter cover.
Steve Mosher says that the past warm periods maybe caused as much melt as today. http://www.climate4you.com/images/GISP2%20TemperatureSince10700%20BP%20with%20CO2%20from%20EPICA%20DomeC.gif