NOAA’s Definition and Data Contradict Their Claim That 2012 Was The Warmest La Niña Year
Guest post by Bob Tisdale
In the 2012 State of the Climate Report, the National Oceanic and Atmospheric Administration (NOAA) stated (my boldface):
2012 ranked as the warmest “La Niña year”, surpassing the previous record set in 2011. Two of the three warmest years on record (2010 and 1998) are “El Niño years”. A La Niña (El Niño) year is defined here as occurring when the first three months of a calendar year meet the La Niña (El Niño) criteria as defined by the CPC.
Nonsense!!!
NOAA provided a lovely graph to illustrate their erroneous claim, which I’ve annotated and included here as Figure 1. The original is here. Unfortunately for NOAA, they must’ve conveniently forgotten that they revised their Oceanic NINO Index (ONI) in 2012, and that now 2006 is now considered a La Niña year. Oops!! According to the NOAA graph, 2006 was considerably warmer than 2012. And we can confirm that by looking at the annual global temperature anomalies presented by NOAA here.
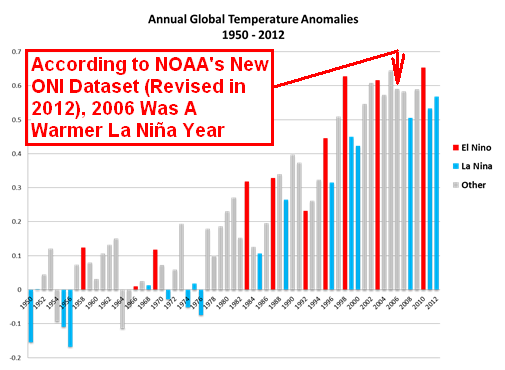
Figure 1
A screen cap of the new and improved ONI dataset is provided in Figure 2.

Figure 2
And a screen cap of the old version is provided in Figure 3. If NOAA had extended the 2012 data of their original and better version of their ONI dataset, 2012 would not have qualified as a La Niña year.

Figure 3
NOAA: If you make the correction to your State of the Climate report, please provide a link to this post. Thank you.
NOAA ONI IS NO LONGER A SEA SURFACE TEMPERATURE ANOMALY DATASET
As a reminder, we discussed and illustrated in the blog post Comments on NOAA’s Recent Changes to the Oceanic NINO Index (ONI) how NOAA’s ONI is no longer a sea surface temperature anomaly dataset, with a fixed set of base years. Therefore, you must exercise extreme caution if you intend to use in any analysis. It can and will give you odd results, because they’ve eliminated the effect of the 1976 Pacific Climate Shift on the ONI data.
INTERESTED IN LEARNING MORE ABOUT THE EL NIÑO AND LA NIÑA AND THEIR LONG-TERM EFFECTS ON GLOBAL SEA SURFACE TEMPERATURES?
Why should you be interested? NOAA also conveniently overlooked the fact that their own datasets indicate El Niño and La Niña events, not manmade greenhouse gases, are responsible for the warming of global sea surface temperature anomalies over the past 30 years and the warming of ocean heat content in the tropics since 1955. I’ve searched sea surface temperature records and ocean heat content data for more than 4 years (more than 3 years for the ocean heat content data), and I can find no evidence of an anthropogenic greenhouse gas signal. That is, the warming of the global oceans has been caused by Mother Nature, not anthropogenic greenhouse gases.
I’ve recently published my e-book (pdf) about the phenomena called El Niño and La Niña. It’s titled Who Turned on the Heat? with the subtitle The Unsuspected Global Warming Culprit, El Niño Southern Oscillation. It is intended for persons (with or without technical backgrounds) interested in learning about El Niño and La Niña events and in understanding the natural causes of the warming of our global oceans for the past 31 years. Because land surface air temperatures simply exaggerate the natural warming of the global oceans over annual and multidecadal time periods, the vast majority of the warming taking place on land is natural as well. The book is the product of years of research of the satellite-era sea surface temperature data that’s available to the public via the internet. It presents how the data accounts for its warming—and there are no indications the warming was caused by manmade greenhouse gases. None at all.
Who Turned on the Heat? was introduced in the blog post Everything You Every Wanted to Know about El Niño and La Niña… …Well Just about Everything. The Updated Free Preview includes the Table of Contents; the Introduction; the beginning of Section 1, with the cartoon-like illustrations; the discussion About the Cover; and the Closing.
Please buy a copy. Credit/Debit Card through PayPal. You do NOT need to open a PayPal account. Simply scroll down to the “Don’t Have a PayPal Account” purchase option. It’s only US$8.00.
Strange. I was ;under the impression the ENSO meter was positive, making last year an El Nino year. hmmmm
highflight56433 says:
January 21, 2013 at 9:59 am
The Enso meter has had a couple different data sources in the last year. Plus, it displays weekly data, not monthly. Reread Bob’t highlighted text:
Next, look at his figure 2 and note the first three months of 2012. They were -0.5 or less, La Niñ conditions. October was the only month with El Niño conditions, but that doesn’t count as it isn’t one of the first three months. (Note 2006 – four months of El Niño conditions that don’t count.
Well, we can argue about what constitutes a La Nina year and whether last year was the first or second warmest La Nina year. What is clear is that La Nina reduces the global temperature and La Nina years are getting much warmer. It certainly would not be surprising if the next El Nino year sets a new record for global annual high temperature. That record, of course, would refer to the recent era and not the last million or billion years.
So, recent Ninas are warmer than past Ninos, according to NOAA’s pristine, unadulterated data.
in other news, Lance Armstrong has won seven Tours de France, displaying speed and power that is unprecedented…
Thanks, Anthony.
Ignore the man behind the screen; look into my eyes; this oil will cure any ailment known to man; 2012 was the warmest La Nina year, yeah really it was, I got a bridge to sell you too.
Even NOAA themselves admit
In the context of the short-lived transition from La Niña into El Niño in 2012, this section features a comparison figure with weak-to-moderate El Niño events that followed La Niña conditions earlier in the same calendar year.
http://www.esrl.noaa.gov/psd/enso/mei/
Is a warmer La Nino really a El Nino?
When the lunatics have not only taken over the asylum but also control the patients’ records, all you can really do is sit back and wait fpor the riots to start.
Sooner or later (I suspect sooner) the general population will start really wondering where all this warmth actually is as cold, sh*tty “weather” continues to fly in the face of “warmest eva!” claims, .their heating bills increase and all that new “green” energy fails to be there when they need it.
We’re also reaching the point where people who grew up with “global warming” as a given are starting to see climate colder than their childhood – snow in winter and no barbeques in summer. As long as the world is “warmer than your childhood” it’s easy to believe. It’s not so easy when it’s clearly COLDER than you remember and someone somewhere is telling you that your own memory is wrong!
RSS temperatures are instructive.
In Jan 2012, when La Nina was still going , they showed an anomaly of -0.060C.
In June, under El Nino conditions, it had gone up to 0.337C.
In December, when ENSO was back to neutral, it had gone back down to 0.101C.
The effects of the ENSO changes during the year are obvious.
http://www.remss.com/data/msu/monthly_time_series/RSS_Monthly_MSU_AMSU_Channel_TLT_Anomalies_Land_and_Ocean_v03_3.txt
D’OH!
2012 ranked as the warmest “La Niña year”, surpassing the previous record set in 2011.
It is really funny to see this, but one has to have a little understanding, if it is not for natural climate variability to explain it, then why does the Earth not warm since 16 years?
What “they” do not say at the same time is how much of the warming was natural climate variability until now? Half? A quarter? Or maybe all?
If one looks at the index:
http://www.bom.gov.au/climate/enso/monitoring/nino3_4.png
the layman would say it was a failed El Nino, and the heat from the Pacific Ocean seems to be already gone:
http://www.bom.gov.au/climate/enso/sub_surf_mon.gif
Interesting, it looks like two La Nina’s have not gathered enough warmth to start an El Nino, and now comes maybe another La Nina. If so, it looks really bad for the temperature record, I wonder what will people tell about it now? The warmest super La Nina?
Or in case of an El Nino the weakest hottest El Nino? The ingenuity of the explanations is amazing.
I find it ridiculous to say 2012 was a La Nina year and to compare it with a year where La Nina was present throughout the year not only the last 3 month of a since July 2011 dead La Nina.
BillD says:
January 21, 2013 at 10:39 am
It certainly would not be surprising if the next El Nino year sets a new record for global annual high temperature. That record, of course, would refer to the recent era and not the last million or billion years.
With the quality of the data maintenance I would maybe trust a record year if this would appear in RSS and UAH. Sorry.
http://www.woodfortrees.org/plot/rss/from:1979/plot/uah/from:1979
Btw, there have been much more extreme El Ninos in history :
The unprecedented number of 2012 NOAA claims about unprecedented 2012 weather also contain an unprecedented number of factual errors. The number of revisions to previously established NOAA facts (July 1936 temp, 2006 Nina, zero UTI siting bias, Antarctic temperature…) to support NOAAs unprecedented MSM PR is also unprecedented.
More evidence of alarming changes in climate related metrics–but not necessarily climate.
One senses the increasingly disparate scurrying of rats aboard the climate change ship as it takes on factual water, becalmed now in 16 plus years of no temperature change, in increasing danger of sinking and taking all the grant gold down with it. Mann the lifeboats…?
Thanks to Anthony, Bob, and all the others who are raising the climate game.
Everyone realizes that the earth gradually warms after an Ice Age, but the original AGW claim was that now the warming had reached “alarming” proportions. The idea that the earth is gradually warming has now been usurped to mean “see?.. global warming is real!”. It’s getting silly.
NOAA is continuing to attempt to stave off the day when the people in general will start to notice that all this warm weather that is talked about is actually cold and icy weather. Their heating bills will have increased and all the new Green energy that they were relying on, has gone bankrupt. They will recall the warm days of their childhood and know that they have been lied to by people paid to tell them the truth.
The NOAA is discredited enough. The light is focused on them, next step is to turn up the heat. Then they will have a genuine complaint about warming.
Is there an overheated cold La Nina?
The average Nino 3.4 value for 2012 is -0.01C. Hardly La Nina. That is officially neutral.
Now if you think of it as a 3 month lag, the average is -0.314C which is still considered neutral. So all this talk about it being a La Nina year is bogus bs.
RSS-UAH temps versus the ENSO lagged 3 months (and adjusting for the El Chichon and Pinatubo volcanoes). Sometimes the lag is only 2 months, sometimes 4 months but it does average about 3 months. There is still a rising trend in temperatures but is close to only one-third of that predicted by the climate models.
We are on the way down now and this could continue for six months.
http://s14.postimage.org/vz323j0r5/RSS_UAH_volc_adj_vs_ENSODec12.png