Guest post by Paul Homewood
Although tornado numbers still need to be confirmed for November/December, NOAA have issued their report for 2012.
It has been abundantly clear for several months that the year would be one of the quietest on record. I was therefore more than a little surprised to see this graph NOAA put right at the top of their page.

http://www.ncdc.noaa.gov/sotc/tornadoes/2012/13
Although they rather grudgingly comment that “tornado activity during 2012 was below average”, the impression is clearly given that tornado numbers in recent years, and even 2012, are much higher than in earlier decades. And, of course, many readers will simply look at the graph, read the first paragraph, and walk away with that very impression.
This impression would be most definitely a wrong one. Let me explain.
The above graph is based on total number of tornadoes reported, everything from the weak EF-0 ones right up to killer EF-5’s. As NOAA themselves acknowledge elsewhere, on their excellent “Tornado Climatology” website:-
Today, nearly all of the United States is reasonably well populated, or at least covered by NOAA’s Doppler weather radars. Even if a tornado is not actually observed, modern damage assessments by NWS personnel can discern if a tornado caused the damage, and if so, how strong the tornado may have been. This disparity between tornado records of the past and current records contributes a great deal of uncertainty regarding questions about the long-term behavior or patterns of tornado occurrence. Improved tornado observation practices have led to an increase in the number of reported weaker tornadoes, and in recent years the number of EF-0 and EF-1 tornadoes have become more prevelant in the total number of reported tornadoes. In addition, even today many smaller tornadoes still may go undocumented in places with low populations or inconsistent communication facilities.
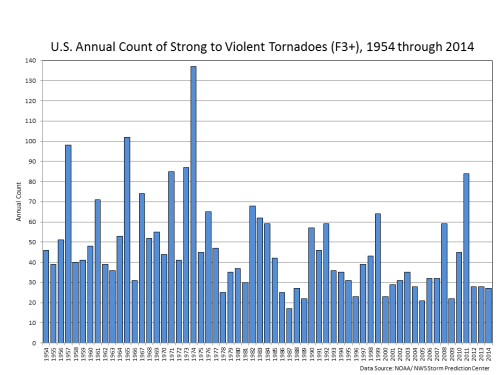
With increased national Doppler radar coverage, increasing population, and greater attention to tornado reporting, there has been an increase in the number of tornado reports over the past several decades. This can create a misleading appearance of an increasing trend in tornado frequency. To better understand the true variability and trend in tornado frequency in the U.S., the total number of strong to violent tornadoes (EF3 to EF5 category on the Enhanced Fujita scale) can be analyzed. These are the tornadoes that would have likely been reported even during the decades before Doppler radar use became widespread and practices resulted in increasing tornado reports. The bar chart below indicates there has been little trend in the frequency of the strongest tornadoes over the past 55 years.
[For instance, Doppler radar was phased in from 1992-97]
Their graph only runs to 2011, but the preliminary total of EF-3+ for 2012 is 33, as illustrated in my graph below.

Out of the 43 years since 1970, there have been 15 with less EF-3+ tornadoes, so it is not exactly an uncommon occurrence. In terms of total tornadoes, the Storm Prediction Centre project that 2012 will be the quietest year since at least 2005 .

My own analysis suggests a total of about 920 total tornadoes, including 350 EF-1 or stronger. If the latter figure is right, this would leave 2012 as the 3rd quietest year for EF1+ tornadoes since 1970. Only 1987, with 316, and 2002, with 311, had fewer.

The November and December numbers will not be confirmed till March, when I will do the usual full analysis, including a look at whether early season tornadoes are on the increase.
After Thought
I cannot finish without revisiting my opening comments.
For NOAA to present the graph that they have at the very start of their report is, in my opinion, not only grossly misleading, but deliberately so.
They cannot claim ignorance, as they themselves already have already admitted that such comparisons are invalid.
Given the misleading data recently issued by other bodies, such as the UK Met Office, it is hard to avoid the conclusion that NOAA deliberately took the decision to publish this particular graph, rather than the more relevant strong tornadoes version, in order to promote their message that “extreme weather” is increasing.
For the second time this week, I am forced to ask the question – “ Is this really what “science” has come down to?”
References
1) Analysis of 2012 data is from NOAA’s Storm Events Database
http://www.ncdc.noaa.gov/stormeven
================================================================
Addendum by Anthony:
January 9th, 2013 marked a milestone in U.S. tornado history. That day marked the longest stretch of days without a tornado death. It will go down in recorded history as the longest streak with no tornado deaths: 197 days and as of this writing, 201 days and is still climbing.
Good piece. The public-relations from NOAA et al. is so deeply reflexive at this point that intentionality may not even matter. “Choices” like putting the misleading graph at the top of stories happen with about as much thought as cows chewing cud. It’s what they do.
I guess Dorothy has to keep waiting for that ride to the land of Oz then …
They sure like to adjust the temperature record, but don’t like to fix the under-reporting of tornados and hurricanes (even though the work has been done and is available to make valid comparisons).
There is a serious problem at the NCDC section of the NOAA. Somebody has to clean this up and it needs to start now.
They like to see if they can spin the tornado data more than the tornado itself.
Does the coriolis effect spin Southern hemisphere data clockwise?
I get the impression that there are two separate groupings at NCDC. One includes the proper scientists, like Greg Carbin, who know their topic inside out.
The other includes the PR people and data massagers.
Outreach is the job…….Tornado…..not so much.
cn
I am curious what exactly constitutes a “tornado “report. Are civilian reports counted? I also wonder if the increasing prevalence of cellular technology has also contributed.
UK Met Office
“UK Outlook for Monday 28 Jan 2013 to Monday 11 Feb 2013:
There is greater than average uncertainty through this period, with no strong signal for any one weather type to dominate. However, on balance colder conditions are more favoured rather than the milder weather experienced so far this winter.
Issued at: 0400 on Mon 14 Jan 2013″
As it’s winter it might be cold!
And their computer only cost 30 millon pounds!
Paul’s note about PR people is quite correct. This is a firm trend in governments around the world headed by our own Canadian Prim Minister. Last summer it only took three email to Nat. Res. Can. to get a technical question answered by a technical person. The first two resulted in completely irrelevant baffle gab about the wonderful job the gov. of can was doing, not! I think groups need to be kept far, far away from science: lawyers and PR.
A ripe topic for Spin!
‘And, of course, many readers will simply look at the graph, read the first paragraph, and walk away with that very impression.’
Job done then , for the mistake is to think this an argument about the facts or the science when in pratice its not . Its about getting the ‘right ‘ message out by what ever it takes .
Several dozen of those from the near-record year of 1974 were from one storm, the one that spawned the tornadoes that almost wiped out Xenia, Ohio. I’m not suggesting the numbers be massaged, but I wonder if there’s a way to account for such “multiple births” or a need for it.
Tornado reporting mirrors cyclone reporting. The name a slew these days, most would not have been reported before 1980 since no one would know they existed.
Is there any chance that tornado activity could be “normalized” with some kind of measurement stat like the ACE index for tropical cyclones? (length travelled on the ground multiplied by F scale etc.)
According to NOAA’s Storm Prediction Center (SPC) US Inflation Adjusted Annual Tornado Trend and Percentile Ranks, we ended up 5 tornadoes above the record annual low:
http://www.spc.noaa.gov/wcm/2012/torgraph-big.png
This are an array of other NOAA SPC analyses are available here:
http://www.spc.noaa.gov/wcm/
If NOAA is under the control of paid up members of the Global Warming Industry, there will doubtless be no press release clarifying matters, such as has been done here. After all, it is clear the principal purpose of this chart on tornadoes was to alarm, rather than to inform.
On the other hand, if NOAA wishes to be seen as being both objective and factual, then a clarification will be issued shortly.
I know which of these two options my five bucks is on,
I wonder how “Final data” could fall below “Area of Uncertainty” of “Preliminary Data” for 2012 in the NOAA Jan-Dec Total Number of Tornadoes graph. The error bar was surely in error, was not it?
Logic and Rhetoric are opposite sides of the same coin. Both seek to persuade the listener to accept a conclusion. Logic seeks to persuade by demonstrating that the conclusion is correct. Rhetoric seeks to persuade by making the listener ‘feel good’ about accepting the conclusion, regardless of its veracity or lack thereof. Any study of the Fallacies of Informal Logic will lead one to recognize that the Fallacies are still in common use because they are often more persuasive than logic.
Science is *supposed* to avoid use of fallacies by requiring all propositions to be empirically testable, but when money enters the game, politics soon follows.
Bloke down the pub says: Does the coriolis effect spin Southern hemisphere data clockwise?
While I’m sure it affects the direction of ‘spin’ to flush our tax money down the toilet on climate catastrophe ‘research’, it apparently makes no difference in political entropy at the point of discharge.
Congress.. haul them in front of a committe and tell them that their budget is for science, not propaganda. Since they do not seem to know the difference, give them a 20% budget cut.
Addendum by Anthony:
> January 9th, 2013 marked a milestone in U.S. tornado history. That day marked the longest stretch of days without a tornado death.
And of course a pretty impressive streak of no US landfalling major hurricanes. 2700 days or so (I don’t have time to look it up).
Maybe we need one of those “Days without an Accident” signs like they have at hazardous work sites. 🙂 Speaking of which, the ENSO meter updated fine, and is at (very) boarderline La Niña “conditions.”
I have my update cron script reporting the last five weeks of data now:
Opening http://nomad3.ncep.noaa.gov/cgi-bin/pdisp_sst.sh?ctlfile=oiv2.ctl&ptype=ts&var=ssta&level=1&op1=none&op2=none&day=15&month=dec&year=2012&fday=14&fmonth=jan&fyear=2013&lat0=-5&lat1=5&lon0=-170&lon1=-120&plotsize=800×600&title=&dir=
Found target /png/tmp/CTEST135816481519198.txt
Opening http://nomad3.ncep.noaa.gov//png/tmp/CTEST135816481519198.txt
Data file
data from 00Z15DEC2012 to 00Z14JAN2013
“———-”
0.0246506
-0.119068
-0.045533
-0.228761
-0.514692
Length of data file 102, most recent value: -0.514692
file_last -0.228761
anomaly -05
For NOAA to present the graph that they have at the very start of their report is, in my opinion, not only grossly misleading, but deliberately so.
They cannot claim ignorance, as they themselves already have already admitted that such comparisons are invalid.
Given the misleading data recently issued by other bodies, such as the UK Met Office, it is hard to avoid the conclusion that NOAA deliberately took the decision to publish this particular graph, rather than the more relevant strong tornadoes version, in order to promote their message that “extreme weather” is increasing.
Yeah, but…
remember, it is not a conspiracy and they aren’t committing fraud.
/sarc /cynic
Now Global Warming results in greater storm reporting.
It would be hard to state out-right that the number of tornado’s has increased due to global warming – because tornado’s result from a mixing of both hot and cold air. This is in fact true of most of what we identify as “extreme” weather events.
This is one of the most ironic facets of claiming an increase in “climate disruption”.
Ed_B says:
January 14, 2013 at 6:26 am
Congress.. haul them in front of a committe and tell them that their budget is for science, not propaganda. Since they do not seem to know the difference, give them a 20% budget cut.
But, but, (their) world would end.
Chris D
I am curious what exactly constitutes a “tornado “report. Are civilian reports counted? I also wonder if the increasing prevalence of cellular technology has also contributed.
The initial local storm reports are initially collected by local NWS offices, and can come from a variety of sources.Each one has to be investigated to check if it really was a tornado and give it a Fujita scale. before it can be confirmed.
As well as Doppler, other factors, such as cell phones, the development of spotter networks by NWS offices, local emergency management officials, local media; and population shifts have all contributed to many more tornadoes being reported.
http://www.spc.noaa.gov/publications/mccarthy/tor30yrs.pdf
Berenyi Peter
I wonder how “Final data” could fall below “Area of Uncertainty” of “Preliminary Data” for 2012 in the NOAA Jan-Dec Total Number of Tornadoes graph. The error bar was surely in error, was not it?
The “final data” are tornado confirmations up to October.
The orange “preliminary” are local storm reports for Nov + Dec. Normally about 80%, I believe, of LSR’s get to be confirmed, so the final total for the year will probably come in around 900.
We need whistleblowrs from NOAA.
The skeptical position will never be validated as long as those who question the data – Hansen temperature adjustments included – are from the outside. Same with the New Zealand offiiical temperatures, as obviously bizarre in relation to their originating, raw station data. We need one of the soldier ants to come public.
Without confirmation that departmental directives forced reasonable men and women to make unreasonable choices, the skeptics will always be the conspiracy cranks.
The Climategate and AR5 leaks are closer to insider revelations, but not close enough. It will take a defector or retiree to deepsix the warmist narrative. If none come about, one will always wonder if the warmist scientists had a legitimate position regardless of the liberal, eco-green agenda.
We need at least one Deepthroat.
Paul is perfectly correct here, including EF4 and EF5 is totally misleading. I suspect he is also correct that this is intentional for the reasons he points out.
Looking at autocorrelation of EF3 and greater ie EF 1,2 and 3 shows some very clear patterns:
http://i48.tinypic.com/a3jp5i.png
firstly it should be understood that autocorrelation lag plots show _repetition_ of patterns not the pattern itself, nor the phase, so no one should start necessarily interpretting these nice wiggles as indicating sine waves in annual tornado count.
However, there is a clear repetition of about 8.3 years (three reps. in 300 months) and a strong negative correlations at about 31.6 years (380months) that would suggest a longer term pattern of about 62-63 year duration.
Here is a similar plot for North Atlantic temps (AMO is detrended N. Atl):
http://i46.tinypic.com/htdwkg.png
It would seem that a major driver of tornado count is North Atlantic temps. They seem particularly sensitive to shorter term changes. The 8.3y cycle seems closely matched to N. A. temp but is a lot stronger in the tornado count data.
In view of the meterological conditions that create tornadoes their sensitivity to short term disruption is perhaps not surprising.
Lead post:
Management decision; An opening lede like that had to pass muster with some upper level of management, the question is, how high?
Also ‘knowing’ what your management desires while preparing such a page/report is operative and determines the end product (no one wants to be told by the boss to ‘do it over’; everyone desires a good ‘review’ -more pay- at KPA time) ..
I don’t see a byline, so must have been ‘staff’ prepared.
.
Chris,
Here is the more or less ‘semi-raw’ (Storm Prediction Center screened only) reporting data from public, law enforcement, storm spotters, etc. as it happens (near real-time) as tabulated through the NWS … personnel from the NWS offices around the country will then afterward visit these locations in the field (time permitting) and ascertain the strength for a Fujita rating:
General entry point: http://www.spc.noaa.gov/climo/online/
Storm report page for “today”: http://www.spc.noaa.gov/climo/reports/today.html
BTW, everyone should check their local NWS office and see when and where various Storm-Spotting classes are being held; this is the time of year when they conduct spotter classes (at least here in Texas!)
Example, class schedule conducted by the Ft. Worth NWS office (note: these are held in a number of locations in counties within the Ft. Worth CWA – coverage warning area) on-going now through into March:
http://www.srh.noaa.gov/fwd/skywarnsch.php?file=sptrsch
Format:
Date, County, City, Location, Time
Monday Jan 14, Milam, Rockdale, Rockdale VFD Meeting Room, 7:00-9:00PM
Tuesday Jan 15, Comanche, De Leon, De Leon VFD, 7:00-9:00PM
Wednesday Jan 16, Hamilton, Hamilton, Hamilton Fire Department, 7:00-9:00PM
Thursday Jan 17, Hopkins, Sulphur Springs, Sulphur Springs City Library, 7:00-9:00PM
Saturday Jan 19, Collin, Frisco, Collin College – Preston Ridge Campus
. . . . . . . . . . . . . . . . . . . . . . . .Conference Center: C105, 8:00AM-4:30PM
.
As a twist on the perverbial question that could relate to this issue:
“If a tree falls in a forest and no one is around to hear it, does it make make…” it a tornado statistic for the NOAA?
;>P
I read recently that we’re in a record period for not having a tornado-related death. It doesn’t seem to be getting much hype.
In 2012 and 1988 the tornado belt was in severe droughts. If there are no thunderstorms there are not going to be any tornadoes. Please compare on the first graph the drought years of 2012 and 1988.
@equibno – Yes, I did exactly what you suggest when I looked at this last summer. I felt that the EF numbers were too inexact. The NOAA has a dataset available for download with the size of the track for each tornado, width and length. Simply scale each to the same unit and multiply. It doesn’t change the big picture answer – there is a trend in tornado total energy, but it is confounded with increased reporting coverage.
I’m no meteorologist, and it is not obvious to me that AGW should be expected to have any effect on number or intensity of tornadoes. Hurricanes, maybe, but not tornadoes.
Jason Miller
There were 419 F1+ in 1988, compared to 350 (est) in 2012.
1985-88 was a quiet period anyway, ranging from 316-419.
This is fairly common among government agencies. Even though they are supposed to be even handed, each administration’s beliefs in what is being reported can be seen in the documents.
Even if they didn’t, it doesn’t matter anyway.
Take a report like this and put a misleading graph at the top with a note somewhere in the document about how misleading it is, the news outlets will see the graph and report that climate is changing. The agency will say, it wasn’t [their] fault, they provided a disclaimer.
Take a report and put the disclaimer at the very top of the document and even in the figure discription. You will get an activist group that claims the climate is changing “based of figures provided by” the government agency… minus the disclaimer of course. The news then picks up the activist group’s claims and does not bother to read the original document that includes the disclaimers everywhere.
I have seen this in another topic I am far more familiar with. Doesn’t seem to matter how the information is shown by the government, the media end up saying the same thing.
‘And, of course, many readers will simply look at the graph, read the first paragraph, and walk away with that very impression.’
Last week I talked with several warmistas who managed to confuse the NOAA’s recent claim that the 2012 was the warmest in the US, with a claim that it was the warmest for the entire world.
Yes there is a long term pattern in the production of tornadoes, it seems to be driven by the lunar declinational tides in the atmosphere, for graphs on the production of past tornadoes by date, and also lunar declination shows it well.
http://research.aerology.com/lunar-declinational-affects-on-tornado-production/
@JohnWho;
+1
Some fools actually still believe that.