
Guest post by Alec Rawls
They say it all the time: even if there were some substantial mechanism of enhanced solar forcing it couldn’t be responsible for late 20th century warming because solar activity was roughly constant from 1950 to 2000. I have rounded up statements to this effect from eighteen top “consensus” climatologists, like Raimund Muscheler (2012):
Solar activity & cosmic rays were relatively constant (high solar activity, strong shielding and low cosmic rays) in the second part of the 20th century and, therefore, it is unlikely that solar activity (whatever process) was involved in causing the warming since 1970.
Is he assuming that the oceans equilibrate rapidly to any change in forcing so that continued high forcing is necessary just to maintain the new equilibrium, resulting in only a brief shot of warming? He doesn’t say. None of them say. They just make this highly counterintuitive claim that persistent forcing cannot cause continued warming, as if they actually believe that it is the change in the forcing rather than the level of the forcing that does the warming.
The tune changes however, as soon as the subject is forcing from greenhouse gases. A staple of the crusade against CO2 is the “commitment study,” where climatologists use their general circulation computer models (GCMs) to estimate the amount of future warming that would result if atmospheric CO2 were to stop increasing and just stay at current levels. That means no change in forcing going forward, just continued forcing at the present “high” level. The estimates of the continued warming this would cause over the 21st century are quite large, roughly equivalent to 20th century warming, or in the latest estimations, substantially higher.
AR4 estimated the “constant composition” commitment at 0.1°C/decade for the early 21st century, 0.6 °C for the whole century
From AR4 (§10.7.1, PP4):
The multi-model average warming for all radiative forcing agents held constant at year 2000 (reported earlier for several of the models by Meehl et al., 2005c), is about 0.6°C for the period 2090 to 2099 relative to the 1980 to 1999 reference period. This is roughly the magnitude of warming simulated in the 20th century. Applying the same uncertainty assessment as for the SRES scenarios in Fig. 10.29 (–40 to +60%), the likely uncertainty range is 0.3°C to 0.9°C. Hansen et al. (2005a) calculate the current energy imbalance of the Earth to be 0.85 W m–2, implying that the unrealised global warming is about 0.6°C without any further increase in radiative forcing. The committed warming trend values show a rate of warming averaged over the first two decades of the 21st century of about 0.1°C per decade, due mainly to the slow response of the oceans. About twice as much warming (0.2°C per decade) would be expected if emissions are within the range of the SRES scenarios.
Should Gerald Meehl’s estimate of 21st century commitment be reduced in compensation for the fact that he uses a 1980 – 1999 temperature average as a baseline? It seems that a decade’s worth of his 21st century warming estimate is actually taking place between 1990 (the center of his baseline period) and 2000. If so, the compensation would be at most about 0.1°C. That is the peak rate of warming the models produce for year-2000 Green House Gas levels. 1980-1999 GHG levels were lower, hence modeled warming would have been less than 0.1°C between the 1990 midpoint of the period and 2000 so less than 0.1°C of Meehl’s estimate of 21st century warming would actually be taking place during the 20th century.
But maybe no adjustment is needed. Meehl et al. certainly do not hesitate in presenting their figures as estimates of “further warming” vis a vis 2000. From the Meehl 2005 abstract:
Two global coupled climate models show that even if the concentrations of greenhouse gases in the atmosphere had been stabilized in the year 2000, we are already committed to further global warming of about another half degree and an additional 320% sea level rise caused by thermal expansion by the end of the 21st century. … At any given point in time, even if concentrations are stabilized, there is a commitment to future climate changes that will be greater than those we have already observed.
As for other commitment findings, Tom Wigley (2005) estimated that the “constant composition” warming commitment “could exceed 1°C,” and the graph at the top of the post is from Matthews and Weaver 2010, a pay-walled post-AR4 commitment study that was reviewed by Gavin Schmidt, who lists their commitment estimate from constant year-2000 GHG forcing as “an additional 0.3 to 0.8ºC warming over the 21st Century.”
AR5 commitment estimates are higher still, presumably because they project 2010 GHG levels. From the Second Order Draft (p. 12-60):
“Constant emission commitment” is the warming that would result from keeping anthropogenic emissions constant and is estimated for example at about 1–2.5°C by 2100 assuming constant (year 2010) emissions in the future, based on the MAGICC model calibrated to CMIP3 and C4MIP (Meinshausen et al., 2011a; Meinshausen et al., 2011b) (see FAQ 12.3).
At the low end, that is more warming than was seen during the 20th century, at the high end it is 3 to 4 times 20th century warming. Guess that nixes the idea of rapid ocean equilibration.
Talking out of both sides of their mouths
These commitment findings should be taken with a grain of salt. Would current levels of GHG forcing, which have coexisted with no statistically significant warming for 15 years now, really cause the present century to warm twice as fast as last? Such wild prognostications show how extravagantly the “consensus” scientists are willing to exaggerate in favor of their anti-CO2 narrative, but they can’t have it both ways. If they expect the persistence of a mildly elevated GHG forcing to cause many decades of substantial warming then it is pure dishonesty to turn around and declare that persistently elevated solar forcing, regardless of its level, could not cause more than a decade or two of warming.
Some of these scientists have done very important work. Ilya Usoskin, for instance, has been a pioneer in developing cosmogenic nucleotide proxies for solar activity. That makes it unsettling to have to call him out, but HEY USOSKIN, it’s about time you renounced the BUT in Usoskin et al. 2005:
The long term trends in solar data and in northern hemisphere temperatures have a correlation coefficient of about 0.7 – .8 at a 94% – 98% confidence level.
BUT:
During these last 30 years the total solar irradiance, solar UV irradiance and cosmic ray flux has not shown any significant secular trend, so that at least this most warming episode must have another source.
Usoskin himself classifies 1920 to 2000 as a “grand maximum” of solar activity, thus his claim here is that even if a historically powerful driver of climate remains at a high level for an extended period of time it will still not cause continued warming. To cause continued warming it would have to keep going up (to higher than high levels).
Does he actually believe that, or did it just seem like a small price to pay to stay in the good graces of the funding institutions that Al Gore, Maurice Strong, James Hansen, Stephen Schneider et al. established in the 1990s? In fact it is a huge price to pay. It is a complete debasement of scientific principle, handing the anti-CO2 crusaders an utterly fraudulent grounds for dismissing the alternative solar-warming hypothesis, and pretty much all of the leading solar scientists have embraced the same trope.
Whether this is bias or cowardice it needs to stop, and for anyone who wants to be silenced no longer, the commitment studies offer an ironclad opportunity. After all, the GCM guys have their own field of expertise. If the computer modelers insist that a steady high level of forcing will cause at least several decades of substantial continued warming then who are the solar scientists to contradict them? All they have to do is stop making highly speculative claims about ocean equilibration that lie completely outside of their field and are unsupported by any reason or evidence.
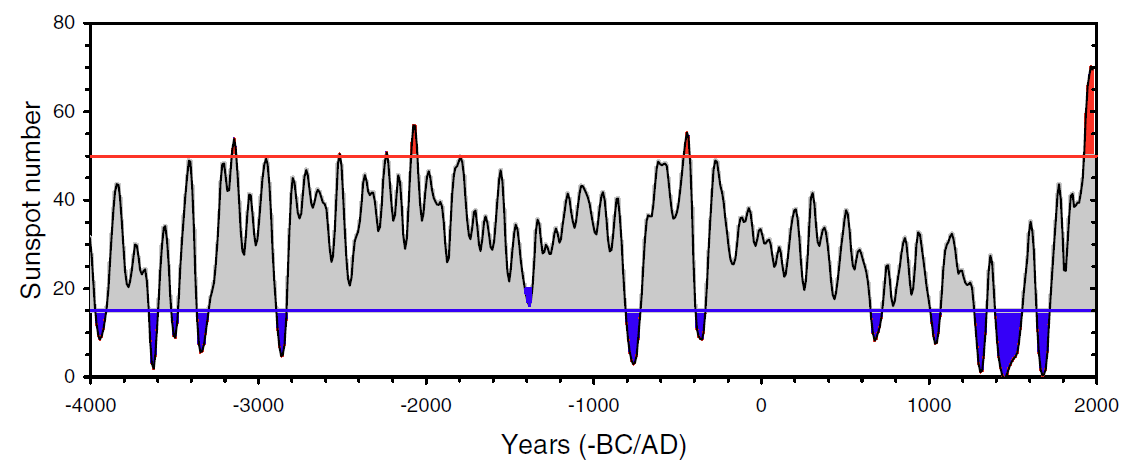
Usoskin’s solar estimates are “grand maximum” even if post-1945 Waldmeier-era sunspot counts are reduced by 20% as Leif Svalgaard urges
Usoskin uses a “high activity threshold” of 50 so even if his sunspot counts (“75 ± 3 since 1950“) are reduced by 20% they are still at “grand maximum” levels from the 1940s to the 1990s by Usoskin’s criteria.
Hat tip to Lucia Liljegren
I asked Lucia if she knew of any GCM tests of the solar warming hypothesis. Had the “consensus” ever GCM-tested their oft-repeated claim that even if there were a substantial mechanism of enhanced solar forcing it could not have caused late 20th century warming?
Not that she knew of, but she suggested that the results of a persistent elevated level of solar forcing should be roughly the same as for a persistent elevated level of GHG forcing, as examined in the commitment studies. In both cases the amount of warming would be the same. Both would be calibrated to account for observed 20th century warming, so the resulting ocean equilibration process should be similar.
Thanks Lucia. The “consensus” has indeed already in-effect GCM-tested the alternate hypothesis, with just a slight change in time frame. Fifty years of high solar activity beginning in 1950 are analogous to fifty years of 2010-level CO2 forcing beginning in 2010, and the predicted warming from the CO2 commitment testing directly contradicts the stated rationale for dismissing a solar explanation for late 20th century warming.
We are living inside the “experiment”, and can’t seem to measure the resultant changes.
What does that tell us ?
There is nothing more myopic than an adherent to the cause. Your logic unravels them. If the logic holds…..why is there an elephant in the room?
Thanks Alec. This is great stuff. I lapped it up with a spoon. And yet, how to get these guys to back away? MOst of them must realize they’re not being honest, but rationalization can be a powerful force. As is self interest. And yet, can’t they even begin to see that it ultimately is in their self-interest to start being honest? I keep waiting for a rush to the exits, but it never comes..
So, since the solar forcing change has been enough for 0.2 degrees this last century, we had 0.1 C in the first half of the century, and the other 0.1 C hit us after the sun stopped strengthening. Is that the bottom line?
Yes exactly.
I came across this numerous times, alarmist constantly claim that heat from c02 generates more heat, i.e. melting ice reduces albedo which increases temperature further, melting permafrost increases CH4 which increases temperature further etc, etc, But I have never once seen this argument applied to solar activity.
In other words, most consensus scientists agree that one “could argue” that natural processes produced the warming until about 1950, but after that you can no longer argue it, because solar activity didnt increase after about 1950. This is the very argument that led Sir David Attenborough to become convinced of strong AGW; temperatures should have gone down after the sun peaked in the mid 20th century, or thereabouts. (You can get a video of David Attenborough discussing this from the BBC, with the author of a famous paper showing modelled 20th century tempertures, also used by the IPCC, (I can’t remember the name of the paper, but it shows a decline in temperature using modelling from natural sources after about 1950, as compared to temperature trends using natural sources plus c02 after 1950).
Even with the IPCC’s claim that something like 10% (or less) of heating from ~1850 was caused by the sun, this means there would be some flow on effects, just as with c02. And the lags for c02 are LONG and leisurely, for the sun it’s nasty, brutish and short. Talk about selective lag bias!
Enoy reading your posts, but I think we will need some papers from consensus physicists in thermodynamics to ‘fess’ up and point out the gross errors and the selectivity, in some new papers in the spirit of honest science. Some of them out there are honest, after all.
Gosh, just take a bike. Start pedaling with a constant force of any amount and your bike will accelerate till an equilibrium point of air friction, tire and mechanical friction match the force. Until the new equilibrium point is reached the bike will get faster and faster.
These climate scientists need even a little multi-disciplinary common sense sometimes. (or get their brains out of their agendas)
Should not be needed to do a study or have an article – this seems as basic as parallel lines do not intersect. Sad indeed.
Have none of these guys ever boiled water on a stove? Or is that too simplistic?
Nice analysis. I was looking for an explanation of the chart.
Of course, for a skeptic to argue that solar forcing is “enhanced” but CO2 forcing is not might be a bit much. Maybe we should all split the difference and work on addressing global poverty.
I am wondering if you are saying that GHG forcings are cumulated but solar forcings / feedbacks are not?
Could you confirm:
1. Whether constant or variable annual solar forcing is taken into account by climate models?
2. Whichever approach is used, whether only annual solar forcing is taken into account or cumulative forcing? [I assume that the world ocean would be the sink for accumulating any gains or losses from variations in solar intensity.]
3. Alternatively. when estimating cumulative heat gains / losses by the world ocean oceanographers / climatologists take into account the cumulative effect of variable solar forcing?
[I am referring to those studies that use the average termperature variation in the word ocean to estimate climate sensitivity to forcing by GHG etc.]
As you are driving down the freeway, give the accelerator pedal a push and hold it there. You will notice that the vehicle picks up speed over time. It doesn’t suddenly, instantly jump from its former speed to the new speed. The oceans provide some thermal inertia for lack of a better term. As increased solar activity continues over several cycles, in this case almost 200 years since the end of the Dalton, we saw gradually increasing temperatures (with the exception of the late 60’s early 70’s which corresponded to a relatively weak cycle with weak solar wind). What is quoted above seems to be saying “since the temperatures didn’t just shoot up and stay there, since they rose gradually, the additional input from the sun could not have have been the cause so it must have been something that also changed gradually.
During the LIA we had several grand minima without much time from the end of one to the start of the next. Most of the post-LIA warming was accomplished by the 1930’s. The duration and magnitude of warming from 1910 to 1940 was very close to the duration and magnitude of warming from 1975 to 2005. The first episode of warming happened when CO2 emissions could not have possibly been the cause. We have an interesting problem where that initial warming is included when they want to count total 20th century warming but is conveniently excluded when talking about CO2 forcing because it would force them to have to find another cause of the early 20th century warming and that certainly can’t be due to CO2. By focusing any attention on that rise, people would begin to notice that the late 20th century rise was not significantly different. This is one reason I believe databases such as NCDC have been slowly adjusting pre-1940 temperatures downward and adjusting post-1940 temperatures upward. They are attempting to slowly erase that inconvenient fact in very tiny increments over the decades in the hope that they can do so slowly enough that nobody will notice. They have managed so far in 4 years to adjust about 0.1 degree of it away.
And there is yet another lesson in dishonestly that has happened lately and this might be bigger news where I live in my local media than it is in other places. Al Gore sold his Current TV to Al Jazeera. The dollars he took from them and put in his pocket were oil dollars. I listened today to a radio show where that was the topic of conversation. The San Francisco employees of Gore’s “Current TV” feel absolutely betrayed. To them, Gore has lost all credibility. Not only did he take oil dollars, but he also expedited the sale to get the favorable tax rates on the transaction by selling it at the very end of 2012 (announced that it had been sold on Jan 2, 2013). These people now believe that Gore has zero integrity and this calls into question everything he has said over the past couple of decades on the subject of climate change as he has basically betrayed the entire movement. They described it as feeling like Gore has “conned” them. He made millions of dollars on the whole climate change issue and then sold a business built on the reputation he gained in that space to what amounts to one of the largest oil companies in the world. The Qatar royal family have considerable influence and financial stakes in the company.
One of the great pontiffs of “climate change” is now thought by many of his most loyal followers to be nothing more than a con.
Frank White asks: “Whether constant or variable annual solar forcing is taken into account by climate models?”
The only solar forcing that the “consensus” GCMs take into account is Total Solar Irradiance (TSI), which varies only minutely over the solar cycle. There is at this point quite a pile of evidence that some mechanism of solar forcing beyond TSI must be at work, which is sometimes called “indirect solar forcing,” or “enhanced solar forcing,” or “solar amplification,” all just meaning “more than TSI alone.”
Frank also asks whether the models look at cumulative forcing. The GCMs, yes. They model heat storage so continued forcing at a given level will continue to cause warming, so long as the level of forcing is above what is needed to maintain the system at its current temperature (i.e. so long as the oceans have not yet equilibrated to the forcing). A big chunk of the warming response to a new level of forcing will occur quickly (less than ten years), but there will also be a medium term response.
This is what the commitment studies show. If the level of forcing is maintained at a new higher level then a slower warming will continue 50 and a 100 years, slowly tapering off over that time. But the “consensus” does not admit this in the case of CO2. They have never run GCM tests for enhanced solar forcing scenarios. (Obvious because they never cite any such tests when they declare that the 50 years of high post-1950 solar activity could not have caused post 1970 warming.)
So it is not the models that are the problem. The problem is that the models are not being applied to the alternate hypothesis.
Nice article thank you.
The jig from these science deniers is up… Let’s call the AGW crowd what they are – science deniers. Imagine if all the money wasted on costly green energy,and fake science was used for something humane like ending world hunger? What if it were used to fund building of nuclear and fracking and new ways to burn cleanly – instead of fighting progress. OK – I don’t think tax money should be used to pick winners… But by simply NOT taking tax money and applying to green, we’d have more incentive to progress. Where would we be now? How would all the cheap clean energy help the poor from the perspective of more jobs and more energy to amplify their productivity?
Imagine a world without political scientists…
A very inconvenient truth.
I think your article is very important, and hits the nail on the head on the very large and inconvenient error that I think forms the entire basis and argument for strong AGW from C02. Let me explain.
In the 1990s scientists were increasingly noticing that the earth had been warming since the 1970s (and longer than that as well) , but at the time there was no apparent natural reason for this to be occurring. When they looked at the sun, it wasn’t changing, so presumably, the only way to explain it was from human-derived greenhouse gas concentrations, which had been steadily increasing at much the same time. It was a very convenient explanation, as it opened up huge career options, as well as the backing of the entire green movement, that the whole world’s ways were was causing trouble to the climate, and entire research lifetimes could now be spent finding ways to alleviate the problem and change the world. You could get an entirely new career just studying the problem. It was also very politicially tempting to jump to the conclusion that is was all human c02, the entire green movement and most of the left would be behind you. Academic careers beckoned. You could save the world.
So many scientists decided that the only explanation for late 20th century warming was from greenhouse gases from human activities. They made up their mind, without properly considering alternatives, because it was just too politically tempting. The idea of multi-decadal heat lags from solar activity was not even known about, and too vague and unlikely to take seriously.
Trouble is, the scientists and agencies which were then formed to ‘look into’ the problem decided they already knew what they were talking about, and dug their heels in. The temperature was rising from c02 and other human activities, and that was that. Trouble is, if this was true, and this is what they genuinely expected, the temperature should have continued to rise after the 1990s. But it hasn’t. And now they have a problem, they can’t turn around and say they jumped to conclusions in the first place in the 1990s and go it wrong, because this would be a serious loss of face. All those media statements, papers, careers, warnings, all horribly and embarrasingly wrong. Too much is now invested, too many have been caught up with the moment, and it’s too late to backtrack and change your mind.
They should have never jumped to the very convenient academic conclusion that society had to be saved by academia. They should have said that they don’t know. They should not have jumped to hasty conclusions, and should had better examined other possibilities. They should not have dug their heels in and formed a house of cards ‘consensus’. They were irresponsible, and it’s going to come and back and haunt them.
When I first looked into the argument for AGW, within a few weeks I thought that multi-decadal heat lags from the high solar activity in the early 20th century could have caused late 20th century warming, couple with ocean changes and cycles, and I am an amateur. I looked into the consensus argument and their papers, and found that the consensus consistently ignored this possibility, only ever stating that late 20th century warming couldn’t be caused by the sun because solar activity had not increased during this time. It is a bad argument, because if that was true there would be no delay in the maximum summer temperatures weeks after the summer solstice, and even every single day after noon. Surely they had something else besides this, but actually they didn’t. All you had to do was to extend the idea of a heat lag out to longer times decadal time periods for solar activity, and late 20th century warming could be a possible explanation. You didnt need PHds and lifetime of research to understand it, but perhaps a lifetime of research had so cluttered one’s mind with false ideas and arguments that they no longer even thought of it. If I, as an amateur, could see things that people with PHds and years of experience couldn’t see, then what else were they missing?
It’s now very inconvenient for academics, to use Al Gore’s phrase, that the world has not been warming since the late 20th century. It undermines their entire argument. When they realise that the sun had a lot to do with late 20th century warming in the first place, when one realises that multi-decadal heat lag effects from solar activity could explain the warming of the late 20th century, the whole house of cards is going to gradually unravel. Late 20th century warming by c02 is the entire basis of their argument for catastrophic warming in the future and for strong AGW, that was what got them involved in the first place; if it was from the sun the entire basis of their argument and reason for their existance comes into serious question.
It’s not the first time ‘academia’ has been grossly irresponsible. The early 20th century saw social darwinism and eugenics, not to mention the re-ordering of society through ill conceived ‘communism’, which was in many places and times a widely respected and acceptable field of study. (Richard Piper, an expert of communism in the 20th century, blames communism’s development and success largely on irresponsible ‘radical intellectuals’. Sound familiar? It isn’t a left or right thing, its simply intellectuals of the right and the left being self serving and all high and mighty). But we can make such erroneous exaggerations and mistakes less likely to occur in the future, if we tighten up their own academic standards and accountablility, and let the self-correcting processes of science work themselves out in due course.
Why is June 21, the first day of summer, not the warmest day of the year in the Northern hemisphere? Solar energy is at maximum on that day. Why do temperatures keep increasing even though solar energy is falling after June 21? Surely this is impossible under the teachings of climate science. Rising temperature requires rising solar energy, otherwise CO2 must be the cause.
One of the great disasters of our time has been political correctness and the erosion of free speech, to the point where scientists fear to speak their minds. Instead they spout nonsense that any child of 5 could spot. At which point the children enter the school system to be “educated” and form the next generation of scientists.
The greatest evils of all time have been done in the name of doing good.
Like Midas all Gore touched turned gold,
Now the sun sets on his gleam.
====================
Another way in which the sun and CO2 are treated unequally is in the IPCC’s “positive feedbacks”. The IPCC is happy to accept a near trebling (from 1.2 to 3.2) of the CO2 effect using “positive feedbacks” for which there is no evidence, and, in the case of the cloud feedback, AFAIK there is not even a hypothesised mechanism (they don’t have a clue how it works they just parameterise it into the models). But, as Alec Rawls has pointed out, when it comes to the sun they look at direct TSI only.
Mario Lento;
Let’s call the AGW crowd what they are – science deniers.
>>>>>>>>>>>>>>>
’tis an ugly term, and no more applicable to them than to us. Further, like skeptics, one size does not fit all.
O/T –[snip . . indeed it is, but interesting and should be put up on Tips & Notes . .thanks. . mod]
The reason the True Believers persist with what I would call ignorance is quite simple the cost of being utterly wrong is not high enough and the cost of just be wrong is nil. The cost of this intellectual fraud is less then the cost of the real fraud of the financial markets. These people view themselves as powerful and the powerful have historically paid not real attention to shame. That goes way, way back so why do we expect it to change now.
Alec Rawls…
“The problem is that the models are not being applied to the alternate hypothesis.”
Do you mean ‘other’ hypotheses? The alternate hypothesis ( as apposed to null ) is exactly what is being tested with the GCM’s
About a decade ago now I coined two terms, the first being that we live in the “post-sentient age”.
The second was supposed to be a spoof, the “Theory of Inverse Reality”, in which you take any argument, construct its antithesis and shove-off.
Post-sentient essentially means unconscious. Unaware. Likely unable to follow Alec’s presentation or “Mike’s Nature Trick”.
Most adherents of AGW I speak with have no clue of when they live (possibly the end Holocene). Eyes tend to glaze over pretty quickly when you go through the “lite” version of the last several interglacials. It’s like, so what? It either actually does not matter to them if sea levels were somewhere between 6 and 42 meters higher than present at the end of the last one, or its just that the decision has already been made, for whatever reason, their data banks are full on what they needed to come to their commitment. The no longer aware, post-sentient, hominid.
Like watching a bullet come to rest in ballistic gel ask why they think it is a wise idea to take the pet climate security blanket out of the late Holocene atmosphere. I mean if it’s that good of a climate thermostat why take it out of the late Holocene atmosphere, with the sun gone all quiet on us, at a half-precessional old extreme interglacial?
Are we really smart enough to actually be thinking of eradicating CO2 to whatever concentration, irregardless of whether or not it is the heathen devil gas it is made out to be, with the sun gone all quiet on us, at a ~half-precession cycle old interglacial? We would cancel that vaunted next-glacial-onset insurance policy?
Making the call to strip CO2 from the late Holocene atmosphere might be the very definition of inverse reality. We might actually be so smart as to, at great cost, aid and abet the onset of the next glacial. Re-defining, in the inverse reality way, what it means to be “cool.”
Which might be a good thing.
As The Wise One (H.sapiens) we actually have been here before. We made it through the hotter last interglacial, the Eemian, or MIS-5e, and through two strong thermal pulses right at its very end. And a rag-tag bunch of us made it through the last ~90kyr glacial, finally establishing human civilizations during the Holocene. We lost the Neanderthals somewhere between MIS-7 and MIS-5.
Whatever hominid survives each eccentricity maxima gets thinned out by the post-MPT ice ages. Back in those days only the hardiest of us survived genetically to the present. Which occasions a thought or two as to how well post-sentient hominids are likely to “adjust” to the next natural climate climate tipping point (glacial onset), possibly of their own reality-inverted making.
Where will the next northern hemisphere glaciation grind to a halt? Kansas, again? That will definitely take the Alberta Tar Sands off the market.
What I think Alec has done quite nicely here is point up a not so fine point of current human nature. The ability to stare reality in the face AND keep on blinking and winking. So what if your hypothesis works against you? Are you actually expecting post-sentient’s to notice an inversted reality? Surely not in the post-sentient age of non reality TV!
If next glacial it is to be, with such reasoning capacity as post-sentient’s can muster, I hold great hope for our genus. Who knows what frontiers those that survive the next glacial, whenever it finally tips, and emerge in the next interglacial, assuming there is to be another one, might next interglacial Homos do?
I tend to think glacials have been very very good to us, but they pale in comparison to eccentricity minima http://www.manfredmudelsee.com/publ/pdf/Trends-rhythms-and-events-in-Plio-Pleistocene-African-climate.pdf
The question literally boils down to how well hominids that come to the exact opposite conclusion (inverse reality) will fare for maybe a couple dozen Dansgaard-Oeschger events, which, demonstrably warm things up 8C to 16C in just a few years to mere decades, eventually that warmth decaying back to the cold glacial world?
Take a moment to consider your answer. If you are really in it for the species, then our present climate simply must go on, regardless the cost. But what a crapshoot! Take the heathen devil gas out of the late Holocene atmosphere and you just might tip us into the glacial that inverse-thinking is unlikely to survive! A long time in which bad decisions don’t turn out all that well. Will such thinking survive to the next interglacial? Who amongst us would prefer that outcome?
Which leaves being in it for the genus. Inverse reality thinking just might get frozen-out, and we will find some of ourselves well-preserved in Alpine glaciers next interglacial, like we have late in this one. Assuming, of course, that there will be a next one…….
This leaves all manner of say geo-engineering options available to facilitate the onset of said next glacial. From a genetic perspective, given what is happening anthro-Wise these days, genus filtration (a glacial?) might not be such a bad thing.
Such is how the Theory of Inverse Reality works. Think of it as “let the Wookie win” genetic correctness. I mean this IS all about “our” future, right?
Guest post by Alec Rawls
They just make this highly counterintuitive claim that persistent forcing cannot cause continued warming, as if they actually believe that it is the change in the forcing rather than the level of the forcing that does the warming.
Here we go again: Image TSI was constant for a million years. Then changed suddenly by 1% ans stayed at that higher level for the next million years. You are claiming that during that second million years [and actually also during the first million years] that the temperature [warming] would continue to rise throughout all that time. If a million is too short, make it 100 million.
Thingadonta talks about how we can attribute late 20th century warming to “multi-decadal heat lags from the high solar activity in the early 20th century.”
I wouldn’t put it that way. It’s not a lagged response. It’s an ongoing slow warming from the persistence of the elevated solar forcing (or at least, that’s the hypothesis). There is a rapid temperature response to a step up in forcing, and if the step up in forcing persists, there will also be a medium term temperature response. These different time responses relate to how deep the warming penetrates into the oceans.
The surface layer warms up quickly (the best estimate seems to be less than ten years), which will in turn warm up the next ocean layer. If the elevated forcing persists the temperature differential between the upper layer and the next deeper layer will decrease, slowing the rate of heat loss from the upper layer, causing it to warm further, and this will continue for multi-decades and even multi-centuries.
This continued warming is not a lagged response to the step up in forcing. It is an ongoing response to the ongoing high level of forcing. It’s important to keep that straight, otherwise one can fall into the mistake all these “top scientists” are making, where they actually seem to think that temperature change is driven by the change in the forcing rather than the level of the forcing.
Usoskin’s solar estimates are “grand maximum” even if post-1945 Waldmeier-era sunspot counts are reduced by 20% as Leif Svalgaard urges…
You seem to be ignorant of the fact that there are two sunspot series in circulation. The Official [or International Sunspot Number – which has the Waldmeier problem] and the Group Sunspot Number suggested by Hoyt and Schatten. The Group Sunspot Number is too low by up to a factor of two going back to the 18th century. In that [artificial] light the Grand Maximum emerges.
Now, you could claim that the GSN must be the correct, or at least preferred, one to use since it provides a convenient explanation for recent warming. And, indeed, many people are making that claim, but that seems circular to me. Perhaps your bar for valid science is lower than mine. If so, fair enough, it takes all kinds of people….
Alec Rawls, you ask:
“even if there were some substantial mechanism of enhanced solar forcing it couldn’t be responsible for late 20th century warming because solar activity was roughly constant from 1950 to 2000.”
The constancy is the mechanism:
http://vixra.org/pdf/1108.0004v1.pdf
This is a preliminary version of David’s paper; it is currently being checked and revised.
@ferd berple says:
January 9, 2013 at 9:59 pm
Why is June 21, the first day of summer, not the warmest day of the year in the Northern hemisphere? Solar energy is at maximum on that day. Why do temperatures keep increasing even though solar energy is falling after June 21? Surely this is impossible under the teachings of climate science. Rising temperature requires rising solar energy, otherwise CO2 must be the cause.
+++++
Amen Ferd Berple.
Now maybe you can talk with Leif and Mosher. Of course their response will be some overly detailed or ambiguous rant. You may even hear we are not qualified to understand.
I work in process control automation as an engineer, project manager, and wear many hats including one developing new business. I sell things that have not been invented yet, and then develop solutions marrying automation with solid scientific and engineering principles. This usually requires working with people smarter than me in a team where I am responsible for the overall outcomes.
I have NEVER had a welding course or welding torch in my hand! Yet worked to develop $650K welding machines which are sold to nuclear plants and even to GE Nuclear. I’ve had to devise new ways to weld 6 foot DIA lids onto 18 foot tall spent nuclear fuel canisters. I’ve developed weld programs and welding process techniques to easily seal these $750K spent fuel canisters –all this while the actual “nuclear welding experts” who are qualified to weld essentially say – “yes that is good… no that is bad.”
I’ve worked with people in solar heating automation where I had to explain to them cold junction compensation when it comes to thermocouples… while convincing them to use platinum RTDs instead. As well I had to explain basic thermodynamic principles so that they could understand how much energy they were pumping, while deciding where to put the warmed fluids to do the most efficient work (heat the pool, house or hot water etc).
I’ve helped to implement robotics controls on other companies’ wafer handling robotics mechanisms to make them work better than using their own factory control boxes. Under our control, they perform autocalibration – which means they can move about and learn their way around a tool by finding feducials via torque sensing algorithms of closed loop servomotors while discerning reflected inertia in ways that look different than stiction, as well as taking advantage of existing laser sensors which might be there –and so any robots under our control could pick and place 300mm si wafers without having to be manually taught by an operator for several hours!!! Good automation makes most robots able to be self taught in minutes… and with more precision… and accuracy than jogging around manually and teach pick & place locations.
The point is: When I delve into new science, if it doesn’t work I don’t get paid. I go hungry. I hate it when arrogant “climate scientists or specialists” tell me or others that I/we are not a (fill in the blank scientist) therefore I/we would not understand.
Here, at WUWT, I am humbled by the intellect here; while at the same time can usually tell when I am being duped.
The odd thing is that though Mosher and Leif are very highly educated –and very smart; they have the same quality of some bad engineers that get lost in the details and fail to see what’s real and true regardless of reason, logic and outcome. They are impossible to work with. They are religious about their beliefs and often times get everything wrong and waste a lot of other peoples’ money with their heads buried in ideology. Yet they hold higher level degrees.
Leif and Mosher, my assumption is that you do not get paid by someone in the private sector who’s business lives or dies by your being right. Still I think you are smart as hell.
The arguments being pandered in the opening statements are ludicrous.
The only way those statements can be true is if THE ONLY VARIABLE IN THE ENTIRE EARTH-SUN-MOON-SOLAR SYTEM COMPLEX OPEN SYSTEM IS SOLAR ACTIVITY.
This is quite clearly twaddle, so let’s list the possible things which could also vary and affect global temperature:
1. The stable state in the mesosphere or atmosphere may have shifted to a new state with different responsiveness to solar/cosmic ray inputs. What, after all, was the effect of CFCs on that? Any other known impacts on ozone either in the Northern- or Southern Hemispheres??
2. The Great Pacific Shift of 1977 may have marked a major shift in the distribution of oceanic heat, thereby affecting global temperature on a decadal scale, especially given the striking preponderance in the frequency and intensity of El Niño episodes since 1977. One wonders whether a 30 year period showing equally frequent and intense La Niña episodes would drive temperatures back down to 1975 levels?? Will the shift of AMO to cold mode see the start of that???
3. There may be cycles in earth-crust-ocean interactions which affect ocean heat content which we are as yet unaware of. A shift between modes may have occurred in the past 40 years. We’re now seeing evidence emerging of tectonic activity linked to solar-atmospheric geomagnetic phenomena, so why not similar events less visible to the naked eye?
4. We have still not identified the drivers of the multi-centennial climate beats which caused the Roman Warm Period, the Fall of Rome, the MWP, the LIA and the modern warm period. The 200 year warming since 1812 is the manifestation of that driver, just as the 200 year cooling down to 1650 was the reverse. One wonders whether the oceanic conveyor belt system has anything to do with it, since this will have profound effects on the boundary of North Atlantic polar ice, the climate of NW Europe etc etc.
5. The ‘loss of correlation between solar cycle length and temperature since 1970’ is an artefact of temperature data gathering and calculation methodologies. We all know what has been going on in that arena, what I’ve not seen is whether that affects the solar cycle-length-temperature graph….
6. Et al, et al, et al.
Now it may be that, behind firewalls, all these issues have been comprehensively dealt with using science which is rigorous, dispassionate, skeptical and which has stood up to challenge. If so, the general public would welcome a non-technical but exhaustive documentation of that to put those arguments to bed.
I have my doubts myself.
But it’s best not to make judgements without being armed with all the facts…..
It is very clear that none of the so-called scientist contributors to the IPCC understand heat transfer. They do not understand heat transfer by radiation (note the S_B equation only applies to surfaces in a vacuum), heat transfer by convection (natural which involves the Nusselt, Grasshof and Prandtl numbers and forced which includes wind velocity or the Reynolds number) and heat transfer by phase change (in this case evaporation and and condensation of water)
The best thing would be to disband this group of incompetents
@davidmhoffer says:
January 9, 2013 at 10:21 pm
Mario Lento;
Let’s call the AGW crowd what they are – science deniers.
>>>>>>>>>>>>>>>
’tis an ugly term, and no more applicable to them than to us. Further, like skeptics, one size does not fit all
+++++
Agreed… you are correct David. I was being a bit of a jerk. I just now realized I was writing while peeved as hell. I’ll stop now.
“indirect solar forcing,” or “enhanced solar forcing,” or “solar amplification,” all just meaning “more than TSI alone.”
Try the variation in ultraviolet radiation. A look at the absorption spectrum gives the answer.
http://wattsupwiththat.files.wordpress.com/2008/06/atmospheric_spectral_absorption.png
http://www.globalwarmingart.com/images/7/7c/Atmospheric_Transmission.png
All of the ultraviolet light is directly absorbed by oxygen and ozone up to over 340 nanometers. These wavelengths photons are far more energetic than an IR photon. Since all of the energy is absorbed directly in the atmosphere any variation of that energy flux directly effects the amount of energy in those molecules.
We already know that in the cycle 23/24 minimum that the exosphere contracted to its lowest altitude since the dawn of the space age when we could accurately measure its density due to its effect on satellites (drag). We have very little idea about what happens to the energy level in the atmosphere at altitudes between 25 km and 150 km as these altitudes are too high for balloons and too low for a satellite to sample.
Some papers (Zhang 2007) squawk about how the ozone hole cools the atmosphere but he never takes into account the fact that a reduced level of incoming energy from the sun does the same thing. Studies have shown up to 50% variation in the energy at these wavelengths. We need more actual information, data, and sampling at these altitudes, not more models and arm waving.
Nick Kermode asks: “Do you mean ‘other’ hypotheses? The alternate hypothesis ( as apposed to null ) is exactly what is being tested with the GCM’s”
Yeah, I wasn’t using “alternate hypothesis” as a term of art. I just meant alternate to the CO2-warming hypothesis. To avoid confusion, I should call the solar-warming hypothesis “the leading competing hypothesis” or something like that.
Mario Lento says:
January 9, 2013 at 11:25 pm
Leif and Mosher, my assumption is that you do not get paid by someone in the private sector who’s business lives or dies by your being right.
As for me you are wrong. Stanford is a private University and I get payed for being right [research being accepted or at least valid]. For about a decade I worked in private industry and that business’ life was very dependent on my being right.
And note: I don’t believe we need a “grand maximum” to warm the climate. When you have a period of several grand minima in relatively close proximity in time, a return of a long run of average sized cycles would be enough to warm things back up over time, if the solar wind / UV would have a climate impact. We have been nearly 200 years without a very “weak” cycle and it now looks like we might get at least two consecutive weak ones. What I meant to say in my earlier comment was that I would not expect the climate to instantly warm all at once in response to a return to normal cycles after about 500-600 years or so of many weak cycles as we saw in the LIA.
Mario Lento says: January 9, 2013 at 11:25 pm
“..I work in process control automation as an engineer…”
Just as an aside:
Many years ago I came to the conclusion that amongst all the smart, organized, get it done people I have met, the process engineers were always right at the top of the list in whatever field they had ventured into.
Good one Leif. You jump from your usual assumption of near-instantaneous equilibration and no hysteresis to imagining equilibration that takes a hundred million years, managing to keep your eyes at all times as far as possible from the intermediate time scales that are the subject of the post. Bravo. If only the IPCC had the foresight to do the same, but they went and blew it, doing commitment studies that on the time scale of multiple decades to multiple centuries show a substantial continued temperature response to a step change in forcing. What blunderers. They let the cat out of the bag.
@Leif Svalgaard
[snip . . read the site rules . . mod]
But I am willing to help. As soon as you’re ready to extricate yourself from yourself, give me a call and I’ll give you a hand.
So in your view Leif, the later GSN numbers need to be reduced by 50%? Going how far back?
I believe there is starting to accumulate a body of evidence that changes in circulation at high latitudes can result from changes in solar UV due to changes in heating of the stratosphere. There is correlation, but there isn’t a causal mechanism that has been 100% nailed down yet. We see that when the sun goes quiet the EUV drops considerably while TSI overall is little changed. So it isn’t so much the total amount of energy so much as it is the mix of energy across the spectrum. Different wavelengths of light have different impacts to different parts of the Earth.
It has been demonstrated by experiment that particles with the energy of GSRs can increase the availability of atmospheric aerosols. We are still waiting for data to show any changes in cloud cover against changes in neutron counts measured here on Earth but that is also a potential avenue. So it may not be ONE silver bullet. It might be two or more and they might work in different ways. A combination of stratospheric cooling, reduced ozone production, increases in GCRs, potential “whitening” of Earth by even as little as 1% taken together at the same time might have considerable impact over areas where a lot of people live and a lot of crops are grown.
All it takes is movement in location or weakening of a persistent pressure system to greatly change the weather across central Europe Wind patterns changing from a zonal flow to a meridional flow might be enough to cause severe cold and storminess to drop across central Europe without even causing a great change in GLOBAL average temperature. Just changing where the cold air is might be enough. Or a weakening of the polar jet to allow polar air to slip a little farther South in winter could make a huge difference.
We are getting ready to experience a very cold period in about 10 days time stretching from China to Europe with temperatures in Moscow forecast to be some 30 degrees below normal according to Joe Bastardi over at Weather Bell. He is talking about weather we haven’t seen “in the last 50 years”. Today there was snow across the Levant with a foot of new snow in Jordan and Lebanon. Athens schools were closed due to snow. It is snowing in Damascus. Nearly 200 have died in India from cold in the past month. The interior of Alaska is seeing tremendously cold weather this winter. This isn’t limited to one small part of the globe. 2010 was a cold winter in Europe, too and now it looks like 2012 might turn out worse across a larger area (but maybe not the same areas as 2010).
We certainly aren’t seeing barbeque summers and warmer than normal winters.
@markx says:
“Just as an aside:
Many years ago I came to the conclusion that amongst all the smart, organized, get it done people I have met, the process engineers were always right at the top of the list in whatever field they had ventured into.”
Thank you… I think it’s because we are motivated to implement science that works, otherwise we don’t get paid, for long. We actually have to solve real problems in economically sound ways. The academics often times (certainly not always) believe their own hype more than what’s real.
I am incredibly fortunate to get to work with really smart people across multiple disciplines –and often times, blow their minds with what is possible. Imagine, someone with no welding expertise, manages to help specify, design, operate and train expert welders right there on above nuclear reactor spent fuel pools on how to make better production welds than virtually anyone else on the planet. I credit the brilliant engineers all doing their part so that I can play with expensive toys and see what happens.
Mario
@Alec Rawls: You are on the right side of science. Your statements are cogent, and full of logic with good clear explanations.
Thank you Anthony for including his writings for us to learn from.
I’ve been going against the tide since Al Gore’s movie made me a skeptic… it’s amazing how easily other people can be hoodwinked by having watched that movie without having a ton of questions!
WUWT has given me hope that there are people who understand what’s going on – and have stuck out their neck diligently against an angry foolish public.
You’re true soldiers Anthony and Alec.
If one subtracts properly calculated effects of solar and GCR forcings from observed temperature,
the result is largely like a sawtooth wave, presumably representing the echo effect of El Ninos returning
prior ocean heat to the atmosphere. (Much of temperature effect from forcing change is about
immediate; a portion is effectively delayed by several years as far as the troposphere is concerned; and another portion is delayed by longer, being the real world where matters are not simple like everything being exactly the same X years delayed in all ocean layers at all depths simultaneously).
I haven’t made up a fancy illustration of that yet for posting here. However, if the reader who is among the
majority who have never actually seen the strikingly blatant solar/GCR cycle versus humidity
correlation and many other illustrations in http://s7.postimage.org/69qd0llcr/intermediate.gif
(click to enlarge), I’d encourage seeing such as a start.
If I recall correctly, other applied biases of the IPCC include using a higher climate sensitivity
on calculated radiative forcings from GHGs than from TSI per W/m^2 (and that is while ignoring
the cloud cover change, GCR influenced, which is more W/m^2 variation than the TSI variation,
like, for instance, http://www.drroyspencer.com/2011/05/indirect-solar-forcing-of-climate-by-galactic-cosmic-rays-an-observational-estimate/ illustrates).
Henry Clark says:
January 10, 2013 at 1:09 am
http://s7.postimage.org/69qd0llcr/intermediate.gif
—————————————————
Impressive correlations.
Lies, unraveled.
Thanks for the article. I have a question about the CO2 commitment models. Are you saying that in their commitment models the atmospheric CO2 fraction remains constant (eg, at 400ppm)? I thought the forcing was directly proportional to the CO2 fraction in the air, and perhaps their idea of constant means a constant rate of emission and so wouldn’t the CO2 fraction still increase with time, but at a slower rate?
“It is very clear that none of the so-called scientist contributors to the IPCC understand heat transfer. They do not understand heat transfer by radiation (note the S_B equation only applies to surfaces in a vacuum), heat transfer by convection (natural which involves the Nusselt, Grasshof and Prandtl numbers and forced which includes wind velocity or the Reynolds number) and heat transfer by phase change (in this case evaporation and and condensation of water)
The best thing would be to disband this group of incompetents.”
Yes, none of them could pass a heat transfer exam. It’s a travesty.
I guess I am revealing my age here, but whenever you read about the models’ addiction of professional ‘climate scientists’ and their forecasts of Thermageddon, are you not reminded of Dr Strangelove (played by Peter Sellers) and his surreal view of the world’s future?
Since 2000 10 months of the year in Central England are trending down a degree or two Celsius. March and April are the only months trending up, by about a degree. December is trending down by 3.5 degrees celsius and February by 2 degrees.
Is it just a coincidence that this is happening during a low sun spot cycle?
Alec,
Whatever these top scientists say, they are quietly doing the research into the ongoing GCR link. In four days time, NASA’s ATTREX study will begin flying a drone over the equatorial east Pacific and, later, west Pacific:
http://espo.nasa.gov/missions/attrex (but don’t click on it yet!).
They are quite coy about the fact that they have NOAA and Goddard Space Flight Centre (of which GISS is a subsidiary) in the project. What’s more they are looking, among other things, at water vapour and ‘radiation’. This link isn’t very informative about this, but I included it if anyone wants to check ATTREX exists. I only know of the water vapour and radiation part of the research because I’m on the NASA email notification list. The email (recieved today) went into more detail but was very careful not to say GCR let alone GCR-water vapour link. I posted the email on WUWT’s tips page today (10th January 2013) if anyone wants to read it. I mark eleven places in the email which point to the GCR subtext and also to attempts to play it down. I think it will make a good article because if they are looking at the GCR link we need to hold their feet to the fire on what they actually find. The data could get mentioned-yet-glossed-over if a substantial link is found…just like Sherwood mentioned but glossed over the results in the 3 GCR link papers in chapter 7 of AR5.
I return to my central heating analogy. Unless these guys have changed physics (due to AGW I suspect). It is 0.0°C outside, I come home at 6pm. The house is cold at around 1.0°C. I turn the central heating on, the thermostat being set at 18°C (to reduce my carbon footprint to protect the penguins/whales/polar bears/Gaia, etc). Now, if they are right & I am wrong, the house should heat up immediately to 18°C. Unfortunately it does not. Due to the various thermal/insulation properties of the construction materials used to build my house, the thermal efficiency of the boiler, the pump, the radiators, the thermostatic valves, the thermal efficiencies of the windows/doors/draft exclusion, the actual size of property etc, even the efficiency of the fuel used to run the boiler be it wood/ coal/oil/gas//composite/other, etc. It may take anything up to an hour or more to reach the desired 18°C internally, assuming the temperature outside doesn’t drop further in the meantime!!! The boiler is running at constant output but is inefficient at first because it needs to heat itself up to make the most of that constant output. Surely there is a similar process on a much grander scale for the Earth & its climate & its response to external & internal factors that actually do drive the climate! I just cannot accept one tiny trace gas can accommodate all the thousands of parameters involved in climate, positive & negative! The IPCC admit openly if one looks, that they claim they know all about CO2, having a very high level of scientific understanding, yet knows very little about the Solar forcing having a very low level of scientific understanding!! As they say themselves……………”We don’t know exactly how element ‘A’, the Sun, affects element ‘B’, the Earth & its Climate, but we know for a fact that element ‘C’, manmade CO2 overpowers element ‘A’!” The most ridiculous thing I have ever heard ever! I wouldn’t buy a used car from these people, no disrespect to secondhand car salesmen/women, your integrity is assured!
That means no change in forcing going forward, just continued forcing at the present “high” level.
Not that right! If CO2 emissions would stabilize at their 2000 level the forcing would continue to increase because CO2 would continue to accumulate [at the 2000 annual rate].
To reduce the forcing one should decrease the CO2 atmopsheric concentration, and this is only possible if emissions were stopped.
This being said, it remains open to know if the impact is 0.6 °C per doubling of CO2 with which we can live with, or another much higher unrealistic number.
Ahem:
“The influence of the sun has been discounted in the climate models as a contributor to the warming observed between 1975 and 1998. Those who support the theory of anthropogenic global warming (AGW), now known as anthropogenic climate change so that recent cooling can be included in their scenario, always deny that the sun has anything to do with recent global temperature movements.
The reason given is that Total Solar Irradiance (TSI) varied so little over that period that it cannot explain the warming that was observed. I don’t yet accept that TSI tells the whole story because it is ill defined and speculative as regards it’s representation of all the different ways the sun could affect the Earth via the entire available range of physical processes. (Since writing this article the effect of UV and EUV on ozone quantities has come more to the fore).
It is true that, as the alarmists say, since 1961 the average level of TSI has been approximately level if one averages out the peaks and troughs from solar cycles 19 through to 23.
However, those solar cycles show substantially higher levels of TSI than have ever previously occurred in the historical record.
Because of the height of the TSI level one cannot simply ignore it as the IPCC and the modellers have done.
The critical issue is that having achieved such high levels of TSI by 1961 the sun was already producing more heat than was required to maintain a stable Earth temperature. On that basis alone the theory of AGW cannot be sustained and should now die.
Throughout the period 1961 to about 2001, there was a steady cumulative net warming effect from the sun. The fact that the TSI was, on average, level during that period is entirely irrelevant and misleading.
It is hardly likely that such a high level of TSI compared to historical levels is going to have no effect at all on global temperature changes and indeed during most of that period there was an enhanced period of positive Pacific Decadal Oscillation that imparted increasing warmth to the atmosphere. My link below to article 1041 contains details of my view that the sun drives the various oceanic oscillations which in turn drive global temperature variations with all other influences including CO2 being minor and often cancelling themselves out leaving the solar/oceanic driver supreme.
It could be said that the increase in TSI from a little over1363 to a little under1367 Watts per square metre over the 400 year period shown is pretty insignificant. However a square metre is a miniscule portion of the surface of the planet so that even a tiny increase or decrease in the heat being received on average over each such tiny area translates into a huge change in total heat budget for the entire planet. The smallness of the apparent range of variation is a function of the smallness of the area subdivision used rather than an indication of insignificance. It is fortunate for us that the sun is not more variable.
The observation of a historically high level of TSI from 1961 to 2001 tends to fit with the theories set out in my other articles about the real cause of recent warming and the real link between solar energy, ocean cycles and global temperatures.”
http://climaterealists.com/index.php?id=1396&linkbox=true&position=1
“The Death Blow To Anthropogenic Global Warming”
June 4th 2008.
thingadonta says:
January 9, 2013 at 9:58 pm
………They should have never jumped to the very convenient academic conclusion that society had to be saved by academia. They should have said that they don’t know. They should not have jumped to hasty conclusions, and should had better examined other possibilities. They should not have dug their heels in and formed a house of cards ‘consensus’. They were irresponsible, and it’s going to come and back and haunt them………
And what do you think that the average man and woman in the street will do when they realize that the scientists got it so wrong and the politicians used that – to extract huge taxes, kill industries, make fortunes – and leave the average man and woman in the street so much worse off with limited food and with their grandparents dying of cold in fuel poverty while the ‘green czars’ like Hansen and Gore live it up on their money? Does anyone really think that the population will ‘go quietly into the night’ with a collective ‘shrug’? When you say things will come back and haunt them; I would say that there will be some high profile scientists and politicians that may need to ‘do a Maurice Strong’ and decamp to one of the countries that won from the ‘nature trick’ they pulled on the taxpayers. There could be ‘Tahrir Square protests’ coming to cities near you – I don’t think this will be a gentle landing.
Alec Rawls: Climate models are nonsensical when it comes to the warming of the oceans, so using them as reference does not help your cause. Let’s discuss Ocean Heat Content, because if there was any mythical influence of CO2 and a solar lag in the warming of the oceans, it would show up there. Let me borrow some graphs from my book.
The ocean heat content for the tropical Pacific warms immediately during the 3-year La Niña events:
http://i48.tinypic.com/wcilgk.jpg
And again immediately during the 1995/96 La Niña event:
http://i45.tinypic.com/1zgc2s8.jpg
Likewise, the ocean heat content for the tropics as a whole warm, with a 9-month lag, during the 3-year La Niña events:
http://i50.tinypic.com/egaj4w.jpg
The warming of the ocean heat content for the extratropical North Pacific is dependent on a 2-year climate shift in 1989-90. Without that shift, the ocean heat content for the extratropical North Pacific would cool:
http://i45.tinypic.com/1z1aiix.jpg
And if you’re wondering how a shift in sea level pressure impacts ocean heat content, the shift in sea level pressure reflects a change in the wind patterns.
That same shift is also evident in the sea surface temperatures for the extratropical North Pacific but it occurs a year earlier.
So where’s the lag and where’s the solar influence? In other words, show me the data.
Bob.
Alec may have his own comment but mine would be that for periods less than 60 years the solar effect is hidden by shorter term variations.
The longer term solar background trend only shows up in successive positive or negative phases hence the upward stepping you noted from one positive phase to the next during the 20th century.
I expect there would have been similar downward stepping from MWP to LIA.
Leif Svalgaard says:
January 9, 2013 at 10:59 pm
Here we go again: Image TSI was constant for a million years. Then changed suddenly by 1% ans stayed at that higher level for the next million years. You are claiming that during that second million years [and actually also during the first million years] that the temperature [warming] would continue to rise throughout all that time. If a million is too short, make it 100 million.
And what is your field of study.
Most of the people here are really intelligent but miss the forest for the trees. These so called scientist know its not warming they don’t give a rats behind. They hate people and society and will say or do whatever they can to control you. The Hansons and Gores of the world consider themselves special and most everyone else worthless. When global warming goes away they will find another cause.
Stephen Wilde says: “Alec may have his own comment but mine would be that for periods less than 60 years the solar effect is hidden by shorter term variations.”
Show me the data. Otherwise, you’re simply speculating. Right now the data disagrees with your assumed long-term effects. That is, reductions in cloud amount associated with La Ninas provide immediate responses in ocean heat content. It may take a while to redistribute that warm water through El Ninos, but the response of the tropical Pacific to ENSO does not lag by any appreciable time period–months, if at all–not decades.
Alec Rawls says:
January 10, 2013 at 12:23 am
So in your view Leif, the later GSN numbers need to be reduced by 50%? Going how far back?
As with the International Sunspot Number, it is better to increase the older number. This has to be done for all times before 1882. http://www.leif.org/research/What-is-Wrong-with-GSN.pdf
Stephen Wilde says:
January 10, 2013 at 3:17 am
I don’t yet accept that TSI tells the whole story because it is ill defined
No, TSI is extremely well defined: the total amount of radiation we receive from the Sun.
However, those solar cycles show substantially higher levels of TSI than have ever previously occurred in the historical record.
Again, No. There is no evidence of such a ‘substantial higher level’ than ever before.
The observation of a historically high level of TSI from 1961 to 2001 tends to fit with the theories set out in my other articles
Since there is no such high levels, does that invalidate your theory?
Are you implying it should be possible to create a GCM with enhanced solar forcing that will perform as poorly at current GCMs?
Leif:
i) Taken out of context. Read the entire sentence.
ii) Article written prior to your ironing flatter of the historical record. Nonetheless the general shape of the record has been preserved though you have raised the 1700s to a similar level to the late 20th century.The dips in activity still correspond with cooler spells as modulated by the 60 year Pacific Multidecadal Oscillation.
iii) TSI from 1961 to 2001 was higher than ‘average’ but of course you do know that it is other aspects of solar activity that I have since proposed as causative of circulation changes.
So as far as I can see my hypothesis remains intact and apparently has now been ‘adopted’ by NASA.
Good point Alec. I’ve been trying to make the same one for several year. And there is another element, that combined with the solar activity, explains the temperature curve fairly well. Have a look at the ENSO chart from about 1976 to 1996.
http://www.esrl.noaa.gov/psd/enso/mei/ts.gif
Bob Tisdale says:
January 10, 2013 at 5:42 am
The relevant data is your own observation of upward stepping in global temperatures.
Short term data often ‘disagrees’ with the long term efects.
I understand what Alec is doing but I think the effort is misplaced. I have read Leif’s claims and I agree that the sun hasn’t been in any grand maximum. Over the last 3 centuries there has been a small warming due to a slightly stronger sun that pulled us out of the LIA. We have reached an equilibrium state.
So, if we remove the problems due to invalid temperature adjustments, siting problems and UHI from the temperature record, I believe the true data shows almost no warming at all during the 20th century. This fits perfectly with Leif’s new sunspot count. The variation we see is due to the oceans.
The entire cAGW mess is based on positive modes of the PDO and AMO. We won’t see that again for decades while we may see a small reduction in TSI as the sun goes quiet. This will lead to cooling.
Stephen Wilde says:
January 10, 2013 at 6:52 am
it is other aspects of solar activity that I have since proposed as causative of circulation changes.
Since the first ones didn’t work one apparently has to look around for something else, ignoring the falsification.
Leif said:
“Since the first ones didn’t work one apparently has to look around for something else, ignoring the falsification.”
The link with sunspots is good enough in broad terms but other variables are better.There has been no falsification even using your revised sunspot numbers.
Something caused the poleward zonal jets and reduced cloudiness during the late 20th century warming spell.
We are now seeing more equatorward zonal jets and increasing cloudiness with the less active sun.
The difference between MWP and LIA air circulation patterns was similar but more pronounced.
Ignore it if you will but there is a clear case for the sun to answer.
Whoops.
Should read:
” We are now seeing more equatorward meridional jets and increasing cloudiness with the less active sun”.
“there are two sunspot series in circulation. The Official [or International Sunspot Number – which has the Waldmeier problem] and the Group Sunspot Number suggested by Hoyt and Schatten.”
Imagine solar scientists counting teenagers’ pimples… LOL
@Alec – If you think a GCM would confirm your ideas, why don’t you just run it yourself? I’m pretty sure all the code and data are freely available, so don’t even have to break your word to use them. You’re an IPCC AR5 reviewer, right? You’ve got climatology and data chops, right? Just run the thing yourself, and publish the answer here, and then in Science, Nature, GRL, etc.
Leif Svalgaard says:
“Since the first ones didn’t work one apparently has to look around for something else, ignoring the falsification.”
Ignoring the falsification would be to NOT look around for something else, kind of like the CAGW crowd refusing to look at anything else even though the models exaggerate warming, i.e.: failed.
Did they write 320% sea level rise? Tell me they are joking. A strict interpretation would have the oceans up by 18,000 * 3.2 WOW, we’d all better get on NUCLEAR POWERED AIRLINERS for the rest of our lives! EVERYTHING will be covered. Tell me it ain’t so that so called “experts” are this dull and slow to make a trivial mistake such as this. (Wait, NO, remember the Himalyan glaciers gone in 35 years? WHOOPS, “typo”, (by 17 times)..we meant 350 years…remember that?)
Stephen Wilde says:
January 10, 2013 at 7:45 am
” We are now seeing more equatorward meridional jets and increasing cloudiness with the less active sun”.
Actually not: http://www.leif.org/research/Cloud-Cover-GCR-Disconnect.png
Let me see if I have “boiled this down” correctly:
1. Climate scientists claim that if CO2 concentration in the atmosphere were to remain at current “elevated” levels (around 400ppm) with no further increase, we would still have “warming in the pipeline” so continued warming would be expected even though the CO2 concentration leveled off.
2. Climate scientists claim that even if solar activity was very high from 1920 – 2000 compared to historical norms, the solar activity was statistically “level” throughout this 80 year time period, so after the initial increase in activity around 1920, all warming would have been essentially instantaneous, and there would have been no further “warming in the pipeline after an initial burst.
So, apparently they would have us believe that if variable A remains at an ELEVATED BUT CONSTANT LEVEL, warming will continue, but if variable B remains at an ELEVATED BUT CONSTANT LEVEL, warming will cease after an initial burst.
Yeah, ok….
So, what I think Alec is basically saying is that since the above claims in #1 and #2 are directly contradictory, one of the two claims MUST BE WRONG, and yet the “climate scientists” claim that both #1 and #2 are correct statements, which means that the “climate scientists” are talking nonsense.
Is that about right?
crosspatch says:
January 9, 2013 at 9:10 pm
“The duration and magnitude of warming from 1910 to 1940 was very close to the duration and magnitude of warming from 1975 to 2005. The first episode of warming happened when CO2 emissions could not have possibly been the cause.”
There’s more, crosspatch: If CO2 were forcing elevated warming in the latter period, then the 1975 to 2005 series should differ, i.e. be longer and stronger. If not, then CO2 rise is not a central factor in the warming. Do we have earlier stretches in the 1800s of the same magnitude and duration – this would definitely falsify the CO2 role as the major actor.
John West says:
January 10, 2013 at 8:44 am
Ignoring the falsification would be to NOT look around for something else
This is a valid argument if you assume a priori that the must somehow be the cause. Otherwise not.
Gary Pearse,
Exactly right. This chart shows that the warming earlier in the last century was identical to the most recent warming. If CO2 had a measurable effect, the recent warming would have been greater. It was not.
This chart [by Phil Jones, an arch warmist] goes back to 1880, and shows that prior warming trends were no different than the recent [natural] warming. Again, CO2 had/has no measurable effect on global warming.
You don’t need to use sunspot counts, there are other things that can be used. F10.7 flux for example:
http://sol.spacenvironment.net/~spacewx/data/F107_5_cycle_v2_34.jpg
Notice the weak cycle corresponding to cooling in the 1970s. then two strong cycles and a slightly weaker one in 23 when temperatures started to level off. F10_81:
http://sol.spacenvironment.net/~spacewx/data/F10_81_5_cycle_v2_34.jpg
Surfer Dave asks: “perhaps their idea of constant means a constant rate of emission.”
That’s a different commitment scenario, which they also run. I have referenced the “constant composition” scenarios (which would only actually occur if the rate of GHG emissions fell to the level at which GHGs are removed from the atmosphere).
crosspatch says:
January 10, 2013 at 9:44 am
You don’t need to use sunspot counts, there are other things that can be used. F10.7 flux for example:
http://sol.spacenvironment.net/~spacewx/data/F107_5_cycle_v2_34.jpg
Notice the weak cycle corresponding to cooling in the 1970s.
Rather note the strongest cycle of them all corresponding to the cooling in the 1950s:
http://jonova.s3.amazonaws.com/graphs/hadley/Hadley-global-temps-1850-2010-web.jpg
So what I would like to know is how a physical model of a real system, can predict the values of future noisy (and chaotic) behavior. That HadCM3LC model in gray predicts a big downward spike (like no other model) in the next couple of decades, and then two more such wild swings in about 100 years. What is it that gives this (or any other model) any credibility at all, compared to the WAG model ?
We are repeatedly told, that the GHG effect is akin to putting on a sweater, or putting a blanket on your bed; both of which slow down the rate of escape of “heat” energy in the case of the blankets, or LWIR EM radiation in the case of GHG.
Sorry, they are not the same, not even close.
In the case of the blanket/sweater analog, the energy source (chemical) is inside the enclosure, and when the chem E is converted partially to waste heat, thereby increasing the local temperature, the temperature can increase until the temperature gradient across the thermal barrier is able to maintain a rate of heat conduction that matches the rate of heat production inside the enclosure.
In the earth case, the driving energy source, which can create heating, is OUTSIDE the “enclosure”, ie the atmospheric blanket. There is no significant energy source inside the blanket. (geothermal and natural and anthropogenic chemical or nuclear sources, being taken as negligible).
So the external energy source, (the sun) has to penetrate the blanket (well its EM radiation energy does) inorder to create any heating inside the enclosure; which then results in LWIR emission from the heated earth, being radiated through the blanket, along with sundry conduction/convection/ evaporation/whatever transports of actual heat energy.
The latter thermal transport processes are highly unidirectional. Heat transport from the upper atmosphere to the surface, is virtually non existent, and is contrary to the second law anyway.
But the real problem is that the original energy source (solar spectrum) is also greatly impacted by the blanket. Perhaps 25 percent of the radiant energy from the source, is captured by the blanket, or directly diverted via scattering, back out to space. (blue sky light, and cloud scattering).
So the warming of the atmospheric blanket is as much a consequence of the external energy source, as it is a subsequent impeding of the outgoing LWIR emission.
And with 70+ percent of the surface (and a greater fraction of the tropical surface) being water, the effect of LWIR emission from the blanket to the surface is rather puny, and results mostly in further evaporative cooling, rather than energy storage in the earth.
We can study all the various temperature variation phenomena with altitude, and stratospheric heatings and the like, but in the end, a warm atmosphere, no matter the warming mechanism, is a rather weak contributor to the net energy of the earth, and in no way does it resemble the sweater/blanket analogy.
Leif:
As regards the period 1999 to 2007:
“Earthshine and ISCCP-FD reflectances show a significant increase before flattening and holding the increase. This implies a reduction in the net sunlight reaching Earth.”
from here:
http://bbso.njit.edu/Research/EarthShine/literature/Palle_etal_2008_JGR.pdf
I think it was very wrong of you to try to rebut my point by simply referring to a graph comparing cosmic rays to low cloud alone.
It is as though you wished to confuse readers.
Stephen Wilde says:
January 10, 2013 at 7:45 am
” We are now seeing more equatorward meridional jets and increasing cloudiness with the less active sun”.
Actually not: http://www.leif.org/research/Cloud-Cover-GCR-Disconnect.png
################
ya Leif, I have found that every time you try to pin Wilde down to numbers he is either wrong, changes his tune, changes the subject, or says things so vague that you suddenly realize that he is a lawyer
“Rather note the strongest cycle of them all corresponding to the cooling in the 1950s”
Another disingenuous post by Leif.
He knows full well that the PDO was negative at the time which allowed a slight cooling to start on the downslope from high solar cycle 19 which was then consolidated during lower (but still high) cycle 20.
I don’t think that is playing fair. It is unscientific to try to make a point whilst disregarding data which is inconvenient.
It is evident from the new CRU model and comments made by scientists there that they finally realize that ‘internal natural forcings’ (ocean sst cycles} are at least as strong as GHG forcing. Attributing the late twentieth century warming to solar forcing at this point is speculative only because the mechanism is only slowly being understood. The elephant in the room right now is the cooling of the Eastern Pacific, the southern ocean and southern Atlantic ocean. It is these cyles along with the positive AMO that could now likely be attributed to the late twentieth century warming. We win simply by proving that the twentieth century warming is likely due to internal forcings.
The global climate system is very complex, still I think solar oscillations are the main driver, only a small part could be internal variations, which still could be linked/coupled with the solar/orbital driver. Slowing down of the 11-year cycle will have effects for sure. Leif is not being logical, what does he want, a 100% correlation? Does he think it’s a mechanical clock?
Leif Svalgaard says:
”This is a valid argument if you assume a priori that the [?] must somehow be the cause. Otherwise not.”
I think we can safely say that IF the 20th century warming is real that it indeed had “a cause” which could even turn out to be merely chaotic noise (internal variation); therefore as hypotheses are tested we should indeed look for other potential causes until one that works (has explanatory and predictive success) emerges and until such time as we’ve found a hypothesis that works well we should base our decisions on the null hypothesis which is not “that CO2 done it” but rather that there is a natural cause to by all broad and objective observations is a warming well within the natural range.
Stephen Wilde says:
January 10, 2013 at 10:31 am
He knows full well that the PDO was negative at the time which allowed a slight cooling to start on the downslope from high solar cycle 19 which was then consolidated during lower (but still high) cycle 20.
Apart from the fact that serious cooling started in the late 1940s
http://jonova.s3.amazonaws.com/graphs/hadley/Hadley-global-temps-1850-2010-web.jpg
And cycle 20 was lowest full cycle since the 1930s [so not ‘still high’], but then numbers have never been your strong side 🙂
Leif Svalgaard says:
January 10, 2013 at 9:52 am
crosspatch says:
January 10, 2013 at 9:44 am
You don’t need to use sunspot counts, there are other things that can be used. F10.7 flux for example:
http://sol.spacenvironment.net/~spacewx/data/F107_5_cycle_v2_34.jpg
Notice the weak cycle corresponding to cooling in the 1970s.
Rather note the strongest cycle of them all corresponding to the cooling in the 1950s:
http://jonova.s3.amazonaws.com/graphs/hadley/Hadley-global-temps-1850-2010-web.jpg
Notice anything else.
http://i446.photobucket.com/albums/qq187/bobclive/pdo-1.jpg
John West says:
January 10, 2013 at 10:41 am
I think we can safely say that IF the 20th century warming is real
No ‘IF’ there, it is real. And the issue was whether TSI varied enough with the solar cycle to explain the 17th century cooling. That hypothesis [advocated by Eddy in the 1970s] was falsified when we got actual measurements of TSI. To ‘rescue’ the hypothesis various tricks are employed: ‘amplification’, ‘feedback’, ‘other [much less energetic] variables’, etc. Most of these excuses seem to stem from an ardent and fervent wish to combat the AGW crowd with something, anything.
Leif said:
“Apart from the fact that serious cooling started in the late 1940s”
PDO went negative in the 40s but stuff other than solar isn’t Leif’s strong point.
Bob Tisdale says:
A couple of responses. First, the subject of the post is theory, not evidence. The “consensus” is asserting that in theory a persistent step up in forcing should only cause a brief episode of warming, so that a roughly steady high solar activity proceeding from 1950 could not cause the warming seen post-1975, even if some mechanism of enhanced solar forcing were in play. But that is not what their own theories actually say according to the GCMs, which are the most fleshed out embodiment of their own theories.
But Bob wants to change the subject. Okay. I agree with him that there should be no lag in solar warming, but he seems to THINK that I am talking about some kind of lagged warming. No, I am talking about a SLOW warming, as I explained earlier to “thingadonta”:
A slow warming is going to be easily obscured by natural variation. I do not at all dismiss Bob’s theory that ENSO can be a driver of internal variation. That theory just doesn’t account for the now-mountain of evidence that solar activity is a primary driver of global temperature.
Nobody has been able to come up with any theory OTHER than internal variation for the 40s-to-70s dip in temperatures, so obviously nobody is dismissing internal variation. I’d call it obviously the most important player on the decadal time scale, though I don’t have any strong view on whether it’s effects would be cyclical or a random walk.
But on the longer time scale, where a slow warming could be expected to show up, the rough coincidence between the rise in solar activity from the Maunder Minimum and the warming of the planet over the last 300 years is not obscure at all. Here I’m with Stephen. If Leif is completely right that, except for the Dalton Minimum and the turn-of-the-19th-century-lull, solar activity was at roughly the same level for the last 300 years, I think that sits perfectly with a solar explanation for the warming over this period.
When Dalton hit there was a big drop back in temperatures. That is just what we expect from the rapid temperature response of the upper ocean to a change in forcing (in my view, a hypothetical enhanced solar forcing, beyond the very slight variation in TSI). When post-Dalton solar activity rebounded so did temperatures, again from the rapid response of the upper ocean. As solar activity stayed up, the warmed-up upper ocean would have done some mixing with the next deeper ocean layers, contributing to the slow process of longer term warming.
It is bizarre for anyone to think that warming can’t go on for 300 years. IT JUST HAPPENED. This is what galls me about Leif. He is constantly assuming that these niggling changes he is advocating in the solar record somehow falsify a solar explanation for 20th century warming. Was 20th century solar activity extraordinary, as Usoskin claims, or merely high, as Muscheler claims? EITHER is perfectly compatible with a solar explanation for 20th century warming.
How people can be so fixated on the rapid temperature response of the upper ocean, to the point of thinking that deeper ocean heat storage does not matter, is just beyond me. I’m not saying Bob is doing that, he hasn’t been specific on the point, but Leif definitely does, and so do a lot of his solar colleagues. Some pathological group-think perhaps. (Leif has used some nasty language towards me recently, so I am not pulling any punches.)
Leif said:
“And the issue was whether TSI varied enough with the solar cycle to explain the 17th century cooling.”
Now that we have Leif’s adjusted sunspot numbers we can see that during the 17th century the sun was as active or nearly as active as in the late 20th century.
So that brought us out of the LIA. The late 17th century cooled off a little but not back to Maunder Minimum levels and during the late 17th century the level of solar activity fell back again.
So there is still a good correlation between sun and climate despite Leif;s adjustments.
Thanks for this post. It’s obvious the science is wrong and that CO2 and H2O don’t have any measurable effect on temperature. It’s also obvious that it’s a 60 year lagging effect from the sun that’s caused all this warming, like melting arctic ice and the hot USA last year and Australia now.
Any fool can easily measure it because when there’s a volcano that stops the sunlight reaching earth, it takes at least a couple of years before the temperature heats up again. So if it can take a couple of years for the effect of a little volcano to disappear, it doesn’t take much science to see that it would take a lot longer for the effect of the sun to disappear. Because the sun is much bigger than a volcano.
Scientists should stop blaming CO2, which is essential to life, and start to take notice of the obvious – the sun.
Robuk says:
January 10, 2013 at 10:53 am
Notice anything else.
http://i446.photobucket.com/albums/qq187/bobclive/pdo-1.jpg
You clearly show that the sun is not the driver of these major climate shifts.
“I have rounded up statements to this effect from eighteen top “consensus” climatologists”
That can’t be right Eric! If you rounded up then shouldn’t there have been TWENTY?
🙂
Alec Rawls says:
January 10, 2013 at 11:13 am
Leif has used some nasty language towards me recently
As you sow, you reap…
It is bizarre for anyone to think that warming can’t go on for 300 years
There are long-term variations in climate, lasting on the order of 1000-2000 years.There is no good evidence that they are caused by the Sun.
“ya Leif, I have found that every time you try to pin Wilde down to numbers he is either wrong, changes his tune, changes the subject, or says things so vague that you suddenly realize that he is a lawyer”
Ya, Mosh. Getting disgruntled are you ?
Leif tries to counter my point with inappropriate data and you are all for it ?
See here:
As regards the period 1999 to 2007:
“Earthshine and ISCCP-FD reflectances show a significant increase before flattening and holding the increase. This implies a reduction in the net sunlight reaching Earth.”
from here:
http://bbso.njit.edu/Research/EarthShine/literature/Palle_etal_2008_JGR.pdf
How about the two of you getting off your high horses, stopping the obfuscation and the ad hominems and addressing the science ?
My post at 11.13 am should refer to 18th century.Could the mods amend it for me ?
Stephen Wilde says:
January 10, 2013 at 11:13 am
So that brought us out of the LIA. The late 17th century
Never good with numbers you were. Perhaps you mean the 18th century?
Leif shows disconfirmation bias, which is good. 🙂
Leif Svalgaard says:
January 10, 2013 at 8:55 am
Stephen Wilde says:
January 10, 2013 at 7:45 am
” We are now seeing more equatorward meridional jets and increasing cloudiness with the less active sun”.
Actually not: http://www.leif.org/research/Cloud-Cover-GCR-Disconnect.png
—————————————–
Figure 4 says, your cloud data is wrong after 2004
http://s7.postimage.org/69qd0llcr/intermediate.gif
Side bar: Bern 2.5CC is sort of interesting. Always in search of analogies with other types of systems, Bern 2.5CC looks a lot like an overshoot situation. With something like a clock in a circuit you see overshoot when the state goes low to high or high to low. Hmmm … where are we NOW? In the high or low state?
But he will run out of evidence.
Keep at ’em Leif.
I think the GCM’s are rigged to give too much feedback from water vapor, and thus overestimate the expected warming, but I’m not going to jump on the solar bandwagon just as a desperate countermeasure to the CO2 catastrophists.
And if it the data starts to support the carbonphobes, well, then I’ll admit I was wrong and buy that damn Prius.
Apologies if I’ve missed something Dr. Svalgaard but you seem to be reticent about commenting on the suggestion that whilst TSI is generally stable, levels of UV and infra-red radiation vary considerably with time.
I’m not trying to make any point or enter the rather fractious debate in this thread – just interested.
Leif:
I’m better with numbers than you seem to be with non solar aspects of climate.
Besides, I asked the mods to correct my post to refer to the 18th century but they didn’t get around to it.
Leif said:
“You clearly show that the sun is not the driver of these major climate shifts”
Hardly.
Bob Tisdale’s work shows upward stepping from one positve PDO to the next so where do you think the extra energy is coming from ?
Stick to solar, Leif. When it comes to system responses to solar input that is outside your field 🙂
Manfred says:
January 10, 2013 at 11:45 am
Leif Svalgaard says:
January 10, 2013 at 8:55 am
Stephen Wilde says:
January 10, 2013 at 7:45 am
” We are now seeing more equatorward meridional jets and increasing cloudiness with the less active sun”.
Actually not: http://www.leif.org/research/Cloud-Cover-GCR-Disconnect.png
—————————————–
Figure 4 says, your cloud data is wrong after 2004
http://s7.postimage.org/69qd0llcr/intermediate.gif
——————————————
The data IS wrong post 2004. A 3% decrease in cloud cover since the 1990s should have caused a massiv temperature increase and not a warming pause.
Leif says: “Never good with numbers you were. Perhaps you mean the 18th century?”
Leif claims to have discovered that 18th century solar activity is way underestimated. The obvious reaction that would occur to pretty much anybody is: “wow, that really strengthens the case for a solar explanation of the rapid temperature recovery from the Little Ice Age.”
But not Leif. Even when Stephen sticks it in his face he says: “Oh look, a squirrel!”
Which is the reason I take Leif’s claims about the solar record with a grain of salt. He’s got just about the most blatantly biased cognitive style I’ve ever seen.
But if he is right, and I give plenty of credence to that possibility too, it does not in any way weaken the case for post LIA warming (including late 20th century warming) having been caused by the sun, and even strengthens the case at some points.
Interesting post at http://ars.els-cdn.com/content… by Ole Humlum and others regarding CO2 levels tracking temperatures.
The main reason they claim rubbish such as continued heat input can’t cause warming is because they think they know the maximum blackbody temperature the Solar radiation can cause.
This claim is so absurdly wrong it is no longer funny.
Any model that says the maximum temperature caused by radiation can be calculated by quartering the radiation field and ignoring day and night is just absurd.
Perhaps they should look again at their workings and note they are calculating the average output, not the real input.
When will the Met Office come clean and let us know how much electrical energy their radars pump into the atmosphere 24/7 The primary forcer is the electron and all wireless com’s and detecting release electrons as waste (pollution) There are 2 components to a radio wave an electrical part and a magnetic part and it’s the magnetic part (data) that is collected and used while the electrical part is the carrier (force) There is over a terrawatt plus of power transmitted per hour by our TV network American ERP (effective radiated power) for TV stations is 100,000 watts. By increasing the electrical energy of the atmosphere it becomes more energetic hence atmospheric heating is taking place.
Alec Rawls says: “But Bob wants to change the subject. Okay. I agree with him that there should be no lag in solar warming, but he seems to THINK that I am talking about some kind of lagged warming. No, I am talking about a SLOW warming…”
I haven’t changed the subject. There’s no evidence of the slow [lagged] warming—or didn’t you bother to look at the graphs I linked earlier?
Alec Rawls says: “A slow warming is going to be easily obscured by natural variation.”
What slow warming? If the short-term warming explains all of the warming, what additional slow warming is there? I presented Ocean Heat Content in my earlier comment to you. The slow warming doesn’t exist in it. It also doesn’t exist in sea surface temperatures. The responses of sea surface temperatures are also in months, not some non-existent lagged [slow] warming.
Alec Rawls says: “I do not at all dismiss Bob’s theory that ENSO can be a driver of internal variation.”
I haven’t presented a theory. I have presented data with the global oceans divided into logical subsets.
Alec Rawls says: “That theory just doesn’t account for the now-mountain of evidence that solar activity is a primary driver of global temperature.”
What mountain of evidence? In my earlier comment to you, January 10, 2013 at 3:36 am, I presented ocean heat content for the tropical Pacific and the extratropical North Pacific. Does your mountain of evidence explain the warming to 700 meters, since 1955, for those two large portions of the global oceans? No. Then your mountain of evidence has a faulty foundation. Your mountain of evidence also doesn’t explain the warming of global sea surface temperatures over the past 30+ years. Would you like me to present that as well here?
I ended that earlier comment with a question to you, So where’s the lag and where’s the solar influence? In other words, show me the data.
Since my use of the word lagged seems to have upset you, let me rewrite it: So where’s the slow warming and where’s the solar influence? In other words, show me the data.
Alec Rawls says: “But on the longer time scale, where a slow warming could be expected to show up…”
It’s expected? Why? There’s no evidence of the mythical slow warming in the short-term data. The warming has all been explained.
Alec Rawls says: “How people can be so fixated on the rapid temperature response of the upper ocean, to the point of thinking that deeper ocean heat storage does not matter, is just beyond me.”
Are you discussing depths in excess of 700 meters? If so, please provide a link to the data for the “deeper ocean storage” you’re referring to, with the data available on a gridded basis so that all of us can examine it in logical subsets. The only dataset I’m aware of is the NODC’s ocean heat content data for 0-700 meters, parts of which I presented earlier.
In a reply to Leif Svalgaard, Stephen Wilde says: “Bob Tisdale’s work shows upward stepping from one positve PDO to the next…”
Please link the graphs and posts in which I have presented “upward stepping from one positve PDO to the next”. I do not recall ever preparing graphs or writing posts where I have discussed “upward stepping from one positve PDO to the next”. In fact—to the contrary—I have presented numerous posts which discuss that there’s no mechanism through which the PDO can cause changes in surface temperature. The process that causes those shifts is ENSO. And you’re aware of that, so I’m not sure why you’re trying to confuse matters here.
Bob.
I’m sure you have produced a graph somewhere that showed upward stepping but I’m unable to refer to it since your output is so large and I wouldn’t know where to start.
I accept that you may not have entered into a discussion of it.
Here you go, Bob.
In this thread:
http://wattsupwiththat.com/2012/06/18/sea-surface-temperature-approaching-the-threshold-of-el-nino/
You said this:
There is a multidecadal component to ENSO, and this can be seen by smoothing the NINO3.4 sea surface temperature anomalies with a 121-month (11-year) filter:
http://i48.tinypic.com/eg672g.jpg
I think there is more somewhere but we clearly discussed the issue in general terms there.
Alec Rawls wrote:
“This continued warming is not a lagged response to the step up in forcing. It is an ongoing response to the ongoing high level of forcing”.
Yes agree, my comment was just sloppy; if solar activity stayed relatively high in the mid to late 20th century then heat would continue to rise due to the “ongoing high level of forcing”.
And I agree with those who think clouds could be just about enough/or at least a major factor to amplify the ‘apparently’ ‘small’ changes in solar activity to account for 20th century temperatures (with a small effect from rising c02). If we don’t have full cloud coverage data from at least the early 20th century, as well as the correct understanding of their effects, then we can’t properly assess what amplifying/nullifying effect clouds may have had with changes in solar activity during this time.
I’m highly suspicous of clouds, using e.g. basic simple observations, e.g. on a hot day the sun burns some of them off, and it gets warmer; a very simple, child-like observation that might have something to do with longer term termperature trends. Simple, field based observations are often more effective in understanding nature than fancy mathematics and computer modelling, I’m thinking of making an exhaustive list of such basic, simple natural observations which are also the basis of the empirical experimental method and science in general, and see where the climate modellers might err, or where they simply just ignore them.
Bob Tisdale,
I watched your 1 hour movie and was impressed.
However, I could not follow the coclusion that the step changes after an El Nino and the subsequent plateaus are sufficient to explain all warming with ENSO.
Temperature may still be a superposition of 2 or more influences, for example a linear increase due to whatever and an ENSO influence, which would tthen still be a step up with El Nino but then a slowly declining temperature.
ntesdorf says:
January 10, 2013 at 2:06 pm
That link doesn’t work. Did you mean this one?
http://www.sciencedirect.com/science/article/pii/S0921818112001658
Leif Svalgaard says:
January 10, 2013 at 10:46 am
Stephen Wilde says:
January 10, 2013 at 10:31 am
He knows full well that the PDO was negative at the time which allowed a slight cooling to start on the downslope from high solar cycle 19 which was then consolidated during lower (but still high) cycle 20.
Apart from the fact that serious cooling started in the late 1940s
http://jonova.s3.amazonaws.com/graphs/hadley/Hadley-global-temps-1850-2010-web.jpg
And cycle 20 was lowest full cycle since the 1930s [so not ‘still high’], but then numbers have never been your strong side 🙂
Climate has nothing to do with numbers – at least not in the linear sense. Climate is a nonlinear / nonequilibrium pattern system, ignoring this and playing linear numbers games will only lead you down the garden path. Pattern recognition is more important here than number-crunching. Some people get this, others not – probably genetic.
Bob
Would you say we are heading into a La Nina now (or at least a “La Nina modoki”)? The east Pacific looks kinda cold, plus the trades seem to be holding up.
Ian W says:
January 10, 2013 at 3:34 am
…..I would say that there will be some high profile scientists and politicians that may need to ‘do a Maurice Strong’ and decamp to one of the countries that won from the ‘nature trick’ they pulled on the taxpayers. There could be ‘Tahrir Square protests’ coming to cities near you – I don’t think this will be a gentle landing.
>>>>>>>>>>>>>>>>>>>>>>>>>>>>>>>>
And that is EXACTLY what they are hoping for!
Remember the ultimate goal is Global Governance.
There is a darn good reason the USA and Canada military signed the February 14th Agreement. [T]he United States and Canada entered into a military agreement on February 14, 2008,allowing the armed forces from one nation to support the armed forces of the other nation during a domestic civil emergency, even one that does not involve a cross-border crisis, according to a police commander involved in homeland security planning and implementation.
Whether this agreement is benign or not is anyones guess. I lost all faith in the good intentions of the US government when they moved the foot and mouth testing laboratory off Plum Island into the middle of cattle country (Kansas) just after the UK foot and mouth outbreak was traced to Pirbright Labs. This was despite the fact …an FMD simulation
exercise by U.S. Department of Agriculture called “Crimson Sky” reports that the
disease can reach 35 states within 10 days, and about 40% of cattle livestock would
need to be slaughtered if five farms are infected simultaneously (McGinn and Hoffman,
2002). Another study also warns that FMD could affect 30-70% of the U.S. livestock
if the government fails to stamp out the disease within a reasonable time frame (Federal
Inter-Agency Working Group, 2003).
Monsanto already has a patent on pigs and there is the INTERNATIONAL COMMITTEE FOR ANIMAL RECORDING: PATENTING IN THE ANIMAL SECTOR just incase you wondered what the ‘advantage’ of destroying US livestock was. /cynicism>
William McClenney says:
January 9, 2013 at 10:59 pm
About a decade ago now I coined two terms, the first being that we live in the “post-sentient age”.
The second was supposed to be a spoof, the “Theory of Inverse Reality”, in which you take any argument, construct its antithesis and shove-off.
Post-sentient essentially means unconscious. Unaware. Likely unable to follow Alec’s presentation or “Mike’s Nature Trick”.
Most adherents of AGW I speak with have no clue of when they live (possibly the end Holocene). Eyes tend to glaze over pretty quickly when you go through the “lite” version of the last several interglacials. It’s like, so what? It either actually does not matter to them if sea levels were somewhere between 6 and 42 meters higher than present at the end of the last one, or its just that the decision has already been made, for whatever reason, their data banks are full on what they needed to come to their commitment. The no longer aware, post-sentient, hominid.
There is a theory – advanced by John Gribben and some others – that our nearest relatives the chimps and gorillas descended from hominids similar to our not so distant ancenstors. People have looked for a nonbipedal common ancestor but not found one, the further they go back toward the 7 million years ago indicated by genetics as the age of the chimp / human common ancestor, the older ancestors keep on showing up as bipedal. The origin of upright bipedality seems be before, not after, the chimp / human common ancestor. The implication is profound. Human-like bipedality and associated intelligence can be lost as easily as gained. Once Homo starts to retreat from sentience there is no limit to the extent of this retreat.
Rosco says:
January 10, 2013 at 2:10 pm
…Any model that says the maximum temperature caused by radiation can be calculated by quartering the radiation field and ignoring day and night is just absurd….
>>>>>>>>>>>>>>>>>>>>>>>>>>>
‘Quartering the radiation field and ignoring day and night’ also quarters the delta in the TSI so it can be safely ignored.
“The interior of Alaska is seeing tremendously cold weather this winter.”
Tremendously warm.
You seem confused, Mosher’s educational background consists of BA’s in English Literature and Philosophy. His “scientific” background involves bringing MP3 players to market for Creative Labs as a marketing director. Leif is an actual scientist.
“It could be said that the increase in TSI from a little over1363 to a little under1367 Watts per square metre over the 400 year period shown is pretty insignificant.”
Don’t forget to divide by 4.
I’m not sure Bob and Alec are that far apart although I tend to agree more with Alec. Part of my interpretation of Bob’s theory is that the El NIno anomalies (e.g. 80’s and 90’s) permitted the gathered heat to be released to the rest of the world rather than stored in the deep ocean. A constant sun is the only viable explanation for varying amounts of warming given ENSO-induced variations (which is mostly clouds) Thus a constantly warmer sun is an even better explanation of where the 1997/8 heat originated.
The proof will come when we get another 1997/8 level El Nino but see no step function in temperature on UAH.
Tisdale says:
I have seen Bob in the past articulate what I thought was a pretty good theory of how ENSO, by affecting cloud cover, could self-propagate. Has this theory been abandoned? In any case, Roy Spencer supports a theory of this kind of internal variability and I find it more than plausible that some such mechanism of internal variability is at work, since short term temperature change seems to be dominated by internal variability. As I said before, there seems to be no other way to account for the 40s to 70s dip.
Bob continues:
Setting aside Bob’s ridiculous demand to do what he does, I am content to look at NOAA’s ocean heat content estimates and to consider the early numbers as they stand (despite the vast uncertainty in these very sparsely sourced estimates).
This data shows the upper ocean layer, and at least to some extent deeper layers as well, taking a dip in the 50s and 60s. Bob seems to think this presents some great dilemma for solar warming theory, as if I am claiming that heat has to be getting stored in the oceans whenever solar activity is high. That is certainly a possibility (what I referred to earlier as the “cyclical” possibility). It could be that the sun was dumping energy into the oceans over this period but somehow the cold monster of the vasty deeps flicked its tail and stole this warmth away, holding on to it until at some point in the future it returns to the surface, either burped back out, or more likely, reducing future heat loss from the upper to the deeper ocean.
But internal variability doesn’t have to be of this cyclical nature. The mechanisms of internal variability could also be self propagating rather than cyclical. (Hasn’t someone written some posts on that theory?) It is possible that over the 40s to 70s dip there was internal variability of this type that was large enough to more than offset solar effects, causing ocean heat content to fall. That wouldn’t mean there was no enhanced solar forcing going on. It would just mean that something larger was also going on at that time.
Why look any further than internal variability, Bob asks, when “the warming has all been explained”? Because there are two ways in which only a very little bit of “the warming” has been explained. First, the observational window in which to study internal variability is very brief. We really didn’t get any halfway decent ocean heat content data until ARGO was up and running in the early 2000s. Sea surface temperature data is very spotty before the satellite era and only goes back in total, what, about a hundred years? This is a tiny slice of climate history, too small to distinguish what is typical from what is anomalous. Maybe if you’ve got a good THEORY, but the idea that much can be sorted out just from looking at the data seems to me far fetched.
Secondly, as I said before, internal variability cannot account for the now-mountain of evidence for that solar activity is a primary driver of global temperature. (Two dozen references listed in the second section here.)
Three idealized functions are used in control theory. They are the ramp function, the step function, and the sinusoidal function. This article seems to compare a step change (increase in solar forcing) to a ramp function (increase in CO2 concentration). For a step change in equilibrium temperature the system temperature will eventually approach the new equilibrium temperature asymptotically but will not overshoot, assuming no feedbacks. For the ramp function after an initial period the system temperature will lag the increasing equilibrium temperature by a constant amount, and will continue increasing as long as the forcing continues to increase. The consensus seems to imagine a CO2 ramp function that continues increasing. The CO2 forcing imho is somewhat speculative, especially in light of recent history which demonstrates that CO2 forcing is presently either absent or held in check by other agencies.
Additionally, any comparison must include proper lag times which depend on the heat capacities involved and are difficult to determine except empirically. All we can do is watch what happens.
Don’t get me wrong I admire Leif’s no nonsense approach. And also the fact that he doesn’t discuss (speculate about) topics he doesn’t understand. A habit most scientists in the field of climate could learn from.
However, this is really very silly comment:
“Here we go again: Image TSI was constant for a million years. Then changed suddenly by 1% ans stayed at that higher level for the next million years. You are claiming that during that second million years [and actually also during the first million years] that the temperature [warming] would continue to rise throughout all that time. If a million is too short, make it 100 million.”
Think of that pot of water heating on the stove metaphor again. 😉
Not so. The “constant composition” commitment studies referenced in this post are step functions. They look at what will happen if the atmospheric composition (not CO2 emission rates) stays constant at year 2000 levels, or year 2010 levels.
Manfred says:
January 10, 2013 at 11:45 am
Figure 4 says, your cloud data is wrong after 2004
http://s7.postimage.org/69qd0llcr/intermediate.gif
when things don’t fit, say that the data is poor…
Horse says:
January 10, 2013 at 12:11 pm
Apologies if I’ve missed something Dr. Svalgaard but you seem to be reticent about commenting on the suggestion that whilst TSI is generally stable, levels of UV and infra-red radiation vary considerably with time.
Stephen Wilde says:
January 10, 2013 at 12:28 pm
Stick to solar, Leif. When it comes to system responses to solar input that is outside your field
But well within yours ??? How many peer-reviewed papers in Science, Nature, etc have you published? How many times have your ‘work’ been widely credited of reviving the field of Sun-Weather-Climate research?
phlogiston says:
January 10, 2013 at 4:48 pm
Climate has nothing to do with numbers – at least not in the linear sense. Climate is a nonlinear / nonequilibrium pattern system, ignoring this and playing linear numbers games will only lead you down the garden path.
So you will be perfectly happy if the IPCC said: “by eyeballing the data, we predict really bad global warming some time in the future”. No you wouldn’t: you would require the data be properly number-crunched, the warming be quantified [with error bars], and the time frame specified.
Alec Rawls says:
January 10, 2013 at 6:17 pm
mountain of evidence for that solar activity is a primary driver of global temperature. (Two dozen references listed in the second section here.)
that is like arguing that smoking is healthy because so many people do it.
I can point to hundreds of papers that claim sun-weather-climate relationships.
Horse says:
January 10, 2013 at 12:11 pm
Apologies if I’ve missed something Dr. Svalgaard but you seem to be reticent about commenting on the suggestion that whilst TSI is generally stable, levels of UV and infra-red radiation vary considerably with time.
I forgot to respond to you. Here it is:
What do you mean by ‘vary considerably over time’? This is often where people confuse things. UV etc vary a lot on a day-to-day basis, or even on a year-to-year basis, but since solar activity is cyclic there is a much smaller variation from cycle to cycle. It is like the weather: it varies a lot from day-to-day and from season-to-season, but a lot less from year-to-year. We have a good measure of the amount of UV we get over a year simply by measuring the variation of the direction of a compass needle [ http://www.leif.org/research/CAWSES%20-%20Sunspots.pdf ] and that measure shows us that the UV varies just like the Sunspot Number, the radio flux from the sun, TSI and just about every solar indicator you can find. So, UV over time is as stable as TSI.
Well, it looks like I mischaracterized the CO2 increase. Apparently they are considering a ramp function up until the present, then constant compositions thereafter, correct? It does appear from your figure that there is an exponential decay to an asymptote that is the new equilibrium temperature, and we would presumably remain at that temperature as long as CO2 concentrations remain constant. I wonder why they didn’t use a ramp function continuing the present trend. Probably didn’t want to scare the children.
Do you agree that a step change in forcing simply produces a new equilibrium temperature and that the system will tend to asymptotically approach but not exceed that temperature? And when the forcing is removed the system will simply go back to its original temperature?
Leif Svalgaard says:
January 10, 2013 at 7:47 pm
Manfred says:
January 10, 2013 at 11:45 am
Figure 4 says, your cloud data is wrong after 2004
http://s7.postimage.org/69qd0llcr/intermediate.gif
when things don’t fit, say that the data is poor…
————————————————————
From above link:
False: change in satellite viewing angle
In the post 2004 period, the ISCCP reported cloud trend implausibly diverged from other cloud cover datasets and from albedo trends seen by earthshine
Studies confirm this viewing angle problem:
http://agwobserver.wordpress.com/2010/01/20/isccp-problems/
Would you believe that cloud cover decreased by 3% since the 1990s while temperature stopped warming ?
Leif Svalgaard says:
January 10, 2013 at 10:56 am
“To ‘rescue’ the hypothesis various tricks are employed: ‘amplification’, ‘feedback’, ‘other [much less energetic] variables’, etc. Most of these excuses seem to stem from an ardent and fervent wish to combat the AGW crowd with something, anything.”
============
Excuses ?
For what, the latest fevered dream in vogue.
“Catastrophic” has been dropped from the lexicon.
Next step: Anthropogenic
Which would only leave GW.
Still an “ardent and fervent” field of study, hypotheses will abound as we combat the enemy.
There was an enemy, right ?
phlogiston says:
January 10, 2013 at 4:58 pm
“The implication is profound. Human-like bipedality and associated intelligence can be lost as easily as gained. Once Homo starts to retreat from sentience there is no limit to the extent of this retreat.”
Thanks Phlogiston! I was not aware of that. A quite interesting coeval……….
@Poptech says:
“You seem confused, Mosher’s educational background consists of BA’s in English Literature and Philosophy. His “scientific” background involves bringing MP3 players to market for Creative Labs as a marketing director. Leif is an actual scientist.”
Thank you Poptech! Yes indeed, I was confused. Mosher is very well-spoken, so now it makes sense. His questions and statement used to seem sardonic to me. They seemed ignorant for a man of science – and so I got irritated by what he said. I really thought he was pretending not to understand his claims. Mosher’s comments makes much more sense to me know that I know where he’s coming from.
Leif on the other hand is passionate about his beliefs, and knows a ton about the solar physics.
Mario Lento says:
January 10, 2013 at 11:42 pm
==============
“You” got Mosher wrong, look it up !!
u.k.(us) says: “You” got Mosher wrong, look it up !!
Tell me what you mean?
Mario Lento says:
January 11, 2013 at 12:15 am
u.k.(us) says: “You” got Mosher wrong, look it up !!
Tell me what you mean?
==================
Off the top of my head, he helped put missiles thru any window you wanted.
Just to clarify things/or not.
Of course. The issue is the time frame. When talking about solar forcing the “consensus” claims that equilibration is rapid, less than ten years, with no significant continued warming after that. When talking about CO2, continued forcing at a given stepped up level is predicted to cause substantial continued warming for many decades. The latter has a lot of physics behind it (the full GCM modeling). The former is a bald assertion, with no explanation given what-so-ever.
Stephen Wilde says: “You said this:
“There is a multidecadal component to ENSO, and this can be seen by smoothing the NINO3.4 sea surface temperature anomalies with a 121-month (11-year) filter:
“http://i48.tinypic.com/eg672g.jpg
“I think there is more somewhere but we clearly discussed the issue in general terms there.”
Stephen, where in that did I state or imply “…upward stepping from one positve PDO to the next…”? I’m wondering about your use of the PDO in your statement.
Manfred says: “I watched your 1 hour movie and was impressed. “
Thanks.
Manfred says: “However, I could not follow the coclusion that the step changes after an El Nino and the subsequent plateaus are sufficient to explain all warming with ENSO.” And you continued, “Temperature may still be a superposition of 2 or more influences, for example a linear increase due to whatever and an ENSO influence, which would tthen still be a step up with El Nino but then a slowly declining temperature.”
Let’s break that “Rest-of-the-World” data (the portion with the upward steps) into two more subsets, by isolating the North Atlantic. For the South Atlantic-Indian-West Pacific we have the step up with the slowly declining temperatures between the major El Niños:
http://i48.tinypic.com/otg19s.jpg
It’s tough to claim a manmade global warming signal there when sea surface temperatures cool between the major El Niños.
Now the North Atlantic: Because the North Atlantic has the AMO, and because the AMO has been causing the North Atlantic to warm at a higher rate that the rest of the global oceans since the mid-1970s, it warms between the upward shifts:
http://i47.tinypic.com/35nc9w0.jpg
So the North Atlantic fits into your scenario of an ENSO-related signal on top of the warming trend (caused by the AMO), but the South Atlantic-Indian-West Pacific data does not.
Thanks for bringing that up. I did look into it. I didn’t have enough time, though, to go into that additional breakdown in the video, but I’ve discussed it in past posts and in the book.
Regards
Alec Rawls says: “I have seen Bob in the past articulate what I thought was a pretty good theory of how ENSO, by affecting cloud cover, could self-propagate. Has this theory been abandoned?”
Alec, you appear to be fixated with the word theory. Once again, I haven’t abandoned a theory because I have not presented a theory. I present data, and using multiple datasets—including sea surface temperature, sea level, ocean currents, ocean heat content, depth-averaged temperature, warm water volume, sea level pressure, cloud amount, precipitation, the strength and direction of the trade winds, downward shortwave radiation, etc.—I present cause and effect.
Alec Rawls says: “Setting aside Bob’s ridiculous demand to do what he does…”
That’s a very odd statement, Alec, considering I simply asked you if you were referring to Ocean Heat Content data in excess of 700 meters. How is that a “ridiculous demand to do what he does”?
Alec Rawls says: “…I am content to look at NOAA’s ocean heat content estimates…
http://www.ncdc.noaa.gov/bams-state-of-the-climate/2009-time-series/ohc
…and to consider the early numbers as they stand (despite the vast uncertainty in these very sparsely sourced estimates).”
Thank you, Alec, for confirming that you’re only considering the top 700 meters when discussing the “deeper ocean heat storage”, as you had when you wrote, “How people can be so fixated on the rapid temperature response of the upper ocean, to the point of thinking that deeper ocean heat storage does not matter, is just beyond me.”
And thank you for confirming the Ocean Heat Content data that I presented earlier was included as one of your “deeper ocean heat storage” datasets. The NODC data is the Levitus et al data.
And as I noted in my first comment to you on this thread (January 10, 2013 at 3:36 am), there is no slower warming of ocean heat content data. I’ll repost a portion here for you so you don’t have to scroll up to it.
HHHHHHHHH
The ocean heat content for the tropical Pacific warms immediately during the 3-year La Niña events:
http://i48.tinypic.com/wcilgk.jpg
And again immediately during the 1995/96 La Niña event:
http://i45.tinypic.com/1zgc2s8.jpg
Likewise, the ocean heat content for the tropics as a whole warm, with a 9-month lag, during the 3-year La Niña events:
http://i50.tinypic.com/egaj4w.jpg
The warming of the ocean heat content for the extratropical North Pacific is dependent on a 2-year climate shift in 1989-90. Without that shift, the ocean heat content for the extratropical North Pacific would cool:
http://i45.tinypic.com/1z1aiix.jpg
HHHHHHHHH
Alec Rawls says: “Bob seems to think this presents some great dilemma for solar warming theory, as if I am claiming that heat has to be getting stored in the oceans whenever solar activity is high.”
Your interpretation of my comments are odd, Alec. Please advise me where I have stated or implied what you’ve written. As far as I know, I have not.
Alec Rawls says: “Why look any further than internal variability, Bob asks, when ‘the warming has all been explained’?”
You’ve taken what I’ve written out of context, Alec. What you quoted was in response to your statement of “But on the longer time scale, where a slow warming could be expected to show up…”
I replied in full: It’s expected? Why? There’s no evidence of the mythical slow warming in the short-term data. The warming has all been explained.
Again, where’s this mythical slow warming, Alec? It does not appear in surface temperature data and it does not appear in the graphs of the ocean heat content for your “deeper ocean” as illustrated in the graphs above.
With respect to the rest of your comment, you have not answered my question that I’ve posed twice to you, with respect to the graphs I presented. Let me ask it one more time: So where’s the [lag] slow warming and where’s the solar influence? In other words, show me the data.
Manfred asks “Would you believe that cloud cover decreased by 3% since the 1990s while temperature stopped warming ?“.
No. See figure 2 in http://bbso.njit.edu/Research/EarthShine/literature/Palle_etal_2008_JGR.pdf
Earthshine found decreasing albedo through the 1990s, while temperatures were increasing, but increasing albedo since then.
The spike in 1991-2 is Pinatubo.
eric1skeptic says: “I’m not sure Bob and Alec are that far apart although I tend to agree more with Alec. Part of my interpretation of Bob’s theory is that the El NIno anomalies (e.g. 80′s and 90′s) permitted the gathered heat to be released to the rest of the world rather than stored in the deep ocean.”
Hi eric1skeptic. I don’t believe we’ve ever exchanged comments here.
I think you’ve misunderstood my portion of the argument with Alec. Alec and I are worlds apart. Alec claims there is a slow warming of the deep oceans (which he has clarified as 0-700 meters in his January 10, 2013 at 6:17 pm comment) in response to his “solar warming theory”. I presented a number of ocean heat content graphs (data, not a theory) that show ocean heat content for 0-700 meters, when examined in subsets, responds quickly to changes and that there’s no evidence of the mythical slow warming.
eric1skeptic says: “A constant sun is the only viable explanation for varying amounts of warming given ENSO-induced variations (which is mostly clouds). Thus a constantly warmer sun is an even better explanation of where the 1997/8 heat originated.”
The other explanation is as Leif has been saying all along—that the variations in solar energy are too small to describe the warming.
Further, the warm water (the heat) for the 1997/98 El Nino was created during the 1995/96 La Nina, by exceptionally strong trade winds and resulting low cloud cover in the western tropical Pacific. See McPhaden 1999:
http://lightning.sbs.ohio-state.edu/geo622/paper_enso_McPhaden1999.pdf
The 1995/96 La Nina is the leading edge of the spike in the ocean heat content in the mid-1990s here:
http://i48.tinypic.com/wcilgk.jpg
It effectively shifted up tropical Pacific Ocean Heat Content. Note how the dip after it (associated with the 1997/98 El Niño) only drops the Ocean Heat Content to the value before the 1995/96 La Niña. So all of the heat released and the warm water redistributed by the 1997/98 El Niño were created during the 1995/96 La Niña.
Also, to counter any thoughts of a direct influence of the solar cycle, the 1995/96 La Nina occurred near the minimum between SC22 and SC23.
Regards
phlogiston says: “Would you say we are heading into a La Nina now (or at least a ‘La Nina modoki’)? The east Pacific looks kinda cold, plus the trades seem to be holding up.”
It appears the sea surface temperatures in the eastern equatorial Pacific will cool below the present NINO3.4 values of -0.23 deg C:
http://bobtisdale.files.wordpress.com/2013/01/15-weekly-nino.png
There’s lots of cool subsurface water from the last upwelling Kelvin wave. See here:
http://www.cpc.ncep.noaa.gov/products/analysis_monitoring/enso_update/wkxzteq.shtml
and the Hovmoller on page 16 here:
http://www.cpc.ncep.noaa.gov/products/analysis_monitoring/lanina/enso_evolution-status-fcsts-web.pdf
How long will La Niña conditions last if they reach that level? Dunno.
There’s an off-equatorial pool of warm water that shows up in the NODC ocean heat content data…
http://i50.tinypic.com/1z5ork9.jpg
..and in the AVISO sea level anomalies for Dec 2012…
http://bulletin.aviso.oceanobs.com/html/produits/indic/enso/welcome_uk.php3
…and the JPL sea level anomalies, but not as pronounced. See the JPL map here:
http://sealevel.jpl.nasa.gov/images/latestdata/jason/2012/20121218G.jpg
I appears to be the leftovers from the El Niño conditions earlier in 2012. Run back in time a few maps here:
http://sealevel.jpl.nasa.gov/science/elninopdo/latestdata/archive/index.cfm?y=2012
If that pool heads north or works its way into the Indian Ocean, then it won’t be involved in the next downwelling Kelvin wave, but if it migrates south, it could help to strengthen the next one and bring us back to El Niño conditions again in 2013.
We’ll have to wait and watch.
A relevant comment I made on the Nasa on the Sun thread earlier.
————————-
“I think to make sense of solar energy’s potential impact on the climate, we have to take it down to very, very tiny rates of energy that can accumulate in / be lost to the Earth system over time, each day, and/or over many years.
For example, the amount of energy which is accumulating in the Oceans and Land-Ice-Atmosphere is on the order 0.5 X 10^22 joules/m2/year. And there is 5 X10^14 m2 on the planet.
But the Sun’s energy is 386.4 X 10^22 joules/m2/year (+/- 0.14 10^22 in the solar cycle).
So if we can measure a 0.5 10^22 joules/m2/year there should be no reason to not assume some of the Sun’s energy can accumulate each year in the same way. There is no way every single 0.1 10^22 joules/m2 is balanced out by the emitted radiation ALL the time. We are talking about photons of energy here and they are not going be exactly balanced all the time.
A tiny, tiny difference in the Sun’s energy received versus the energy emitted each day is going to accumulate over time. I’m just saying, noone has ever looked at the issue this way that I am aware of.”
—-
I’d just add now, that there are accumulations of energy from the change in solar energy in the seasonal cycle. Land temperatures lag behind the Sun by 35 days. The Oceans/Lakes lag behind the Sun by 45 to 82 days. The energy accumulates and then drawsdown in the seasonal cycle.
The day-time temperatures lag behind the Sun by 3.5 hours. Another level of accumulation / drawdown.
I’ve calculated some of these numbers down to the second and it is an extremely small number – 0.007 joules/m2 per second but it actually works out to be 21,128,886,205,855,700 solar photons / m2 / second.
Now see what I’m saying. We need to move this down to the level where the real quantum world of energy and molecules operates at. Milliseconds and a single photons and an untold number of molecules on Earth.
Lief says that the sun’s variability is insufficient to have brought about the Global Warming that has been reported in the temperature data sets.
Bob says that the ocean is not warming which obviously supports Lief. It also seems to give the lie to the statement that temperatures are rising globally, let alone from made made CO2.
The actual recorded sea level change does not show any acceleration and in fact seems to be slowing down supporting Bob’s assertion regarding ocean temperatures based on his astonishing quantity and quality of data so clearly presented by him.
You are really left with only one conclusion. The Earth is not warming in any significant way and the temperature data sets have been fiddled with as is shown by the continual “adjustments” they are subjected to. Anthony has shown us that at least one of the keepers is running two sets of books and we have all seen with disbelief the continual claims of “unprecedented” extreme weather events which are nothing of the sort.
I am not a person who embraces any conspiracy theories but it is very strange that several keepers of the temperature data around the world are doing this and I have no doubt that they are.
Bob, you said this:
“There is a multidecadal component to ENSO, and this can be seen by smoothing the NINO3.4 sea surface temperature anomalies with a 121-month (11-year) filter:”
http://i48.tinypic.com/eg672g.jpg
I agree that you didn’t discuss it or speculate but I did.
It seems that from your data the peak of the 1990 positive Pacific Multidecadal Oscillation (not PDO) was higher than the 1930s peak.
All data should be looked at carefully for nuances that might help to explain reality and my take was then and is now that rising peaks from one positive phase to another would fit very well with the general rise in global sea and air temperatures from the Maunder Minimum to date.
It is likely that there was a series of rising steps from LIA to date and a series of falling steps from MWP to LIA.
Your suggestion that the observation represents a multidecadal component to ENSO is, I think, a less likely speculation than mine because it does not account for the progression of climate change from MWP to LIA to date whereas my interpretation does.
So, in my opinion, that uplift from the 1930s peak to the 1990s peak is in fact the solar signal working through the system in the background beneath the 60 year Pacific Multidecadal Oscillation.
Thanks for the explanations Bob. You said: “The other explanation is as Leif has been saying all along—that the variations in solar energy are too small to describe the warming.” and “Also, to counter any thoughts of a direct influence of the solar cycle, the 1995/96 La Nina occurred near the minimum between SC22 and SC23.”
I have to go with Alec and add this point: the 11 year solar cycles are not as important as the long term rise and fall of solar activity. It’s not that they don’t matter at all, but that 4 or 5 years (half of a cycle) is too short to have much of a noticeable effect against other natural variations.
OTOH, there was a high level of solar activity from the late 40’s to the early 2000’s. That “modern maximum” is not just someone’s fanciful notation on a chart, but a period of many decades of higher than normal activity with the usual cycles within it. Granted it’s not a lot of extra energy, only about a watt. But over long periods of time that extra solar energy (plus possible connection from extra solar to lower GCR to fewer clouds) can warm some ocean surfaces. The extra warming can only add to the release in the 97/98 El Nino.
My theory of warming is pretty simple, but with a couple of dimensions. There are contributing factors from ENSO heat storage and release, but only if substantial La Ninas are followed by substantial El Ninos (otherwise the heat is lost to the deep ocean). Solar always contributes, but is modulated by weather and by the sun itself. GHG gases always contribute and the manmade component adds to that slowly over time. Thus the 97/98 heat release was increased by solar and CO2 factors to some extent as they added to the heat stored in 95/96 and previously.
No Bob, I did not confirm for you that I am “only considering the top 700 meters when discussing the ‘deeper ocean heat storage’.” When I said I was content to look at the 0-700 meter data it was in response to your statement that: “The only dataset I’m aware of is the NODC’s ocean heat content data for 0-700 meters.”
This data set shows a 40s-70s dip in temperature for more than just the well mixed upper ocean layer, an event which poses some challenge to both the CO2-warming theory and the solar-warming theory. Clearly there is some mechanism of internal variation at work that can overpower these other forcings for at least a few decades. I just noted that the presence of such a mechanism does not mean that the other forcings are not at work. The different climate drives can be superimposed, and what other challenge does the ocean temperature data present to the solar-warming theory?
Apparently you did have something else in mind, something to do with the rapid rise in ocean heat content during a La Nina? Rising heat content during La Ninas makes sense to me. Cooler top water emits less IR and gives up less heat by conduction to the atmosphere while still absorbing as much shortwave, or more if the La Nina lessens cloud cover. But what in the world does this have to do with whatever other warming or cooling effects that it may be superimposed on?
Are you trying to claim that you can distinguish what heat content effects are due to the La Nina from what smaller contemporaneous heat content effects might be due to solar or CO2? Sounds most implausible to me, no matter how finely gridded your data is, and yes, the latter is what I was referring to when I said it is ridiculous for you to ask other people to do what you do. You may think that by working over these very short-lived data sets you can pull the various superimposed phenomena apart. I wish you luck, but the idea that you can come to strong conclusions on this basis (“all the warming”), sorry, I don’t begin to buy it.
Maybe you can figure out how ENSO works. That would be great. Maybe you have figured it out. I hope so. But for my purposes, I don’t see how any of this makes any difference to the things I’m saying.
I think Bob has figured out how ENSO works but there are two remaining gaps:
i) How the oscillation started in the first place. Bob (I think) feels it sufficient that it be an emergent property of a system with moving parts and resistance from adjoining land masses whereas I think it is a result of thermal instability arising from the fact that the ITCZ mean position being north of the equator more solar energy gets into the oceans south of the equator than north of it.
ii) An explanation as to why there is apparently a difference between the peaks of successive positive phases at about 60 year intervals when in general ENSO is supposed to be a zero sum process which ought to net out to zero over a 60 year timescale. Bob seems satisfied that that is what he calls a multidecadal component to ENSO but I prefer to interpret it as a background solar signal.
Bob has objected to my point i) above on the basis that the southern ocean surfaces are actually cooler than the northern oceans but I put that down to more evaporative cooling in the southern hemisphere combined with the fact that, in the northern hemisphere, energy in the oceans backs up north of the equator due to limited access to the polar regions for cooling purposes due to land mass obstacles in the northern hemisphere.
That still doesn’t seem to prevent surges of ‘excess’ energy from southern to northern hemisphere in the ENSO cycle though.
@ Keith AB
I consider the reasons you outline ample cause to be skeptical of any accurate quantitative warming claims, but there are ample indications of warming in a more qualitative sense like glacier retreat (etc.) that it’s warmer now than say around 1900 and especially compared to circa 1700. Regardless of what Leif says, this correlates generally with sunspots at least on an anecdotal level of historical data considering the long lag times involved. (BTW: Bob is not saying the ocean hasn’t warmed since the LIA, just not lately, kind of like the rest of the climate.) I haven’t read all the comments between Alec and Bob, but I can’t say I’ve noticed any major conflict in their respective posts previously; I’ll need to take a closer look before commenting further.
Alec Rawls IMHO has put the CAGW advocates between a rock and a hard place here. They either have to claim there’s no CO2 warming “in the pipeline” which in effect greatly reduces “sensitivity” or admit there could be warming “in the pipeline” post solar activity peak. Either way it suggests a larger natural warming component than they’ve previously claimed was possible with their settled science.
Bob Tisdale IMHO generally puts CAGW advocates between a rock and a hard place about once a week to once a month; there’s just no way to resolve (try as they might) the observed heating pattern of the oceans not matching the expectations from CO2 induced warming and the ocean circulation patterns being a superior explanation of the claimed 20th century warming at least from a mechanistic perspective.
D Böehm Smokely sez:
No, only if you assume CO2 is the only driver of temperature (it isn’t) and that temperature is the only way we can measure increasing heat in the system (it isn’t). Stronger storms and melted sea ice use heat but don’t raise temperature.
And of course you are misattributing your second chart. The data is Phil Jones, the chart is the interpretation of Jo Nova.
Keith AB says:
January 11, 2013 at 4:51 am
Some very good stuff, but also this:
Yep, all big crimes are committed by “lone nuts,” and never, ever by a gang of nuts working together.
Alex and Bob If there’s a driver for El and La nino it would have to be this process http://www.ips.gov.au/Educational/5/2/3 Our first magnetic field line is the tropopause where the temperature is supose to be stable No rise or fall in temp’s’ so adding electrical energy to a stable regien of the atmosphere WILL create man made changes to the north south magnetic flow By charging up the tropopause (the glass ceiling for the greenhouse effect) blocks energy from escaping and entering the troposphere I guess the millitary use the tropopause to lissen in on world wide communication for secrity reasons. Pine Gap here in Australia is the heart for America’s security network from the other side of the world for lissening in. There’s a atmospheric energy inbalance and co2 gets the blame because of it’s negetive charge when in fact we release more electrons from our remote sensing and com’s systems. Because of the co2 negativity it gets carried North to the pole and this could explain why the polar jet strem is expanding south and if they want they can shift the jetstream further south by doing this http://hal.archives-ouvertes.fr/docs/00/31/64/49/PDF/angeo-16-1212-1998.pdf Question is the met office notified when and were weather modification is being carried out? and if not wouln’t all data be to noisy to get solid data.
@Alec Rawls: You respectfully wrote to Bob Tisdale: “You may think that by working over these very short-lived data sets you can pull the various superimposed phenomena apart. I wish you luck, but the idea that you can come to strong conclusions on this basis (“all the warming”), sorry, I don’t begin to buy it.”
I may be off base here. But I would like more people to take a look at the work that Bob has done. It makes sense to me based on data records, that Bob has been able to find where the heat goes based on ENSO events. This to me is a macro view of the heat picture – but when viewed this way, it seems eerily obvious. Of course the precision of the temperature data is greater than its accuracy, so it’s not possible to know where all the heat goes, I think. Bob makes a fantastic case if you go through the journey. Actually, I bought it… 8 bucks to be precise.
dvunkannon says:
January 11, 2013 at 1:55 pm
D Böehm Smokely sez:
January 10, 2013 at 9:38 am
Gary Pearse,
So are you saying that for 150 years up to the present with the warming periods the same duration and magnitude, that rapidly rising CO2 since the 1950s would not show itself in these periods. Take a ruler for the last ‘long’ warming period that appears to have come to an end in just before the end of the 20th Century, mark in the trend you believe is due to CO2 going forward to 2012 and lets see what residual natural trend there is. Now take this natural trend and plot it at the beginning of the previous warming trends and explain the residual without CO2.
It is a red herring to invoke latent heat in phase changes in ice for the recent change because the exact same thing happened to the ice in earlier periods. Lost Arctic ice was a big story in the 30s (they were also worrying about the seals – BTW. they were smart enough then to know that polar bears would be fine because the seals have to come to shore where the bears are lined up).
Sheesh, with all the models being wrong, with the UK met office now postponing temp rise until 2017 (no warming for over 20 years), with Israel and San Diego getting snow and frost, with Al Gore cashing in and going on to other opportunities, with the NYT chopping their environmental desk….. don’t be the last one to turn out the lights. What will it take!!!
dvunkannon,
Converting data into chart form does not make that data wrong. You just don’t like the fact that Phil Jones’ data deconstructs your belief that CO2 causes any measurable warming.
• • •
Jim W. says:
“Thanks for this post. It’s obvious the science is wrong and that CO2 and H2O don’t have any measurable effect on temperature.”
Exactly. That is what the planet is telling us.
Leif Svalgaard says:
January 10, 2013 at 7:47 pm
…
phlogiston says:
January 10, 2013 at 4:48 pm
Climate has nothing to do with numbers – at least not in the linear sense. Climate is a nonlinear / nonequilibrium pattern system, ignoring this and playing linear numbers games will only lead you down the garden path.
So you will be perfectly happy if the IPCC said: “by eyeballing the data, we predict really bad global warming some time in the future”. No you wouldn’t: you would require the data be properly number-crunched, the warming be quantified [with error bars], and the time frame specified.
OK my statement was OTT. If its numbers you want, here are some to get your teeth into:
http://wwwold.nioz.nl/public/fys/staff/leo_maas/publications/dkm.pdf
This paper by Doelman et al describes the unravelling of nonlinear tidal forcing of an enclosed coastal inlet. It looks like a nice analogy in a general way to seeing if a system is behaving like a nonlinear oscillator influenced by several periodic forcings. It turns out one’s first task is to derive the Melnikov function – or functions.
I believe that this is the sort of study needed to investigate any planetary or solar influences on climate, such forcing may not be strong resulting in direct following of the forcing frequency, but more complex due to weak forcing. Such weak nonlinear forcing would defeat simpel wiggle-matching approaches – however persistent – but might be revealed with the approapriate type of analysis, such as that reported here.
Stephen Wilde says:
January 11, 2013 at 1:02 pm
I think Bob has figured out how ENSO works but there are two remaining gaps:
i) How the oscillation started in the first place. Bob (I think) feels it sufficient that it be an emergent property of a system with moving parts and resistance from adjoining land masses whereas I think it is a result of thermal instability arising from the fact that the ITCZ mean position being north of the equator more solar energy gets into the oceans south of the equator than north of it.
ii) An explanation as to why there is apparently a difference between the peaks of successive positive phases at about 60 year intervals when in general ENSO is supposed to be a zero sum process which ought to net out to zero over a 60 year timescale. Bob seems satisfied that that is what he calls a multidecadal component to ENSO but I prefer to interpret it as a background solar signal.
This proposal – that phases of ENSO dominated by el Nino and La Nina are directly forced by oscillation solar parameters – is highly testable. We will have to see if such phase / regime changes in the past and future corellate to solar weather. Personally I feel there could be an intrinsic oscillation involved – but this does not rule out external forcing.
phlogiston says:
January 11, 2013 at 3:20 pm
I believe that this is the sort of study needed to investigate any planetary or solar influences on climate, such forcing may not be strong resulting in direct following of the forcing frequency, but more complex due to weak forcing.
Serious study of such things will be valuable, but they contrast strongly with the wild-eyed wiggle matching usually trotted out as proof of ‘open minds’.
@u.k.(us) says:
January 11, 2013 at 1:04 am
Mario Lento says:
January 11, 2013 at 12:15 am
u.k.(us) says: “You” got Mosher wrong, look it up !!
Tell me what you mean?
==================
Off the top of my head, he helped put missiles thru any window you wanted.
Just to clarify things/or not.
+++++++
I still do not understand where I have him wrong. What did I say that was incorrect?
Stephen Wilde says: “Your suggestion that the observation represents a multidecadal component to ENSO is, I think, a less likely speculation than mine because it does not account for the progression of climate change from MWP to LIA to date whereas my interpretation does.”
As I’ve written to you numerous times before, you need to present data to confirm your interpretations, otherwise you’re simply speculating.
Stephen Wilde says: “So, in my opinion, that uplift from the 1930s peak to the 1990s peak is in fact the solar signal working through the system in the background beneath the 60 year Pacific Multidecadal Oscillation.”
Same reply as above.
Eric (skeptic) says: “My theory of warming is pretty simple, but with a couple of dimensions. There are contributing factors from ENSO heat storage and release, but only if substantial La Ninas are followed by substantial El Ninos (otherwise the heat is lost to the deep ocean).”
What deep ocean data are you referring to that supports “the heat is lost to the deep ocean” during the otherwise timeframes?
Stephen Wilde, PS: Thank you for confirming that I’ve never discussed or speculated about “upward stepping from one positve PDO to the next”.
Alec Rawls says: “No Bob, I did not confirm for you that I am ‘only considering the top 700 meters when discussing the ‘deeper ocean heat storage’.” When I said I was content to look at the 0-700 meter data it was in response to your statement that: ‘The only dataset I’m aware of is the NODC’s ocean heat content data for 0-700 meters.’”
Good, I’m glad we’ve confirmed that you’re content with the NODC’s 0-700 meter data.
Alec Rawls says: “This data set shows a 40s-70s dip in temperature for more than just the well mixed upper ocean layer, an event which poses some challenge to both the CO2-warming theory and the solar-warming theory.”
On a global basis, the data does in fact show a cooling of ocean heat content from 1955 to the 1970s, as does the Pacific Ocean north of 24S (the tropical Pacific and the extratropical North Pacific):
http://i46.tinypic.com/25fu3q9.jpg
However, when you divide that Pacific data into two subsets, the tropical Pacific cools from 1957 to 1973 and it cools from 1976 to 1995:
http://i50.tinypic.com/juh9bb.jpg
Each one of those multidecadal cooling periods, and the fact that there’s an ENSO-related explanation for the short-term warming events, challenge “the CO2-warming theory and the solar-warming theory.”
And the North Pacific, north of the tropics, cooled from 1955 to 1988.
http://i48.tinypic.com/9gk192.jpg
That’s a continuous 3 decades of the data challenging “the CO2-warming theory and the solar-warming theory.”
So until the “the CO2-warming theory and the solar-warming theory” can explain the cooling of ocean heat content (0-700 meters) from 1957 to 1973, the cooling from 1976 to 1995 and the cooling from 1955 to 1988, those theories are based on faulty foundations.
That’s one of the problems with looking at data solely on a global basis, and that has been one of my messages for 4 years. The global ocean heat content data appears to present a long-term warming, but when we divide it into subsets, it shows long-term cooling with short-term warming. In fact, if we were to exclude the warming of ocean heat content in the tropical Pacific caused by the 1973-76 La Nina and the 1995/96 La Nina, the data would cool since 1957.
http://i47.tinypic.com/jhphmc.jpg
So the warming of the tropical Pacific over a 57-year term could be said to depend on 4 years of (La Nina-caused warming) data.
And if we exclude the warming of ocean heat content in the extratropical North Pacific caused by the obvious 1989/90 climate shift, the data cools since 1955.
http://i49.tinypic.com/29atwcp.jpg
And that means the warming of the extratropical Pacific to depths of 700 meters over a 57-year term depends on 2 years of data.
Both “the CO2-warming theory and the solar-warming theory” are flawed.
Alec Rawls says: “Apparently you did have something else in mind, something to do with the rapid rise in ocean heat content during a La Nina? Rising heat content during La Ninas makes sense to me.”
That’s what’s shown in this graph, which I included in my initial comment on this thread:
http://i48.tinypic.com/wcilgk.jpg
Alec Rawls says: “Cooler top water emits less IR and gives up less heat by conduction to the atmosphere while still absorbing as much shortwave, or more if the La Nina lessens cloud cover.”
The stronger Pacific trade winds associated with La Nina events do reduce cloud cover over the tropical Pacific.
http://i48.tinypic.com/15wawbd.jpg
Refer also to Pavlakis et al (2008):
http://www.atmos-chem-phys-discuss.net/8/6697/2008/acpd-8-6697-2008-print.pdf
Alec Rawls says: “But what in the world does this have to do with whatever other warming or cooling effects that it may be superimposed on?”
What other warming and cooling effects are you discussing?
Eric (skeptic) says: “GHG gases always contribute and the manmade component adds to that slowly over time. Thus the 97/98 heat release was increased by solar and CO2 factors to some extent as they added to the heat stored in 95/96 and previously.”
There’s no evidence that greenhouse gases contribute to the warming of sea surface temperatures or ocean heat content. Let me borrow a few graphs from my reply to Alec above to illustrate this.
The ocean heat content for the tropical Pacific cools from 1957 to 1973 and it cools from 1976 to 1995:
http://i50.tinypic.com/juh9bb.jpg
Where’s the greenhouse gas-driven warming from 1957 to 1973 and from 1976 to 1995?
The ocean heat content for the North Pacific, north of the tropics, cooled from 1955 to 1988.
http://i48.tinypic.com/9gk192.jpg
Where’s the greenhouse gas driven-warming from 1955 to 1988?
Or, to look at the data another way, we can exclude the warming of ocean heat content in the tropical Pacific caused by the 1973-76 La Nina and the 1995/96 La Nina. The data cools since 1957.
http://i47.tinypic.com/jhphmc.jpg
Where’s the greenhouse gas driven-warming from 1955 to 2012, without those La Ninas?
Again, to look at the data differently, we can exclude the warming of ocean heat content in the extratropical North Pacific caused by the obvious 1989/90 climate shift. The data then cools since 1955.
http://i49.tinypic.com/29atwcp.jpg
Where’s the greenhouse gas driven-warming from 1955 to 2012 without that 2-year climate shift?
Have you seen me break down satellite-era sea surface temperatures? The sea surface temperatures for the East Pacific haven’t warmed in 31 years:
http://oi48.tinypic.com/flkhmb.jpg
Where’s the greenhouse gas driven-warming of the East Pacific from 1982 to 2012?
The sea surface temperatures for the South Atlantic-Indian-West Pacific cools between the strong El Nino events of 1986/87/88 and 1997/98 and cools between the strong El Nino events of 1997/98 and 2009/10:
http://oi48.tinypic.com/otg19s.jpg
Where’s the greenhouse gas driven-warming from 1988 to 1997 and from 1998 to 2009?
That leaves the sea surface temperature data for the North Atlantic, with the Atlantic Multidecadal Oscillation, which, since the mid-1970s, has provided additional natural warming of the North Atlantic sea surface temperatures above the natural warming of the other ocean basins.
Greenhouse gases appear as though they simply cause a little more evaporation from the ocean surfaces as oceanographers and physicists have been saying all along.
jmorpuss says: “Alex and Bob If there’s a driver for El and La nino it would have to be this process http://www.ips.gov.au/Educational/5/2/3”
I took a quick look but did not see a data source, so that I could compare it to an ENSO index. Do you have a link to a dataset?
Bob the link above doesn’t take you to were it should I’ll post it again here http://www.ips.gov.au/Educational/5/2/3#prop And if it’s the power data you request then good luck on that one I’ve tried to get ERP (effective radiated power) figures with no luck.
(Snip. If that is your idea of debate you can take it elsewhere. Next off-topic attempt gets future comments deleted. ~mod)
Welcome to the reality based segment of the population that trusts HadCRUT3! Still, the basic issue is that CO2 is not the only driver of global temperatures, so you are arguing against a strawman here, as is Jo Nova. You might as well draw a few more lines on that second chart, and ask how steadily rising anthropogenic emission rates and total accumulation of CO2 in the atmosphere could cause the temperature to go down. Because that is the argument you are making, that 100% of the trend is attributable to CO2.
But if you insist on playing with colored lines, you might try to be a bit more science-y by making all the intervals the same length – you know, apples to apples and all that. If we make Jo’s first interval 30 years long, like the others, by starting in 1850 instead of 1860, what happens? Oh, the slope is different. If we make it end in 1890 instead of 1880, what happens? Oh, the slope is different. So careful choice of endpoints is necessary to make the argument work. Clue – that ain’t science.
Again, all is not lost! It is great to see that you think 30 year periods are needed to make a point about climate. Totally drives a stake in the heart of the 16 years of no warming meme, eh? And you had it right from the start. Good boy!
Bob This is why I have not been able to get the ERP for cross equatorial com’s
http://en.wikipedia.org/wiki/Spread_spectrum Big brother is allways looking over or shoulders .
vun Kannon,
Even the Met Office now admits that global warming has stopped. That admission totally drives a stake into the heart of your failed conjecture, eh? And you thought you had it right from the start.
Wrong.
@D Boehm Stealey – Stopped for what? 16 years? When the temperature was rising, we regularly heard that 20, 30 years of data was necessary to recognize a trend in climate. Come back in 14 years with your claim that global warming has stopped.