
Model-Data Comparison: Pacific Ocean Satellite-Era Sea Surface Temperature Anomalies
Guest post by Bob Tisdale
I’ll be adding the Pacific Ocean (60S-65N, 120E-80W) sea surface temperature anomalies to my monthly updates. See Figure 1 for the area covered by those coordinates. Why add the Pacific Ocean? It covers about 45% of the surface area of the global oceans and about 33% of the surface area of the globe (land+oceans combined). Or, to look at it another way, the Pacific Ocean covers more of the globe than the continental land masses combined. The Pacific stretches almost halfway around the globe at the equator, which is one of the reasons why El Niño and La Niña events are so important to global climate. When an El Niño releases a massive volume of naturally created warm water from below the surface of the western tropical Pacific and spreads it across the surface of the eastern tropical Pacific, precipitation and surface temperatures react globally—responding to the all of the additional moisture in the atmosphere and to the shifts in atmospheric circulation (jet streams).
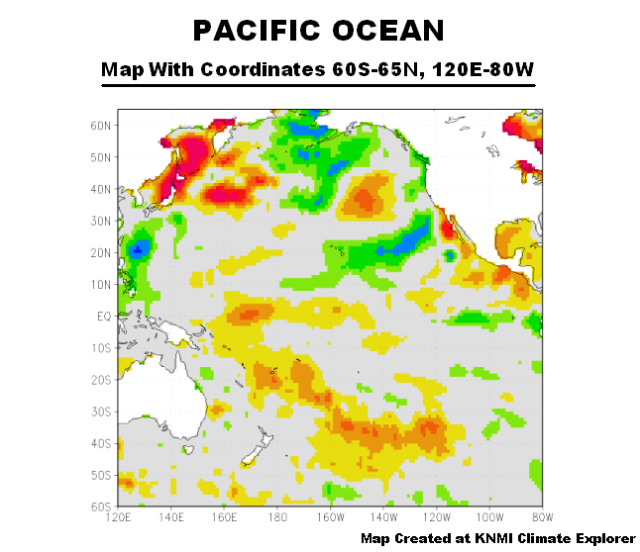
Figure 1
With that in mind, I decided to run a quick model-data comparison for the Pacific, using the coordinates listed above.
The following graph (Figure 2) compares the Reynolds OI.v2-based satellite era sea surface temperature anomalies to the multi-model ensemble mean of the RCP6.0-based climate models from the CMIP5 archive. Those model outputs are available through the KNMI Climate Explorer. The CMIP5 archive is being used by the Intergovernmental Panel on Climate Change (IPCC) for their upcoming 5th Assessment Report (AR5). Climate forcing scenario RCP6.0 is similar to the commonly used A1B scenario from past IPCC reports. I’ve started the comparison in January 1994, right after the apparent rebound from the impacts of the volcanic eruption of Mount Pinatubo—the impacts in the data, not the models. The model mean represents the best-guess estimate of how the sea surface temperature anomalies for the Pacific Ocean would warm IF they were warmed by manmade greenhouse gases. The models say the Pacific sea surface temperatures should have warmed approximately 0.4 deg C or about 0.7 deg F. However, based on the linear trend, the satellite-based data for the Pacific Ocean haven’t warmed since 1994. That’s one month shy of 19 years, almost 2 decades, with no warming of the sea surface temperatures for the entire Pacific Ocean. That’s a chunk of real estate (wet real estate) that appears to contradict the hypothesis of greenhouse gas-driven global warming. I have a funny feeling we won’t see this model-data comparison in the upcoming IPCC AR5.
Figure 2
If we extend the model-data comparison back in time to the November 1981 start of the dataset, Figure 3, the trend of the model simulations is still about 3 times higher than the observed warming. If the modelers can’t even simulate the warming of the largest ocean basin on the planet, what value do the models have? Some readers might think the answers are none, nada, zip.

Figure 3
Figure 4 presents the Pacific Ocean sea surface temperature anomalies as they will appear in the monthly updates.

Figure 4
FOR THOSE NEW TO SEA SURFACE TEMPERATURE ANOMALY GRAPHS
The large upward spikes in Figure 4 are caused by El Niño events and most of the downward ones are caused by La Niñas. The effects of the explosive volcanic eruptions of El Chichon in 1982 and Mount Pinatubo in 1991 are also evident. The eruption of El Chichon counteracted the effects of the 1982/83 El Niño, which was comparable in size to the one in 1997/98, so the spike in 1982/83 would have been stronger if not for that volcanic eruption. And the eruption of Mount Pinatubo overwhelmed the effects of a series of smaller El Ninos around then and caused the apparent dip and rebound from 1991 until the end of 1993.
HAT TIP
Many thanks to Jennifer Marohasy.
INTERESTED IN LEARNING MORE ABOUT THE EL NIÑO AND LA NIÑA AND THEIR LONG-TERM EFFECTS ON GLOBAL SEA SURFACE TEMPERATURES?
Why should you be interested? Sea surface temperature records indicate El Niño and La Niña events are responsible for the warming of global sea surface temperature anomalies over the past 30 years, not manmade greenhouse gases. I’ve searched sea surface temperature records for more than 4 years, and I can find no evidence of an anthropogenic greenhouse gas signal. That is, the warming of the global oceans has been caused by Mother Nature, not anthropogenic greenhouse gases.
I’ve recently published my e-book (pdf) about the phenomena called El Niño and La Niña. It’s titled Who Turned on the Heat? with the subtitle The Unsuspected Global Warming Culprit, El Niño Southern Oscillation. It is intended for persons (with or without technical backgrounds) interested in learning about El Niño and La Niña events and in understanding the natural causes of the warming of our global oceans for the past 30 years. Because land surface air temperatures simply exaggerate the natural warming of the global oceans over annual and multidecadal time periods, the vast majority of the warming taking place on land is natural as well. The book is the product of years of research of the satellite-era sea surface temperature data that’s available to the public via the internet. It presents how the data accounts for its warming—and there are no indications the warming was caused by manmade greenhouse gases. None at all.
Who Turned on the Heat? was introduced in the blog post Everything You Every Wanted to Know about El Niño and La Niña… …Well Just about Everything. The Updated Free Preview includes the Table of Contents; the Introduction; the beginning of Section 1, with the cartoon-like illustrations; the discussion About the Cover; and the Closing. The book was updated recently to correct a few typos.
Please buy a copy. (Credit/Debit Card through PayPal. You do NOT need to open a PayPal account.). It’s only US$8.00.
VIDEOS
For those who’d like a more detailed preview of Who Turned on the Heat? see Part 1 and Part 2 of the video series The Natural Warming of the Global Oceans. Part 1 appeared in the 24-hour WattsUpWithThat TV (WUWT-TV) special hosted by Anthony Watts in November 2012. You may also be interested in the video Dear President Obama: A Video Memo about Climate Change.
SOURCES
The NOAA Optimally Interpolated Sea Surface Temperature Data (Reynolds OI.v2) are available through the NOAA National Operational Model Archive & Distribution System (NOMADS).
http://nomad3.ncep.noaa.gov/cgi-bin/pdisp_sst.sh
The CMIP5 Sea Surface Temperature data (identified as TOS, assumedly for Temperature of the Ocean Surface) is available through the KNMI Climate Explorer Monthly CMIP5 scenario runs webpage.
Thanks, Anthony.
Great stuff Bob!
Thank you for the post. NOAA predicts EL Nino and to me it seems like La Nina is goin to show up pretty soon. What is your prediction?
Olavi, last time I looked NOAA was projecting ENSO-neutral through the rest of the season:
http://www.cpc.ncep.noaa.gov/products/analysis_monitoring/lanina/enso_evolution-status-fcsts-web.pdf
I don’t make predictions, but ENSO-neutral sounds reasonable to me.
Refer also to my preliminary November 2012 sea surface temperature update. It’s a week old. NINO3.4 sea surface temperature anomalies have dropped a little since then:
http://bobtisdale.wordpress.com/2012/11/26/preliminary-november-2012-sea-surface-temperature-anomaly-update/
Regards
Nah? What did I tell you. 1995 – is when the regime changed from warming to cooling. It is the radiation less than half um that warms the oceans and that drives the weather. And that type is regulated by the sun (Gleisberg cycle)
Quick question – re the model ensemble used in the comparions (CMIP5/IPCC) – are any other models (or perhaps the individual components of the ensemble) showing better results?
I find it quite disconcerting that the difference between model(s) and reality is so bad, (yeah, I know the models aren’t going to be perfect, but hey, this is ridiculous IMHO) especially as the models seems to inherently ‘show’ (or calculate via inherent forcings?) a permanent rising trend well above and beyond the observed cooling periods.
Frankly, I would consider the modelers to be way off base with these efforts and any and all works/papers and policy statements or actions based on such models should be immediately revoked/withdrawn, etc.
Bob,
Aren’t there two lessons here? The models have got the slope wrong with respect to warming of the oceans but they also miss the ENSO cycle. Since so much of the seasonal weather patterns are dependent upon the ocean set up, could you also argue that if you cannot predict ENSO (or the temperature distributions in other ocean basins) that you cannot predict the weather and more specifically predict anything about extreme weather?
When were those climate model predictions made?
.
Just a quick observation on a closely related subject.
I have seen it written in WUWT that hurricanes cool the sea, and therefore remove thermic energy from the sea/climate (depositing this energy into the upper atmosphere, and thence intomspace).
However, when I was in the Mediterranean, a small but rough storm passed, and the sea was noticeably 5 degrees c cooler afterwards. Quite obviously, this warm surface temperature had not been redistributed into the atmosphere, but the rough sea surface had redistributed (mixed) this warmth into lower layers in the sea.
Thus storms and hurricanes may well store energy in the lower layers of the sea, for later seasons, rather than dissipating it. Is this so?
.
So .2 since the cold spell of the 40s through the 70s. I wonder what it was like prior to the cold spell?
Bob– Thank you as always for your excellent and informative reports.
I’d like to suggest that occasionally, 2-standard deviation bands be placed on the CMIP temp projections to give a clearer statistical indication of just how far off IPCC’s model projections are from reality.
Thank you.
So Bob, in your first figure, some of those purple up and down edges are pretty darn steep, which just doesn’t look like thermal time constan theating effects, for such a huge mass of water, with an astronomical heat content.
But then it is SST that is plotted, and not total ocean volume Temperature.
So somebody like me who knows pretty much nothing about oceans, would take a WAG that these SST numbers are mostly the result of “stirring” up the oceans, and bringing already existing “heat” to the surface, rather than new heating and cooling of a much more static thermal mass.
I can see how rotation plus land mass edge interractions could be quite effective stirring tools, along with storm systems making it quite chaotic.
For the life of me, I can’t even imagine how one could model such a system.
Well what the hell ! I see the pretty powder blue lines say they can’t.
I do not know the little ENSO meter gets data from – but the indicator is tilted towards the El Nino side of neutral.
SOI daily data plus 30 day and 90 day averages at the Long Paddock page suggest it should tilt towards La Nina.
http://www.longpaddock.qld.gov.au/seasonalclimateoutlook/southernoscillationindex/30daysoivalues/
Silver Ralph, why is it quite obvious that
‘the rough sea surface had redistributed (mixed) this warmth into lower layers in the sea’
?
“””””…..
Silver Ralph says:
December 6, 2012 at 9:21 am
Just a quick observation on a closely related subject……”””””
So Silver, most big oceanic storms physically transport millions of tonnes of real H2O mass into the atmosphere, along with about 590 calories per gram, of latent heat of evaporation.
So I think your thesis doesn’t hold water; that surface “heat” has gone to where the sun DOES shine; the upper atmosphere. So it isn’t down in Davey Jones’ locker !
It seems to me this prediction business, be it numeric models or goat guts is nothing but a sham game of intellectual slight of hand. We all know the numeric models are um-calibratable, as all the variables are neither understood, cataloged or accurately measured. That aside from the impossibility of modeling dynamic systems with essentially static mathematics. This models and often some of the empirical data being collected are also suffering from overly precise inaccuracies.
george e. smith says:
December 6, 2012 at 9:46 am
“So Silver, most big oceanic storms physically transport millions of tonnes of real H2O mass into the atmosphere, along with about 590 calories per gram, of latent heat of evaporation.”
I did a rough calculation that Hurricane Ike dropped enough water to fill about 1/3-1/2 of Lake Erie.
george e. smith says:
December 6, 2012 at 9:37 am
“would take a WAG that these SST numbers are mostly the result of “stirring” up the oceans, and bringing already existing “heat” to the surface, ”
From the water temperature profiles that i’ve seen (a handful), the surface is the warmest water, and below about 300m it’s almost all near freezing.
In case it was not clear from my previous comments and questions, I respect your work.
Thanks for the post.
Silver Ralph: when I was in the Mediterranean, a small but rough storm passed, and the sea was noticeably 5 degrees c cooler afterwards. Quite obviously, this warm surface temperature had not been redistributed into the atmosphere, but the rough sea surface had redistributed (mixed) this warmth into lower layers in the sea.
Why was it obvious, or even evident, that the energy had been redistributed to the lower layers in the sea instead of the upper atmosphere?
Just looking at the CMIP model ensembles, not only are the trends wrong, the magnitude of the seasonal fluctuations are way off (amplitudes much too small). Time to
debugrecalibrate the models…” Silver Ralph says:
December 6, 2012 at 9:21 am
Thus storms and hurricanes may well store energy in the lower layers of the sea, for later seasons, rather than dissipating it. Is this so?”
This season is a later season for previous seasons as are all previous seasons. You seem to be suggesting that the climate is constatntly forcing energy into the deep ocean. The renown Dr Trenberth as failed to find this energy, in fact he thinks it’s a travesty. And as the models predict surface warming your hypothesis if correct would prove them wrong as much as the actual sea surface temperature record does.
Models are wrong and you are wrong.
Frank K. says: “Just looking at the CMIP model ensembles, not only are the trends wrong, the magnitude of the seasonal fluctuations are way off (amplitudes much too small).”
The ensemble mean is the average of dozens of ensemble members and the models are not initiated at any one specific time, so the yearly variations cancel out one another, minimizing the amplitudes we’re seeing.
Anthony,
A suggestion inspired by this latest model fail.
Can you put up a reference page that tracks “claim v data” so we can keep track of CAGW models as they fail?
I’d be willing to bet that if we correlated years to fail and fail that the only surviving alarmist claims are those at the long end of the prediction spectrum.
DR says: “When were those climate model predictions made?”
DR, according to the schedule here…
http://cmip-pcmdi.llnl.gov/cmip5/
…the archive was open through July 2012, with the first models expected to be submitted in February 2011.
Ralph, I thought surface turbulence had little or no impact below 60 fathoms?
DavidS says: December 6, 2012 at 9:42 am
Silver Ralph, why is it quite obvious that ‘the rough sea surface had redistributed (mixed) this warmth into lower layers in the sea’
__________________________________________
Because the storm had precious little convective activity associated with it, to transport the energy into the atmosphere, but plenty of high winds and very rough seas. Yet the surface sea temperature was so cold the next day, you could barely swim in it.
This is why it seemed obvious to me that the rapidly cooling surface temperature was caused by mixing, rather than evaporation. But if the storm mixed the warm water into lower levels, then that thermic energy was being stored for later seasons and years. If this is true of all storms and hurricanes, then do they not store solar energy more than they dissapate it?
.
Bob Tisdale says:
December 6, 2012 at 10:53 am
Frank K. says: Just looking at the CMIP model ensembles, not only are the trends wrong, the magnitude of the seasonal fluctuations are way off (amplitudes much too small).
“The ensemble mean is the average of dozens of ensemble members and the models are not initiated at any one specific time, so the yearly variations cancel out one another, minimizing the amplitudes were seeing.”
Bob, I understand what you saying – perhaps it would be interesting to plot anomalies from the individual ensemble members to see what the yearly variations look like.
“I have a funny feeling we won’t see this model-data comparison in the upcoming IPCC AR5.”
Are you kidding? Nothing inconvenient will appear in IPCC AR5, only ‘homogenised’ data and fantasy computer models will be allowed.
Climate computer model predictions have done so much damage to the western world’s economies in that they have resulted in gullible/dodgy politicians imposing insanely expensive and unreliable ‘renewables’ energy policies, not to mention carbon taxes.
Silver Ralph says:
December 6, 2012 at 11:35 am (replying to a question from DavidS)
DavidS says: December 6, 2012 at 9:42 am
Silver Ralph, why is it quite obvious that ‘the rough sea surface had redistributed (mixed) this warmth into lower layers in the sea’
__________________________________________
Because the storm had precious little convective activity associated with it, to transport the energy into the atmosphere, but plenty of high winds and very rough seas. Yet the surface sea temperature was so cold the next day, you could barely swim in it.
This is why it seemed obvious to me that the rapidly cooling surface temperature was caused by mixing, rather than evaporation. But if the storm mixed the warm water into lower levels, then that thermic energy was being stored for later seasons and years. If this is true of all storms and hurricanes, then do they not store solar energy more than they dissapate it?
—-
You are wrong. Again.
I will assume you were correct in that you were on the surface during a storm in the Mediterranean, and that (somehow) you measured credible and calibrated water temperatures at all relevant and meaningful water depths before, during, and after that storm over a sufficient region of the Mediterranean to make your statement valid.
Your “conclusion” is dead wrong.
I have been on – and more importantly – under storms at sea. Real stroms, not localized thunderstorms in a highly saline, very shallow sea surrounded by solar-concentrated heat energy on rocky lands at low latitudes and generally clear skies.
There is a noticeable “rolling” motion due to waves between 30 feet (9 meters) and 45 feet below sea level during storms. There is a very minor “rocking” of a submarine between 60 feet and 120 feet depth below sea level. Below 150 feet (45 meters) there is no motion detectable due to storms.
If the submarine is not being moved by the massive energy of tons of mass of surface waves under 50 knot wind forces at 150 feet depth, then those waves CANNOT be distributing ergs of heat energy measured by 1/10 degree changes in temperature from the upper surface to the deep water where you apparently (hope ?) to find Trenberth’s missing heat energy.
Oceans are not storing “heat” below the surface.
http://en.wikipedia.org/wiki/Thermocline
Sea water has 800 times the density of the air above, and 4 times the specific heat capacity. That means the top one meter of ocean holds 3200 times the thermal energy of the same volume of air at the same temperature. Just a few meters of ocean holds the same thermal energy as the entire planetary atmosphere. The rest of the ocean is a gigantic thermal sink, as the chart in the thermocline graph above clearly shows.
Oh. About your “perceived” cold water the next day.
You did mention that the storm in question dumped water (from the sky, from the upper-levels of the atmosphere in thunderstorms where things like water condense around nuclei and heavy freezing objects like hail and sleet fall even on 100+ degee afternoons) right?
Now, if as on the shallow Mediterranean water that I’ve swum in in, the (calm, unmixed) surface layers were heated thoroughly by the sun for several days, then suddenly dumped on by a non-highly mixed highly-localized mass of cold, fresh water equal to 1-3 inches rainfall, is it not surprising that the upper few inches of sea water were cooled by the dumping of cold rainwater?
And, gee whiz, if that falling rainwater who’s temperature (that you measured with a calibrated toe exposed to the water) were evaporated elsewhere, then the net loss of energy (heat of evaporation) would be removed from the water areas where it was evaporating, right? Not removed from the area where it was falling? But, rather, would not that heat loss (from evaporation elsewhere and conduction to the cold atmosphere high above) be deposited INTO the surface water where the rain fell?
Adding to RACookPE1978 comment above. I can confirm his facts. No real surface effects can be felt below even the strongest storms. Not only is sea water 800 times denser than air, it is also very viscous compared to air. That damps anything resembling turbulence. Big shocks like explosions and earthquakes could be dangerous due to the low compressibility. But in real conditions, the open ocean is not the problem. the problem is the transfer of shockwaves to the fixed surfaces (shores) that converts the energy into wave heights. Snorkeling around the shore surface does not reveal the real ocean. It’s mostly cold, dark and motionless.
If you want to measure surface temps, measure them just below the surface where the real energy is located. Solar energy heats the surface, the surface heats the surroundings. If you want to understand climate change, you need to understand the surface albedo. Also cloud albedo.
RACookPE1978,
That marine storms with high wind speeds cause vertical mixing of the water column is a well known phenomenon.
Silver Ralph says:
December 6, 2012 at 11:35 am
High winds, and rough seas… Hi Silver Ralph, if your coffee is too hot, what do you do? Blow on it? On a small scale you’re introducing high winds and roughening the surface. Does this push heat further into your coffee? It would be pointless if it did. It removes the hottest particles of coffee into the atmosphere, just like the storm does. Read one of Willis’s old papers (search this site) on his thunderstorm thermostat theory. It will become obvious.
Enjoy your coffee!
HB
Silver Ralph says:
December 6, 2012 at 9:21 am
.
Just a quick observation on a closely related subject….
>>>>>>>>>>>>>>>>>>>>>>>>>>>>
Check out Willis’s Thermostat theory
The Thermostat Hypothesis
Further Evidence for my Thunderstorm Thermostat Hypothesis
Willis publishes his thermostat hypothesis paper
Silver Ralph says:
December 6, 2012 at 9:21 am
I have seen it written in WUWT that hurricanes cool the sea, and therefore remove thermic energy from the sea/climate (depositing this energy into the upper atmosphere, and thence intomspace).
That’s correct. Ocean surface temperatures drive hurricanes.
However, when I was in the Mediterranean, a small but rough storm passed, and the sea was noticeably 5 degrees c cooler afterwards. Quite obviously, this warm surface temperature had not been redistributed into the atmosphere, but the rough sea surface had redistributed (mixed) this warmth into lower layers in the sea.
Thus storms and hurricanes may well store energy in the lower layers of the sea, for later seasons, rather than dissipating it. Is this so?
The storm you saw would have been convective (formed over land) or frontal, and not driven by sea surface temperature. The Med is usually a calm sea with little wave action and therefore little mixing of surface waters with lower levels. Which means solar energy is retained in the top layer. The wave action from the storm would have mixed the upper layer with colder water from below.
So you are correct in your conclusion, but bear in mind the same thing will happen year after year and its whether there is any increase or decrease in mixing which will determine if there is a net warming of the lower levels of the ocean (caused by storms).
In figure 3, comparing the model average to the measurements, it’s seems that the ups and downs match each other to some degree. In the middle big peak does not. Considering that this figure is a comparison of an ensemble average with a single measurement sequence it’s kind of surprising. The averaging would account for the different amlitudes but the patterns are vaguely the same.
The other oddity I noticed is that skeptic land is able to accept that aerosols, with very very very tiny concentrations in the atmosphere, can affect global climate, but somehow the much larger amounts of CO2 cannot. Bit of an inconsistency there guys.
Bob, a question about the Argo data. You stated that the data you get is already smoothed and adjusted before you plot it. Is there any chance to see the raw data?
LazyTeenager says:
December 6, 2012 at 1:03 pm
Huh?
I thought it was the climate modeling community that invented the aerosol dial in order to make their models work.
Lazy says:
“…skeptic land is able to accept that aerosols, with very very very tiny concentrations in the atmosphere, can affect global climate, but somehow the much larger amounts of CO2 cannot. Bit of an inconsistency there guys.”
As usual, we see that reality is different on Lazy T’s planet. Lazy presumes that aerosols and CO2 should act the same.
It should also be noted that the alarmist cult believes that the aerosol concentration exactly negates the putative warming caused by “carbon” . That is a preposterous assumption, every bit as silly as their evidence-free belief that CO2 is the “control knob” of the planet’s temperature.
People like Lazy Teenager live in a bizarro world of ridiculous beliefs. Despite sixteen years of evidence to the contrary, Lazy still believes in his catastrophic AGW nonsense. His belief is enabled by his incurable cognitive dissonance. Like Winston Smith wondering if everyone believed that 2 + 2 = 5, would that make it true? Lazy looks at 16 years of non-global warming and wonders if that is proof of catastrophic AGW. Earth to Lazy: the planet is telling us the truth; you are not.
Frank K. says: “Bob, I understand what you saying – perhaps it would be interesting to plot anomalies from the individual ensemble members to see what the yearly variations look like.”
I do not intend this in a rude way: But here’s a link to the CMIP5 output page at the KNMI Climate Explorer:
http://climexp.knmi.nl/selectfield_cmip5.cgi?id=someone@somewhere#ocean
Sea surface temperature outputs are identified as TOS. Anyone can perform any analysis they wish to perform.
Hopefully that didn’t sound rude. I don’t like sounding rude around the holidays. (I save that for after the holidays.)
Regards
LazyTeenager says: “The other oddity I noticed is that skeptic land is able to accept that aerosols, with very very very tiny concentrations in the atmosphere, can affect global climate, but somehow the much larger amounts of CO2 cannot. Bit of an inconsistency there guys.”
Once again you have expressed your very limited understanding of the subject matter. Volcanic aerosols impact downward shortwave radiation (visible sunlight) which has a very obvious impact on sea surface temperature and ocean heat content. On the other hand, CO2 impacts the amount of downward longwave radiation, which has NO observable impact on sea surface temperature and ocean heat content. Get it?
Bob Tisdale says; “Or, to look at it another way, the Pacific Ocean covers more of the globe than the continental land masses combined. The Pacific stretches almost halfway around the globe at the equator, which is one of the reasons why El Niño and La Niña events are so important to global climate”.
Few people realise the true immensity of the Pacific Ocean so I tell them to try this little example.
Get one of those basket ball sized globes of the world on it’s stand.
Place the globe so that the equator is a little above eye level and the North Pole is tilted directly away from you.
Turn the globe until you have the immensity of the Pacific, the South Pacific and a part of the Great Southern Ocean facing you.
You will be able to see New Zealand in it’s entirety. Also the world’s largest Island, New Guinea together with three quarters of the Australian continent on the far left side and about half the Antarctic continent right at the bottom.
Thats it!
Those land masses are all that are visible and the only significant land masses in the third of our world that you see when looking at that globe.
The rest is water, the immense expanse of the Pacific Ocean with just a dusting of very small islands distributed across the south west third of the ocean.
We live on a water world where 71% of our planet is covered with 1.3 billion cubic kilometres of water although few are truly aware of the role that immensity of water plays in the planetary processes and the planet’s geological, climatic and life evolving history.
Susan S. says: “Bob, a question about the Argo data. You stated that the data you get is already smoothed and adjusted before you plot it. Is there any chance to see the raw data?”
First, sorry, this isn’t ARGO data. This is sea surface temperature data. ARGO data is usually presented as part of Ocean Heat Content data. Second, the raw data appears on the graphs. The observational data in Figures 2 and 3 is “Raw”. And Figure 4 includes the raw data in purple and the smoothed data in dark blue.
Regards
Minor typo department…..
“Who Turned on the Heat? was introduced in the blog post Everything You Every Wanted to Know about El Niño and La Niña… ” should be “Everything you Ever…..”. It’s a hotlink, so I hope it can be fixed without lotsa difficulties.
IanM
Thanks Bob, and thank you so much. I am learning more as I listen and read your posts here and on your site.
P.S; I was watching P 2. of your Natural Warming of the Global Oceans video, when you said in the video, that ARGO data is tacked on at the 2007-2011 global temperature data of the oceans on top of the original observational data. So shouldn’t the ARGO data have it’s own graph? It measures more than the Reynolds Ol.v2 data doesn’t it?
Thanks for answering my question before, by the way. I appreciate all the time you give to many of us willing to learn a bit more about our oceans which in turn do drive temperatures on land.
“LazyTeenager says:
December 6, 2012 at 1:03 pm
The other oddity I noticed is that skeptic land is able to accept that aerosols, with very very very tiny concentrations in the atmosphere, can affect global climate, but somehow the much larger amounts of CO2 cannot. Bit of an inconsistency there guys.”
That may be the view of some sceptics but there is a very simple example. Take a sheet of glass, paint it with a thin layer of black paint, lo and behold no light gets through. Now imagine spreading that black paint exactly vertically through 40,000 ft of atmosphere. Still no light would get through. So a sceptic fox is shot. Good. I’m a sceptic but rely on science in which it is quite reasonable that the black paint stops light, CO2 has very little effect and no significantly dangerous resultant effect and aerosols can have a significant effect through triggering the formation of clouds.
Simple really.
Reprinting this comment from your earlier posting, which you’re probably not responding to anymore:
Bob, I love your posts and found the video very informative and well done. Not long enough as far as I was concerned. But I am still left some questions.
Most of them have to do with where the heat comes from that ENSO redistributes around the world. I gather that the source of it is tropical sunshine warming the equatorial pacific waters. So my question is, why has that been increasing over the last 30 years, raising ocean heat content, and not just evening out? Why the step up to new levels, rather than just back up to the same level?
I understand from the video how the La Nina events account for the ocean heat increase, and the subsequent spreading of that heat by El Ninos. But why have the La Nina’s put so much heat into the oceans during this time, for the El Ninos to spread it around and warm the whole atmosphere? I get the logic that this is hard to account for by purely GHG forcing, but I still don’t see where it is coming from. Is it a decrease in cloud cover over the tropics? Why so much decrease then? What is driving that?
It even makes me wonder how the oceans warm up to begin with. Is it only through direct sunshine? Does the GHG effect have any direct influence on ocean heat or surface temps? I understand how GHG effects can trap heat in the atmosphere, but can they have that effect on the oceans as well? What do the AGW people claim in that regards?
Also: what is that causes the increased strength of the trade winds that brings about La Ninas?
I know these are a lot of basic questions that may take too long for you to answer. Perhaps you could point me towards some links that do.
Thanks
If you go back to 1965, you see a rise … which is now becoming the warmist’s new time frame. Along with the claim that without AGW the world would have cooled another 0.6C.
A cynical man, the type I am, would say to pin the beginning of the trendline to 1983 @ -0. 30C., so that the 2012 temp is about + .034C, rising at under 0.2C/decade, but “worse is to come”. Then the observations match the prediction (much as a bad-fitting suit, at all places where they touch).
In essence, I think that is what they are doing to show that temps are both rising and in keeping with IPCC theory. The problem with this is that the necessary temps for >2012 have to be even more extreme. A year or two more of flat or falling SSTs will make the whole theory very, very hard to explain except …
That the world is in a natural cooling period! Thank goodness for AGW! Reverse carbon credits! Companies that contribute CO2 stave off an ice age and should be financially rewarded.
(You heard it here first.)
Bob
“When an El Niño releases a massive volume of naturally created warm water from below the surface of the western tropical Pacific and spreads it across the surface of the eastern tropical Pacific, …… ”
Me
Hi Bob – Perhaps the El Ninos spew out Keith Trenberth’s missing heat?
Susan S. says: “So shouldn’t the ARGO data have it’s own graph?”
I used to prepare posts solely about ARGO-era ocean heat content data. Example:
http://bobtisdale.wordpress.com/2011/03/25/argo-era-nodc-ocean-heat-content-data-0-700-meters-through-december-2010/
That was one of my favorite posts to prepare, especially the animations. Watch how ENSO drives the warm and cool anomalies away from the tropical Pacific.
But I recently published a post that was basically about the differences between the “measured” and presented ocean heat content data and about the fact that the “measured” data had unceremoniously been removed from the KNMI Climate Explorer after complaints by NOAA and the UK Met Office (there’s no other reason for KNMI to remove it).
http://bobtisdale.wordpress.com/2012/06/02/ukmo-en3-ocean-heat-content-anomaly-data-disappeared-from-the-knmi-climate-explorer-as-suddenly-as-it-appeared/
The differences are so great between the two dataset that I no longer find the ARGO-era ocean heat content data presented by the NODC to have any credibility. So I stopped providing updates. It’s my silent protest. I also have a post in the works that I’ve been sitting on about that “hump” in the old data…
http://bobtisdale.files.wordpress.com/2012/06/figure-1-global.png
…which was “corrected” out of the OHC data. It’s not a hump. It’s an upward shift that’s easily explained—but more on that in a future post.
And thanks for the kind words. Good to see the work is helpful.
Regards
Bob Tisdale says:
December 6, 2012 at 2:03 pm
Frank K. says: “Bob, I understand what you saying – perhaps it would be interesting to plot anomalies from the individual ensemble members to see what the yearly variations look like.”
I do not intend this in a rude way: But here’s a link to the CMIP5 output page at the KNMI Climate Explorer:
http://climexp.knmi.nl/selectfield_cmip5.cgi?id=someone@somewhere#ocean
Sea surface temperature outputs are identified as TOS. Anyone can perform any analysis they wish to perform.
—
Thanks Bob – no that wasn’t rude. I’m capable of producing the plots, and I should do that and not always rely on the work of others. Thanks for all that you do here at WUWT. Cheers and happy holidays. :^)
Bob
There was a similar flat period in global SST anomalies during the 1870/1880 ‘s era which included low solar activity and was preceded by a major El Nino in 1877/78 followed by a steady decline of SST’s to1910. Do you see any similarities between then and now? . We also had recently a major El Nino in 1997/98, low solar activity and now have a flat period in Pacific SST’s.too. Prelude to a cooler period by 2030 like by 1910?
LazyTeenager says: December 6, 2012 at 1:03 pm
“….oddity I noticed is that skeptic land is able to accept that aerosols, with very very very tiny concentrations in the atmosphere, can affect global climate….”
Clouds, my lad.
As much as you and the IPCC try, you cannot ignore them.
Conrad Goehausen says: “Reprinting this comment from your earlier posting, which you’re probably not responding to anymore…”
Sorry I missed it. If you’ll let me know which thread, I’ll link this reply on that earlier thread too.
Conrad Goehausen says: “So my question is, why has that been increasing over the last 30 years, raising ocean heat content, and not just evening out? Why the step up to new levels, rather than just back up to the same level?”
Conrad, based on the rest of your comment, you understand the relationship between ENSO and tropical Pacific ocean heat content. So I won’t go into that explanation.
The primary problem we have with ocean heat content and sea surface temperature data is there’s too little data. Reliable sea surface temperature measurements for the entire globe exist only for the past 30 years—the satellite era. Before that there’s very little source data in the southern hemisphere, south of 45S, and that’s a lot of real estate. Therefore, we have no idea what type of multidecadal variability exists in the Southern Oceans. No idea at all. Further, because of the limitations of the pre-satellite era data, no one can say that the past 30 years is outside of the normal. Climate models are simply computer-based conjecture, based on a flawed hypothesis.
It’s even worse for ocean heat content data. We’ve only had complete coverage of the global oceans for a decade at best. Before that there’s little to no data at depth in the southern hemisphere south of the tropics. I still find it amazing that we can see the relationship between ENSO and tropical Pacific ocean heat content—thanks to NOAA for have the foresight to install the TOA project buoys there in the 1980s and ‘90s.
To answer your question, it simply appears to be the frequency of the 3-year La Niña events in the tropical Pacific—and the freakish 1995/96 La Niña. Without that 1995/96 La Niña, tropical Pacific ocean heat content data would be no higher today than it was in the early 1990s.
The above should also serve to answer some of your later questions.
Conrad Goehausen says: “Is it a decrease in cloud cover over the tropics? Why so much decrease then? What is driving that?”
Yes, it’s the periodic decrease in cloud cover over the tropical Pacific, which is associated with the stronger trade winds during La Niña events. What’s driving it? No one knows why ENSO has the frequency, magnitude and duration it does. If they did, the IPCC’s climate models would be able to simulate ENSO, but they can’t. If someone knew what drives ENSO, all of the ENSO models used in El Niño and La Niña predictions would be able to provide reasonable forecasts of the next ENSO season before the springtime predictability barrier, but they can’t.
Conrad Goehausen says: “It even makes me wonder how the oceans warm up to begin with. Is it only through direct sunshine? “
There are a number of other factors that can cause sea surface temperature and ocean heat content to warm. For example, when there’s an El Niño, the trade winds slow in the tropical Atlantic. The slower trade winds mean less evaporation, so the sea surface temperatures and ocean heat content for the tropical Atlantic warm. If there’s a multidecadal period when El Niño events dominate, the Atlantic trade winds would be slower than normal for that multidecadal period, which would, in turn, cause sea surface temperature and ocean heat content to warm more than normal.
Then there’s the impact of the surface winds from that travel from north to south and vice versa. If those winds impede the poleward transport of warm water from the tropics toward the poles, then less warm water will arrive at high latitudes where it can evaporate more readily and be radiated into space easier. During periods such as that, ocean heat content would rise, and that’s likely what caused that shift on North Pacific ocean heat content in the late 1980s, early 1990s, shown in red here:
http://oi45.tinypic.com/ftn2j5.jpg
Conrad Goehausen says: “I understand how GHG effects can trap heat in the atmosphere, but can they have that effect on the oceans as well? What do the AGW people claim in that regards?”
The AGW people claim the ocean warming (sea surface temperature and ocean heat content) was caused by back radiation associated with CO2, but the data contradicts them. Therefore, it appears the additional infrared radiation from manmade greenhouse gases only increases evaporation. Add to that, no one knows whether clouds provide positive or negative feedback.
Conrad Goehausen says: “Does the GHG effect have any direct influence on ocean heat or surface temps?”
The ocean heat content and sea surface temperature data indicate they warmed naturally, and the natural warming of the oceans account for the vast majority of the rise in land surface air temperatures.
Conrad Goehausen says: “Also: what is that causes the increased strength of the trade winds that brings about La Ninas?”
That’s a complicated answer—as if there are any simple answers associated with ENSO. There are many interrelated (coupled) factors that drive ENSO. The trade winds are driven by the temperature differences between the eastern and western tropical Pacific. And the trade winds are the primary contributor to the temperature difference between the eastern and western tropical Pacific. The other major factor that influences ENSO mode are phenomena called Kelvin and Rossby waves and their relationship with ENSO is the basis for the delayed oscillator theory. IRI has a reasonably easy to understand discussion of the delayed oscillator theory here:
http://iri.columbia.edu/climate/ENSO/theory/index.html
The introduction to the delayed oscillator theory in my book is written at an even more basic level.
herkimer says: “There was a similar flat period in global SST anomalies during the 1870/1880 ‘s era which included low solar activity and was preceded by a major El Nino in 1877/78 followed by a steady decline of SST’s to1910. Do you see any similarities between then and now? . We also had recently a major El Nino in 1997/98, low solar activity and now have a flat period in Pacific SST’s.too. Prelude to a cooler period by 2030 like by 1910?”
There’s way too little data back in the 1800s to draw any reasonable comparison. With respect to your last question, I don’t make predictions, sorry. I describe after the fact.
James Allison says: “Perhaps the El Ninos spew out Keith Trenberth’s missing heat?”
And that reminded me that few people realize Trenberth’s travesty statement was a discussion of not being able to track the heat/warm water associated with ENSO.
He wrote, “Where did the heat go? We know there is a build up of ocean heat prior to El Nino, and a discharge (and sfc T warming) during late stages of El Nino, but is the observing system sufficient to track it?”
Refer to my blog memo to Trenberth:
http://bobtisdale.wordpress.com/2012/09/20/a-blog-memo-to-kevin-trenberth-ncar/
Thanks again Bob, I will be rereading more of those posts, as I did go through the ones you pointed out to me, (read them too.). I enjoyed them, and learned something. Now to see if it will stick! Enjoy your day
Merry Christmas, and Happy New Year, from Susan in Alberta, Canada.
Bob T. explains basic science to LazyTeenager @ 2:09 pm. Then asks if LT gets it.
To paraphrase an old saying: You can always tell a lazy teen, but you can’t tell’em much.
Bob T. explains basic science to LazyTeenager @ 2:09 pm. Then asks if LT gets it.
To paraphrase an old saying: You can always tell a lazy teen, but you can’t tell’em much.
———————————————————————————–
I should mention my last name is Swedish?
http://www.swedensfinest.com/images/products/detail/1554a.jpg
“Once again, reality trumps models – Pacific SST’s are flat”
Reality is just a corporate shill for Exxon and the other oil companies.
A geography question. Where is the boundary between the Pacific Ocean and the Southern Ocean? When I was a boy we thought that the sea off Victor Harbour was part of the Southern Ocean, but the sea off the East Coast was part of the Pacific Ocean. That would mean a boundary starting somewhere near Tasmania. But where is the other end? The Horn?
I put this in tips and notes, but it is probably relevant here:
I find solar ponds, or salt gradient ponds, quite fascinating. Primarily for their simplicity and their ability to harvest solar energy.
http://en.wikipedia.org/wiki/Solar_pond
But, energy harvest potential aside, what they clearly do show is that much of the radiant energy from the sun which strikes a water body MUST be absorbed within that body, or if the water is shallow, in the base of the pond, where much of it is transferred to the pond.
In the case of a freshwater pond, heating results in convection currents and surface evaporation, and the system is to a certain extent, self-regulating.
In a salt gradient pond, the massive density of the lower layers means the heat is held in those layers, which can reach 90 degrees C. (I have heard reports of boiling…)
Now the oceans cover 70 percent of the earth, and have an massive heat storage capacity in relation to the atmosphere, and have been absorbing energy for eons. The fact they are not boiling means the system has been very self regulating (convection and evaporation).
It seems to me that the oceans do not care whether the energy which strikes them comes directly from the sun, or is re-transmitted infra-red from greenhouse gases, still they self regulate, probably with fairly notable lag periods, and there is no doubt in my mind that by far the greatest effect on this planet’s climate must be the solar energy directly absorbed by the oceans.
I read all sorts of strange things telling me water cannot be heated from above: Well, it can be, and on this planet primarily is heated this way.
Very good information on solar ponds is here:
http://www.enersalt.com.au/Local%20Publish/html/solar_ponds.html
Bob,
Thanks so much for that detailed explanation. Far more than I expected. I find the ENSO phenomena fascinating, especially in the ways it can explain how heat can be trapped in the oceans by the La Nina events. (and apparently by the effects in the Atlantic of the El Nino events).
I agree that it’s hard to explain those La Nina events by GHG warming. I’m trying to see if there’s any way it could work, and back radiation just doesn’t seem to fit the bill, since that would be fairly constant, and not confined to La Nina conditions. I also find it very interesting that it seems that the La Nina conditions, if I am reading you right, seem to be natural positive feedbacks, in that the trade winds drive the very temperature differences that drive the trade winds. I’m still puzzling over what kind of conditions make this result in the kind of excessive La Ninas that result in jumping the ocean heat content up to new levels. I suppose it may be related to the PDO. Or perhaps there is a positive feedback mechanism that just gets these things rolling from one La Nina to the next, resulting in bigger temperature differentials from east to west pacific. Which brings up the question as to what would interrupt that feedback mechanism, and lead to a bigger “obstacle” to its reaching new levels of ocean heat, and even creating a negative cycle, where each La Nina fails to even return ocean heat to its previous level, so we get a step-down ENSO pattern, rather than a step-up one.
Not sure if that makes any sense, or if you have any thoughts on that. I’m just thinking out loud about the kinds of ENSO conditions which could lead to a global cooling cycle, rather than the warming binge it was one in the 80’s and 90’s, and the stasis since then.
I also find it interesting that no one really seems to know what drives this. It seems that the trade winds are the root of it, and the cycle of temperature/pressure differentials from east to west, but what drives that as an historical trend seems to be anyone’s guess.
Since many seem to be predicting a global cooling cycle beginning soon, I am wondering what you might expect to see in the ENSO data to reflect this. My own thoughts are that in some respects, the warming of the arctic may be creating conditions in the Pacific that could actually produce a cooling ENSO pattern – the opposite, of course, of what the AGW crowd thinks will occur. In other words, a global feedback pattern from arctic warming that ends up upending the ENSO so that it produces global cooling pattern, which could be seen as a major negative feedback in the overall climate system. Perhaps this occurs on long cycles, and it would be interesting to see the data. Too bad as you say we don’t have much data going back that far, or linking the equatorial pacific with the connections to the arctic and antarctic.
Thanks again for all your work. Really enjoying your videos and book.
RACookPE1978 says: December 6, 2012 at 12:22 pm
Oh. About your “perceived” cold water the next day.
You did mention that the storm in question dumped water (from the sky, from the upper-levels of the atmosphere in thunderstorms) right?
__________________________________
No, I did not mention rain. We were on the warm-frontal edge of the storm (a low pressure system), where there is very little convection, and no rain on this occasion. The cooling of the sea was not due convection, nor was it due to rain.
And I am not sure why you bring in the subject of submarines. If you have ever dived in the Med, you will know that the first thermocline is only about 5m or 8m down, where the temperature drops by some 5 degrees c or so. And the water at these depths is still quite dynamic, with currents and surface effects disturbing the bottom. You have to hold onto rocks to keep steady, to study any creature or artifact.
It seems more than likely that the rough seas mixed these layers, and cooled the surface (and thereby warmed the lower levels). I was hoping for someone to point me in the direction of a study of this effect, rather than a submariner’s yarn.
.
RoHa says: “Where is the boundary between the Pacific Ocean and the Southern Ocean?”
The CIA website lists the boundary at 60S:
https://www.cia.gov/library/publications/the-world-factbook/geos/oo.html
@RoHa & Bob Tisdale:
I think the definition of “Southern Ocean” was recently changed. Per the wiki:
https://en.wikipedia.org/wiki/Southern_Ocean
Geographers disagree on the Southern Ocean’s northern boundary or even its existence, with many considering the waters part of the Pacific, Atlantic, and Indian Oceans instead. Other regard the Antarctic Convergence, an ocean zone which fluctuates seasonally, as separating the Southern Ocean from other oceans, rather than the 60th parallel. Australian authorities regard the Southern Ocean as lying immediately south of Australia.
The International Hydrographic Organization (IHO) has not yet ratified its 2000 definition of the ocean as being south of 60°S. Its latest published definition of oceans dates from 1953; this does not include the Southern Ocean. However, the more recent definition is used by the IHO and others
Or maybe they are just still bickering….
But at any rate, the idea that there is a clearly defined Southern Ocean is relatively new and not particularly fully, er, “done”…
Even more interesting is to compare the 1st half of century with models. Natural variability does not exist in models at all. 1910-1945 warming of 0,7°C is shown in models just as 0,1 °C – they do not capture the reality, just the radiative fantasy of their authors.
E.M.Smith, in many respects it’s nonsensical to try to put a border on the Southern Ocean, since it’s not isolated from the Atlantic, Indian and Pacific Oceans. It’s their hub. I present it separately for two reasons. First, it is identified as an ocean. Second, it has that 30-year (maybe longer) cooling trend:
http://bobtisdale.files.wordpress.com/2012/11/13-southern.png
Regards
Juraj V. says: “Even more interesting is to compare the 1st half of century with models.”
They’re terrible before 1976. Recall that series of posts I published last year. This two-part post provided a good summary:
http://bobtisdale.wordpress.com/2011/12/09/do-climate-models-confirm-or-contradict-the-hypothesis-of-anthropogenic-global-warming-part-1/
and:
http://bobtisdale.wordpress.com/2011/12/12/part-2-do-observations-and-climate-models-confirm-or-contradict-the-hypothesis-of-anthropogenic-global-warming/
Regards
Bob
“There’s way too little data back in the 1800s to draw any reasonable comparison”.
I realize that you do not make predictions but you have done posts comparing the period of 1880-1910 with more current events [ see DIP AND REBOUND ]
http://i34.tinypic.com/20r2y6o.jpg
I think there are historical patterns to the development global cooling periods that are similar including several low solar cycles in a row [3 or more] , leveling off and then dropping of ocean SST’s, AMO going negative, cooling of winters and the Arctic, more negative AO periods and in parallel dropping of global air temperatures due to declining SST and fewer strong El Ninos. El Nino’s continue but there are fewer strong El Ninos during these cooler periods. Your current post on the flat Pacific ocean SST seems fit into that pattern.
My opinion and half-educated guess at what is happening with models:
Models are an interesting animal. When they are developed, they are tweaked and dialed to match historical data, which is why they match so well from a certain midpoint backwards. They have lots of dials to tweak and turn but the favorite dial, (so well-liked the numbers are wearing off), is the CO2 dial. Could they use another dial, or a combination of other dials, to get the same affect? Sure. They could turn the CO2 dial to zippo and use all the other ones to get the same match on the trained hindcast. But then they have to turn in their keys and can’t play with the super computer anymore. But back to the story. Going forward, they let the tweaked and dialed model run a bit ahead. Alas, the match kinda sucks.
Not to worry! A new and improved model is born, tweaked and dialed to match the present data, and then allowed to run forward till the group gets together and creates another new and improved tweaked and dialed model. On it goes, keeping us initially impressed with how well the models match, hoping we will forget the short period of time they suck.
One of the best ways to see the growth of these types of “new and improved” models, and tweaks done on old ones, is on the weekly ENSO update page powerpoint that uses models to predict ENSO events. You want sauce with that spaghetti? What I find interesting about that set of models is the relatively new addition of the seat of the pants prediction (called a “consensus”). Humans make that one while sitting around a table discussing the topic of prediction. Lately, it has been lower than both the dynamical and statistical model means in terms of the top half of ENSO predictions. Does this mean that this group has reduced confidence in models? That’s my guess.
The models only match the raw data they are trained on, which is why after a certain point is reached going backwards, they suck. Just as they suck going forward predicting what the data will look like but have not been trained on.
Pamela Gray says:
December 7, 2012 at 6:41 am
“Models are an interesting animal.”
Being able to simulate physical systems in software is a wonderful technology*. But it’s also very easy to create models that include the modelers bias on how he thinks what he’s modeling works. And in fact this is a property of all models. Yet for a model to be useful it has to be validated against that physical system.
But if you don’t know how a system works, and you can’t put the physical model on a test bench, it’s not validated.
The problem with this model is that a venisuan planetary scientist decided that CO2 had to be the cause of warming on Earth, and to get the simulator output average temp to go up with co2 (since the simulator totally failed to generate increasing temps on it’s own), there had to be a CS multiplier.
They have knobs to adjust everything, and can only guess what settings to use.
I would at least at one point, consider myself a professional simulation expert, as I supported 8-12 different types of electronic design simulators, including equation solvers that could model an equivalent climate system for over 15 years.
“””””…..MiCro says:
December 6, 2012 at 10:05 am
george e. smith says:
December 6, 2012 at 9:37 am
“would take a WAG that these SST numbers are mostly the result of “stirring” up the oceans, and bringing already existing “heat” to the surface, ”
From the water temperature profiles that i’ve seen (a handful), the surface is the warmest water, and below about 300m it’s almost all near freezing…..”””””
So let’s see now; Silver Ralph opines that the reason SSTs are depressed in the back track of a passing hurricane, is simply that storm mixing turned over surface waters sending the warm surface water down, and bringing some cooler water from some depth, to the surface. That would be consistent with your observations (a handful), that deeper waters are cooler.
That would also result in the surface water, no longer being the warmest water, which conflicts with you handful of observations.
Now Bob’s first SST graph shows a total peak to peak Temperature range of merely 0.6 deg C, over all those years. So evidently, if ocean stirring (storm caused or not) is turning over surface layers, there is no need for it to involve waters as deep as 300 metres, in order to find water 0.6 degrees cooler than the surface. If the Temperature fluctuations followed a typical white noise pattern (random gaussian distribution), then one would expect to often see peak to peak changes of about six times the RMS value.
So assuming that Bob’s graph data, is considerably averaged over space and time, the raw data from many locations might often have a 3.6 deg C range.
Even a 3.6 deg P-P temperature range does not involve water depths anywhere near 300 metres, so such mixing (bringing heat up and down) could easily result in data like Bob’s graph.
That does not alter the simple fact, that Silver Ralph’s comment re hurricane path cooling, is incorrect, and that is a simple consequence of evaporative energy loss from the ocean surface to the upper atmosphere. It is that energy that is powering the hurricane.
Say wot? The Pacific is peaceful? Like, pacific-like even? I’ll be swoggled. It’s non nacheral!