Guest post by Tom Fuller
The physics behind the theory of global warming are solid. CO2 is a greenhouse gas, we’re emitting industrial levels of it, with China now in the lead for emissions. A significant portion remains in the atmosphere for a fairly long time, though the residence time is widely disputed. This residence of CO2 retards the cooling of the Earth and temperatures warm as a result.
One of the few non-controversial datasets in climate change is the Keeling curve, the graph of the concentrations of CO2 in the atmosphere reproduced here:

We see concentrations rising steadily from 315 parts per million in 1960 to 395 ppm last year. It’s close to 400 ppm now.
Human emissions of CO2 caused by burning of fossil fuels and production of cement have risen similarly:
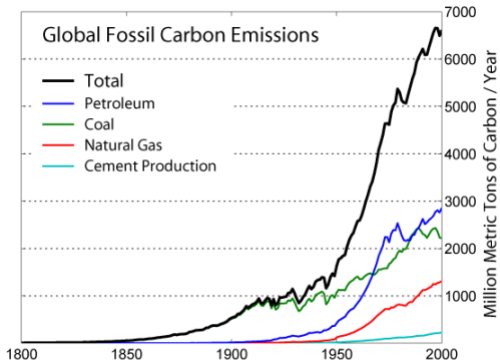
Emissions have climbed at an even higher rate than concentrations.
And the third data source to look at (for simplicity’s sake–we could actually look at dozens of data sources) is temperature changes. This chart shows the global average temperature change from a ‘normal’ 30-year range from 1950-1980. It comes from the Goddard Institute for Space Studies, led by scientist James Hansen.
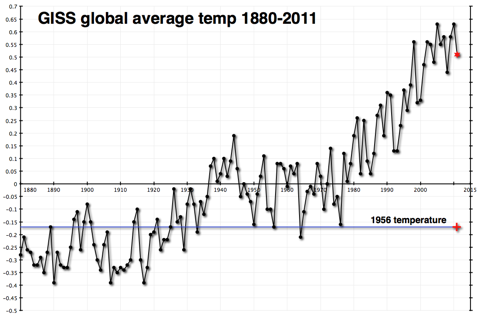
This shows a fairly constant rise in temperatures since 1978.
Once again, you don’t have to be a climate scientist to think that there seems to be a connection. The physical theory published first by Svante Arrhenius over 100 years ago and elaborated on by a century’s worth of scientists has observational evidence that tends to confirm it. I certainly believe in it.
In fact, I believe that global temperatures will probably rise by about 2 degrees Celsius over the course of this century. The difference in estimated temperature rises from different sources almost always comes from the differences in estimated atmospheric sensitivity to concentrations of CO2 in the atmosphere. Having extra CO2 in the atmosphere warms the atmosphere, which is presumed to produce more water vapor, which is also a greenhouse gas and would contribute more warming than the CO2 by itself. How much extra warming would ensue is pretty much the heart and soul of the debate over global warming.
Those who think that there isn’t much of an additional effect (that sensitivity of the atmosphere is low) have been chuckling very publicly because temperatures haven’t risen very much (if at all) since the big El Nino year of 1998. This is not hugely surprising, as the shape of the data is uneven, a sawtooth with ups and downs that can last a decade or longer. But it is happening at an inconvenient time politically for those who are worried that sensitivity is high. They are trying to get the world to prepare for warming of 4.5C or higher, without much success.
Here’s what temperatures look like more recently.

By itself, this chart doesn’t explain very much. As I said, it is not uncommon or unexpected for the temperature record to have flat or declining periods that last a decade or more.
However, I have a problem. The Carbon Dioxide Information Analysis Center (CDIAC) has estimates of how much CO2 humans have emitted since 1750. (Confusingly, they convert the CO2 to tons of carbon with a fixed formula.) That chart is the first one way up there at the top of the post. It rises dramatically
But looking at the data global.1751_2009 (3), one thing jumps out at me. CDIAC writes “Since 1751 approximately 356 billion metric tonnes of carbon have been released to the atmosphere from the consumption of fossil fuels and cement production.” And they helpfully provide an Excel spreadsheet showing their estimates by year.
And almost one-third of that number, 110 billion metric tonnes, have occurred since that time in 1998 when temperatures reached their temporary plateau.
| 1998 | 6644 |
| 1999 | 6611 |
| 2000 | 6766 |
| 2001 | 6929 |
| 2002 | 6998 |
| 2003 | 7421 |
| 2004 | 7812 |
| 2005 | 8106 |
| 2006 | 8372 |
| 2007 | 8572 |
| 2008 | 8769 |
| 2009 | 8738 |
Above: Table1, CO2 emissions by years, million metric tonnes – data CDIAC
Because heat moves somewhat sluggishly through the earth’s oceans, and because there is a lag factor in other earth systems, we do not expect a hair-trigger reaction to increases in CO2 emissions and concentrations.
But one-third of all human emissions of CO2 have occurred since 1998. And temperatures haven’t budged as a result.
This does not ‘disprove’ global warming–at all. I still believe that temperatures will climb this century, mostly as a result of the brute force effect of the 3,000 quads of energy we will burn every year starting in 2075–the reason I started this weblog.
However it makes it exceedingly difficult to use the past 15 years as evidence of a very high sensitivity of the atmosphere to CO2 concentrations. And it makes me feel more comfortable about my ‘lukewarm’ estimate of 2C temperature rises as opposed to the more alarming 4.5C rises put forward by some of those who are most active in the movement to reduce emissions drastically.
And it makes me wonder about why people don’t include relevant data when they discuss these issues. Is it really that politically incorrect to show real data, even if that data doesn’t advance your case?
Tom Fuller blogs at: 3000Quads and is co-author with Steve Mosher of the CRUTape Letters.
A plot of HadCruT4 temperature anomalies vs atmospheric CO2 concentration is shown here
http://i1244.photobucket.com/albums/gg580/stanrobertson/Temp-CO2-1850-2012-v2.jpg
The CO2 data prior to 1960 was entered as annual amounts with a weight of 12x rather than the monthly amounts reported later at Mauna Loa. The least squares best fit line says that we are getting 1.9C per CO2 doubling. At the current rate of increase of CO2 of 0.5% / yr, that will take 140 years. Since temperature increase is proportional to the log of CO2 concentration, it will increase linearly with time and yield only 1.36 C over the next century. This shows what the earth is doing now in a completely model independent way.
But if the temperature arrest continues for another decade or two, the line would become less plausible and it would strongly suggest that something other than CO2 is driving the earth’s climate.
Note that the CO2 axis on my plot is logarithmic!
Thanks for the statement of your belief in AGW, in spite of the strong evidence you cite to the contrary. Very faithful of you.
Existence of greater moisture in the atmosphere as a result of warming has, apparently not occurred, according to recent surveys. And this implicit claim that adding carbon (regardless of concentration levels) must always either result in positive feedback, or little feedback is also not proven,although this article assumes otherwise. Looking at a simplified system, where only CO2
increases is useless when dealing with a very non-simple system like the climate. Nor is the claim that emissions will continue and increase as far into the future as is claimed I consider preposterous, regardless of whether people stay concerned or not- technology practically at our fingertips (electric cars, Generation 4 fast reactors, China’s aggressive hydro and nuclear programs, etc.) make certain that natural progression of technologies will radically reduce carbon emissions, which, in my view, makes current concerns about the distant future a non-issue.
I think perhaps that may be the most unrealistic portion of concerns about future carbon levels – they assume highly unlikely future energy world and a virtually static technology. Electric cars, for example have (assuming cheap and practical batteries) a distinct economic advantage over gas powered vehicles, which they will replace, irregardless of public concerns about carbon emissions.
Much the same can be said about nuclear power. And that, gentlemen, is be the ball game.
Forget about CO2 – – it’s largely irrelevant.
Recall the parallel sawtooth-shaped patterns of T and CO2 vs time from various polar ice-core datasets.
First, temperature always changes direction before CO2 follows (hence, cause/effect)
Second, T always begins to decline when CO2 is at its greatest concentration; and T always begins to rise when CO2 is at its lowest concentration.
So CO2 is always a trailing indicator unless we’re talking plant physiology and growth rates. That’s where CO2 rules.
CO2 is only an issue because lefties see it as a path to tax every human activity in the world.
@arthur4563: you wrote: “Electric cars, for example have (assuming cheap and practical batteries) a distinct economic advantage over gas powered vehicles, which they will replace,… ”
I don’t see how electric cars have a distinct economic advantage. Could you tell me what they are?
lower cost? less weight? longer range? faster refuel rate? I think the answer is no to these questions, but perhaps I don’t know what to ask.
You use GISS data? GISS?? Really? And with a straight face?….
Golly…
“The physics behind the theory of global warming are solid.”
” CO2 is a greenhouse gas,…”
With two such spectacularly wrong statements to start with, the rest of the analysis is built on very soft sand.
The author also asks the following question;
“Is it really that politically incorrect to show real data, even if that data doesn’t advance your case?”
Anyone who does not think that the answer is “YES” has not being paying attention.
Looks to me like the next third runs from about 1972 t0 1997, so 2/3 since just 1972. We should have fried by now if the active hypothesis were true.
If you hold up three fingers and say that represents the nominal 280 PPM pre-industrial CO2. Then hold up four fingers and say that represents the current level, near 396 PPM. As each finger represents enough CO2 to completely block the 15 micron, 666 cycles per cm CO2 absorption band, turn your hand sideways, as in a salute, to see the real difference between three and four fingers of CO2.
The net effect of the CO2 absorption band is like a one foot diameter tree in in the middle of a ten-foot wide stream. Adding more CO2 just lowers the altitude of total absorption.
Below is a Wikipedia graphic that shows the miniscule difference between 300 PPM (green) and 600 PPM (blue) as calculated by MODTRAN, a program developed by the Air Force to calibrate their equipment.
MODTRAN Radiative Forcing; Double CO2
MODTRAN3 v1.3 upward irradiance at 20 km [up], U.S. Standard Atmosphere
http://en.wikipedia.org/wiki/File:ModtranRadiativeForcingDoubleCO2.png
Tom, kudos for your presentation: courageous in a sceptic blog. And Anthony, balance is good, nay, necessary. Tom, I do have a bit of trouble with your use of the term ‘belief’. This has always been a notable feature of the [luke]warm to warm side of the climate change argument. (I use ‘climate change argument’ to stress that it’s the CAUSE of the climate change that is in question, not whether climate change ‘exists’ and is ‘real’)
What is your belief founded on? You “believe” that temperatures will rise 2 degrees by century’s end. Please elaborate, even if a generalization is all you have time for. Your ‘brute force’ remark is much like the general view that “we MUST be having an effect” (a view rarely if ever backed by why someone would assert it). Your ‘estimate’ of 2 degrees must have a foundation?
I will agree, however, that yes, cherry-picking is all too prevalent, as is the convenient erasure of historical accounts by laypeople (the weren’t ‘scientists’…appeal to authority). To many inconvenient truths tend to skewer the case. However, your presentation seems to leave the question just as open at the end as it was at the beginning; far from the consensus certainty that is the hallmark of the greenhouse-driven climate change paradigm.
MODTRAN Radiative Forcing; Double CO2
MODTRAN3 v1.3 upward irradiance at 20 km [up], U.S. Standard Atmosphere
http://en.wikipedia.org/wiki/File:ModtranRadiativeForcingDoubleCO2.png
Yes, notice the difference in Watts.
Now quickly what was the difference in watts from the sun between the LIA and today?
Another hint. How many excess Watts does it take to melt greenland?
How many excess watts to melt all the artic ice?
The second Figure (emissions trend) is too old; the right-hand end being 2000, where the emissions from developed nations tended to plateau but those from developing nations (esp. China) began to skyrocket.
IIRC, from 1990 (start year of Kyoto) to 2012 the global CO2 puff has increased by ca. 60% while the Mauna Loa CO2 concentration has increased by merely 10% or so.
This fact alone may be enough to cast a big doubt on AGW, let alone on CAGW.
As an engineer, I would think one would pause to rethink a hypothisis when the response is flat for fifteen years while the level of the stimulus is dramatically increased. An open minded engineer or scientist not married to his/her theories would look elsewhere for a valid relationship.
Maybe there is something wrong with the “physics” after all.
How many thermometers were there in the Southern Hemisphere in 1880 to calculate the global average temperature of the Earth for that year?
3.39 W/M^2 is the total difference and water can change it rapidly blocking 600-1000 W/M^2..
I would dare say the the minor flux in solar output is not the issue. Now the magnetic waves are a much different issue and they influence water vapor with great ease as they bend and fold the atmosphere..
Dear steven mosher, your argument is assuming that there is no other way heat can escape than through radiation in the blocked band. There is, both in other radiative bands and through latent heat, convection etc.
Also, you ask us what the difference in watts between lia and today is. We have no clue and neither do you. We didn’t meassure radiation at the toa at the time.
Best,
Rikard
“This does not ‘disprove’ global warming–at all. I still believe that temperatures will climb this century, mostly as a result of the brute force effect of the 3,000 quads of energy we will burn every year starting in 2075–the reason I started this weblog.”
Now I didn’t run any numbers but consider this. If humanity releases “3,000 quads of energy every year” than that is a constant. Heat is transported away from the surface via convection, conduction and radiation and radiated away to space in the stratosphere mostly. A heat engine.
If we offset the system by adding a constant amount of energy per time it will only shift the temperature at the surface by a constant amount, making the heat engine slightly more efficient. A new equilibrium is reached.
Will humanity multiply exponentially, thus increasing the amount of energy added per year exponentially? Unlikely. As people get more wealthy birth rates drop.
( http://www.gapminder.org )
Will humanity , while growing in number sub exponentially (therefore negligibly), grow energy use per person exponentially? Again, unlikely. Electricity use per person in Germany, for instance, has been stagnant since the 1970ies. We are deriving more value from each unit, though – more efficient fridges, computers, TVs etc. (if one can call TV a value)
Steven Mosher says:
December 6, 2012 at 9:00 pm
“MODTRAN Radiative Forcing; Double CO2
MODTRAN3 v1.3 upward irradiance at 20 km [up], U.S. Standard Atmosphere”
Steven, is there any observational evidence that the real atmosphere behaves similar?
I’m asking because it should be measurable.
Simple answer Tom, YES.
Deception in the name of THE CAUSE, is desirable and necessary.
At least thats my default since reading the CRU emails and Climate Audit.
The recent blame every storm on CC has done nothing to enhance the credibility of believers.
I value honest opinions but will check the data myself to the best of my ability.
Oh Tom I haven’t checked your blog in a while, what was your take on the orchestrated propaganda carried out by the BBC? 28 -30 not so unbiased experts.
Tom Fuller;
This residence of CO2 retards the cooling of the Earth and temperatures warm as a result.
>>>>>>>>>>>>>>>>>
This is wrong. The temperature of the Earth SURFACE is in theory warmed. By saying simply “the Earth” you are including the atmosphere. The average temperature at equilibrium of the system as a whole (surface+atmosphere) doesn’t change at all due to a doubling of CO2.
Mario Lento says:
December 6, 2012 at 8:27 pm
“@arthur4563: you wrote: “Electric cars, for example have (assuming cheap and practical batteries) a distinct economic advantage over gas powered vehicles, which they will replace,… ”
I don’t see how electric cars have a distinct economic advantage. Could you tell me what they are?
lower cost? less weight? longer range? faster refuel rate? I think the answer is no to these questions, but perhaps I don’t know what to ask.”
A typical smallish electric car costs 25 k EUR – 15k for the car and 10 k for the battery. The battery delivers a range upwards of 100 km and is typically designed to last for 100,000 km or about 1,000 charge cycles.
So you pay 10,000 EUR for 100,000 km or 10 Eurocent per km (13 US cent per km) for the battery alone BEFORE you pay for the electricity. (Which is at German prices and let’s say 7 kWh per 100km about 1.75 EUR – BUT you already paid 10 EUR for the battery depreciation over the same distance…)
IFF batteries were 10 times less expensive one could talk – because in that case the value of a battery would be negligible. But it’s not the case. And no “Moore’s Law” for batteries.
Steven Mosher;
How many excess watts to melt all the artic ice?
>>>>>>>>>>>>>>>
May I refer you to arctic circle temps?
http://ocean.dmi.dk/arctic/meant80n.uk.php
If you’ll note, there are on average less than 100 days per year in which temps are high enough to melt ice. There are approximately 200 days per year when temps are -30C or colder. So the answer is a LOT more than a few. In fact, you can go back to the early 60’s, and you’ll find that temps were a lot lower over the course of the year, but the number of melting days was NOT less. SB Law requires that there be more warming in the winter than in the summer, and once you factor that in, the number gets even bigger. Sorry, no boost from water vapour at that latitude either, cold = dry.
A better question might be how many watts will it take to reverse the increase of ice in the Antarctic?
“And it makes me wonder about why people don’t include relevant data when they discuss these issues. Is it really that politically incorrect to show real data, even if that data doesn’t advance your case?” Absolutely. Those most strident on both sides of the question are not interested in real empirical data. They are only interested in model results, not data at all, which advance their cause not matter what that cause may be. This people have turned the question into a religious quest for power the furtherance of the theology.
RE: Steven Mosher says: (December 6, 2012 at 9:00 pm)
“MODTRAN Radiative Forcing; Double CO2
MODTRAN3 v1.3 upward irradiance at 20 km [up], U.S. Standard Atmosphere
. . .
“Yes, notice the difference in Watts.”
Based on the MODTRAN radiation code, web tool hosted by the University of Chicago, it appears that the radiant energy outflow reduction caused by each *complete doubling* of the CO2 concentration in the atmosphere can be compensated by a surface temperature increase on the order of one degree C. This relationship seems to hold from 20 PPM to well over 1000 PPM CO2. This program calculates the raw effect of adding CO2 to the atmosphere without regard to any complex and controversial climatic feedback effects.
The dangerously high positive feedback levels originally estimated by the IPCC seem far-fetched and unsupported by current data.
David Archibald, in his article, The Fate of All Carbon says, according to current estimates, there may not be enough economically recoverable, combustible carbon left in the ground to ever reach one full doubling of the CO2 content in the atmosphere. (560 PPM)
http://wattsupwiththat.com/2011/11/13/the-fate-of-all-carbon/
“This chart shows the global average temperature change from a ‘normal’ 30-year range from 1950-1980. It comes from the Goddard Institute for Space Studies, led by scientist James Hansen.”
It does NOT show anything of the sort.
What it does show is the “Hansen adjusted, urban consolidated and homogenised” temperature.
This is in NO WAY related to REAL global average temperatures, no matter what your definition of that ludicrous term is.
but the number of melting days was less.
“””””””””””””””””””
NOT. NOT less. I hate it when my fingers go on pause while my brain doesn’t.
[Reply: Fixed it for ya’… -ModE ]>/b>
Arthur, I strongly agree with your point that it is foolish to assume technology is stagnent and our energy sources will be the same in 2075 as today. Who would have thought several years ago that the US could become the worlds largest oil producer. http://www.latimes.com/business/la-fi-us-saudi-oil-20121113,0,5693478.story. A lot can happen in 62 years unless the Government continues to destroy initiative and technology development by deciding what is best. I am convinced that the energy source of the future is nothing that is being pushed today.
On the other hand the future of the electric car is looking more grim every day as the US and others squander tax dollars on battery development based on technology hand picked by Washington et al. The free market has spoken although governments are trying to force a vehicle on us that has limited use. Despite all the subsidies and grants we still do not have a suitable battery for anything except a special purpose vehicle. Indeed such a battery my never exist which will provide useable range to the electric car. It is stupid to spend money on demonstrating the car when an energy source is non existant. Intelligent resourcing would focus on the missing link. It has been perfectly clear for years that an electric car is viable if there is a suitable battery!
If you check out this article below, it is clear that because of government picking winners (actually mostly loosers) we are inhibiting the development of potential technologies that might actually provide future viable alternative energy sources.
http://www.altenergystocks.com/archives/2011/11/electric_vehicles_ineptitude_apathy_and_piles_of_taxpayer_money_1.html
@garymount:
Well, by inspection of the first chart in this posting:
http://chiefio.wordpress.com/2009/08/17/thermometer-years-by-latitude-warm-globe/
and adding up the thermometers in the traunches below the equator (and including the equator for good measure), I get the vast sum of….. 29 + 15 equator = 44
One could presume that half the equatorial thermometer were above the equator proper and end up at about 37 as more likely.
In 1839 the total was zero BTW, so those were pretty new thermometers. Don’t think they were in Stevenson Screens, nor meeting NOAA guidelines, though 😉
Eyeballing the chart N.H. looks like S.H. is about 1/10 the coverage. Oh, and that’s land thermometers… not like there’s much land in the Southern Hemisphere though… and what there is tends to be bunched up near the equator or smack dab on top of the South Pole…
@Steven Mosher says:
[…]
And how much more water is evaporated and falls as added rain (transporting that heat to the top of the air column to be radiated away) from 3.x W / meter^2?
(Yes, I know, it’s an almost unmeasurably small quantity, but do try…)
http://chiefio.wordpress.com/2011/04/03/perspective-on-rain-and-heat/
“Fully one half of all the heat delivered to this part of the planet is taken away by rain alone.”
For Puerto Rico. As that is ignoring clouds (and there are plenty of clouds blocking incoming sunshine) and as it is ignoring convection (that carries the other half, pretty much… and does it in HOURS, not days) there isn’t a whole lot left for IR to do …
http://chiefio.wordpress.com/2010/12/02/does-convection-dominate/
which references this paper showing transport “same day” via convection:
http://hal.archives-ouvertes.fr/docs/00/31/68/93/PDF/angeo-19-1001-2001.pdf
So I figure 3 W will ALMOST make the air rise enough faster to maybe measure it, if you work hard and have some really expensive equipment…
From Steven Mosher on December 6, 2012 at 9:00 pm:
Now quickly what was the difference in watts from the sun between the LIA and today?
Watts is Joules per second. So you’re asking what was the difference in the total amount of energy in Joules released from the Sun per second between the LIA and today. Which means jack. What should be asked is the difference in insolation, expressed as Watts per square meter. Which may require calculating the position of the Earth relative to the Sun both today and during the LIA, as well as knowing the solar output then and now. And also it matters how much insolation actually reached the surface, you’d have to know how global cloud cover then compared to cloud cover now. Best of luck finding those measurements.
Another hint. How many excess Watts does it take to melt greenland?
How many excess watts to melt all the artic ice?
Again, Watts is a rate. You could calculate how many Joules it’d take to melt the ice. But you’re asking about excess Joules per second. Well, once you’ve figured out how many J/s are shed by natural processes like convection and evaporative cooling of precipitation, then you might be able to figure the “excess” rate of energy building up in the ice that’ll lead to melting.
And at that point, anything excess is in theory enough to melt the ice. If all of the Greenland ice acquires just one extra Joule per second, theory says someday it’ll all melt. Sure it’ll take a long time, but as long as the rate is maintained then it will all go away.
So your questions are nonsense.
I think what you are saying Tom and Mosher is that even if there is compensation in the atmosphere for CO2 flux gain there is still a flux gain and the volume of carbon fuel consumed is adding not insignificant amount. So even if we are not sure about the exact effect we should be sure to consider possible effect. When considering your next century estimate did Issac Held influence you.I think he has influenced me but but I know little of the maths and can conceptually follow only.
“The physics behind the theory of global warming [is] solid.”
—————————————————
Which theory? There seem to be a number of them. When it gets hot, the warmunists trot out a theory that explains everything to the point of the science being settled – until it gets cold; then they pull another one outa their arses. Next there will be a global warming theory to explain why there has been none for well over a decade. Blah blah blah…
“This residence of CO2 retards the cooling of the Earth and temperatures warm as a result.”
—————————————————
“CO2 retards” – a good epithet for the AGW faithful.
[Reply: Not to pick on you, but in general… Can we tone down the “insults to the person” angle? It gets tiresome and isn’t productive… and I’ve noticed the thread trending that way. -ModE]
BTW, for anyone wanting to see a less biased view of the temperature data in GHCN (Global Historical Climate Network – i.e. land thermometers from NOAA data copies for the globe) this graphs is IMHO about as good as you can get:
It has both Version 1 and Version 3 data sets on it, so you can see how “adjusting” changes and how ‘thermometer inclusion – or not’ changes change the data over time. (Surprise! the warming ‘trend’ goes up…)
Basically it shows we climb out of the LIA in the late 1700s / early 1800s, then ‘dip’ again in the “Year without a summer” on some volcanic activity. That causes a dip. Things are low and more or less stable until about 1920 then we warm up to the warm 1930s; cool in the 1970s, and now have warmed up to about the same as the 1930s and 1822 or 1780.
This is based on a variation on the “First Differences” method. It does no adjusting and spans data dropouts (effectively interpolating trend over the dropout on a per thermometer basis, since you do have values at each side of the gap). Basically, no ‘data diddling’. Oh, and it calculates the anomaly FIRST, not after fudging around the temperatures as GIStemp does. (GIStemp keeps temperatures AS temperatures until the end where it makes a fictional ‘grid box’ anomaly by comparing ‘grid boxes’ that mostly don’t have any thermometers in them at all…. just hypothetical calculated values…) Details of how it works for anyone who wants to know are on my blog in the dT/dt category. A reasonable description is in this link:
http://chiefio.wordpress.com/2010/02/28/last-delta-t-an-experimental-approach/
that is ‘mid-development’ so includes tables of data and not graphs, but does describe what it does and why.
This is from a later step comparing it to classical FD and looking more at effects and less at ‘method’:
http://chiefio.wordpress.com/2012/06/26/wip-on-first-differences/
In short, this is about as “real” and “just the data” as you can get. (Though even this is a bit biased warm via ‘adjustments’ made at NOAA / NCDC as evidenced by how V1 is made warmer in V3 for “the same” data…)
“A problem: nearly one third of CO2 emissions occured since 1998, and it hasn’t warmed”
No spell checker? It’s “occurred”.
Note that between 1940 and 1980, CO2 concentration rose by 10% but global average temperature declined significantly.
With respect to the referenced graph showing a forcing of about 3.39 W m-2 for a doubling of CO2, shown here, I would like to mention the following:
From here:
Stoffel, et al. 2006 From the abstract:
From Figure 4:
From Figure 7 in 2006:
From Figure 9 in 2006:
From the Conclusions
Reda, et al. 2006
Reda, et al. 2008
Reda, et al. 2010
Original calibration procedures: Albrecht & Cox 1976
Thus, it seems that the forcing of 3.39 Wm-2 would appear to be about the same size as the measurement error for using the new and improved calibration method and about an order of magnitude smaller than historical measurement error (prior to 2006, or so). At first blush, one would be tempted to say that the forcing of 3.39 Wm-2 would statistically probably be indistinguishable from zero, but that depends on whether the Modtran calculations are based on actual measurements and on whether the two numbers are directly comparable. Clearly, if the instruments alone have an error of about 3 Wm-2, then the total measurement error would be larger, but how much larger I haven’t tried to estimate.
If you take the Mauna Loa C02 record since inception and the GISS temp record for the same period, you can work out the rate of change of C02 per year (dC/dt) and do the same for the rate of change of temp (dT/dt). If you then divide one by the other you will get the rate of change of C02 with temp (dC/dT), or vice versa. If you plot this out on a graph you get a blitz of data points and an R^2 of around 0.005 for linear, power or logarithmic data fits. If there were any relationship between the two I would have thought that the data would have trended so you could put a meaningful line through it, albeit with a degree of scatter about that line, but a line you would get a high R^2 value for. To account for thermal lag you can repeat but offset the d(temp) from the d(C02) by one year, two years etc, but you still get fundamentally the same picture. What that says to me is that the influence on temperature from C02 is small compared to something else.
Good to see a thoughtful look at all this, not the usual polarised yahboo arguments.
It is interesting to look at the same data as a log plot. Available as text here http://cdiac.ornl.gov/trends/emis/tre_glob_2009.html
A straight line in a log plot is an exponential growth , the steepest line shows the greatest _rate of growth_ (not to be confused with greatest quantity of emissions).
http://i50.tinypic.com/2n83l1d.png
The greatest rate of growth was not the 20th but 19th century (emissions were lower but growing fastest). The 20th can be characterised by three periods of roughly equal annual growth:
1910-1944
1944-1974
1974-2000
The rate of growth of the middle period was about three times greater than the other two. Yet ironically that was precisely the period when we see actual global cooling.
In fact if we had to simplify the temperature record in to two warming periods and an intermediate cooling the dates would be almost exactly those above.
Now to look at actual CO2 forcing we need to look at how much of those emissions stay in the atmosphere, a large proportion gets absorbed by plant life and oceans. But to look at this data and to look for a simplistic correlation without taking natural climate cycles into account (which is precisely what a lot of alarmists do) we would probably conclude that we should be INCREASING CO2 emissions to slow down global warming !!
I’m not suggesting that is the correct result but it shows pretty clearly that until we understand and account for natural cycles we will get totally spurious results that are not use for evaluating the effects of human emissions and NO WAY useful in determining policy.
How come C02 is always talked about in total? Should not C02 be separated into anthropogenic and natural.
“The physics behind the theory of global warming are solid.”
Wrong, the physics behind the hoax of global warming are rubbish. The pseudo scientists involved have calculated linear equations for radiative balance based on surface area. What is needed is three dimensional iterative calculations. A three dimensional atmosphere in a gravity field with a pressure gradient needs to be modelled to get the correct answer. Modelling conduction, convection and vertical movement of gasses within the atmosphere is vital to getting the correct answer.
The correct answer is that radiative gasses cool our atmosphere. Radiative gasses can intercept IR and either re emit it or conductively transfer the energy to molecules around them. Additionally radiative gasses can emit IR to space from energy they have acquired conductively from the surface or contact with non-radiative gasses in the atmosphere. Our atmosphere is primarily heated by conductive contact with the surface. It is primarily cooled by IR radiation to space at altitude.
The AGW pseudo scientists left out the most basic concept from their BS(blackboard scribbling), HOT AIR RISES. Without radiative gasses this air cannot cool and descend and convective circulation in the vertical dimension would stall. It is important to note that adiabatic cooling on ascent is irrelevant to convective circulation as it is matched by adiabatic heating on decent. The energy imbalance that drives convective circulation on this planet is caused by radiative cooling at altitude. Without radiative gases driving convective circulation, our atmosphere would heat to match the hottest point of conductive contact with the earth’s surface.
The importance of convective circulation to atmospheric temperature can be demonstrated with a very simple empirical experiment using two equal heating and cooling sources in two insulated test chambers filled with air. In one chamber place both the heating and cooling source at the base to model an atmosphere with no radiative gasses. In the other chamber place the heating source at the base and the cooling source at the top. Which chamber reaches the highest average air temperature?
The pseudo scientists you have put your blind faith in failed to model even the most basic features of our atmosphere, volume, conduction and convection are all missing from their rubbish equations. Radiative gasses cool our atmosphere. It is physically impossible for additional radiative gasses causing global warming is on this planet.
Why is it that supposedly smart people subscribe magical properties to an inert gas in an inert atmosphere? 390 PPM of CO2 equals 1 molecule to 2564 molecules of everything else. Meanwhile water is 1 molecule to 25 molecules of everything else.
No wonder the bible says, Rom 1:22 Claiming to be wise, they became fools,
(facepalm)
A question to anyone, how long does carbon dioxide stay in the atmosphere? Too many conflicting theories, as I have discovered. From 5 years to 200 years, which one is correct? Please be easy on me, I do not have a degree of any sort. I just want to learn new things, because of the conflicting theories of global warming, and now it’s called climate change? (Makes me think that the earth is going through menopause with all these new catchy titles they give the natural processes of this planet.)
“This does not ‘disprove’ global warming–at all.”
It seems no other warmist will answer this question which has been stated here often: “What WILL disprove global warming”?
For example, another n years of no warming with n = fill in the blank.
In big pharma, regulatory agencies make us state our criteria up front before testing, Then the results of tests are compared to those prospective statements. Doesn’t ever seem to be the case with the AGW crowd. Nothing but ad hoc explanations and infinite “wiggle room”.
Curiously I just made a plot of my average yearly salary as a function of time going back to 1975. I was amazed to find it has the same shape as the temperature data from GISS. And just like global mean temp, my salary has stagnated in recent years. I hope for higher temps in the future because that is obviously the primary driver of my salary since they are so well correlated, even better than the CO2 correlation with temp.
Unfortunately, the Aarhenius concept of the ‘GHG blanket’ breaches all the rules of standard radiative heat transfer physics.
Meteorology and by inheritance climate science teach that a pyrometer, e.g. a pyrgeometer, measures a real energy flux when in reality it is the assembly of Poynting Vectors in the viewing angle of the instrument.You can easily prove it – have two instruments back to back in zero temperature gradient and net signal is zero. Take one away and it jumps up to the temperature signal.
This is a basic physics’ failure of awesome importance because the same mistake is made in the 1906 Schwarzchild ‘two-stream’ approximation in the climate models. This makes them into a perpetual motion machine with imaginary warming and positive feedback.
In reality there can be no CO2-AGW because there’s no net IR to make it happen. The recent warming is from another mechanism involving aerosols decreasing low level cloud albedo, and it’s self limiting – this comes from correcting Sagan’s aerosol optical physics..
Basically, climate science has got most of the basic physics wrong and its refusal to admit this is a causing serious harm to science which has become political propaganda.
CDIAC reports ton of carbon emitted. And yes, there is a fixed formula tying carbon (atomic weight 12.011) to CO2 (molecular weight 44.01). Eventually all carbon based fossil fuel burned becomes CO2.
The data of CDIAC goes back to 1751, these are approximations, but probably not bad ones (who would have better ones?).
Interesting is:
– it took up to the year 1929 to emit 10% of all what has been emitted up to 2010.
But temperature increases, sea rises and glacier melting were taking place well before that date.
– since 1990 28% of all emitted carbon has been released (slightly less than one third as written in the article), without statistically significant temperature increase.
These are 40% since 1990, and 55% since 1980.
– CO2 atmospheric concentration rises by approx 2 ppm every year.
– Mass balance: out of the 365 billion tons emitted (total up to 2010) only 68% are found in the atmosphere (CO2 concentration rising from assumed pre-industrial 280 ppm to 388 ppm in 2010). The rest has been somehow absorbed by the seas, the ground and the biomass.
These facts should not be controversial.
If the current trend goes on (using a CAGR of 2.5% per annum, based over the past 10 years) the total emitted carbon would be approximately 3400 billion tons in 2100, 10 fold of what has been burned so far since the beginning of the industrial era.
I don’t know if there are enough fossil fuel reserves on earth to be burned!
The lack of clear correlation “Temperature vs. Carbon emitted” may have three causes:
a) lag time: this is improbable since the absorption of electromagnetic waves is almost instantaneous, and the mixing of CO2 into the atmosphere is made within a few months.
b) the system response “Forcing+Feedback to Forcing” to CO2 is not as high as certain models predict, in particular those used by IPCC. This is quite probable.
c) natural changes counteract the action of CO2, resulting in other temperature evolution than predicted by a monocausal model. This is also taking place.
The big questions are: what are the modulation factors? what dimensions have they? Who knows?
We have only one experiment going on and every opinion is based on extrapolation models, more or less wrong and sophisticated.
How much more? Can we say with 95% certainty that if this goes on for 15 years or more the climate models have got it wrong. Now take a look at the following:
http://landshape.org/enm/santer-climate-models-are-exaggerating-warming-we-dont-know-why/
The physics behind the theory of global warming are solid.
I quote and I question. Perhaps you could give me a link or two to what the theory of global warming actually is?
My current understanding of the Greenhouse Effect (which I understand underlies the theory of global warming) is that wavelength lengthened radiation from a notionally black body Earth is intercepted in part by GHGs and part of this is re-radiated in a downwards direction adding to solar input to the Earth’s surface.
My problem with this is that most energy from the Earth’s surface is picked up by the atmosphere by conduction, convection and latent heat of evaporation. It doesn’t just stay there of course this energy is re-radiated also and on every emission half goes in a downwards direction as the emissions are isotropic.
The difficulty I have is that the second mechanism is far more effective at producing “back radiation” (as I believe is the terminology). I do not mean this in the sense that the majority of energy leaves the Earth’s surface by the “thermal” mechanisms (although it does) I mean it in the sense that the second mechanism IS FAR MORE EFFICIENT at producing “back radiation” than is the former. This is simply because only certain, albeit broad, absorption lines in GHGs intercept outgoing radiation and most is left unhindered to leave the planet. On the other hand energy leaving the Earth’s surface by thermal mechanisms is in effect fully intercepted by atmospheric gasses.
If we try a little thought experiment and turn off the greenhouse effect by preventing outgoing radiation from the Earth’s surface so that only the thermal mechanisms are allowed what will happen? Obviously the amount of “back radiation” will increase! So if we turn off the greenhouse effect the surface warms.
If we add more CO2 to the Earth’s atmosphere we will have a slight increase in greenhouse “back radiation” (slight being due to the logarithmic saturation effect plus the inefficiency of the mechanism) but we will have a much greater increase in “back radiation” through the thermal mechanisms.
It seems to me that the global warming movement are missing a trick here and if they accepted a little basic physics they would be able to demonstrate that “back radiation” from GHGs is actually far higher than they originally believed it to be.
So please help me. What is the physics of global warming?
Stay cool!
Look in figure 4 of the following link and get the results for ftot=1
http://www.tech-know-group.com/papers/IR-absorption_updated.pdf
You see the value “mechanisms other than radiation”
That is the answer to your question
@Susan S.:
The short answer is “No.”
Nobody really knows. It’s all just guessing. What we do know is that the human contribution is nearly nothing compared to nature.
And that a forest or farmland or pond scum will suck out all the CO2 over and above it in just a few years (or even less…) if given the chance.
http://chiefio.wordpress.com/2010/10/10/got-wood/
And even that most of the CO2 is in the ocean and rocks, not in the air at all. Heck, we’ve got liquid blobs of the stuff coming up from the ocean bottom:
http://chiefio.wordpress.com/2011/12/10/liquid-co2-on-the-ocean-bottom/
There’s a load of it in soil, pulled out of surface waters (and still forming too):
http://chiefio.wordpress.com/2012/04/27/caliche-co2-feldspar-and-climate-dust/
(and breaking down). so no, we don’t really know ‘where CO2 goes’…
http://chiefio.wordpress.com/2010/10/17/where-co2-goes/
And, in fact, only recently figured out that many fish make “gut rocks” out of it and ‘poop’ it out onto the ocean floor.
http://chiefio.wordpress.com/2009/02/25/the-trouble-with-c12-c13-ratios/
In short, we’re swimming in the stuff from natural sources (haven’t even begun to mention natural plant rotting and volcanoes and subduction of ocean carbonates to decomposition in the crust and…) and the idea that PEOPLE matter to the geologic scale processes is really just silly.
Holy crap. I’m not even slightly worried about the effect of CO2 on temps, but are you saying that CO2 concentrations in the atmosphere are increasing 33% per 14 years (23.5% per decade)? That actually IS a problem.
I have a greenhouse that during growing season is kept at ~1500PPM CO2. Plants love it, but it will give you a pretty bad headache if you stay in there for 2 hrs or more. Don’t know why, but it’s well documented. It’s like the splitting headache you get if you stop drinking coffee for a few days.
I’ve been told but can’t confirm that this happens to humans when CO2 levels reach 1000ppm. If true, everyone’s going to have a constant, splitting headache starting in the year 2052. If it takes 1500 ppm, then the year will be 2069.
I hate headaches. That’s worrisome information.
I suggest the way forward for surface transport is indeed electricity by hydrogen powered fuel cells. The electricity being produced by new generation nuclear e.g. Thorium based or eventually nuclear fusion.
You post ignores technological advances in energy production.
There was great worry in London at the end of the 19th century regarding horse manure. Future generations were going to be overwhelmed in horse manure if we did not act now. 😉
Shale gas, nuclear fusion, nuclear fission, energy efficient materials and the unknown.
http://www.iter.org/
blogagog says:
December 7, 2012 at 1:26 am
Well you wouldn’t want to be a submariner where CO2 levels are around the 4000 to 5000 PPM mark.
blogagog; the 33% increase is for human emissions, which are a very low proportion of the total including natural.
Thanks for the post and all the comments. Good to see data and physics discussed.
One question: Why do we still use global average temperature as a proxy for heat content and radiation?
First: Near surface air temperature does does not say much about heat content and radiation of that area without accompanying data on air humidity.
Second: Average global temperature says nothing about wether the earth is warming or not because a reduction in temperature swings alone would result in higher average temperatures without any change in overall radiation.
Third: Average global temperatures are influenced by cloud cover. Cloud cover has increased in those years and may have counteracted any additional radiative forcing of CO2.
To sum it up: We don’t know if this one third of human CO2 emissions since 1998 has had any effect on “global warming”. It can certainly not be judged by looking at global average temperature alone.
You show a grapgh or rising CO2 and a graph of rising temperature and state “Once again, you don’t have to be a climate scientist to think that there seems to be a connection.” If you substituted a graph of rising incidence of say, asthma, does that mean rising Co2 causes rising asthma?
Correlation is not causation.
eco-geek: ‘what is the physics behind global warming’. There isn’t any! Firstly the earth and the ~100m adjacent atmosphere are at near the same temperature. Therefore the radiative equilibrium is set by the thermal emission of the atmosphere reducing the equivalent wavelength vectors from the surface. Because the GHG part of the thermal spectrum is near black body, this means there are just a few water vapour side-bands [23 W/m^2] net IR. Most of the IR is lost via the atmospheric window,
Secondly, No IR absorbed by the atmosphere can be directly thermalised: there is no experimental proof of any direct thermalisation.
it’s a big confidence trick based on claiming imaginary polluted cloud cooling hides imaginary CO2-AGW.
I don’t think you will get headaches anytime soon.
Co2 levels of concern might become just a thing of the past by 2052. Look at the USA co2 output curve. Also look at China’s heavy investment in nuclear and hydro. Things are changing but not in the way Warmists want. I doubt headaches will be a concern to people living in 2052.
Here is the MNDOLI link:
http://www.health.state.mn.us/divs/eh/indoorair/co2/index.html
@JMT:
It’s worse than we thought. CO2 is causing Solar Storms!
http://chiefio.wordpress.com/2012/04/20/co2-causes-solar-storms/
We’ve had rising levels of solar storms right in sync with CO2 for DECADES. Clearly it’s a problem. And as there’s nothing else the Magic Gas can’t cause, I see no reason to ignore this one.
😉
But Wait! There’s MORE!!
http://motls.blogspot.com/2006/05/global-warming-on-jupiter.html
That nasty ol’ CO2 is even making the OTHER planets warm up! Right in sync with CO2, they ALL get warmer!!!
Clearly CO2 is causing all of this. After all, the lines both go up together!!
😉
Sensitivity to CO2 is zero, maybe slightly negative, if anything. Climate shifts from warming to cooling at the highest CO2 concentrations, and from cooling to warming at the lowest concentrations. This has never failed and it’s happening now again, for the milionth time.
On the face of the Earth’s energy budget, the radiatively active gases radiate to space and cool, while the non-active gases (the bulk, N2, O2) cannot radiate and therefore insulate. They’re the real GHGs.
http://science-edu.larc.nasa.gov/EDDOCS/images/Erb/components2.gif
Tom Fuller said;
‘One of the few non-controversial datasets in climate change is the Keeling curve, the graph of the concentrations of CO2 in the atmosphere reproduced here.’
Non controversial??!! Just see how fast Ferdinand would get here if I posted an extended excerpt from Becks work.The CO2 records available from 1830 need independent auditing as they show a different picture to Keeling (who was greatly influenced by G S Callendar and somehow miraculously got the concentrations right first time-something that had apparently eluded generations of scientists before him )
In using as evidence material from Giss from 1880 you are ignoring the reality that temperatures have been rising-in fits and starts-since the 1600’s;
http://wattsupwiththat.com/2012/08/14/little-ice-age-thermometers-historic-variations-in-temperatures-part-3-best-confirms-extended-period-of-warming/
In this context Hansens record from 1880 (largely copied from the stations used by Callendar who was called an amateur by the Royal Met Society) can be seen as no more than a staging post of already rising temperatures and not the starting post.
Arrheniius substantially changed his estimates in 1907 in a paper that seems to get quoted a lot less than his estimates from a deade earlier.
My increasing belief is that man is a low noise within the climate system (a sometimes loud noise locally but relatively quiet in a global context) through its activties primarily involved with Forestry and agriculture, but that co2 itself is a minor and muted noise within the overall song of humanity..
Nice to see you writing here again. Look forward to more pieces.
tonyb
eco-geek says: December 7, 2012 at 1:15 am
OK, most of the energy from the Earth’s surface is actually lost by radiation. But no matter how the atmosphere is heated, whether by conduction, convection, evaporation or radiation, it can only radiate back to Earth due to the prescence of greenhouse gases. The major constituents of the atmosphere, oxygen and nitrogen, do NOT radiate in the thermal IR region. So, without greenhouse gases, there would be no back-radiation.
*The physics behind the theory of global warming are solid.*
It is obviously not, since the “science” must be helped by skewed paleoclimatic hockey sticks, artificially adjusted temperature data. It is as solid as leftist’s idea, that raising taxes or eliminating the rich class will yield more revenue. Usually it does not.
*CO2 is a greenhouse gas.*
Name-calling.
*This chart shows the global average temperature change from a ‘normal’ 30-year range from 1950-1980.*
Friends do not let friends use GISTEMP.
*The physical theory … has observational evidence that tends to confirm it. I certainly believe in it. I believe that global temperatures will probably rise by about 2 degrees Celsius over the course of this century.*
Science is not about believing. In God we trust; all other show data.
*Having extra CO2 in the atmosphere warms the atmosphere, which is presumed to produce more water vapor*
Never observed so far.
*As I said, it is not uncommon or unexpected for the temperature record to have flat or declining periods that last a decade or more.*
Models have not predicted such a flat period.
http://blog.sme.sk/blog/560/310249/global2001.jpg
There was substantial cooling between 1945-1980.
http://data.giss.nasa.gov/cgi-bin/gistemp/gistemp_station.py?id=431043600000&data_set=14&num_neighbors=1
These kind of lukewarm posts should be endorced in WUWT. This shows that the author has an open mind and the courage to discuss the shortcomings of the typical models. The only way to advance specticism is to debate in a way that does not put the other side in an akward position. If they feel that they discovered the truth themselfs, they are much more likely to change their views.
I’m certain that if the warming plateau continues majority of the lukewarmers will shift their opinions accordingly. Anayways this article is a great tool. Now I can ask “Why hasn’t there been any global warming for 15 years, when 1/3 of all the human released CO2 has been released to the atmoshpere?”.
“This does not ‘disprove’ global warming–at all. I still believe that temperatures will climb this century, mostly as a result of the brute force effect of the 3,000 quads of energy we will burn every year starting in 2075–the reason I started this weblog.”
And science does not “disprove” the existence of God – the scientific method is to put forward a hypothesis and set about proving that it is valid, rather than get people to disprove it – such an approach is for people of faith. “I still believe” is a sign of faith and not a statement of science.
Is the figure of 110 billion metric tonnes derived from data extrapolated/extended to 2011? The data from 1998 to 2009 in your table seems to sum to only 91.7 billion.
MikeB: ‘back radiation’ does not exist except as the artefact of the shielding of the detector in a pyrometer.
Its purpose along with the ‘forward radiation’ field from the Earth’s surface is to combine vectorially to produce net energy flow, the only bit that can do thermodynamic work.
The two-stream approximation vastly exaggerates heating so it’s all a big scare story constructed by the physics’ amateur Trenberth, who being a meteorologist was taught incorrect physics.
It”s a bog cock up.
“Arthur, I strongly agree with your point that it is foolish to assume technology is stagnent and our energy sources will be the same in 2075 as today.”
It is very reasonable to assume that the power stations we build today, and have built in the recent past, will still be operating in 2075. E.g. the Chinese happily bring a coal-fired station on line every week – the size of the largest US power station. These things are here to stay for a while…
It should be clear that we fight for strategically securing rescources for a reason: We intend to burn all the stuff that is still in the ground either way, right?
I hope I will still see H fusion succeed in my lifetime.
@AlecM
You are right two-stream heat flow gives spurious absorption.
In the following link are given qualitative results for a one-stream formulation of heat flow.
No back-radiation and absorption by the atmosphere an order of magnitude lower.
The mechanism of heat evacuation is convection.
http://www.tech-know-group.com/papers/IR-absorption_updated.pdf
The AGW is hypothesis has a central constant, something called Hansen delay of 15 years
Hansen was, and is wrong to attribute 15 year lag to the CO2 warming factor!
Why is that?
The 15 years lag is nothing to do with CO2, it is exactly the delay between geomagnetic signal (derived from the combined sun-Earth magnetic field changes and the AMO:
http://www.vukcevic.talktalk.net//GSOc.htm
15 year lag is well known natural effect
It is delay between the changes in the angular momentum of the Earth’s outer core (where magnetic field is generated) and the LOD (length of the day)
NASA & Oxford University: Torsional oscillations of the Earth’s core
http://trs-new.jpl.nasa.gov/dspace/bitstream/2014/13763/1/00-0133.pdf
The total CAM (core angular momentum) exhibits a principal maximum at a 15-year lead with respect to LOD page 6/10
I’m still hoping to raise tomatoes year round. Doesn’t look like I’ll live to see it. Oh, which reminds me, anyone interested in my Y10K software insurance policy? It’s cheap right now. Guaranteed. One hundred percent refundable if not used.
AlecM: Secondly, No IR absorbed by the atmosphere can be directly thermalised: there is no experimental proof of any direct thermalisation.
This has been discussed here at length. Of course back radiation can not increase the temperature of the earth (direct thermalisation), but back radiation can and does slow the cooling of the surface.
Tom Fuller’s statement above therefore is misleading: “Having extra CO2 in the atmosphere warms the atmosphere…”
No it doesn’t. CO2 does not “warm” the atmosphere, never ever. The sun does. CO2 just slows cooling, at least theoretically, resulting in an increase of average temperature readings. Which is pretty irrelevant to the question as temperatures alone tell us nothing about heat content and radiation budgets of a real planet (see post above…). On top of that: Even if CO2 slows the cooling of the earth, we simply don’t know exactly what other effects kick in (clouds? change in weather patterns?) to counter that reduced rate of heat loss and might even temporarily overcompensate, thus resulting in global cooling.
Bair Polaire; Sorry, but I disagree. Back radiation is simply thermal GHG emission. it has nothing to do with CO2 band IR emission from the Earth’s surface because that is annihilated at source.
Sorry, don’t mean to be personal, but this is one of this is one of the most amazing mass delusions in scientific history, a bit like the Earth centric view of the Catholic Church.
There is no significant absorption of IR from the Earth’s surface by GHGs. The GHE is an entirely different phenomenon – the surface temperature rises and that heats the adjacent gas above lapse rate warming, pushing the tropopause a bit higher.
No process engineer who has like me done real measurements of GHG heat emission and absorption considers the ‘consensus’ has the remotest connection with reality. it’s a con.
Just three words chaotic, politics and belief collide indignantly with science, theory and hypothesis cut to the chase and objectively you have to recognise the fact that everyone involved in this fracas has an axe to grind. The politicians Ban Kimoon UN, Obama, EU, the activists WWF FOE Greenpeace media BBC, various sycophantic economists and pseudo scientists Univ Professors are all milking “the climate” for all that they are worth and in truth no one really knows what the hell is going on and 40 years ago no one really cared now the paranoia on all fronts is bordering on lunacy. Even when data and evidence is presented that directly contradicts the hypothesis politicians and activists continue to wring their hands about warming even when warming is not happening because their specific goal was never about saving the planet the UN target was getting their hands on $100 billion of our money to give to their mates because that is what every human wants more money. Wind turbine speculators foam at the mouth at getting their hands upon legislated subsidy because its more of an assured income that fighting every day to make a profit unexceptional but well educated politicians couldn’t care less about the effect but know belief is everything and will exploit that sectarian interest to garner votes conveniently misunderstanding the contradiction and the self deception of their behaviour. What everyone needs to do is recognise the reality that whatever cause of our climate to change or weather to be better or worse it is most likely to be completely random and continually chaotic with one system competing against another and that whatever we do we can neither change it nor manage it. The laws of physic will prevail there will be birth life and death physics goes one way only and what happens in between is unpredictable. What all of this debate makes quite clear is the fact that there are just too many people with too little to do with their lives except bicker about how to exploit the current situation for cash power influence or corruption of the politician process and that most people care too much about the rhetoric and care too little about making sure that we elect individuals who have some rigour and some sense of reality. This is true the more greed and corruption there is in the system the short will our lives be on this planet because there are only so many holes you can dig in the ground everything is finite which makes continuous argument about whether it gets hotter or colder irrelevant for me hotter is better because if it gets really bloody cold then we are all stuffed and if those who believe that the rise in temperature is only 50% of what the hawks claim it to be then we are closer to freezing to death than we are to being just a little more than warm, think the word is get a grip!!
[Slow down. Take a breathe. Calm down. Use paragraphs, sentences, punctuation. 8<) Mod]
Steven Mosher says: December 6, 2012 at 9:00 pm
“… How many excess Watts does it take to melt Greenland?…”
Good point on the wattage difference Steven, indeed not negligible.
Amazingly enough I found at least a partial answer some time ago to your question: (summary… a lot): 2 to 4 degrees in temperature PLUS 60 Wm2 extra insolation!
Re Eemian insolation forcings – according to researchers it took temperatures equivalent to future IPCC ‘no action’ projections PLUS a massive increase in isolation: 60 Wm−2 compared to the 0.85 Wm−2 loading currently estimated to occur from CO2 increases.
Significant contribution of insolation to Eemian melting of the Greenland ice sheet (2011) van de Berg etal
http://www.staff.science.uu.nl/~broek112/home_files/MB_pubs_pdf/2011_vdBerg_NatGeo.pdf
But we DO know what warm air does! It rises!
So any ‘slower cooling’ from ‘back radiation’ just means more and ‘faster rising’ to make up for it.
So take your model of more “back radiation” and air having some added warmth near the surface (temporarily). It will expand, become lighter, and head UP. The more “back radiation” induced temperature is higher than it otherwise would have been, the more and faster it rises to dump that heat at the TOA to be radiated away more effectively by those same radiating gases.
The net result of more CO2 is at most slightly faster convection during the warmest part of the day. (As temperatures cycle strongly over the course of the day, the heat is all dumped before sundown anyway. Ask any pilot when thermals happen. They start just after sun-up and run down after the sun sets.)
What about water? To the extent the surface is water, more “back radiation” makes more evaporation (and not higher temperatures). As water vapor is lighter than air, it, too, rises. In that case to eventually make clouds at altitude where it condenses and dumps the energy (and more effectively radiating the heat away).
There is simply no reason to stop the model (mental or otherwise) at the point the photon hits the dirt or CO2 molecule. We do know what happens. Hot air rises. Hotter air rises faster. The evaporation / precipitation cycle runs faster (if ‘rain is in the air’) too. What’s broken is the idea that heat “builds up”, when in reality it “travels up”…
Mosher writes “Now quickly what was the difference in watts from the sun between the LIA and today?”
A trick question? TSI is overrated. Try considering energies at specific wavelengths and then answering your own question.
E. M. Smith: “What’s broken is the idea that heat “builds up”, when in reality it “travels up'”
Agreed but there is a bit more subtlety in that clouds interact with the atmospheric window to control heat loss.
Also,. photons do not exist until the instant Poynting Vectors combine vectorially at a point.
There’s a slight problem with the “MODTRAN Radiative Forcing; Double CO2” graphic lined to by spertor and Steven Mosher (but for entirely different reasons). The emission chart doesn’t represent the equilibrium state; it’s intended to show the reduction in outgoing radiation, and the consequent forcing of an instantaneous doubling of CO2. The proof of that is the absence of change in the radiation escaping from the surface through the “atmospheric window”, wavenumber ~800-1000 on the chart and references to the same or similar charts in the scientific literature. The superimposed plots represent an unchanged surface temperature..In other words it’s the “initial conditions” for such an instantaneous doubling.
The premise that a continuing increase of CO2 would lead to a long-term reduction in radiation to space (and therefore continuous and accelerating warming) is clearly a false one. The Earth-atmosphere system would also continuously change to a new (warmer) equilibrium where outgoing radiation would rise to match the incoming (assuming all feedbacks remain constant).
edit/addendum to this post: markx says: December 7, 2012 at 3:58 am
Steven Mosher says: December 6, 2012 at 9:00 pm
“… How many excess Watts does it take to melt Greenland?…”
Amazingly enough I found at least a partial answer some time ago to your question: (summary… a lot): 2 to 4 degrees in temperature PLUS 60 Wm2 extra insolation! … to melt 30–60% of its present-day volume…
Significant contribution of insolation to Eemian melting of the Greenland ice sheet (2011) van de Berg etal
http://www.staff.science.uu.nl/~broek112/home_files/MB_pubs_pdf/2011_vdBerg_NatGeo.pdf
@AlecM:
And here I thought photons only came into existence when we chose to measure / see them after they transited the slit… er, the two slits… ;-+
http://www.doubleslitexperiment.com/
BTW, I also thought Poynting Vectors were only valid in free space (vacuum) not occupied space? (One presumes due to the molecules ‘observing’ the photons 😉
https://en.wikipedia.org/wiki/Poynting_vector
But what do I know… I haven’t observed my answer yet, so it’s both true and non-true ( or alive and dead… or meowing…and not…)
Isn’t quantum-reality fun? 😉
Speaking of which: The cloud represents condensed water, so IR loss. Yet it also blocks more (new) incoming light. Net I’d count that as heat blocking and dumping. Now it might do this over an area other then where it first formed, and that place might have some ‘retained warmth’ (from clouds at the ‘right’ height…) but that ignores what happened during the formation…
Then again, we don’t really know how to model clouds… so maybe they haven’t decided what they will do / be yet either … The ‘received wisdom’ is that clouds at one altitude cause heat retention while those at another altitude cause heat loss. Wonder what they do with clouds that change height…
Maybe I’ll go out and look at a cloud so it has to ‘make up its mind’ 😉
E.M.Smith:
The net result of more CO2 is at most slightly faster convection during the warmest part of the day.
What’s broken is the idea that heat “builds up”, when in reality it “travels up”.
Great post! Couldn’t you take this whole issue of broken reasoning and make it an article?
Can you recommend links to what exactly happens at the surface of the sea (direct evaporation, not higher temperatures? maybe both?) and to how exactly the earth is cooling by conduction, convection, evaporation and eventually radiation. Anybody? It should be easy to understand, I want to show it to a friend at the UN. Thanks a lot.
@Bair Polaire:
Probably… but not right now… It’s 4:44 AM for me, and I’ve not been to sleep in 20 hours… I’m about at my ‘end of day’ and starting a new article is not going to happen. But in about 8 hours I’ll give it a go. I’m just too ‘fuzzy’ to do it now. (And, finally, fading fast… To sleep, perhaps to dream…) But glad you like it!
There is a whole chain of “broken thought” that makes up the AGW Model. From being “All IR all the time – convection and precipitation need not apply” to simply ignoring things that are well known to matter to confounding temperature and heat to… But that is for tomorrow… (er, later today 😉
E. M. Smith: the Poynting Vector I allude to is the average energy flux for a monochromatic plane wave: qdot = epsilon c. E0^2/2. For a collimated beam it is identical to the Planck irradiance at that wavelength.
A gas may have slightly different epsilon but at the earth’s surface there will be the vector summation of the Down and Up PVs. This is a more subtle take on the standard S-B analysis which because the S-B equation is the integrated Planck function, you lose information.
@AlecM:
Did I not have enough 😉 faces on my comment to make it clear I was having a bit of fun with Q.Mech.? Ok, go ahead and be serious about it… but I can’t say “Poynting Vector” without thinking that we need “The machine that goes PIIING!” in the background somewhere 😉
Yes, they work in gases too, but with more terms… better as a thought tool, IMHO; then again, that’s what you were using them for…
I am still waiting for some credible statement as to what the optimum temperature should be. We don’t know if we are below it or above it. But this has not stopped the fretting. As an issue, global warming (er, now “climate change”) is far more about advancing central control and justifying bigger government than it is about real remediation of climate trends that is harmful to the ecosystem.
Have a look at:
http://www.metoffice.gov.uk/hadobs/hadcrut3/diagnostics/global/nh+sh/
Smoothed HadCRUT3 *has* increased since the beginning of 1998.
Something else apparent in HadCRUT3: A periodic cycle with a period around 62 years and an amplitude around .21 degree C peak-to-peak, with the most recent peak in 2004. (Assuming it’s sinusoidal, which may not be the case.) This largely explains the lack of warming since 2001, as well as about 40 of the warming that did occur from 1973 to 2004.
Something else: Although 110 of the 356 gigatons of CO2 emissions have occurred since 1998, and about 28% of the increase in atmospheric CO2 above the estimated pre-industrial level of 280 PPMV occurred since 1998, the percentage of warming from the pre-industrial to 2012 change of CO2 caused by the 1998-2012 CO2 change will be less. This is because the greenhouse gas effect of CO2 varies approximately logarhythmically with CO2 level. On a log scale, the post-1998 CO2 increase is about 23.5% of the increase above the pre-industrial estimate.
How many Watts does it take to fry a Mann?
I agree and I give you a link with numbers:
http://www.tech-know-group.com/papers/IR-absorption_updated.pdf
supplement to my earlier plot , here are the major fuel types plus the total as log plots. Here we see how the different fuels dominated different periods:
http://i45.tinypic.com/2na2zd5.png
Interesting to note the dips caused by the great depression and the two world wars and the huge change since the petrol crisis of 1973 , when we first realised that oil was not always dirt cheap and endlessly abundant.
Still the overall observation is that there are distinct periods with different growth rates but each period shows fairly constant exponential growth.
The paradox for anyone wishing to maintain the CO2 is the dominant force driving climate is that the period with most rapid growth was precisely the period when gobal temperatures COOLED.
It would seem from this evidence that either you conclude that faster growth causes global cooling (doubtful) or you realise that CO2 is NOT the dominant force. In fact not even a major player.
I still suspect CO2 has an influence but have yet to find conclusive evidence (or any evidence to be honest) of how much. In order to work that out we need to characterise and understand natural climate change.
Here’s one plot that may suggest recent warm peak was a bit bigger than the last one. Though showing that is not also part of natural variation is far from obvious, without a lot more data. It does, however, leave the door open to a reduced CO2 warming.
http://i49.tinypic.com/xbfqtw.png
Slightly OT: Bloomberg Gaia News was pushing hard this morning for stricter limits on India and China, because India is getting “hardest hit” by Evil KKKarbon. I found some records (which were surprisingly hard to find, and unsurprisingly sketchy!) and graphed Bombay and Delhi.
Results: No warming visible. Not even the expected signature of UHI.
http://www.polistrasmill.blogspot.com/2012/12/india-hardest-hit.html
Sorry for ranting… but:
tokyoboy says:
Another often overlooked fact. The ecosphere easily absorbs CO2, ANY amount of CO2, as demonstrated in – wait for it – Greenhouses. The shock of seasons is the only clearly visible and identifiable thing on the “Keeling Curve”, (other than a rise right at a time in the 70s when the energy shortage was reducing fossil fuel use, and a dip in the early 90s when Kuwait’s oil fields were burning out of control) when a significant percentage of vegetation in each hemisphere simply stops absorbing CO2 for half of the year. NOTHING in the CO2 cycle / system / flux / whatever you want to call it should be considered stable, because it’s NOT.
Since CO2 is plant food, and plants are tremendously ubiquitous, ANY extra food in the air simply gets consumed by plants, whether they’re trees, grasses, mosses, macro, micro, whatever. This is no different from the equivalent of animal populations exploding with an abundance of food and water, and dying off during shortages. It’s the reason there is a “gaia theory” – the planet is hospitable to life BECAUSE of life. Life runs this show, and we don’t control as much of the life on this planet as we often seem to think we do.
This really should cast doubt on any actual anthropogenic signal in the atmosphere in the first place. The assumption that rising CO2 is CAUSED by burning fossil fuels is, contrary to all you think you know, still not proven. It’s merely assumed.
Tom Fuller:
Ditto on human technology. NOTHING is stable. There is absolutely NO REASON to assume that we will continue as we are. Maybe a larger percentage of the world will wise up and start using Nuclear for household power. But predicting anything about technology and even what will drive our goals and civilization in 63 years is a stretch. Could anyone in 1950 have realistically even comprehended our current lifestyle, with HDTV, flat panels, microwave ovens, smartphones, GPS, fuel efficient vehicles, etc.? Not even the Science Fiction authors were even remotely close.
E.M.Smith at December 7, 2012 at 3:58 am – sums it all up. ANY radiative effect of CO2, which most of us totally agree is happening, or could happen, is dwarfed by the simple mechanics that are NOT radiative. The atmosphere is anything but still – air is constantly moving. Both warmer air and water vapor are lighter, and rise as high as they need to to cool off or condense. This is the main reason that the atmosphere has been AS STABLE as it has for billions of years – it’s not an “evolutionary” thing, it just IS. It’s how a planetary atmosphere works at this distance from the sun, with this much Nitrogen and Oxygen over a mostly water-covered planet. Tiny perturbations in atmospheric make up are simply not capable of the amazing feats of disruption we’re being warned about.
And, it’s the reason I personally have mocked and derided “warmists” for their incredible bad handle on logic. The atmosphere is an extraordinarily complex and chaotic system. There are balances and feedbacks that we have not even begun to comprehend. Gas proportions, temperatures, everything oscillates around some value, and we don’t yet know enough to reverse engineer those values. Blaming tiny, unimportant climate variations on emissions of CO2 that are massively overwhelmed by natural emissions, however, is almost as ridiculous as drawing perfectly straight “trend lines” along every increase one sees in temperature.. or sea level… or the DJIA… or… the price of pumpkins in October.
In reply to Susan S. who wrote in the link a question: http://wattsupwiththat.com/2012/12/06/a-problem-nearly-one-third-of-co2-emissions-occured-since-1998-and-it-hasnt-warmed/#comment-1166789
Here is a nice chart that are composed of many peer reviewed science papers from the 1950’s to the 1990’s that show it is less than 25 years (The high end) and always less than 15 years in the rest of the chart:
http://globalwarmingskeptics.info/thread-188-post-3118.html#pid3118
Enjoy.
“I certainly believe in it”, “I believe that”, “I still believe that”, notice the trend?
Some questions:
Do you suppose the universe cares what you believe?
If you believe something really hard, does that cause it to happen?
Who believed hard enough to cause the medieval Warm Period, the even warmer periods before that?
Is science about belief?
What is it about?
When you can answer that last question, get back to me.
Mosh:
“Now quickly …”
… another Mosher cryptogram.
Mosh, if you know the answer, good for you. Gold star. WHY NOT TELL THE REST OF US!
Now here’s a cryptogram for you: Now quickly, if 3.39 watts/m^2 is bad, what about 70 watts/m^2?
You replied “apples”? Sorry that’s not correct. Nice try though, so we’ll still give you a gold star.
70 watts/m^2 is the approximate additional solar irradiation received at TOA on Jan 3, which is the occurrence of the perihelion in Earth’s elliptical orbit around the sun. Yes, the so-called “solar constant” 1367 (or recalibrated 1362) watts/m^2 is just an average. Actually, it varies from 1345 watts/m^2 on July 3 (apihelion) to 1435 watts/m^s on Jan 3 (perihelion). (Funny how 3.39 gets lost in the noise here.)
How do you like them apples?
The optimum temperature for human beings must surely be greater than the minimum temperature that an unprotected human being can survive. Otherwise, how did we evolve?
What is the lowest temperature an unprotected human can survive? 28C/82F.
This is also the temperature of the tropical rainforests – where we came from. Without technology the heat loss from a human being is such that we cannot eat enough food to survive average temperatures below this.
The average temperature of the earth is 59F/15C. Too cold for humans without technology. Without technology humans would only be found in the tropical jungles.
EM Smith says: ”
”
“GHCN (Global Historical Climate Network – i.e. land thermometers from NOAA data copies for the globe) this graphs is IMHO about as good as you can get:
Nice graph! I would also add that the last time I analysed the data myself (GHCN V2 at the end of 2009) the corrections to the data set were an almost straight line fit from 1910 to present day with an R^2=0.93 and with a slope of +0.3 DegC per century.
Mr. Fuller: Thank you for your exposition. You show exactly why there is no equation in which CO2 concentration is the independent variable and global average temperature is the dependent variable. That theory is wrong. Given a CO2 concentration, you can’t calculate temperature. Controlling the CO2 concentration is going to control the CO2 concentration.
Plenty of other possibilities exist. Fossil fuel consumption may have risen as a result of civilizational growth which is changing some other variable. Or, there may be a more complex equation in which CO2 is a factor. We don’t know the answer. We should say that and start looking for the real answer, which is not likely to be as well funded, but more relevant. We are wasting time and resources at present.
It is not the first time, nor will it be the last, in which science vociferously supports a theory which is then falsified. It strikes me as remarkable for the degree to which scentists, activists, journalists and politicians have chosen sides. Remarkable, but hardly unique. Evolution, eugenics and phrenology come to mind.
The scientific method does not give us a way to find the correct answer. It gives us a way to disprove the wrong answer, and as always, nature gets the only vote that really counts. It seems time to back away from a proposed answer that is obviously wrong, and try again.
“assuming cheap and practical batteries”
Might as well assume unicorns and fairies.
“How many thermometers were there in the Southern Hemisphere in 1880 to calculate the global average temperature of the Earth for that year?”
If one tree is sufficient to measure the temperature of the entire world, then surely 10 to 15 thermometers should be over kill when it comes to measuing the temperature of the southern hemisphere.
****
blogagog says:
December 7, 2012 at 1:26 am
I have a greenhouse that during growing season is kept at ~1500PPM CO2. Plants love it, but it will give you a pretty bad headache if you stay in there for 2 hrs or more.
****
How is the greenhouse enriched? If it’s burner exhaust, your headaches are prb’ly CO induced, not CO2. Pretty sure 1500 ppm CO2 shouldn’t effect you…
Well. I don’t know about the “physics behind the theory of global warming”being “solid”or not. But the observations are suggesting that the theory is wrong. Completely wrong.
End of story.
OK. Can we not all concentrate on more important things? Sorry to everyone who has decided to make a career out of it but you were wrong. You probably owe us all. The least you can do is acknowledge the fact that you were wrong and then you can maybe start paying us back.
I think it’s fascinating that a “lukewarmer’s” post would have hit a sweet spot of interest and provoked such an outpouring of very well thought-out, very diverse, and well documented comments surrounding virtually every aspect of the CAGW debate, and in the process exposed the concept of “settled science” as a total joke at this point. Judy Curry has tried to create such a discussion on her site, but the debate was never as focused as this one.
JWR says:
>>
Look in figure 4 of the following link and get the results for ftot=1
http://www.tech-know-group.com/papers/IR-absorption_updated.pdf”
>>
Thanks for the link but sorry, didn’t get as far as figure4. Second line was where I stopped wasting my time:
“back-radiation of heat” is not a physical phenomenon. [1, 2, 3]
Heat flows and radiates spontaneously only from warm to cold.”
Yet another idiot who thinks he can rewrite the 2nd law and believes a photon can check where it’s going before being emitted and decide whether it’s “allowed” to go there or not.
But look to the next alinea.
Do you think that in the one-slab model the slab absorbs 2q or one q.
And if you are not sure, in the stack of 51 layers is the first slsb absorbing 100q , according to the two-stream formulation- or one q, like all other slabs according to the (correct) interpretation of Stefan-Boltzmann.
But why not looking a bit futher, to find out that the one-stream formulation gives results which are more convicing than the two-stream formulation, a violation of the 2nd Law.
DL Klitsteins says: “This is because the greenhouse gas effect of CO2 varies approximately logarhythmically with CO2 level. On a log scale, the post-1998 CO2 increase is about 23.5% of the increase above the pre-industrial estimate.”
logarithmic 😉
You are right to a point which I once reason why I suggested this article should show this data as a log plot:
http://i45.tinypic.com/2na2zd5.png
However, it’s not even that much since the CO2 concentration is now well beyond what spectroscopy calls ‘linear’ , which actually means it’s linear on a log plot of 😉 The scale of absorbance units is a log scale. CO2 in the atmosphere is pretty much saturated in the wavelengths where it is relevant. The only way it can still have an increasing effect is by the absorption bands broadening by what is called “collision broadening”.
But all this is a bit of side show if they are going to insert “parameters” into the models that multiply the result of the physics based calculation by a factor of three.
So the greatest addition of CO2 ever by mankind produces NO detectable temperature increase?
As in none? Nada? Zippo?
Gaia is messing with you, Tom. And she doesn’t suffer fools lightly.
Matt says:
December 7, 2012 at 2:50 am
Oh, H fusion works. It just isn’t affordable–like solar, wind, geothermal, algae. LENR is a more likely solution.
Sorry old chap, but Arrhenius = Erroneous.
And try comparing the heat content of the atmosphere (even it were trapped by that awful Satan gas) with that real driver of climate, the oceans. Infinitesimal by comparison.
Well done for the cherry picking on the graph of temperature increase, perhaps it would have been more useful/justifiable to look at the 100 time span to date. And then a different picture forms.
The notion that our tiny contribution to atmospheric CO2 is either significant, or long lasting is laughable.
Yes Tony you are right.
The link hereunder give you the numbers.
http://www.tech-know-group.com/papers/IR-absorption_updated.pdf
It’s an even bigger problem than Mr. Fuller will admit. It is yet further evidence, the icing on the cake, if you will, showing that the GCMs are pure unadulterated bunkum. Belief systems, even those which are “more moderate” are difficult to set aside, I guess. Ya just gotta love the “brute force effect” of man’s C02. You can’t see it, can’t measure it, but you just KNOW it’s there.
If CO2 slows down the cooling of the Earth’s surface, then does it not, by that exact same process and to the exact same degree, slow down the warming of the Earth’s surface — by absorbing IR coming in from the Sun and isotropically re-radiating ~half of that back out? After all, about half the incoming solar radiance is IR.
Is there some reason CO2 works on outbound IR and not on incoming?
What strikes me about the trend of the CO2 graph is that it is linear and not logarithmic. I would have expected that since the 1960’s that fossil fuel use, number of cars, businesses, expansion of developing countries, population increases that the graph SHOULD be more of a log growth than linear. I get that the fluctuations are due to seasonal changes, but everything looks just too constant, trend-wise, for me to definitively say that this is all due (or even mostly due) to humans. The recessions and expansions that have affected global economies should have made more blips and bumps in the graph, no? Can anyone help me out with what I’m missing here?
Another thought for the pool: part of the implicit premise of the article is flawed. Though carbon emissions are going up dramatically, the quantity of carbon in the atmosphere isn’t going up as fast. You can check this out by comparing the rise in PPMV with emissions. By my estimates, only about 50% of the carbon ends up in the atmosphere, and that proportion has been going down for about 10 years. Even if it were constant, the “third of emissions since 1998” doesn’t mean “third of increase in CO2 since 1998”.
FWIW, I’m with the author. The current rate of CO2 growth coupled with historic correlation /sensitivity of temperature to CO2 means that AGW really doesn’t matter. That’s even leaving aside the real possibility that the rise in temperature is an unrelated natural phenomenon, or that feedbacks might be (or even become) negative. You have to believe computer models which say that things are going to get much worse in order to be in the worried camp.
Thinking Out Loud sez: “To account for thermal lag you can repeat but offset the d(temp) from the d(C02) by one year, two years etc, but you still get fundamentally the same picture. What that says to me is that the influence on temperature from C02 is small compared to something else.”
In a linear/monotonic analysis, the time lag does not make a difference. Pearson r would be the same. Linear regression weight would be the same, although intercept would be different. In the natural world, most linear relations are linear for some limited range, and the relation curves one way or the other at the ends. Here, at the most you would have a couple data points at either end weakening the calculation of the strength of the monotonic relation.
mellyrn says:
December 7, 2012 at 9:33 am
NO, because the solar radiation comes in at different wavelengths to the outgoing earth radiation. See…
http://www.ghgphys.com/userimages/sunearth2.png
The carbon dioxide band relevant to global warming is between 14 and 16 micron. Notice that this coincides with the outgoing radiation, but doesn’t block the incoming insolation.
Easy – yes! Try to get up to speed.
Tom Fuller says
The physics behind the theory of global warming are solid. CO2 is a greenhouse gas, we’re emitting industrial levels of it, with China now in the lead for emissions. A significant portion remains in the atmosphere for a fairly long time, though the residence time is widely disputed.
This residence of CO2 retards the cooling of the Earth and temperatures warm as a result.
Henry says
this is all rubbish and we have been discussing this at length here for I don’t know how many times/
i.e.
the truth is that the physics is not solid and we do not know if the net effect of more CO2 in the atmosphere is that of warming.
Namely, in the case of CO2,
there is also radiative cooling, due to absorption of the molecule in the UV (which is why we can identify it on other planets!), in 1-2 um, and 4-5 um bands. I am saying that the cooling due to back radiation in these regions of the molecule that goes on 12 hours per day might be just as much as the warming (or:delay in cooling) due to the back radiation coming from earth 14-16 um, that goes on 24/7. So WHERE is Tom’s balance sheet that would show us that the physics is solid? What the IPCC did is evaluating warming against CO2/ GHG increase.
They forgot that more heat (natural) + HCO3- (gigatons in the oceans) => produces CO2 + OH-
(the first smoke of a kettle that has been turned on)
On top of that we have an increase in vegetation over the past 50 years which has been considerable.
Plants and trees need both warmth and CO2 to grow. Or did you ever see a tree grow where it is very cold? So how much biological cooling was caused by the CO2 due to the increase in vegetation over the past 50 years?
.
You see what the problem is? You cannot say: if there is an increase in CO2 it must be getting warmer (even though that increase in warming might be very small) until you have first proven it by doing some physical testing. The closed box experiments do not tell you how much radiative cooling and how much radiative warming is caused by the increase in CO2.
You cannot “calculate” that which has never been measured. (which is what they have been doing by applying as correct the inverse relationship which might not be causal. i.e. smoking causes cancer but cancer does not cause smoking.
For a better understanding of the physics, I advise you all to read this:
http://blogs.24.com/henryp/2011/08/11/the-greenhouse-effect-and-the-principle-of-re-radiation-11-aug-2011/
“…you don’t have to be a climate scientist to think that there seems to be a connection.”
I agree. In fact I’d go as far as to say it probably helps if one is scientifically illiterate in order to think that there “seems to be a connection.” We know we’ve been pumping out CO2 throughout the industrial age. That doesn’t mean you can then pick any other trend, e.g. temperature change, and conclude that there is a “connection” at all, let alone a cause-and-effect relationship. It could be an accidental coincidence. The fact that historically CO2 has never caused run-away warming in the past (natural CO2 changes have always followed temperature changes, not vice versa) gives support to this theory.
The empirical evidence is clear: CO2 does not significantly affect temperature. Temperature determines CO2.
blogagog says:
December 7, 2012 at 1:26 am
Holy crap. I’m not even slightly worried about the effect of CO2 on temps, but are you saying that CO2 concentrations in the atmosphere are increasing 33% per 14 years (23.5% per decade)? That actually IS a problem.
I have a greenhouse that during growing season is kept at ~1500PPM CO2. Plants love it, but it will give you a pretty bad headache if you stay in there for 2 hrs or more. Don’t know why, but it’s well documented. It’s like the splitting headache you get if you stop drinking coffee for a few days.
I’ve been told but can’t confirm that this happens to humans when CO2 levels reach 1000ppm. If true, everyone’s going to have a constant, splitting headache starting in the year 2052. If it takes 1500 ppm, then the year will be 2069.
I hate headaches. That’s worrisome information.
The headache is caused by acidosis. You are not clearing CO2 from your system as efficiently as you would under lower concentrations. The increase in CO2 results in a systemic shift toward a lower (more acidic) pH. Your doctor could probably offer some easy cures. Acidosis is essentially the same chemical effect that the “ocean acidification” bunch are worrying about. Unlike the ocean, while your system IS buffered to maintain an average pH state, because of the difference in mass, your system’s homeostatic mechanisms are more easily overloaded.
”
A trick question? TSI is overrated. Try considering energies at specific wavelengths and then answering your own question.”
TSI is overrated. Total solar is over rated? really? Is that settled science?
I’ll ask the question again. using whatever wavelengths you want, please show the difference between the sun in the LIA and the sun today?
use watts. it will help folks understand.
P. Solar,
Here is another idiot. When a utility boiler is down, the steam pipes are cold, ambient. When you light the boiler, the gas or coal or oil burns around 4000 F. Very quickly the pipes begin warming, and end up at around 1000-1200 F, of course flled with soon-to-boil water unless it is a supercritical boiler which most of them are now. Now the inside of the boiler is completely lined with steam pipes, as many as can be crammed in. Ges what happens to the burning fuel? Yup, that’s right, still at 4000 F. Looking inside one you get an idea what Hell might be like.
Compare and contrast to your statement. If you could contradict me I would sincerely appreciate it, as this is counter-intuitive, but happens just every darn time. If it didn’t soon the fuel could be turned off, free ride like an MG Midget behind an 18-wheeler!
Yesterday I spent some Google time drilling for the duration of re-radiation. I got everything from microseconds to picoseconds. It makes a huge difference, as the slower it happens, the less likely it is to happen, as the CO2 molecule will bounce off many neighbors, just heating them up. The most believable writer in fact stated that one in 10,000 events results in re-radiation. Apparently Einstein himself was involved in calculating this.
Is it possible that, in this day and age, the phenomenon is not well-described?
Susan S., every year Mother Nature puts in, and takes back out, 97% of the CO2, and we put in 3% rising. The total in the atmosphere is about 5 years worth of this, so my money is on a 5-year residence time. Crops and forests worldwide are lush these days from the extra CO2, so what will happen in the coming years? Beats me…
“Guess,” sorry sorry
Man made global warming theory depends more on the H2O molecule than CO2, the idea is that CO2 triggers a slight increase in global temps, which then places more water vapor into our atmosphere. This increases global temps. So how has atm H2O levels changed since the 1940’s ? Recent studies indicate a slight downward conc. which is opposite of prediction AGW. Perhaps the wrong atm gas is being studied.
Thanks both to E.M Smith and to sunsettommy. I appreciate the help. So do these graphs show that those natural and man made emissions from 10 years ago, have they then been removed from the graph? Should they not show more of an up down cycle than just a regular climb such as this graph shows?
Steven Mosher says:
December 7, 2012 at 11:34 am
I’ll ask the question again. using whatever wavelengths you want, please show the difference between the sun in the LIA and the sun today?
Err.. is that a trick question? The Svensmark effect is a serious contender to explain the mechanism of amplification of minor solar variances. That ampplification has real impacts on solar insolation, which is the real driver of temperature and climate.
Are you asking the right question?
RE: Steven Mosher: (December 6, 2012 at 9:00 pm)
[RE: Spector says: December 6, 2012 at 8:53 pm]
“MODTRAN Radiative Forcing; Double CO2
“MODTRAN3 v1.3 upward irradiance at 20 km [up], U.S. Standard Atmosphere
http://en.wikipedia.org/wiki/File:ModtranRadiativeForcingDoubleCO2.png%5D
“Yes, notice the difference in Watts.
“Now quickly what was the difference in watts from the sun between the LIA and today?”
The difference in watts indicates that the net upward irradiance from the Earth would be 3.39 watts per square meter less with 600 PPM CO2 concentration (blue curve) than with 300 PPM (mostly hidden green curve.) These are plots of Terrestrial Irradiance (‘Earthshine’) looking down from 20 km up with the Earth at an assumed identical constant surface temperature in each case.
Using the standard settings for the MODTRAN webtool hosted by the University of Chicago:
CO2=375 PPM
CH4=1.7 PPM
Trop. Ozone=28 PPB
Strat Ozone Scale=1
Ground T offset=0
hold water vapor=pressure
Water Vapor Scale=1
Locality=1976 U. S. Standard Atmosphere (default: Tropical)
[Weather]=No Clouds or Rain
Sensor Altitude=20 km (default 70 km)
[Orientation]=Looking Down
One gets an output for “Ground T, K=288.20 (degrees Kelvin ) for Iout of 258.893 W/m2.
Then if you set the Ground T offset to +1, the result is 262.200 W/m2 for 289.20 K
The difference being 3.307 W/m2 for a one degree surface temperature rise. Assuming a constant solar energy input, that one degree rise would just about compensate for irradiance lost (3.39 W/m2) by doubling the CO2 content. So far, man has added enough CO2 to the atmosphere for about a half doubling (41.4% increase), logarithmic effect.
I understand that the 20 km sensor altitude setting, which shows energy flowing out of the troposphere, is the standard for measuring ‘Radiative Forcing.’ I believe that data calculated for the default 70 km altitude would be more representative of thermal energy actually escaping the planet.
Ref: Modtran Infrared Atmospheric Radiation Code
http://forecast.uchicago.edu/Projects/modtran.html
mellyrn says:
December 7, 2012 at 9:33 am
If CO2 slows down the cooling of the Earth’s surface, then does it not, by that exact same process and to the exact same degree, slow down the warming of the Earth’s surface — by absorbing IR coming in from the Sun and isotropically re-radiating ~half of that back out?
—————————–
MikeB says:
(Hilariously erroneously, since it’s nearly verbatim what davidmhoffer told me a few days ago in HIS impassioned plea for me to believe he ‘understands the physics’ and that the fact the sun is blue and that I don’t know, is proof I don’t)
December 7, 2012 at 10:15 am
“NO, because the solar radiation comes in at different wavelengths to the outgoing earth radiation. See…
http://www.ghgphys.com/userimages/sunearth2.png
The carbon dioxide band relevant to global warming is between 14 and 16 micron. Notice that this coincides with the outgoing radiation, but doesn’t block the incoming insolation.
Easy – yes! Try to get up to speed.”
————————————-
You are the second Greenhouse Gasser who’s come here
insulting the readers *** for not knowing the sun is blue***
in just a few days.
You people who believe in Greehnouse Gas religion are stunningly ignorant; and indeed to a man seem like you’re also utterly impervious to that typical proof a theory is wrong: the calculations and algebraic principles are wrong all along the way.
You’re so sure you’re right: you’ve looked over all the calculations, and yes, Greenhouse Gas Religion makes perfect sense according to the numbers…you’ve been cogitating on it for years, “teaching” and “clarifying” the “sensitive, nuanced physics,”
and then you reveal that:
the whole time,
you thought the sun is blue.
From Greenhouse/Occupy-pedia: the article ‘Sunlight’ :
“…Sunlight in space at the top of Earth’s atmosphere … is composed (by total energy) of about 50% infrared light,
40% visible light,
and 10% ultraviolet light.”
“At ground level this decreases… by energy fractions to 44% visible light, 3% ultraviolet (with the Sun at the zenith, but less at other angles), and the remainder (53%) infrared.
Thus, sunlight’s composition at ground level, per square meter, with the sun at the zenith, is about
527 watts of infrared radiation,
445 watts of visible light,
and 32 watts of ultraviolet radiation. “
It is very clear from this graph:
http://www.climate4you.com/images/HadCRUT4%20GlobalMonthlyTempSince1958%20VersusCO2.gif
Diagram showing HadCRUT4 monthly global surface temperature estimate plotted against the monthly atmospheric CO2 content according to the Mauna Loa Observatory, Hawaii, back to March 1958. The red line is a polynomial fit with key statistics listed in the upper left part of the diagram. Last month incorporated in the analysis: October 2012 (inside red circle). Last diagram update: 21 November 2012.
http://www.climate4you.com/ClimateReflections.htm#20080927:%20Reflections%20on%20the%20correlation%20between%20global%20temperature%20and%20atmospheric%20CO2
Maybe there should be some “consensus” that the warming since LIA has released CO2, thus the rise in CO2 is an artifact of the warming oceans plus industrialization. And the warming since LIA allows for additional atmospheric moisture while warming oceans allow for less concentration of soluble CO2. I still see the problems with which came first, the chicken or the egg, in founding the arguments. In the end it’s always the surface heating the atmosphere regardless of the atmospheric composition.
****
Steven Mosher says:
December 7, 2012 at 11:34 am
TSI is overrated. Total solar is over rated? really? Is that settled science?
I’ll ask the question again. using whatever wavelengths you want, please show the difference between the sun in the LIA and the sun today?
use watts. it will help folks understand.
***
No significant difference. Not sure what your point is, other than the global climate, despite constant TOA solar input, varies naturally at least of couple degC over centennial timescales. In fact, it’s proven in ice cores to vary far more than that.
Having read Fuller’s article I am left with the impression he knows about as much as the rest of us.
– – – – – –
Tom Fuller,
Your opening paragraph has the fundamental seeds of why your argument does not lead logically and scientifically to your’ belief’ (your word not mine) that a problem exists about adding anthropogenic CO2 to the Earth-Atmospheric system.
First it is not sufficient to say “The physics behind the theory of global warming are solid.”. That statement is not relevant when applied to the multiple timescale dependent net effects of all physical processes, considered individually and in interaction with each other, of the actual total Earth-Atmospheric system as it exists in its setting of orbiting the Sun and having a relatively large moon. You are substantially incorrect because simple ideally arranged boundary condition physics calculations with caveats of ‘all other things being equal’ do not present your solid basis of global warming of the Earth-Atmospheric system. It does not. GCMs do not help your statement either; rather they would weaken it considerably.
Second, the ‘theoretical’ direct temperature change effect of anthropogenic CO2 increase on the Earth-Atmospheric system may be as much as ~1.2 C per CO2 doubling, or it may be much less. It is not conclusively known what the direct effect magnitude is in the actual Earth-Atmospheric system as opposed to a laboratory research project. With any magnitude for it, the case observationally is that it appears to be, in geologic timescales and in the modern period from ~1860, not of sufficient causal climate change magnitude compared to naturally occurring phenomena that are a quite reasonable basis for explaining all of the climate behavior. This observation contains feedbacks occurring within the timescales; arguments of quasi-equilibrium in the Earth-Atmosphere system outside of the timescales notwithstanding.
Third, it is not scientifically meaningful to say “CO2 retards the cooling of the Earth and temperatures warm as a result.”. The Earth-Atmospheric system contains a multi-gaseous planetary atmosphere which provides a planetary atmospheric effect on Earth-Atmospheric system’s overall behavior in response to all the energy flows into, within and out of the Earth-Atmospheric system. CO2’s radiative behavior is a component of the whole planetary atmospheric behavior of the Earth-Atmospheric system; greenhouses are irrelevant and a misleading misnomer wrt to the planetary atmosphere effect and CO2’s role as an interactive part of that planetary atmospheric effect. What changes the planetary atmospheric effect when CO2 is added (or if any gas is added) is a change in the energy flows/patterns (both of heat energy and radiative energy) and the boundary conditions within the Earth-Atmospheric system. Energy flow changes and boundary condition changes are what provide the accurate description of the planetary atmospheric effect changes in response to changes in quantities of any of the gases within the Earth-Atmospheric system. Your ‘delay’ description should be modified.
Although anthropogenic CO2 isn’t needed to reasonably explain the climate behavior on all timescales, that explanation does not prima fascia preclude some minor to moderate effect on the Earth-Atmosphere system. I think science is not yet in the developmental state of knowing.
In conclusion=> Concern should be displaced forthwith until better case made about anthropogenic CO2 increase.
I highly recommend the posts in other threads of ‘rgb’ from Duke University as a highly readable explanation of the physics. DISCLAIMITORY NOTE: I do not claim my comment above is in any way reflective of what ‘rgb’ has said . . . my comment is my view only. But I like ‘rgb’ stuff. : )
John
RE highflight56433 (December 7, 2012 at 1:37 pm)
“Maybe there should be some “consensus” that the warming since LIA has released CO2, thus the rise in CO2 is an artifact of the warming oceans plus industrialization. And the warming since LIA allows for additional atmospheric moisture while warming oceans allow for less concentration of soluble CO2. I still see the problems with which came first, the chicken or the egg, in founding the arguments. In the end it’s always the surface heating the atmosphere regardless of the atmospheric composition.”
I know that it is possible to create two or three-stage RC-type filter array that more or less relates sea-surface temperatures to the observed CO2 concentration with optimized selection of the initial conditions in 1880, however this appears to imply an unreasonably high sensitivity to the 0.8 degree net temperature change since then, and with so many arbitrary values involved, (initial conditions and time constants) this formulation seems highly artificial.
I believe it is safe to assume that the CO2 increase is man-made, with petroleum production now on the order of 90 million barrels of oil daily and the net ‘global warming’ effect being limited to about a half a degree C. since 1850. Depending on how much economically recoverable, combustible carbon is left in the ground, we may add another half degree in another hundred and years or so. I think we are reaching the point where we really need to develop a feasible, safe nuclear power technology or prepare for the major population reduction required to make ‘green energy’ practical in the post-carbon era.
Ecologist Paul Colinvaux in his 1978 book _Why Large Fierce Animals are Rare_ explains, among other things, that our current biosphere is limited by a scarcity of atmospheric carbon dioxide. The role of humanity in de-fossilizing sequestered carbon and returning it from geological graveyards into living breathing growing and evolving ecosystems seems under-reported. Nor is carbon the only such resource so redistributed. Thousand year deposits of guano — bats and seagulls removing phosphorous from the ecology and excreting it into useless piles — have been extracted and restored by humans. Vital “trace” minerals are mined, purified, and added to human foodstuff and are then distributed, via our sewers, to the rivers and oceans.
Without humanity, an ever depleting biosphere would gradually but inevitably grind to a halt as unintelligent life converts “resources” into “waste products” at the billion-year-old traditional rate. So-called “natural” processes convert, at best, only a few percent of available solar energy into the stuff of life. Humans, however, cheat. Our solar processes exceed photosynthetic efficiencies. Our fossil fuel processes, recovered the lost carbon of failed species such as dinosaurs, not only support us and our client agricultural species, but restore vital carbon to the air. And our potential to use nuclear fission and fusion offer improvements in energy efficiency that are literally astronomically out of proportion to “nature” and will, ultimately, allow our biosphere to become a bio-torus around the sun, if not a bio-DYSON-sphere.
And as a by-product of the restoration of fossil carbon to our ecosystem, we are beginning expose acreage that has been biologically out-of-production since the last ice age. The ice is getting out of the way and species can emerge from the warm areas — Colinvaux refers to these tropics as “Refugia” — to re-colonize Iceland, Greenland, Siberia and Alaska. Plants, including bristlecone pines, will seed themselves higher into the mountains, above the current frost line. We can expect to see more algae and lichens bloom. The polar bears and caribou have never had conditions so good; and it’s only getting better. Mr Fuller’s graph of how well, quickly, efficiently and consistently humanity is accomplishing this destiny is reason for celebration
AlecM: Meteorology and by inheritance climate science teach that a pyrometer, e.g. a pyrgeometer, measures a real energy flux when in reality it is the assembly of Poynting Vectors in the viewing angle of the instrument.You can easily prove it – have two instruments back to back in zero temperature gradient and net signal is zero. Take one away and it jumps up to the temperature signal.
I get an idea of what you are trying to say. I’d love to see that pyrgeometer experiment on Youtube. Should go viral if it really proofs the GHE from CO2 (or any GHG) can not be measured as advertised.
Millions of years ago when plants first started to appear we had 15 times the amount of CO2 that we have today….but according to the warmers we would start to burn up at twice today’s levels. As the planet greened up instead of being a lifeless dust bowl the warmers are wrong. To compound their misery if high CO2 were able to acidify the oceans then they would long ago ceased to have any life in them.
Why is CO2 not causing the high temps predicted?….First if all it’s ability to create heat diminishes in a logarithmic curve as you stack it up and secondly the climate models put in as much positive feedback as they can whilst apparently ignoring negative feedback.
AGW well and truly up the creek.
blogagog says:
December 7, 2012 at 1:26 am
I have a greenhouse that during growing season is kept at ~1500PPM CO2. Plants love it, but it will give you a pretty bad headache if you stay in there for 2 hrs or more.
This is OT but I will agree with others, I think you may have a C0 issue not a C02 issue. I would check.
Mosher writes “I’ll ask the question again. using whatever wavelengths you want, please show the difference between the sun in the LIA and the sun today?”
And the answer is “completely unknown”. The fact that the components of TSI varied so much (an order of magnitude more than expected) was completely unknown up until recently and we just dont have any data to know its implications in the past.
TSI is overrated because different wavelengths play different roles in the atmosphere. UV is on the whole captured high in the atmosphere as is IR. So if TSI is made up of more UV and/or more IR for a period then warming effect at the earth’s surface changes.
You cant just lump it all into one TSI figure and expect to get meaningful results when the differences you’re looking for at the surface are so small.
We know that CO2 rises after around 800 years following a warm period. So what was happening in 1150? The medieval warm period? So how much of today’s CO2 level is due to that period?
I’m wondering if it will take a few years before we see temperature change…..any thoughts? I am a global warming advocate and just started exploring your site : )
Blogagog:
CO2 levels in a typical New York City Office building is normally around 1,000 ppm. Older buildings can reach 2,000 ppm. i second what others are saying. If your CO2 generator is not operating correctly, you could be giving yourself CO poisoning. Normal background CO should be 9 ppm or less. The limit is 25 ppm for no more than 8 hours.
I used to check CO in homes as part of a check on the combustion systems. Headaches are a common symptom of CO.
@theBuckWheat:
We can get an idea of the optimal temperature via observation of human choice. Given a choice, people abandon Detroit and move to Miami. The leave The Dakotas and Wyoming and head to Santa Fe and Phoenix… (Phoenix has just about a 4 season growing season too, while the Imperial Valley of California clearly can grow things year round as that’s where our winter salads come from…)
So, on the face of it, folks clearly find about 86 F ( 30 C ) just about ideal. So I’d set that as the “goal”. I do note in passing that even at 104 F ( 40 C ) folks in places like Phoenix are quite happy with life (while at 0 F folks get grumpy and you die if outside unprotected too long) and “pool time” is preferred to “ice camping” by most…
So set your goal to 30 – 40 C ( 86 – 104 F ) and I think you’ll be fine.
@Bair Polaire:
OK, it’s still a ‘work in progress’, but I said I’d get something back today:
http://chiefio.wordpress.com/2012/12/08/broken-reasoning-and-hot-air/
First cut, and still needs a load of links and pictures added, plus a few more topic lines, but at least now you know where to watch 😉
“The physics behind the theory of global warming are solid.”
Yes it is, but the theory neglects equally solid physics that mitigates the effect. One can think of dozens of solidly phiysical mitigating factors; saturation, effective sequestration amongst overwhelming water vapor molecules near the surface, greater radiating surface area at higher “effective radiating altitude”, and many others mentioned above. We lack the tools to sort all this out, but we have a box we’ve put lots of CO2 in and not much atmospheric warming is coming out.
pouncer:
“Our fossil fuel processes, recovered the lost carbon of failed species such as dinosaur…”
There was a post by Indur M. Golkany late last year, iirc, praising the merits of “fossil fuels”, attracting around 100 responses or so. Willis Eschenbach had a post on “hydrocarbons” at around the same time, with a similar number of responses.
I did a search on the comments of both, and found that almost every post to Indur’s article used the term “fossil fuels,” with only one poster deferring to the neutral scientific term for the species in the H-C system, i.e., “hydrocarbons.” On the thread about hydrocarbons by Willis, however, “hydrocarbons” was the most popular term used in comments, with the word “fossil” appearing maybe once. The same “group think” phenomena is evident on this page too.
Now it so happens that dead things like dinosaurs and whales and phytoplankton blooms, even if they don’t get eaten (which they do in almost every case), degrade spontaneously, at some rate, according to the law of entropy (not to mention diffusion, dilution, and gravitational displacement of things like fats in water). If you can overcome the logistics problems with accumulation and preservation of vast quantities of biological molecules, you still have an insurmountable thermodynamic constraint imposed on transforming your pile into petroleum, because to push sh*t uphill you need energy:
http://www.pnas.org/content/99/17/10976.long.
But in the sediments of a post modern Earth, reality is a social construct. 😉
Mo says
I am a global warming advocate and just started exploring your site : )
I’m wondering if it will take a few years before we see temperature change…..any thoughts?
Henry @ MO
well, my own data set shows we are cooling. In fact almost all major data sets now indicate that we are cooling since 2002
http://www.woodfortrees.org/plot/hadcrut4gl/from:2002/to:2012/plot/hadcrut4gl/from:2002/to:2012/trend/plot/hadcrut3vgl/from:2002/to:2012/plot/hadcrut3vgl/from:2002/to:2012/trend/plot/rss/from:2002/to:2012/plot/rss/from:2002/to:2012/trend
Looking at my own results, this cooling will continue until around 2035.
http://blogs.24.com/henryp/2012/10/02/best-sine-wave-fit-for-the-drop-in-global-maximum-temperatures/
Spector says
The difference in watts indicates that the net upward irradiance from the Earth would be 3.39 watts per square meter less with 600 PPM CO2 concentration (blue curve) than with 300 PPM (mostly hidden green curve.) These are plots of Terrestrial Irradiance (‘Earthshine’) looking down from 20 km up with the Earth at an assumed identical constant surface temperature in each case.
Using the standard settings for the MODTRAN webtool
Henry says
you cannot “calculate” that which has never been measured first (and put in a balance sheet)
http://wattsupwiththat.com/2012/12/06/a-problem-nearly-one-third-of-co2-emissions-occured-since-1998-and-it-hasnt-warmed/#comment-1167114
to refer people to a calculating program that supposedly is correct (MODTRAN) is misleading them.
Khwarizmi says: December 7, 2012 at 8:58 pm
“….If you can overcome the logistics problems with accumulation and preservation of vast quantities of biological molecules, you still have an insurmountable thermodynamic constraint imposed on transforming your pile into petroleum, because to push sh*t uphill you need energy:
http://www.pnas.org/content/99/17/10976.long….”
That is detailed work and an incredible read. It makes sense given the great quantities and and the great depths at which hydrocarbons are now found. … but am I correct in assuming coal beds (brown coal at least?) can still considered to be sedimentary organic products?
Jeremy Poynton says:
December 7, 2012 at 5:00 am
How many Watts does it take to fry a Mann?
Jeremy, that’s some absolutely capital pun-ishment! ;->
Seems very simple …
CO2 has increased by 30% since 1998.
CO2 is said to be responsible for only 1/3 of the projected warming, the balance of the projected warming being attributed to the effect of the CO2 warming driving an increased level of the major GHG on the planet, atmospheric H20.
It is this missing increase in the level of atmospheric H20 which is responsible for the lack of warming.
And is therefore responsible for exposing a flaw in the whole CAGW theory.
Claiming that the global temperature will increase by the end of the century is obvious nonsense for a very simple reason: nobody knows.
As far as I’m aware the ice cores do not provide any evidence that CO2 can drive temperatures, but it shows clearly that temperatures drive CO2. Greenhouse warming may work in the laboratory but the ice cores show that, for whatever reason, it doesn’t work in the climate system.
So: nobody knows. But I have a horrible feeling that this century may be dominated by global cooling. Now that really is something to worry about….
Chris
markx:
“.. am I correct in assuming coal beds (brown coal at least?) can still considered to be sedimentary organic products?
That’s a good question: I think it might be an assumption worth more research and consideration, rather than an established fact. If some of the organic compounds on the surface and in the atmosphere of Titan would be considered “signs of life if they were on our planet,” how can we be sure that an organic compound here is a sign of life?
Maybe some of our popular ideas about cosmology, biology, geochemistry, evolution, the origin of life, the scope of the biosphere and its relationship to climate, are compromised by an impossible story of petroleum origin that comes from one of the alchemists featured in Extraordinary Popular Delusions. That would be horrible, if true!
Hi Khwarizmi:
Whether oil is truly a fossil fuel (like coal, where the actual literal fossils of leaves can sometimes be found in the shales immediately above and below the seam) or not, the best guess we have is the dinosaurs — large fierce predators and their natural prey — lived in an epoch of much higher atmospheric CO2 concentration. Higher CO2, –> higher photosynthetic efficiencies, –> more life.
Human history has developed in an epoch of relatively scarce carbon dioxide. The past century has seen Gaea restore herself via the services of her minions, Mankind, to the levels she enjoyed in her youth.
That many ignorant and anti-scientific minds argue that the recovery of deep carbon and restoration of that carbon into the biosphere we and all Gaea’s creatures share is some kind of a PROBLEM just boggles my mind. Have these people no education whatever? Or is it merely a matter of perspective?
HenryP says:
December 7, 2012 at 10:23 am
i.e.
the truth is that the physics is not solid and we do not know if the net effect of more CO2 in the atmosphere is that of warming.
============
Correct. The atmospheric lapse rate shows that energy is being lost to space from the atmosphere. This energy loss MUST be due to radiation by GHG to space. It cannot be due to conduction because there is no conduction to space.
You cannot reduce this radiation loss to space by increasing the very same GHG that is causing the energy loss. The only way to reduce radiation loss to space (and thus warm the planet) is to reduce GHG. Increasing the amount of GHG in the atmosphere is like adding a bigger radiator to your car and arguing that since there is more heat coming out of the engine the engine will run hotter.
sunsettommy says:
December 7, 2012 at 6:32 am
Here is a nice chart that are composed of many peer reviewed science papers from the 1950′s to the 1990′s that show it is less than 25 years (The high end) and always less than 15 years in the rest of the chart:
http://globalwarmingskeptics.info/thread-188-post-3118.html#pid3118
Hi Tommy,
Only one problem with that graph: the IPCC (too) long decay time has nothing to do with the residence time of CO2 in the atmosphere of all the other estimates. The residence time is how long it takes in average for a CO2 molecule (whatever its origin) in the atmosphere before it is exchanged with a CO2 molecule of another reservoir. That is the turnover time, which is about 150 GtC / 800 GtC each year (mainly during the seasonal exchanges) or about 20% per year. Thus a residence time of ~5 years.
The time needed to remove some excess CO2 out of the atmosphere above the (temperature dictated) dynamic equilibrium is of a different order: Some 4 GtC as CO2 (whatever its origin) is removed from the atmosphere each year, while we are about 210 GtC (100 ppmv) above equilibrium. That gives an e-fold time of 210 / 4 = 52.5 years or a half life time of roughly 40 years to remove any extra CO2. Way longer than the 5 years residence time, but much shorter than the IPCC, which calculates that at some point saturation of the deep ocean and terrestrial uptakes takes place, where no such saturation is in sight…
highflight56433 says:
December 7, 2012 at 1:37 pm
Maybe there should be some “consensus” that the warming since LIA has released CO2, thus the rise in CO2 is an artifact of the warming oceans plus industrialization.
Simple measurements show that an increase of 1°C of seawater increases the partial pressure of CO2 in the water phase with about 16 microatm. Thus to bring the air-water transfer of CO2 back into dynamic equilibrium, an increase of ~16 ppmv in the atmosphere is sufficient.
That means that the increase in temperature since the Little Ice Age of maximum 1°C should have given an increase of maximum 16 ppmv in the atmosphere, while the measured increase is about 100 ppmv, of which 70 ppmv since we have accurate measurements at Mauna Loa. Further, vegetation reacts in opposite way: higher temperatures means more land available for vegetation, thus more CO2 sequestering and growth (with sufficient moisture). The average result over multi-decades (MWP-LIA) to multi-millennia (glacials – interglacials) is about 8 ppmv/°C.
Thus temperature related: maximum 8 ppmv. Human induced: 92 ppmv.
IanG says:
December 7, 2012 at 5:15 pm
We know that CO2 rises after around 800 years following a warm period. So what was happening in 1150? The medieval warm period? So how much of today’s CO2 level is due to that period?
Not much:
CO2 levels changed ~6 ppmv in the medium resolution (~20 years averaging) ice core of Law Dome for a change of ~0.8°C, with a lag of ~50 years after the sharp drop in temperature:
http://www.ferdinand-engelbeen.be/klimaat/klim_img/law_dome_1000yr.jpg
Thus we may expect the same CO2 levels as in the MWP, which were 280-285 ppmv. But we are already over 100 ppmv above that level…
If I am ever up in some high remote area, near the upper inhabitable edge of our atmosphere on a mountain,
and I’m stranded, with just three 5mm thick, wool blankets, to keep me warm, in a cabin, the furnace is broken on,
sleeping,
and there’s a fire,
If I run outside to find myself facing a problem: narrow ledge facing the stars in front of me and to my back, the raging inferno of the cabin-
When Emergency Services arrive, I’ll tell them that
“I stood there looking at those freezing stars in space,
but on the other side,
to my back,
I had that raging fire;
which was burning me. But I had three, 5mm thick, furniture mover’s pads I had brought with me to wrap some sensitive equipment up in.
So, I wrapped those around me, using them as insulating blankets:
and once I had those three wrapped around me, there was less radiation getting through,
so the surface of my skin and clothes, were warmer.
When the State Trooper says “You mean – cooler ?”
I’ll look at him like –
“You must not believe in Global Warming, you
silly arguing,
UNSCIENTIFIC
trash,
so I’ll EXPLAIN this, ONE MORE TIME! This is ALL AGREED by SCIENTISTS from NASA!
You’re SO unSCienTIFIC, I feel like I’m taking CRAZY PILLS having to EXPLAIN THIS to YOU!!”
” I CLEARLY SAID: “At FIRST I was standing on that freezing ledge, with the SURFACE of my BACK on FIRE,
and FREEZING on my FRONT.
I wrapped a 5mm thick, woolen emergency blanket around me,
which blocked 10% of the radiation from the fire:
leaving the surface of my body, WARMER.
My clothes didn’t go out completely, so I added ANOTHER 5mm blanket to the first one, blocking 20% of the radiation from the fire,
leaving the SURFACE of my BODY
WARMER!!!!
The fire was STILL causing me some DISCOMFORT
so I put yet a THIRD 5mm blanket around me,
which blocked a total of 30% of the incoming radiation,
making me YET WARMER.
WTF about THIS,
do YOU,
NOT UNDERSTAND,
OFFICER?!?!”
How do you Magic Gassers think that’s gonna shake out – is he going to:
(1) THANK me for clearing up to him that blocking fire from reaching an object in frigid space is WARMING it
(2) Whip my #$$, and take me in for observation at the mental hospital,
until I stop insisting that the blankets I used to block 30% of the heat from a fire which had my clothes smoldering,
“made me warmer and warmer, until my clothes stopped smoldering.”
You say.
henry@ferdberple
Good comment. thanks
henry@ferdinand meeus engelbeen
the relationship between increasing CO2 versus increasing temps (without the presence of man) has been well established.
At the top of my hat, how you work this out to not being about 16 ppms per degree K seems implausible in terms of the actual records for CO2 versus temps. (I will have to look at those graphs again, but we know that CO2 was as high as 7000 ppm at much earlier stages of earth)
Apart from the normal increase in CO2 due to temp. rise of the oceans we must also consider more CO2 release from below the seabed (due to normal volcanic activity ) as a result of a temp. increase of sea water. (atlantic/pacific rifs)
I am also a bit puzzled as to how you explain that earth is cooling whilst CO2 is rising?
http://wattsupwiththat.com/2012/12/06/a-problem-nearly-one-third-of-co2-emissions-occured-since-1998-and-it-hasnt-warmed/#comment-1167630
I would also question how you came to a probable result (of ca. 8 ppm) from the sequestration of CO2 due to the increase in vegetation noted over the past 4 or 5 decades? (report, results?)
Finally, are you still saying that the net effect of more CO2 in the atmosphere causes more warming, if so where is your balance sheet?
http://blogs.24.com/henryp/2011/08/11/the-greenhouse-effect-and-the-principle-of-re-radiation-11-Aug-2011/
btw I am in Holland soon. please make it a bit warmer there for me? thanks
This does not ‘disprove’ global warming–at all.
—
If that doesn’t do it, then you fail to mention what would. Falsifiability is a tenet of the scientific method. Yet you fail to provide it. In fact, you go against the facts and proclaim that some belief you hold must be true. At the very least, you should be open to the proposition that when faced with an unknown future, that multiple causes may be true. But you do no such thing. To you, AGW is the only possible outcome.
This brings me to where you state that the theory of global warming are sound. No, it is the theory of greenhouse gases in a closed system that is sound. When it comes to global warming, there are many greenhouses gases and other effects that are still uncertain as to their amount, effect and overall interaction between each other. You state that CO2 drives water vapour. That’s ridiculous. Larger effects always drive the smaller ones if they interact, never the other way around. It’s like saying that a moth can change the direction of traffic. It is ridiculous.
I’ve said it before. Climate scientists need to understand natural variations, especially the cooling parts, before announcing doomsday on something they do not comprehend. The current theory of global warming is not sound at all. It based on the lack of imagination and knowledge of climate scientists. I wish I could make that up, but it’s entirely true. They’re using the Sherlock Holmes theory that if they eliminate all other causes, then the only thing that remains (human effects) must be the cause, no matter how unlikely it may seem. This is all based on computer models and none of them can explain natural cooling periods. So forgive me if I don’t put too much faith in their models. I’m a programmer. Saying I’m an expert in computer models is like saying a mechanic is an expert in nuts and bolts. GIGO trumps all models.
Global warming theory cannot trump GIGO (garbage in, garbage out). GIGO is a law that is higher than all others.
I’m not saying CO2 doesn’t contribute to warming or that humans don’t produce any. I’m saying that the evidence is clearly lacking to support your ideas and all you’re going on is faith.
What happens if you factor in SO2 emissions and natural ocean cycles?
E.M.Smith says @Bair Polaire:
OK, it’s still a ‘work in progress’, but I said I’d get something back today:
http://chiefio.wordpress.com/2012/12/08/broken-reasoning-and-hot-air/
Broken Reasoning And Hot Air
Great post from the Chiefio, inspired from this discussion here!
He has pieced it all together – a parade of climate science misconceptions: oversimplified models that are so reduced that they become just wrong, the misuse of temperature as a proxy for heat, the mindless averaging away of non-linear properties and effects, the ongoing neglect of (climate) history and the persistent unwillingness to think a little further than just “back radiation”.
This line should be circled widely: “What’s broken is the idea that heat “builds up”, when in reality it “travels up”…”
Thanks, everybody!
MrX says:
December 8, 2012 at 12:39 pm
“They’re using the Sherlock Holmes theory that if they eliminate all other causes, then the only thing that remains (human effects) must be the cause, no matter how unlikely it may seem.”
Of course, this is a gross logical fallacy in general. One has to stipulate first that one has all possibilities covered. Only then can process of elimination produce a conclusive result.
A better Sherlock quote appropriate to the case at hand is:
The AGW crowd are working hard at twisting the data to suit theories, but the case is still falling apart for them.
HenryP says:
December 8, 2012 at 12:34 pm
the relationship between increasing CO2 versus increasing temps (without the presence of man) has been well established.
Yes, 4-5 /°C on short term (2-3 years) to 8 ppmv/°C over (very) long term:
http://www.ferdinand-engelbeen.be/klimaat/klim_img/Vostok_trends.gif
Geological history shows much higher CO2 levels, but most of that is buried in carbonate rocks, unavailable for release back into the atmosphere. The 8 ppmv/°C is rather fixed over the past 800 kyear, but doesn’t hold anymore for the past 150 years, when humans started to emit lots of CO2.
Thus the increase of maximum 1°C since the LIA did give a maximum of 8 ppmv extra in the atmosphere. The rest of the 100+ increase since the start of the industrial revolution is from human origin. See the ice cores record:
http://www.ferdinand-engelbeen.be/klimaat/klim_img/antarctic_cores_001kyr_large.jpg
Some extra CO2 from seabed volcanoes comes into the bulk of the deep oceans. If the rates are similar to the land volcanoes, then that hardly influences the deep ocean carbon content and certainly not on short term. Further, there is no measurable temperature rise of deep ocean seawater temperature and hardly any at the surface.
“I have a screen of gases , you can hang in the atmosphere and it blocks sunlight coming in or out.”
“Really?”
“Yep. First it blocks about half the infrared from the sun, from ever getting to earth, warming it.
Then it blocks whatever makes it to earth trying to get away from earth.”
“Wow. What do you call it when it does that?”
“Heating.”
“…Wow..”
“Yeah… and then some of the gas goes from a liquid/solid state to gas if it contacts heat and wafts up to the upper atmosphere, dumps the heat into space becoming a solid again, to fall back down and do this again and again and again.”
“Wow, that’s some gas class. What do you call it when your gas does that ‘evaporating/rising/condensing/dumping heat directly into space,
atmospheric air-pressures phase-change refrigerant thing it does?
“Heating.”
“Nice.”
Yeah… we have some gases that block the high energy blue light too. That mechanism of blocking blue light from ever heating the earth has it’s own name.”
“Oh?”
“Yeah.”
“What’s it called?”
“Heating.”
HenryP says:
December 8, 2012 at 12:34 pm
I forgot to add a comment on the effect of the increase in CO2 on temperature. Here my opinion:
“In my opinion even a doubling would have little impact, as clouds are a negative feedback (while all current GCM’s include clouds as a positive feedback!), thus a doubling of CO2 would have only moderate (and thus globally positive) effects.”
~ Ferdinand Englebeen, WUWT, 11-25-10
But be carefull: even if there is a (temporarely – PDO-related?) cooling now, that doesn’t imply that CO2 has no effect at all: a small impact can be masked by a more important natural variability…
You think the Earth is going to heat up the better part of 2C based on 3000 Quads of energy consumption pa? The sun exposes the Earth to 173 PW, or 1.73e17 W. 3000 Quads/yr is 3000*1e18/365/24/3600~=1e14 W ~= 0.nothing. So a one-one thousandth increase in the amount of energy entering the Earth system is worth a 2C rise?
Yeah, no.
The rest of the piece is interesting but doesn’t actually say very much. Without any statement of the time constants of the system the fact that CO2 has increased by a third in the last 15yrs doesn’t actually mean anything. It’s really a gut feel piece.
My understanding is there is no historical evidence that CO2 ever contributed to climate changes. yet we see that CO2 rose between icing events, after the warming. Thus, CO2 is an artifact of warming.
What did I tell you
says
Yeah… we have some gases that block the high energy blue light too. That mechanism of blocking blue light from ever heating the earth has it’s own name.”
“Oh?”
“Yeah.”
“What’s it called?”
“Heating.”
Henry says
ehh, I think that is wrong?
Actually the “blocking” is back radiation <1 um (high energy that heats the oceans) from ozone and others that absorb in the 0-1 um region, that is sent back in a radius of 180 degrees in the direction where the radiation came from. If there is more F-UV and/or E-UV coming in, due to whatever reason, you get more ozone and HxOx and NxOx being produced/manufactured up there, from its original components. As a result you get more cooling……
hence we are currently cooling whilst ozone and others are increasing.
http://wattsupwiththat.com/2012/12/06/a-problem-nearly-one-third-of-co2-emissions-occured-since-1998-and-it-hasnt-warmed/#comment-1167630
henry@ferdinand meeus
if I look at these graphs it seems more or lees like 10 ppm per degree C, on average.
http://joannenova.com.au/global-warming-2/ice-core-graph/
Nevertheless, it is less that I had expected. However, since I don’t know the method and calibration procedures I remain a bit skeptical. What were the temps. in the Cambrium when we had the CO2 in the thousands?
Either way. we are cooling, currently at the highest rate,
http://blogs.24.com/henryp/2012/10/02/best-sine-wave-fit-for-the-drop-in-global-maximum-temperatures/
so the idea that CO2 has something to do with climate will be put to rest soon.
Earth energy stores are a bit empty now, so I predict that from now average temps. will drop as high as maxima are falling. That would be about ca. -0.035 degree C per annum for the next 8 years or so. Cooling will only end in ca. 2036.
Bair Polaire says:
December 7, 2012 at 4:36 am
….Can you recommend links to what exactly happens at the surface of the sea (direct evaporation, not higher temperatures? maybe both?) and to how exactly the earth is cooling by conduction, convection, evaporation and eventually radiation. Anybody? It should be easy to understand, I want to show it to a friend at the UN. Thanks a lot…..
_____________________________________
For what it is worth I use these graphs:
This is the real killer since the effect of CO2 is multiplied threefold by triggering more H2O vapor per IPCC wisdom:
Global Relative Humidity graph
NOAA: Global Atmosperic Specific Humidity
The Sun – Ocean connection
Atmospheric Transmission of incoming solar radiation
Real graph of relative radiative Energy of the Sun vs Earth
Incoming solar graph
Incoming solar vs ocean depth
Multiple graphs, Sun & Cosmic rays
Temp change during solar eclipse
Movement of Köppen Climate boundaries in US Mid West
Britannica: Köppen climate classification
This is the little goody that has been wiped off the internet thanks to Judithgate.
Sun most active in 11,000 yrs
YOu need to also read Judithgate about how the IPCC ignored the real experts on solar insolation. Comparision of lean graph vs ACRIM composite graph and Official TSI composite graph and Actual satellite results graph.
Grand maxima of solar activity
Solar activity reaches new high
Solar irradiance 1611 to 2001 ″ is by Judith Lean – from WUWT
WUWT article on NASA’s Solar Radiation & Climate Experiment (SORCE) mission.
SORCE’s Solar Spectral Surprise – UV declined, TSI constant
NASA paper: Global increase in UV irradiance during the past 30 years (1979–2008) estimated from satellite data
In other words the IPCC (and Svalgaard) keep saying the sun is constant and therefore can be disregarded but NASA scientists keep coming up with how it actually varies so the IPCC sweeps it all under the rug. Note that the highly variable part of the sun, vis-uv wavelengths, are the same wavelengths that are absorbed by the oceans.
You then need to watch Bob Tissdale’s Vids
“The Natural Warming of the Global Oceans”
Part I
Part II
AndyG55 says:
December 6, 2012 at 10:07 pm
“This chart shows the global average temperature change from a ‘normal’ 30-year range from 1950-1980. It comes from the Goddard Institute for Space Studies, led by scientist James Hansen.”
It does NOT show anything of the sort…..
______________________________________
The definition of a ‘normal’ 30-year range from 1950-1980. Is telling too.
At this point I rather trust what plants are telling us not Hansen.
If you look at the Köppen climate classification vegetation-based empirical climate classification system you find this set of graphs for the American Midwest.
On the bottom graph, a close up reveals the cold outlier is 1970 and the next coldest times are 1910, 1960 and 1950/1940. Gee fancy that, Hansen picked the three consecutive decades that had the coldest temperatures as his ‘normal’ He could have easily have picked 1920,1930 and 1940 which are in the middle of the pack and are therefore more representative of modern ‘normal’ according to plants.
theBuckWheat says:
December 7, 2012 at 4:54 am
I am still waiting for some credible statement as to what the optimum temperature should be….
>>>>>>>>>>>>>>>>>>>>>>>>>>>>>>>
Easy answer: Warmer not colder.
1. Warmer means less storms
2. Warmer means wetter (in general more evaporation)
3. Warmer means increasing the growing season so the northern land masses are more productive.
Another Köppen,-Geiger map of the world. WIKI on classification scheme (more info )
4. Warmer means less political unrest. E.M.Smith (ChiefIO) goes into detail about that. link
And last but not least the warm phases in the climate are getting less warm – NOT GOOD
Greenland Ice Core and NH Summer Energy: The Leading Indicator and the length of the Arctic Melt season has started to DECREASE while fall snow cover in the NH Increases.
The only down side to warmer is melting of glaciers and sea level rise but that isn’t happening.
graph
India – Record snowfall revives 2,000 glaciers and all seven glaciers on California’s Mount Shasta are growing.
What is the equilibrium level of CO2?
It is about 270 ppm (or at least it has been over the last 24 million years since C4 grasses evolved [between 32 Mya and 24 Mya] which increased vegetative Carbon cycling and pulled half of the CO2 out of the atmosphere – in fact, there is two distinct down-steps at these two periods).
http://s13.postimage.org/pvmtijcw7/CO2_Last_40_Mys.png
Is CO2 correlated with Temperature?
Only in the ice ages (with CO2 lagging behind temperatures by 1,000 years at a rate of 14 ppm per 1.0C temperature change which is probably about half each related to vegetation Carbon cycling and half due to Ocean uptakes/discharge).
http://s12.postimage.org/gqh2y043x/Temp_vs_CO2_Last_40_Mys.png
flyfisher says:
December 7, 2012 at 9:46 am
What strikes me about the trend of the CO2 graph is that it is linear and not logarithmic…. Can anyone help me out with what I’m missing here?
>>>>>>>>>>>>>>>>>>>>>>>>>>>>>>>>>>>>>>>>
In a Nutshell: No one considers the fact that the CO2 data is just as manipulated as the temperature data. Those who are measuring CO2 elsewhere learned at Mauna Loa BTW.
…You say there are independent measurements. Once I had managed to find a link and publications for those measurements. The were all Keeling and another fellow, possibly the graduate student going through the loops. I do not call that independent….
Remember CO2 is released by the Mauna Loa and the adjacent Kilauea volcanoes.
From Mauna Loa:
When Zbigniew Jaworowski started asking pointy little questions he was denied funding and fired
Links:
Fred H. Haynie, a retired EPA research scientist, has devoted the past four years to a study of global climate change, and in particular the relationship to CO2… One reason I retired early from research at EPA years ago was good science was beginning to be sidetracked for political purposes. In this case EPA has been completely derailed. http://www.kidswincom.net/CO2OLR.pdf
Questioning the CO2 Ice Hockey Stick
WUWT: http://wattsupwiththat.com/2010/12/26/co2-ice-cores-vs-plant-stomata/
Comment on CO2: http://wattsupwiththat.com/2010/06/04/under-the-volcano-over-the-volcano/#comment-403545
and this
New Paper With Stunning Admission By Climate Alarmist Scientists: Actual CO2 Emissions Are Unknown; Please Send Money!
And here comes Englebeen to defend the sacred CO2 data…..
So any carbon tax needs to retroactive to the dinosaurs!
Gail Combs says:
Gail, thanks for all your well thought out comments that include links to support your “writings”
The following argument**, which is ubiquitously used by those extremely concerned about climate and those lukewarmingly concerned about climate, is unfixable in principle; it is reasonably beyond repair:
So, dear WUWTers, have fun with it during the holidays ahead.
** In another future post a case can be discussed that it is not an argument (reasoning) at all, but instead it could be viewed as just a convenient collage of rhetorically useful statements.
John
John,
You forgot to add the part which says:
Pretend that alternative non carbon, renewable energies will be plentiful, cheap, uninterruptable, and are are a viable subsitute for carbon based fuels that currently power our industries, transportation and electricity needs. The economies of the world will not be impacted and our homes warmer. There will be no Hurricanes, tornadoes, earthquakes, or wars.
– – – – – – –
Catcracking,
Hey, thanks for the additional thought to be incorporated into the ‘argument’.
We can temporarily stick your idea in the current ‘argument’s’ statement ‘g’. [which is: “g. End of argument**, but the beginning of the unfortunate precedent it sets in other areas like biodiversity . . . or any cause.”] So, that way your item can be considered a consequent from the whole of the ‘argument’. Right?
John
John, exactly, the irrational belief in alternative energy would not be needed without the fabrications you site.
Gail Combs says:
December 9, 2012 at 8:26 am
Gail, we have been there many times.
If you don’t like the “cleaning” procedure used at Mauna Loa (after all, we are interested in “background” CO2 data, not what a local volcano or vegetation emits or absorbs), simply plot the raw data, they give you exact the same yearly average and trend within 0.1 ppmv. Or if you think that the data are skewed by the local volcano or vegetation, use the data from the South Pole, no volcano or vegetation in the first 1,500 km. Desite that, exact the same trend, but with a lag of about a year, compared to Mauna Loa:
http://www.ferdinand-engelbeen.be/klimaat/klim_img/co2_trends_1995_2004.jpg
And let Jaworowsky rest in peace, together with his ideas about the ice cores CO2. If you can explain me how CO2 can migrate from 180 ppmv inside the ice core towards 395 ppmv outside the ice core, then I may start to believe him. And if you can show me that there is no difference between the age of the ice layers and the age of the enclosed air bubbles, then you may have convinced me completely…
Once again Steven Mosher (12/6 21:00) proves to others the fuzziness of his thinking.
It takes ENERGY to melt ice: 334 kJ/kg ice (Enthalpy of Fusion of Ice,
plus 2.1 kJ/kg/deg C to raise its temperature to the melting point. 1 kJ = 1000 Joules.
Watts are POWER (Re: kadaka above), energy per time: 1 Watt = 1 Joule/sec.
Watts/m^2 is a power surface density.
What Joules are to distance, Watts are to velocity.
So asking how “many excess watts does it take to melt Greenland” makes no more sense than to ask “what excess air speed do I need to get to the South Pole?” How long do you have? Where are you now? What is your heading? What is the velocity of the wind over the ground and how much does it gust and vary by day, season, and year?
A different question that HAS an answer is: How LONG will it take an “excess” 3.4 Watts/m^2 to melt a m^2 of ice cap 1 km think? Actually we can estimate the MINIMUM time to do this, assuming all heat goes into melt, perfect thermal insulation, iso-thermal conditions, no night and day, no sublimation, no evaporation, no precipitation:
Per m^2 of ice, 1 km thick, (2 to 3 sig. figs.)
Volumne of Ice = 1000 m^3
Density of ice = 920 kg/m^2
Mass of Ice = 920000 kg
Enthalpy of Fusion (ice) = 334000 J/kg
Energy required to melt = 3.07E+11 J
convert to Watt-sec = 1 (J/sec)/watt = J/watt-sec
Energy required to melt = 3.07E+11 watt-sec
sec/year = 3.16E+07 sec/year
Energy required to melt = 9740 watt-years
With: “Excess” 3.4 Watts/m^2 = 3.4 watts/m2
Minimum Time required to melt = 2860 years
A maximum melt rate of about a foot per year, which will not keep up with the precipitation we ignored along with a lot of other things.
@Johanus Dec 7, 06:36: +1
@Mostly Harmless 04:24: +1
@markx, 04:26: +1
@Spector 12:53: +1
@Gail Combs Dec 9, (05:48, 06:08, 06:55, 08:26) +2 for the lot.
Tom Fuller, in his main post, shows Figure1 ‘The Keeling curve Image: Scripps Institute’; which is all of the Mauna Loa Observatory’s Monthly Average Carbon Dioxide Concentration ‘data’ from from its beginning of measurements just before 1960 .
First, it looks like the vertical axis is somewhat inaccurately labeled as CO2 Concentration (ppm). The correct axis label should be CO2 Mixing Ratio (ppmv). I am surprised Scripps does not have it labeled accurately and resorts to an insufficiently specific labeling.
Second, the chart has little explanatory power about yearly short variations over ~6 decades of CO2 versus GMT without analysis of details all the specific annual variations of that figure which would show a strong relationship with the detailed annual variation of the anomalous GMT. Namely, temperature causes CO2 variation over very short times scales. Natural variations in temp can explain the dominate change in CO2. Attribution of a significant part of the CO2 changes to anthropogenic CO2 is inconsistent with the details of the CO2 data. NOTE: This is my interpretation of Murray L. Salby, “Physics of the Atmosphere and Climate” (January 2012, Cambridge University Press) section 1.6.2 figure 1.43.
John
For me, the temperature difference between the earths surface and the stratosphere drives the massive convection cycles that constitute the troposphere. This temperature difference is more or less a constant; it varies very little with the amount of heat it transfers. So the only possibility of warming is if the stratosphere warms. This region of the atmosphere has the curious property that the more co2, the more it cools, as it tends to radiate more heat to outer space. So while adding co2 should not produce cooling, there are powerful negative feedback mechanisms that ameliorate any small increases.
pouncer says:
December 7, 2012 at 3:44 pm
……The role of humanity in de-fossilizing sequestered carbon and returning it from geological graveyards into living breathing growing and evolving ecosystems seems under-reported. Nor is carbon the only such resource so redistributed. Thousand year deposits of guano — bats and seagulls removing phosphorous from the ecology and excreting it into useless piles — have been extracted and restored by humans. Vital “trace” minerals are mined, purified, and added to human foodstuff and are then distributed, via our sewers, to the rivers and oceans…..
___________________________________
Best comment on the whole mess that I have seen so far. Thank you.
C3 plants:
So it looks like an evolutionary transition from C3 to C4 was taking place because of carbon dioxide starvation.
RE: HenryP says: (December 7, 2012 at 10:14 pm )
[Spector says
The difference in watts indicates that the net upward irradiance from the Earth would be 3.39 watts per square meter less with 600 PPM CO2 concentration (blue curve) than with 300 PPM (mostly hidden green curve.) These are plots of Terrestrial Irradiance (‘Earthshine’) looking down from 20 km up with the Earth at an assumed identical constant surface temperature in each case.
Using the standard settings for the MODTRAN webtool]
“Henry says
you cannot “calculate” that which has never been measured first (and put in a balance sheet)”
I think we do this all the time. The first trip to the moon was based on calculations for an event that had never happened before. I believe the MODTRAN code is based on the detailed HITRAN spectrum line absorption data base and an assumed atmosphere. I usually qualify these as raw measurements that exclude feedback effects.
If you assume that the rapid temperature increase from 1965 to 1995 was *ALL* do to the CO2 increase, then I believe you do indeed get a much higher sensitivity than MODTRAN predicts. Perhaps so much higher than the raw sensitivity that it is easy to understand why there is talk catastrophic thermal runaway due to positive feedback in the atmosphere.
I believe MODTRAN has been validated, at least, with near current atmospheric conditions, as a predictive tool to estimate atmospheric infrared radiation levels to calibrate and design Air Force weapon systems.
The UK Climate Research Unit, HadCrut3 data indicates over the past 130 years, there has been only about 0.8 degrees C total total increase in average global temperature. MODTRAN results suggest that CO2 may be responsible for a relatively harmless 0.5 deg C. Based on the known temperature fluctuations of past history, I do not think it is reasonable to attribute all of observed temperature increases to CO2 even though these are ‘measured’ data.
The MODTRAN spectrum plot shows two interesting things. First, the effect of CO2 is limited to a relatively narrow region at the center of the terrestrial emission band and Second, there are no ‘holes’ in the radiation pattern due to water vapor. This suggests that the continual process of condensing accelerated convection makes water vapor a leaky greenhouse gas. There is very little water vapor left in the atmosphere above the 20 km sensor level.
REF: Validating MODTRAN for Climate Studies
By P Gosselin on 11. August 2012
By Ed Caryl
http://notrickszone.com/2012/08/11/validating-modtran-for-climate-studies/.
Spector said
I believe MODTRAN has been validated, at least, with near current atmospheric conditions, as a predictive tool to estimate atmospheric infrared radiation levels to calibrate and design Air Force weapon systems.
Henry says
yes, I was saying that that atmospheric infra red is only half the story. What is relevant there is the spectrum of the molecule from 5-15 um, which is the radiation coming up from earth 210-310 K (24/7)
So now what about the 0-5 um part of the spectrum where there are places in the molecule with absorption? They back radiate the sun’s incoming 5525K (12hrs/day)
I was asking for the balance sheet?
I don’t think you understand the behavior of a gas in the atmosphere yet.
Namely, in the case of CO2,
there is also radiative cooling, due to absorption of the molecule in the UV (which is why we can identify it on other planets!), in 1-2 um, and 4-5 um bands. I am saying that the cooling due to back radiation in these regions of the molecule that goes on 12 hours per day might be just as much as the warming (or:delay in cooling) due to the back radiation coming from earth 14-16 um, that goes on 24/7. So WHERE is the balance sheet that would show us that the physics is solid?
(never mind the whole problem that water vapor also absorbs in the 14-16 um and that there are also HxOx compounds lying on top of the atmosphere, just like ozone)
On top of that we have an increase in vegetation over the past 50 years which has been considerable.
Plants and trees need both warmth and CO2 to grow. Or did you ever see a tree grow where it is very cold? So how much biological cooling was caused by the CO2 due to the increase in vegetation over the past 50 years?
.
You see what the problem is? You cannot say: if there is an increase in CO2 it must be getting warmer (even though that increase in warming might be very small) until you have first proven it by doing some physical testing. The closed box experiments do not tell you how much radiative cooling is caused by the increase in CO2.
You cannot “calculate” that which has never been measured. (which is what they have been doing by applying as correct the inverse relationship which might not be causal. i.e. smoking causes cancer but cancer does not cause smoking.
For a better understanding of the physics, I advise you all to read this:
http://blogs.24.com/henryp/2011/08/11/the-greenhouse-effect-and-the-principle-of-re-radiation-11-aug-2011/
[“biological cooling” … or “biogical heating” (caused by increased plant growth increasing albedo) ? Mod]
RE: HenryP: (December 11, 2012 at 4:38 am )
.
“Henry says
“yes, I was saying that that atmospheric infra red is only half the story”
For thermal energy *leaving* the earth, it is almost the whole story, given the current temperature of the planet. What MODTRAN calculates is electromagnetic radiation in the atmosphere either going up or down over a wave-number spectrum range of 100 cycles/cm (100 microns) to 1500 cycles/cm (6.67 microns.) For a state of local equilibrium, the average radiation leaving the Earth (W/m2) must be the same as that being absorbed by the planet from the sun, an assumed constant (W/m2) level.
The intent here is to estimate the raw effect that changing the chemical composition of the atmosphere has on heat (W/m2) escaping given a fixed surface temperature, or on the value surface temperature given a fixed amount of heat leaving the atmosphere required for local equilibrium.
MODTRAN is not a climate prediction program; it is an isolated effect estimator. Cause and effect can become confused in measurements made, where all that is really known is that both things happened at the same time or in the same data set. We do know the absorption-emission spectra of the greenhouse gases and can calculate their effect on radiation leaving the atmosphere.
Henry@mod
(more) UV (=energy) + (more) CO2 + photosynthesis => (more) trees + plants + (more) food + drinks
The extra greenery in the past 50 years extracts energy (warmth) from the system.
Spector says
We do know the absorption-emission spectra of the greenhouse gases and can calculate their effect on radiation leaving the atmosphere.
henry says
if you want to continue this argument, without understanding what the argument is about, be my guest. I am not only interested in the effect it has on leaving earth. I am also interested to know how much cooling it causes?
For comprehensive proof that CO2 is (also) cooling the atmosphere by re-radiating sunshine, see here:
http://www.iop.org/EJ/article/0004-637X/644/1/551/64090.web.pdf?request-id=76e1a830-4451-4c80-aa58-4728c1d646ec
They measured this re-radiation from CO2 as it bounced back to earth from the moon. So the direction was sun-earth (day)-moon(unlit by sun) -earth (night). Follow the green line in fig. 6, bottom. Note that it already starts at 1.2 um, then one peak at 1.4 um, then various peaks at 1.6 um and 3 big peaks at 2 um. You can see that it all comes back to us via the moon in fig. 6 top & fig. 7. Note that even methane cools the atmosphere by re-radiating in the 2.2 to 2.4 um range.
So, my proposal is, try first to understand how a gas behaves in the atmosphere.
http://blogs.24.com/henryp/2011/08/11/the-greenhouse-effect-and-the-principle-of-re-radiation-11-aug-2011/
If you want to present me with that balance sheet, you have to get the dimensions right.
(W/m2/m3? time? concentration change of the CO2? etc, etc)
Only “Watts Up With That?” would accept submissions/publications from anonymous sources (“Guest Blogger”?). Who wrote this?
And the commentors . . . that link us to THEE alarmist AGW gatekeepers, wikitrash, spare me! Use another reference please.
IanG (says @ December 7, 2012 at 5:15 pm) : Great question. I thought the delay was 600 years.
[Reply: The Guest Blogger is Tom Fuller, a regular contributor here. His name appears at the top of the article. — mod.]
RE: HenryP: (December 11, 2012 at 9:56 am)
“[Spector says
[We do know the absorption-emission spectra of the greenhouse gases and can calculate their effect on radiation leaving the atmosphere.]
“henry says
“if you want to continue this argument, without understanding what the argument is about, be my guest. I am not only interested in the effect it has on leaving earth. I am also interested to know how much cooling it causes?
Most cooling due to radiation emitted from CO2 occurs above the 20 km level, which is the standard level used to measure ‘Radiative Forcing’ of the troposphere–the graph that I referenced. As the CO2 absorption and emission lines are all at the same wavelengths, CO2 is a very efficient absorber of its own emissions.
A MODTRAN plot made at the default 70 km level does show a tall, thin spike in the middle of the CO2 band that is due to radiation from the mesosphere. Only at that altitude, is there so little CO2 left in the atmosphere that CO2 can have a cooling effect. If you look at a temperature profile of the atmosphere, you first see a cooling trend with altitude that is enabled by radiation from water vapor, then from the tropopause through the stratopause there is a warming trend and above the stratopause, cooling with increased altitude begins again, as CO2 is now so thin that it will not reabsorb its own emissions. Neglecting this upper region may cause a ten percent upside error on the MODTRAN estimates using the 20 km sensor level.
I have referenced this Wikipedia Radiative Forcing plot, as it is the only one I have found that clearly shows how little, doubling the CO2 content in the atmosphere would affect thermal infrared radiation leaving the Earth’s atmosphere.
The 350 Organization would have us believe that man has added far too much CO2 to the atmosphere already, and actually *doubling* the CO2 content would forever alter the world we know. These fears are easy to understand by those who see CO2 as a thickening gray cloud getting progressively darker as more CO2 is added, until it eventually blocks all cooling radiation from the Earth. That was the model I saw Bill Nye present in a global warming debate with Joe Bastardi.
MODTRAN shows that the effect of CO2 is limited to a narrow band that is already as dark as it can ever get, except for those narrow regions on the fringes of the band. As far as stopping the flow of heat from the atmosphere, CO2 is not like an ever-rising dam, as most people believe, it is more like a one-foot wide tree in the middle of a ten-foot wide stream. Perhaps the ‘tree’ also has a small crack in the middle due to mesospheric CO2 radiation.
REF: http://en.wikipedia.org/wiki/Mesosphere
“Within the mesosphere, temperature decreases with increasing altitude. This is due to decreasing solar heating and increasing cooling by CO2 radiative emission. The top of the mesosphere, called the mesopause, is the coldest part of Earth’s atmosphere.”
Just for further reference, here is a picture I found of a MODTRAN plot at the default 70 km altitude showing the spike due to radiation from the mesosphere. These plots show most cooling occurs at wavelengths longer than 6.667 microns, (wavenumber:1500 cycles/cm) with the majority being between 8.333 microns (1200 cycles/cm) and 40 microns. (250 cycles/cm) It is important to note that the CO2 ‘hole’ does not go down to zero energy flow, but drops to a value that corresponds to a temperature of 220 K from a peak that corresponds to a temperature of 280 K, this indicates, roughly, a 60 percent reduction in energy flow at the base. Increasing CO2 does not appear to reduce this threshold, but it only, ever so slightly, widens the gap on a logarithmic basis.
The other small gap off to the right at 1100 cycles/cm is due to ozone.
http://calvin-m-wolff.com/rad.02161212.gif
Unless it is in solid crystal form, CO2 only absorbs or emits photons. While CO2 may absorb shorter wavelength photons, I believe emission is most likely to occur in the base 15 micron band. Most solar energy is received at wavelengths shorter than one micron in the optical band where CO2 is transparent.
The website for the image is:
USING MODTRAN
http://calvin-m-wolff.com/Using_Modtran.html
Spector says
Most cooling due to radiation emitted from CO2 occurs above the 20 km level,
Henry says
Clearly, you still don’t understand how a gas behaves in the atmosphere;
here is another graph that shows. The red is the incoming solar arriving at sea level on a cloudless day
http://en.wikipedia.org/wiki/File:Solar_Spectrum.png
the yellow marked areas is all that is being “absorbed” by the gases in the atmosphere before it reaches earth…..
Unfortunately a gas has little mass. So it is impossible for the air to “absorb” (as heat) 25-30 % of incoming solar. I have been at length to explain, the term “absorption” is a bit unfortunate here. As I explained in my blog
http://blogs.24.com/henryp/2011/08/11/the-greenhouse-effect-and-the-principle-of-re-radiation-11-aug-2011
the yellow marked amount of radiation of that solar spectrum is what is being back radiated, mostly by the O3, H2O, O2, HxOx and NxOx, and lastly also by CO2. Study the spectra of what we measured coming back from the moon? .
So this back radiation (“cooling”), particularly of the CO2, (seeing that it is evenly distributed in the air) goes on from the bottom of the atmosphere to the top of the atmosphere…..surely you must be able to understand that?
I don’t know how to give a better explanation of what happens with gases in the atmosphere than what I have tried to give here:
http://blogs.24.com/henryp/2011/08/11/the-greenhouse-effect-and-the-principle-of-re-radiation-11-aug-2011
and I am stunned to find that people still do not understand it.
Surely, if there is more CO2, the yellow dents it makes in the incoming solar spectrum will become bigger? (i.e. more will go to the moon and more to outside earth……)
That is 5525K coming in there. Why climate scientist would only worry about the 210-310K going out from earth,is a total mystery to me….Surely, if they claim CO2 causes warming, they have to present us with a balance sheet?
The total confusion on – and total misunderstanding of – this whole subject, is quite unbelievable to me.
the key to understanding is the report measuring the radiation coming back from the moon
http://wattsupwiththat.com/2012/12/06/a-problem-nearly-one-third-of-co2-emissions-occured-since-1998-and-it-hasnt-warmed/#comment-1170447
RE: HenryP: (December 12, 2012 at 10:19 pm)
“Henry says
“Clearly, you still don’t understand how a gas behaves in the atmosphere;
here is another graph that shows. The red is the incoming solar arriving at sea level on a cloudless day . . . the yellow marked areas is all that is being “absorbed” by the gases in the atmosphere before it reaches earth….”
Yes, that is all true. That graph shows how the atmosphere is heated by solar radiation that does not reach the ground. Not how it is heated by radiation back from the ground. Most of that heat is bounced around and shared with other molecules in the atmosphere. The longest wavelength shown is 2500 nm (2.5 microns or 4,000 cycles per cm) which is far shorter than the 15,000 nm wavelength that CO2 tries to cool itself with.
Photons arriving from the sun were emitted at 5525 K. Luckily, the atmosphere of the Earth is far too cold to re-emit those wavelengths (except, perhaps as a result of transient molecular attachment.) Even though some of that energy does not reach the ground, it still adds to the heat that the Earth must return to outer space.
I have regarded cooling as an independent issue on the assumption that CO2 heating is minimal due to its transparency. I do not know if MODTRAN includes the effect of solar heating, but I suspect there would be major inaccuracies in its calculations if it did not. I believe that solar radiation is insignificant over the 6.667 to 100 micron band MODTRAN uses.
The standard Trenberth Global Energy Flows Diagram is useful here:
http://iedro.com/blog/wp-content/uploads/2012/04/RBRWuG0086_Trenberth_Radiative_Balance_BAMS_2008
What you are referring to are elements of the left side of this diagram showing how energy arrives on earth. The MODTRAN calculations apply to the right side showing how heat leaves the Earth. Because the Earth is so much colder than the sun, there is little overlap between the two. Solar energy that heats the atmosphere can only be returned to outer space via the pathways on the right side of the diagram. And yes, most heat is returned from the atmosphere. The 396 W/m2 surface radiation is replaced by 333 W/m2 back radiation for a net 63 W/m2 from the surface while the Earth, as a whole, is radiating 238.5 W/m2 to outer space. Only reflection returns shortwave solar energy directly to outer space and solid or liquid particles are usually required for that.
Spector says
That graph shows how the atmosphere is heated by solar radiation that does not reach the ground.
henry says
Only a small % of the 30% is used by heating the air. Most of it is back radiated, due to absorption and subsequent re-radiation, by the GHG gases, to outer space.
Hence we can measure it even after it has bounced back to us from the moon.
You have not understood how the GH effect works, precisely.
read the definition at the beginning here:
http://blogs.24.com/henryp/2011/08/11/the-greenhouse-effect-and-the-principle-of-re-radiation-11-aug-2011
and then you try to understand how the GH effect works. Do the forest experiment. We have a gas in the air where you can actually see the re-radiation!!
Other simple experiment:
\cold night in winter
clouds arrive
warmth is back radiated from the clouds
night feels a bit warmer
Spector says
I have regarded cooling as an independent issue on the assumption that CO2 heating is minimal due to its transparency.
Henry says
CO2 is not transparent, like nitrogen is, that is my whole point.
Spector says
I do not know if MODTRAN includes the effect of solar heating, but I suspect there would be major inaccuracies in its calculations if it did not. I believe that solar radiation is insignificant over the 6.667 to 100 micron band MODTRAN uses.
henry says
You cannot calculate that which has never been measured, never mind correctly understood, in the first place. MODTRAN is a fraud.
Sorry, but I have tried my best to re-educate you.
Spector says
That graph shows how the atmosphere is heated by solar radiation that does not reach the ground.
henry says
Only a small % of the 30% is used by heating the air. Most of it is back radiated, due to absorption and subsequent re-radiation, by the GHG gases, to outer space.
Hence we can measure it even after it has bounced back to us from the moon.
You have not understood how the GH effect works, precisely.
read the definition at the beginning here:
http://blogs.24.com/henryp/2011/08/11/the-greenhouse-effect-and-the-principle-of-re-radiation-11-aug-2011
and then you try to understand how the GH effect works. Do the forest experiment. We have a gas in the air where you can actually see the re-radiation!!
Other simple experiment:
\cold night in winter
clouds arrive
warmth is back radiated from the clouds
night feels a bit warmer
Spector says
I have regarded cooling as an independent issue on the assumption that CO2 heating is minimal due to its transparency.
Henry says
CO2 is not transparent, like nitrogen is, that is my whole point.
Spector says
I do not know if MODTRAN includes the effect of solar heating, but I suspect there would be major inaccuracies in its calculations if it did not. I believe that solar radiation is insignificant over the 6.667 to 100 micron band MODTRAN uses.
henry says
You cannot calculate that which has never been measured, never mind correctly understood, in the first place. MODTRAN is a fraud.
Sorry, but I have tried my best to re-educate you.
RE: HenryP says: (December 13, 2012 at 6:15 am )
“Henry says
CO2 is not transparent, like nitrogen is, that is my whole point.
CO2 is generally described as a colorless gas. It is transparent to electromagnetic radiation at all frequencies that do not resonate with its internal structure. Most transparent gases have fine absorption-emission lines, which correspond to their particular internal structures and molecular state of rotation. It is true that nitrogen is transparent to both optical and infra-red radiation because it is a ‘homonuclear’ molecule with no dipole moment to couple its vibrations to electromagnetic radiation.
Transparent does not mean perfectly transparent as rare abnormal absorption-emission events can occur during molecular collisions. There is also a complication caused by rare molecules with alternate isotopes, which have slightly different spectra.
The issue of what happens with shorter wavelength absorption bands of CO2 and other gases can absorb solar photons is both more complex and obscure. The following reference:
http://noconsensus.wordpress.com/2010/08/17/molecular-radiation-and-collisional-lifetime/
Says that the typical ground level molecular collision decay half-life of an excited CO2 molecule is on the order of a few microseconds while the radiation emission decay half-life may be on the order of a half second or so.
Thus, if the molecule is left alone long enough, a similar photon may be emitted at some random direction, where it might just as well be absorbed by another CO2 molecule. But it appears that the most likely effect, except at the top of the atmosphere, is that the absorbed energy is quickly shared out on inelastic collisions and so the net effect is to *heat* the atmosphere and that heat will eventually be emitted again to outer space as terrestrial band photons.
If that heat were not returned to outer space, it would eventually heat the ground by preventing convective cooling and increasing back-radiation. Only out-going terrestrial radiation, photons that are scattered out of the atmosphere, and no-deposit, no-return reflections can be put on the cooling side of the balance sheet. Gases do not reflect.
The *primary* reason that carbon dioxide has become an issue in climate studies is because its 15 micron absorption line happens to be right in the middle of the Earth’s thermal radiation emission band. The significance of this has been exaggerated as only a fraction of that band can be impacted by CO2 absorption. (See vibration mode one in the reference below.)
CO2 has a symmetric, non-polar molecular structure that minimizes its external electrical field. This minimizes its interaction with other molecules and is the reason that this gas is non-condensing in our atmosphere.
Infra-Red Spectroscopy
“Not all vibrations lead to absorption in the infra-red region. For absorption to occur there must be a change in the dipole moment in the molecule during vibration. This is illustrated by looking at the [transmission] spectrum of carbon dioxide gas.”
http://www.succeedingwithscience.com/labmouse/chemistry_as/1903.php
Wave-number 667 cm-1 is equivalent to 15 microns and 2300 cm-1 is equivalent to 4.35 microns.
Spector says
so the net effect is to *heat* the atmosphere
henry says
rubbish. most of it is back radiated due to re-radiation as soon as the sun starts shining…
The O2 and N2 is completely transparent at the wavelengths where CO2 absorbs…..they cannot be heated by that re-radiation.
Did you ever look at the spectrum of CO2? You can see the absorptions between 1-2 um in that report of the radiation specific to the CO2 being bounced back from the moon. CO2 also emits in the UV due to re-radiation which is why we can identify it on other planets. We have also big absorption between 4 and 5 um where water vapor also absorbs.
If you ask me, you still do not understand how the GH effect works. But I am glad you understand the books./
My main point here has been to say (see above) that MODTRAN (‘good enough for government work’) calculations seem to show that CO2 is not the Big Bad Bear that most people now fear.
As the solar band is 20,000 or more cycles/cm (wave-number) wide, the CO2 spectrum only impacts minute fractions of this energy and that is probably logarithmically related to CO2 content, in just the same way that outgoing absorption is logarithmically limited.
CO2 can only cool the Earth by emitting photons derived from heat energy absorbed from the surrounding atmosphere to outer space. I believe terrestrial temperatures make 15-micron photons the primary means of cooling by CO2, as there is not enough thermal energy to easily excite the higher modes. Only in the mesosphere (and perhaps the upper stratosphere) is the remaining CO2 thin enough to let its own emitted photons escape to outer space.
CO2 scattering of incoming radiation is a problematic calculation as it involves knowing whether the absorbed energy will be re-emitted before it is diluted by being shared with other molecules in the atmosphere. One needs to know the radiation decay, half-life of each excited state, (Einstein constant) the molecular collision rate and the probability that each collision will be elastic for that state of excitation. Then there is also the probability of escape to outer space for each emitted photon to consider.
Relative to the surface, the greenhouse effect is primarily due to the 333 W/m2 back-radiation that allows only 63 W/m2 of 396 W/m2 attempted emission to escape as indicated on the Trenberth diagram. That is only one factor influencing the global thermal energy budget.
I believe the fact that there has been no appreciable warming since 1998, even though nearly one third of CO2 emissions occurred since then clearly shows that there are other things involved beside CO2. This also indicates that the rapid rise in temperatures between 1965 and 1995 is probably not valid as a calibration for the effect of CO2 on the climate.
Spector says
CO2 can only cool the Earth by emitting photons derived from heat energy absorbed from the surrounding atmosphere to outer space. I believe terrestrial temperatures make 15-micron photons the primary means of cooling by CO2,
henry says
no!
CO2 cools by back radiation (to space) of sunlight (various absorptions 0-5 um).
CO2 warms by back radiation (to earth) of earth shine (14-16 um, where H2O also absorbs)
If you don’t get this you will not understand why London was cooling when the rest of the world was warming and why we are cooling now.
To put this matter to rest I will copy my whole blog post here.. Perhaps it (the teaching) can also benefit other people following this discussion.
The greenhouse effect and the principle of re-radiation
Quote from Wikipedia (on the interpretation of the greenhouse effect);
“The Earth’s surface and the clouds absorb visible and invisible radiation from the sun and re-emit much of the energy as infrared back to the atmosphere. Certain substances in the atmosphere, chiefly cloud droplets and water vapor, but also carbon dioxide, methane, nitrous oxide, sulfur hexafluoride, and chlorofluorocarbons, absorb this infrared, and re-radiate it in all directions including back to Earth.”
I am watching with some amusement a lot of scholar discussions on the green house effect as I realised again that the people that I encounter on most scientific blogs don’t understand the chemistry principle of absorption and subsequent re-radiation. In fact very few people do understand it because if they did they would have raised the alarm bells ringing long time ago. But they all got stuck at Tyndall and Svante Arrhenius. … They know that CO2 (carbon dioxide) “absorbs” in the 14-16 um region. Most people think that what it means is that the molecules absorbs photons here which then subsequently get transferred as heat to neighbouring molecules. Then it absorbs again, and so on, and so on…and all the absorbed light is continuously transferred to heat…Although this may happen up to a certain saturation point as soon as the light or radiation hits on the gas, that is in fact not what is causing the heat entrapment.
I happen to be familiar with spectrophotometry. You have to understand what actually happens when we put a beam of light of certain wavelength on a sample of liquid or gas. We have various spectrophotometers that can measure the various ranges of UV-visible -IR etc. Usually you have the option to vary the wavelength of the beam of light, either manually or automatically. If the gas or liquid is completely transparent, we will measure 100% of the light that we put through the sample coming through on the other side. If there is “absorption” of light at that specific wavelength that we put through the sample, we only measure a certain % on the other side. The term “extinction” was originally used but later “absorption” was used to describe this phenomenon, meaning the light that we put on was somehow “absorbed”. I think this was a rather unfortunate description as it has caused a lot of confusion since. Many people think that what it means is that the light of that wavelength is continually “absorbed” by the molecules in the sample and converted to heat. If that were true, you would not be able to stop the meter at a certain wavelength without over-heating the sample, and eventually it should explode, if the sample is contained in a sealed container. Of the many measurements that I performed, this has never ever happened. Note that in the case of CO2, when measuring concentrations, we leave the wavelength always at 4.26 um. Because the “absorption” is so strong here, we can use it to compare and evaluate concentrations of CO2.
The best way to experience re-radiation for yourself is to stand in a dark forest just before dawn on a cloudless night. Humidity must be high. Note that water vapour also absorbs in the visible region of the spectrum. So as the first light of sun hits on the water vapour you can see the light coming from every direction. Left, right, bottom up, top down. You can see this for yourself until of course the sun’s light becomes too bright in the darkness for you to observe the re-radiated light from the water vapour. This is also the reason why you will quickly grab for your sun glasses when humidity is high, because even with the sun shining for you from your back and driving in your car, you can feel on your eyes that the light from the sun is re-radiated by the water vapor in the atmosphere.A third way to experience how re-radiation works is to measure the humidity in the air and the temperature on a certain exposed plate, again on a cloudless day, at a certain time of day for a certain amount of time. Note that as the humidity goes up, and all else is being kept equal, the temperature effected by the sun on the plate is lower. This is because, like carbon dioxide, water vapour has absorption in the infra red part of the spectrum.
We can conclude from all these experiments that what actually happens is this:
in the wavelength areas where absorption takes place, the molecule starts acting like a little mirror, the strength of which depends on the amount of absorption taking place inside the molecule. We may assume that at least 50% of a certain amount of radiation is sent back in a radius of 180 degrees in the direction where it came from. (However, because the molecule is very small and therefore might behave more or less like a sphere, it could be up to ca. 62,5% ). This re-radiation in the sun’s spectrum and in the earth’s spectrum is the cooling effect, or warming effect, respectively, of a gas hit by radiation. An effect that is very similar to this, is also observed when car lights are put on bright in humid, moist and misty conditions: your light is returned to you!!
Unfortunately, in their time, Tyndall and Arrhenius could not see the whole picture of the spectrum of a gas which is why they got stuck on seeing only the warming properties of a gas (i.e. the closed box experiments). If people would understand this principle, they would not singularly identify green house gases (GHG’s) by pointing at the areas in the 5-20 um region (where earth emits pre-dominantly) but they would also look in the area 0-5 um (where the sun emits pre-dominantly) for possible cooling effects. If you really want to understand what happens in the atmosphere, this rough graph / representation (on a cloudless day) is very important:
http://albums.24.com/DisplayImage.aspx?id=cb274da9-f8a1-44cf-bb0e-4ae906f3fd9d&t=o
See how the absorptions that are apparent in the spectra of the individual components of the atmosphere affect the outgoing radiation of earth and see how they affect the incoming radiation. For example, let us look at the absorption of ozone at between 9-10 um? It makes a dent in earth’s outgoing radiation at 9-10. In other words what happens: Radiation from earth of 9-10 goes up, hits on the ozone, most of which is high up in the sky and which is already absorbed to capacity, and therefore a great percentage (at least 50%, probably more) is sent back to earth, leading to entrapment of heat, leading to delay in cooling, leading to a warming effect. Also look at water vapor and CO2 around 2 um and see how that makes a dent in the incoming solar radiation. Notice that the ozone shields us from a lot of sunlight by absorbing and re-radiating in the UV region. In fact, if you really grasp what you are seeing in this graph/ representation (from a cloudless day), you would realize that without the ozone and CO2 and H2O and other GHG’s you will get a lot more radiation on your head. In fact, you would probably fry.
For comprehensive proof that CO2 is (also) cooling the atmosphere by re-radiating sunshine, see here:
http://www.iop.org/EJ/article/0004-637X/644/1/551/64090.web.pdf?request-id=76e1a830-4451-4c80-aa58-4728c1d646ec
They measured this re-radiation from CO2 as it bounced back to earth from the moon. So the direction was sun-earth (day)-moon(unlit by sun) -earth (night). Follow the green line in fig. 6, bottom. Note that it already starts at 1.2 um, then one peak at 1.4 um, then various peaks at 1.6 um and 3 big peaks at 2 um. You can see that it all comes back to us via the moon in fig. 6 top & fig. 7. Note that even methane cools the atmosphere by re-radiating in the 2.2 to 2.4 um range.
This paper here shows that there is absorption of CO2 at between 0.21 and 0.19 um (close to 202 nm):
http://www.nat.vu.nl/en/sec/atom/Publications/pdf/DUV-CO2.pdf
There are other papers that I can look for again that will show that there are also absorptions of CO2 at between 0.18 and 0.135 um and between 0.125 and 0.12 um.
We already know from the normal IR spectra that CO2 has big absorption between 4 and 5 um.
So, to sum it up, we know that CO2 has absorption in the 14-16 um range causing some warming (by re-radiating earthshine) but as shown and proved above it also has a number of absorptions in the 0-5 um range causing cooling (by re-radiating sunshine). This cooling happens at all levels where the sunshine hits on the carbon dioxide same as the earthshine. The way from the bottom to the top is the same as from top to the bottom. So, my question is: how much cooling and how much warming is caused by the CO2? How was the experiment done to determine this and where are the test results? (I am afraid that simple heat retention testing might not work here, we have to use real sunshine and real earthshine to determine the effect in W/m3 / [0.03%- 0.06%]CO2/m2/24hours).
I am doubtful of the analysis of the spectral data. I have not seen any work that convinces me. In the case of CO2, I think the actual heat caused by the sun’s IR at 4-5 could be underestimated, i.e. the radiation of the sun between 4 and 5 may be only 1% of its total energy output, but how many Watts per m2 does it cause on earth? Here in Africa you cannot stand in the sun for longer than 10 minutes, just because of the heat (infra-red) of the sun on your skin.
In all of this we are still looking at pure gases. The discussion on clouds and the deflection of incoming radiation by clouds is still a completely different subject.
CO2 also causes cooling by taking part in the life cycle. Plants and trees need warmth and CO2 to grow – which is why you don’t see trees at high latitudes and – altitudes. It appears no one has any figures on how much this cooling effect might be. There is clear evidence that there has been a big increase in greenery on earth in the past 4 decades.
From all of this, you should have figured out by now that any study implying that the net effect of more CO2 in the atmosphere is that of warming, must exhibit a balance sheet in the right dimensions showing us exactly how much radiative warming and how much radiative cooling is caused by an increase of 0.01% of CO2 that occurred in the past 50 years in the atmosphere. It must also tell us the amount of cooling caused by the increase in photosynthesis that has occurred during the past 50 years.
There are no such results in any study, let alone in the right dimensions. FOR EXAMPLE, consider the fact that time must be in the dimensions.
For more on why it is considered highly unlikely that CO2 is a contributory cause to global warming, see here:
http://blogs.24.com/henryp/2012/04/23/global-cooling-is-here/
http://blogs.24.com/henryp/2012/10/02/best-sine-wave-fit-for-the-drop-in-global-maximum-temperatures/
The above results show that a cooling cycle started around 1995.