


(Photo credits: NOAA)
By WUWT regular “Just The Facts”
Your help is needed in building the new WUWT “Extreme Weather” Reference Page. My recent article A Big Picture Look At “Earth’s Temperature” – “Extreme Weather” Update appears to have struck a cord with some of our Warmist friends, as I earned an “Extreme Denial” label from Tamino.
Apparently Tamino took issue with the fact that I only debunked the “Climate Change” = “Extreme Warming” meme from one angle, i.e. by showing that little if any warming has occurred over the last 15 years, thus claims that “Extreme Weather” has recently “arrived” and become “the new normal” are unfounded and erroneous. Tamino seemed disappointed that I had not attempted to debunk claims that there’s been a “dramatic increase in weather-related catastrophes”. He offered in support of this claim, an insurance company’s marketing materials and 3 charts (1, 2, 3) from the United States, which represents less than 2% of Earth’s surface area. Not particularly compelling.
I will address Tamino’s charts in further detail below, but the first order of business is to see if we can figure out whether there has been a “dramatic increase in weather-related catastrophes” and “Extreme Weather”. As such, I’ve created the WUWT “Extreme Weather” Reference Page and populated it with all of the credible 3rd party data on weather extremes that I am aware of. I am sure there’s more. Please post links to any credible data sources on weather extremes below or in comments of the WUWT “Extreme Weather” Reference Page, and we’ll review them for inclusion on the “Extreme Weather” reference page.
The credible global weather extremes charts I have found thus far are as follows:
Tropical Cyclones
Global Tropical Cyclone Accumulated Cyclone Energy (ACE)y – 1971 to Present
y - 1971 to Present")
Global Tropical Cyclone Frequency- 1971 to Present

Global Hurricane Frequency – 1978 to Present

Precipitation/Drought
Global Precipitation

Global Palmer Drought Severity Index (PDSI)

Tornadoes
US Strong to Violent Tornadoes (EF3-EF5) – 1950 to Present chart;

is also significant as “Tornado researcher Tom Grazulis estimates that about 75 percent of the world’s tornadoes occur in the United States.” Chicago Tribune However, this may be misleading in that “many countries do not keep records of their tornadoes. The actual number of tornadoes outside the U.S. is not known.” Answers.com
If you are aware of any other global or semi-global weather extremes charts from credible data sources, please post them in comments.
Returning to the charts that Tamino thinks I am in “Extreme Denial” of, the first chart Tamino offers is from the marketing materials of German Insurer Munich RE:

Munich RE is “one of the world’s leading reinsurers” “with income from reinsurance premiums alone at nearly €26.5bn (2011)”. Their “What we do” section begins with, “What happens if the sea level rises by one metre? How do offshore wind farms affect risks in the shipping business?” Furthermore, if you look at this Munich RE marketing press release from November 11, 2011, you’ll see that they have a clear financial interest in marketing and promoting the “Extreme Weather” meme:
Over the last 30 years, Asia Pacific has experienced more than 50% of all fatalities from natural catastrophes, almost 40% of all economic losses but less than 9% of the insured losses.
This shows the urgent need for wider natural catastrophe insurance coverage. This can be met through a variety of measures, from traditional insurance and reinsurance, to public-private partnerships or pooling of natural catastrophe risks nationwide.
Munich Re has the expertise and experience, and is discussing natural catastrophe schemes with governments all over Asia. The support can be twofold: on the one hand, driving the discussion in greatly exposed economies to structure country-wide solutions; on the other, finding solutions for governmental infrastructure assets such as roads and bridges. Munich RE
Clearly Munich RE has a significant financial interest in “discussing natural catastrophe schemes with governments”, thus it’s marketing materials cannot be considered a credible source for unbiased scientific data. It would be akin to a skeptic posting a temperature chart from Exxon Mobil, laughable.
This Federal Emergency Management Agency (FEMA) Disasters Declared chart is the second undeniable plot Tamino posted:

However, it appears more indicative of changes to the “disaster declaration” criteria versus a change in weather extremes, i.e.:
“FEMA was established under the 1978 Reorganization Plan No. 3, and activated April 1, 1979, by President Jimmy Carter in his Executive Order 12127″ Wikipedia.
“A review of data for a seven-year period from 1988 to 1995 reveals that large expenditures, as funded by supplemental bills, relate to declarations issued for the largest events. During this time period, disaster declarations were made for Hurricane Hugo, the Loma Prieta earthquake, Hurricane Andrew, the Midwest floods of 1993, and the Northridge earthquake. However, these were not the only events deemed worthy of presidential action and of cost to the federal treasury.”
“But like the tail of a comet, over 200 other declarations accounted for one quarter of such outlays, many of them of relatively minute cost and extent. While of lesser impact on the national treasury, such “low end” declarations have become, to some observers, new sources of federal spending at the local level, long referred to in other contexts as “pork barrel spending.” Congressional Research Service
“In 1996, the agency was elevated to cabinet rank.” which correlates well with the spike in Disasters Declared in the second half of the 1990s. Furthermore, if you look at this 2011 FEMA list of 99 “Major Disasters” versus these lists from 1958 and 1959 with 7 “Major Disasters” each, it seems apparent that the FEMA data is biased by changes in disaster declaration criteria, e.g. “events deemed worthy of presidential action and of cost to the federal treasury”. As such the FEMA Disaster Declaration data is not a credible proxy for “Extreme Weather”.
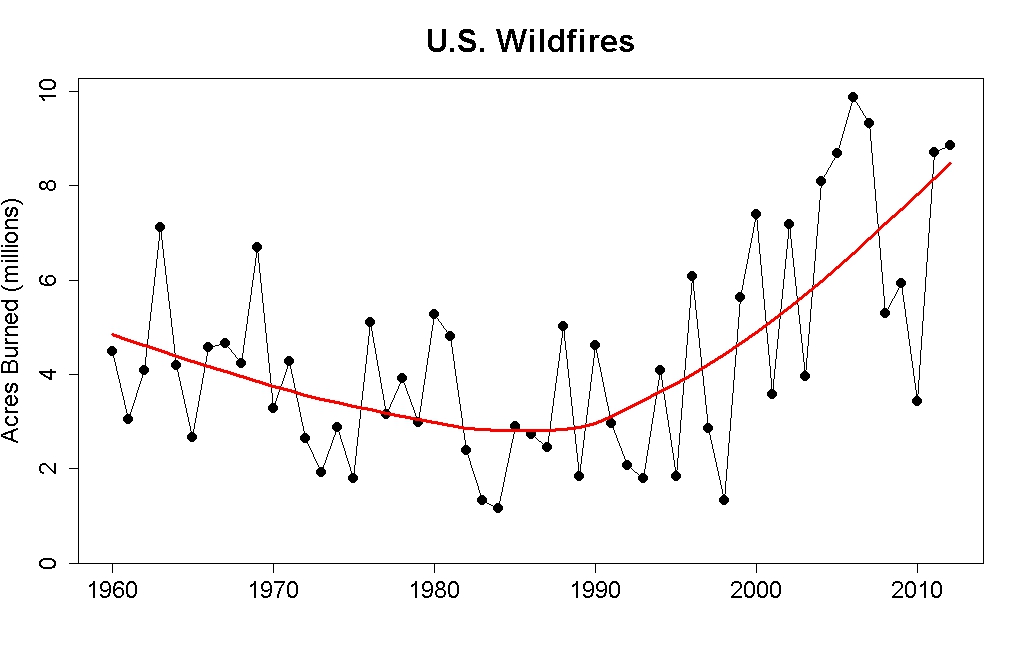
Third Tamino’s posted this US Wildfire chart;

however, it only shows Acres Burned, whereas the following chart shows the US Acres Per Wildfire and the Number of Wildfires Per Year:

This is an important distinction as the associated article elaborates:
This graph shows the inverse relationship between numbers and sizes of US wildfires over time. Note the greater number and smaller sizes of fires between the creation of Wilderness in 1964 and the beginning of the modern wildfire era in 1987 and 1988 (with Silver Complex and Yellowstone fires of those years), as compared with the smaller number and greater size of recent fires. One factor may be the shift in USFS policy from rapid suppression to “let it burn,” which has allowed for numerous smaller fires – previously extinguished individually — to coalesce into larger fires and singular complexes.Evergreen
For reference;
“Forest managers agree that the current fire risk is primarily a combination of two factors — higher-than-average temperatures and a profusion of fuel, the product of nearly a century of fire suppression policies.”
“Recognizing widespread overgrowth in American forests, in the late 1970s the Forest Service began reintroducing policies of prescribed burning and allowed many smaller, natural fires to burn out on their own, provided they didn’t threaten lives or property. The decision this summer to attack all fires, while not a direct reversal of this policy, does represent a departure from that practice of natural restoration, said Jennifer Jones, a public affairs specialist with the Forest Service. Scientific America
The shift in thinking was formalized in a 1995 statement of federal fire policy, and strengthened in a 2001 revision. The policy recognizes that fire is “an essential ecological process,” and that decades of trying to keep fires from burning have led, ironically, to “larger and more severe” conflagrations because of the buildup of underbrush and other fuel. USA Today
As such, US Forest Fire data is biased by “nearly a century of fire suppression policies” and “the shift in USFS policy from rapid suppression to ‘let it burn,'”, which begin “in the late 1970s”, “was formalized in a 1995 statement of federal fire policy, and strengthened in a 2001 revision.” US Forest Fire data is not a credible proxy for “Extreme Weather.”
Finally, Tamino offers this NOAA Extremes in 1-Day Precipitation chart;

which is relevant, but it is only illustrates the “Contiguous U.S.”, which is just “1.58% of the total surface area of the Earth” and the chart ends in 2011. Fortunately, this NOAA Extremes in 1-Day Precipitation – 1910 to Present – Year to Date chart;

shows the full US, which is at least closer to 2% of Earth’s surface area, whatever that means, and the chart is current through October 2012, so it shows the drop in Extremes in 1-Day Precipitation that has occurred during 2012. This Extremes in 1-Day Precipitation chart was one of a number US climate extreme charts that were already included in the WUWT US Climatic History Reference Page, which I’ve now added, along with an array of other US centric weather extreme charts, to the WUWT “Extreme Weather” Reference Page
Tamino didn’t do so well supporting claims that there’s been a “dramatic increase in weather-related catastrophes”, “Extreme Weather” has “arrived” and is now the “new normal”. Perhaps you can do better? Please post all credible charts on weather extremes in comments and we will review for inclusion on the WUWT “Extreme Weather” Reference Page. Thank you in advance for your assistance.
Please note that WUWT cannot vouch for the accuracy of the data/graphics within this article, nor influence the format or form of any of the graphics, as they are all linked from third party sources and WUWT is simply an aggregator. You can view each graphic at its source by simply clicking on it.
Dahhhh Tamino, do you think maybe population increases may have something to do with insurance claim increases not to mention a shi*$#t load of other insurance related factors that have change in the last 50 years !!!
The ICAT Damage Estimator has estimates of the damages from US landfalling hurricanes from 1900-2011, in terms of how much damage they would have caused had they hit today (thus adjusting for inflation and the amount of “stuff” in the path of each storm). Unfortunately, they don’t have a nice neat by-year summary as far as I could see, so I copied down the data and made my own spreadsheet.
I don’t know that this counts as “credible charts on weather extremes”, but I found it interesting at least. The $100B+ peak years are 1900 ($106B: Galveston), 1926 ($196B: Great Miami Hurricane plus two others), and 2005 ($124B: Katrina, Wilma, Rita, and three others).
http://rogerpielkejr.blogspot.ca/2012/11/normalized-us-hurricane-damage-1900.html
http://rogerpielkejr.blogspot.ca/2012/10/new-paper-normalized-tornado-damage-in.html
http://rogerpielkejr.blogspot.ca/2012/09/drought-and-climate-change.html
To list a few.
Isn’t the argument against the Medieval Warm Period that there is no evidence it was worldwide? Is somebody changing the goalposts yet again?
The best for a now and then comparison is Steven Goddard’s. A veritable enormous source of past anecdotal evidence of catastrophes.
Good stuff.
Worthwhile to look at “Extreme Holocene Climate”, too. Too many claims by Warmists about current conditions being ‘unprecedented’…
Kurt in Switzerland
Discussing weather related insurance premiums with Munich Re is like talking about fire hazards with Al Capone. Neither would give you a realistic estimation on the risk unless you paid up.
Insurance payouts are bigger because more people are living in vulnerable places.
End of story.
http://rogerpielkejr.blogspot.ca/2012/03/handy-bullshit-button-on-disasters-and.html
mstickles:
Link to your spreadsheet not working.
I would like to see the ‘uncorrected’ temperatures for Alice Springs and the surrounding area of Central Australia which have flatlined for fifty years.
How does anyone know what the weather was like in some places a thousand years ago if no one lived there or were able to keep a record? It is only people’s memory and recording skills (and being there) that allows us to know what happened, and how severe the weather was.
IMHO nothing in weather is ‘unprecedented’.
They look to ice core samples from the poles and make projections – not very accurate but that is my opinion.
The EPA has these US Climate Change Science Program(CCSP) heat wave / temperature graphics through 2008. The 1930’s in the US were hellish.
http://www.epa.gov/climatechange/science/indicators/weather-climate/heat-waves.html
Disaster declarations are influenced by elections and political parties. Where congressional seats are in play for upcoming elections, FEMA funding is more likely to be asked for and approved. The academic papers below cite much of the research on the politics of U.S. disasters.
Here is quote from recent WSJ (Cato) article: “Nor has federal disaster aid been immune from politics. History shows that the more politically important a state is, especially to a presidential re-election effort, the more likely it is to receive a federal disaster declaration.”
http://www.cato.org/publications/commentary/disaster-relief-bigger-government-isnt-always-better
Governors as Opportunists: Evidence from Disaster Declaration Requests
John T. Gasper Andrew Reeves September 12, 2012
http://www.andrew.cmu.edu/user/gasper/WorkingPapers/govreqs.pdf
The Political Economy of FEMA Disaster Payments
Thomas A. Garrett and Russell S. Sobel (2002)
http://research.stlouisfed.org/wp/2002/2002-012.pdf
mstickles says: November 23, 2012 at 11:09 am
The ICAT Damage Estimator has estimates of the damages from US landfalling hurricanes from 1900-2011
YFNWG says: November 23, 2012 at 11:14 am
http://rogerpielkejr.blogspot.ca/2012/11/normalized-us-hurricane-damage-1900.html
http://rogerpielkejr.blogspot.ca/2012/10/new-paper-normalized-tornado-damage-in.html
I am hesitant to use “damage” as a proxy for weather extremes, as “damage” is biased by a multitude of non-weather factors, including population movement/growth, building codes, inflation, preparatory time, coastal defense measures, etc., and thus the results are heavily dependent on normalization procedures, e.g.:
I agree with Stephen Richards at 11:28 am.
There is much wailing and gnashing of teeth in the MSM about “extreme weather events” of late. Stephen Goddard’s collection of press clippings and other related items tends to put some perspective on weather events. Some of the hyperbolic language used in describing contemporary events in the late 1800s wouldn’t go amiss in today’s press reportage!
http://stevengoddard.wordpress.com/bad-weather/
Scroll down for the older articles; it pays dividends to follow some of the sources given. I particularly like this one from 1800 http://books.google.com/ebooks/reader?id=VG5bAAAAQAAJ&printsec=frontcover&output=reader&pg=GBS.PP5
YFNWG says: November 23, 2012 at 11:14 am
http://rogerpielkejr.blogspot.ca/2012/09/drought-and-climate-change.html
Added to the “Extreme Weather” Page, under US – Precipitation/Drought. Thank you
http://www.spc.noaa.gov/wcm/torgraph-big.png
NOAA’S Inflation Adjusted Annual Tornado Running Total ??
oldseadog says:
November 23, 2012 at 11:42 am
mstickles:
Link to your spreadsheet not working.
http://www.grtbooks.com/public_files/NormalizedHurricaneDamage.zip
Great work – I reviewed it very quickly and it seems to point out that increases were started by Bill Clinton – so now we know it was Clinton/Gore that caused this to occur. Spread the word blame it on Clinton/Gore!!!!
Insurance statistics do not represent physical processes in reality. They count insured damaged or destroyed values. Changes in land use due to for example population groth in previously avoided areas as well as higher investment values due to tecnical progress or changes in social behaviour are not quantified. The great floods in Bangladesh for exampfe are mostly man-made and were not caused by raised sea-surface or stronger storms.
To use such data in a scientific debate is far away from real science. It’s manipulation or – which I do not believe – ignorance.
Remind me again, why does anyone listen to Tamino on these issues?
It is circular reasoning to listen to anyone on “the team”. they drink from the same trough, ‘believe’ the same fantasies and sing from the same hymnbook. They are redundant.
“US Strong to Violent Tornadoes (EF3-EF5) – 1910 to Present chart” should be 1950 to present.
Tornadoes in UK for what it is worth. (my highlighting)
It is claimed that the UK gets more tornadoes per square kilometre than the USA, but not more tornadoes in total. On average, around 30 tornadoes are reported each year in the UK, although these are generally much weaker than their American counterparts. However, there have been a number of notable exceptions – such as the Birmingham tornado on July 28 2005 which left a significant trail of damage.
http://metofficenews.wordpress.com/2012/05/08/how-often-do-we-get-tornadoes-in-the-uk/
What is Munich Re’s definition of a Weather Catastrophe? If it’s a dollar amount, then maybe it’s a moving target that should be adjusted for inflation and population density.
Many years ago a friend of ours, an attractive, intelligent single woman in her twenties, rented a house we owned for a short spell. Through the grapevine we heard that she had been unhappy recently and acting a bit strangely. My wife and I decided to call on her to make sure she was alright. When we arrived we found her generally anxious and slightly agitated. Thankfully I don’t remember the exact detail of the conversation but after an hour of patient listening and discussion explanation and demonstration our friend seemed reassured that the issue causing her anxiety was without foundation. Greatly relieved that progress had been made, we prepared to leave but before we could say farewell our friend had once again become anxious and agitated only this time it was about at totally different issue. So we sat down again and once again worked through the topic with gentle sensitivity until she was convinced that her fears were groundless. For a moment or two she seemed reassured so we reached for our coats….but before we got to the door she was showing signs of anxiety again and yes you’ve guessed it, this time about a completely different issue….
Forty eight excruciating hours later, exhausted and having talked ourselves hoarse we finally managed to get her admitted to a psychiatric unit where she was medicated and ultimately made a complete recovery.
I repeat this story because of the eerie similarities between my friend’s neurotic episode and the collective anxiety that is clearly felt by a section of the population with regard to the climate issue.
But like my friend all those years ago, it does seem that as soon as you have cleared up one source of anxiety (CAGW) another (Extreme Weather) pops its ugly head up.
I admire WattsUpWithThat because it adopts the patient (though wearying) approach of gently explaining, over and over and over again, the realities of ‘climate change’.
I detest the Warmist Clique that has made itself rich and ‘famous’ by exploiting people’s fears and Tamino surely is the most loathsome of these alarmists.
The FEMA “Disasters Declared” chart an “undeniable plot”? Oh, come on, pull the other one. He expects us to swallow a government-sponsored chart as “evidence” in favour of government-sponsored AGW propaganda? So all they have to do is declare lots of “disasters” and that makes it “fact”? Yeah, right. And we were all born yesterday. Bull. S#¡t.
He should take a trip over to breadandbutterscience.com – specifically, the “Weather History” section. If he can read the facts of the matter James Marusek gives us there and still lie about modern weather being “extreme”, then he’s a more proficient liar than I took him for.
How about Earthquakes? ( Graph at bottom)
http://www.johnstonsarchive.net/other/quake1.html
“But like my friend all those years ago, it does seem that as soon as you have cleared up one source of anxiety (CAGW) another (Extreme Weather) pops its ugly head up.”
I agree with you sentiments, but offer one distinction. In your friends case, her anxiety was real and palpable. The faux anxiety of the alarmists, however, is a cynical ploy to try and create anxiety among the population. Nearly all those believing in this “threat”, do so for ideological reasons, and because it makes them feel correct – politically, that is.
Stephen Richards says: November 23, 2012 at 11:28 am Karl, T., NOAA. 2006. – Click the pic to view at source[/caption]
The best for a now and then comparison is Steven Goddard’s. A veritable enormous source of past anecdotal evidence of catastrophes.
Stephen Brown says: November 23, 2012 at 12:10 pm
I agree with Stephen Richards at 11:28 am.
There is much wailing and gnashing of teeth in the MSM about “extreme weather events” of late. Stephen Goddard’s collection of press clippings and other related items tends to put some perspective on weather events. Some of the hyperbolic language used in describing contemporary events in the late 1800s wouldn’t go amiss in today’s press reportage!
http://stevengoddard.wordpress.com/bad-weather/
Scroll down for the older articles; it pays dividends to follow some of the sources given. I particularly like this one from 1800 http://books.google.com/ebooks/reader?id=VG5bAAAAQAAJ&printsec=frontcover&output=reader&pg=GBS.PP5
I added one of the charts from Steven Goddard’s collection, i.e. Percent of US in Moderate to Extreme Drought 1900 – 2006;
[caption id="" align="alignnone" width="564"]
to the “Extreme Weather” reference page and added a link in the Source Guide to Seven’s “Bad Weather” page:
http://stevengoddard.wordpress.com/bad-weather/
Thank you
A Few Observations:
As far as the UK is concened, since the 1980s there has been a consideable amount of building on floodplanes. This means that many of these newer properties are prone to flooding during wet weather. It also has the knock-on effect of meaning that flood water cannot soak away in the flood plane but is instead added to the downflow of the rivers – increasing the problems downstream.
On another note: Derren Brown did a very interesting TV programme about “Faith and Attribution” wherein he deonstrated that given a faith base, whether that be God, or “This Programme will be secretly watching and testing you” etc., there is a high probabiliy that the subject of this faith will believe that random events are somehow pre-destined by the object of the faith. I am sure that this extends to the faith in AGW also.
I see something weird happened to the link I (thought I) gave above. Let’s try again.
breadandbutterscience dot com
If that fails, put the http and www bits in front and type it the old-fashioned way.
Also, the red mist made me forget to say – Good work, JTF. Again!
How about Earthquakes? ( Graph at bottom)
The virtue of the Earthquake graphs is that they illustrate the futility of trying to discern “trends” in data series that are essentially Poissonian — expressions of a more or less constant probability per unit time, with little bunching or antibunching. Yes, there are peaks and troughs. There is usually a linear trend (on any finite length segment) although it is usually not very large (and is completely insignificant).
Yet if you feed the Earthquake data to somebody and tell them it is “weather” data instead, they’ll find a way to make it be all about warming.
rgb
The carbon theologians seem to be circling the wagons. I tried to make a very reasonable substantive comment on Tamino’s post mentioned above and it was deleted without mention. Same with RC on their thread on of all things “Opening a Dialogue”. Even at SKS where my contrary comments as trunkmonkey were tolerated for years a recent effort to open a technical discusion on the inability of greehouse gasses to warm the oceans was summarily deleted.
When interest in discussing contrary views is lost, the transformation from science to theology is complete.
Of course, they’d manage this with randomly generated Poissonian noise. In fact, Michael Mann’s algorithm has managed this very thing, as Macintyre and McKittrick fairly clearly showed.
rgb
Insurance encourages foolish behavior, the underwriters spread the cost among all parties.
Just more gambling, but with really good statistics/data.
YFNWG says: November 23, 2012 at 11:38 am
http://rogerpielkejr.blogspot.ca/2012/03/handy-bullshit-button-on-disasters-and.html
That’s a good article, I’ve added it to the source guide, along with a link to the IPCC’s Special Report – Managing the Risks of Extreme Events and Disasters to Advance Climate Change
Adaptation (SREX):
http://www.ipcc-wg2.gov/SREX/
Per the Summary For Policymakers:
Even the IPCC seems skeptical of the “Extreme Weather” meme, I wonder if Tamino thinks that the IPCC is in “Extreme Denial” too…
Thank you
Here ya go…………..
* scroll down a little on this page as I have given several other references which Antony added to his post as an “Update”.
http://wattsupwiththat.com/2012/05/27/another-paper-shows-that-severe-weatherextreme-weather-has-no-trend-related-to-global-warming/
“Little change in global drought over the past 60 years”
http://www.nature.com/nature/journal/v491/n7424/full/nature11575.html
“Dr. Ryan Maue releases new hurricane frequency data showing a negative trend in the last 30 years”
http://wattsupwiththat.com/2012/10/01/dr-ryan-maue-releases-new-hurricane-frequency-data-showing-a-negative-trend-in-the-last-30-years/
http://www.agu.org/journals/gl/gl1114/2011GL047711/2011GL047711.pdf
“U.S. tornado activity near low point in modern record”
After one of the busiest years for tornadoes in 2011, tornado numbers in 2012 have come crashing down to historic lows.
In 2011, there were 1692 twisters – second most on record. This year, only 882 tornadoes have touched down. (Tornado records date back to 1950*).
http://www.washingtonpost.com/blogs/capital-weather-gang/post/about-face-tornado-activity-near-low-point-in-modern-record/2012/11/14/9ee31a2a-2e86-11e2-89d4-040c9330702a_blog.html
“New paper finds the highest storm activity is associated with cold periods”
http://hockeyschtick.blogspot.com/2012/11/new-paper-finds-highest-storm-activity.html
“We find that high storm activity occurred periodically with a frequency of about 1,500 years, closely related to cold and windy periods diagnosed earlier”
http://www.nature.com/ngeo/journal/vaop/ncurrent/full/ngeo1619.html#ref1
—————————
Imagine these past weather news reports today.
“It’s worse than we thought!”
http://stevengoddard.wordpress.com/bad-weather/
Bob Shapiro says: November 23, 2012 at 12:39 pm
“US Strong to Violent Tornadoes (EF3-EF5) – 1910 to Present chart” should be 1950 to present.
Corrected in the article and on the “Extreme Weather” page. Thank you
Bob Koss says: November 23, 2012 at 12:03 pm
The EPA has these US Climate Change Science Program(CCSP) heat wave / temperature graphics through 2008. The 1930′s in the US were hellish.
http://www.epa.gov/climatechange/science/indicators/weather-climate/heat-waves.html
Yes, all three of them are in the US – Temperature section towards the bottom of the “Extreme Weather” page.
In the middle of the usual baloney about the future, the link below will lead to a chronology of drought in the Canadian prairies over the most recent 600 years. There were 5 multi-decadal droughts in period 1402 to 2004 (the period covered by the study) over a wide area of the Canadian prairies. All of them occurred prior to 1945, only one of them occurred in the 20th century, the two most severe occurring between 1480 and 1540, which was somewhere in the middle of the LIA.
As I have recounted before on Goddard’s page, Britain’s John Palliser was sent out to assess the Canadian prairies for population and agriculture. He came back from his trip stating that the area was uninhabitable and unsuitable for agriculture. The area he assessed in the 1860’s was dubbed as “Palliser’s Triangle”. Unfortunately for him, he assessed the area at the tail end of one of the 5 recorded multi-decadal droughts.
Palliser’s Triangle is now home to more than 3.5 million people and is one of the most productive agricultural areas on earth.
It is dangerous to look at climate on a daily, weekly, yearly or even decadal scale and draw conclusions. Imagine if those 3.5 million people had inhabited Paliser’s triangle from 1480 to 1570, when the worst of the droughts occurred (3 of the 5 recorded multi-decadal droughts were in those 90 years). Insurers would not provide crop insurance because the risks would be too great. Fresh water rationing would be in full effect. In fact, it is probable that the area would have depopulated because it was uninhabitable.
Here is the chart.
http://www.parc.ca/saskadapt/adaptation-options/theme-assessments/water-drought
There are many issues with respect to the disaster meme. Firstly – reporting is increased, be it wind,rain, fire or drought, etc – in the last 50 year, such things have been increasingly documented and recorded, classified, etc,etc. Think of something ‘seen; a hundred years ago, by a handful of people, but today the same ‘event’ would be witnessed and recorded by many hundreds!
Also, for what its worth – I’d say that any insurance company compiled data is worthless because it is compiled by them and all they are interested in is explaining/justifying/inflating their premiums and of course making a profit! Add to that the fact that any claims by Joe Public will be ‘inflated’ and you can see we are on a loser!
As has been mentioned, flooding in the UK has more recently become an issue – but partly because of bad building practise – bad infrastructure, etc, etc. So, in the UK, I would only use official rainfall records (which again, will no doubt be improved in recording quality) over the years.
My main point is that any data related to ‘weather extremes’ needs to be throughly and carefully researched in order to draw any meaningful results. as the forest fire graph shows – what metric you ‘use’ makes a very great difference!
I would suggest that before any such data is held up as indicative – it will need to be thoroughly ‘debunked’ itself!
Remember this study?
http://onlinelibrary.wiley.com/doi/10.1002/qj.776/full
This really is not fair. Asking for Just The Facts!!!
“2012 Could Break Record for Fewest Tornadoes”
http://www.ouramazingplanet.com/3795-2012-fewest-tornadoes.html
Tamino’s been on the kool aid,thought it was about time he surfaced again with some tripe, no doubt in self flagallation over Sandy muttering incantations to the two dark sith lords Mann & Gore
Come on repeat after me Grant….. Extreme weather is the new norm… Extreme weather is the new norm..Extreme weather is the new norm.LOL
I have posted this in several areas before. But the weather we are seeing especially in the blocked, looping, meridonal jetstreams leading to continual weather of the same type – cold rain and floods in one area, droughts and heat waves in another; are precisely what one sees as the climate changes from a natural warm period to a natural cold period.
This year Europe has had lots of rain. In particular UK has had flood after flood with the rain starting just after Easter and continuing off and on with repeated deluges of ‘a month’s rain in a day’. The UK has just one such stormy day today with hurricane force gusts and heavy rain.
Well the same weather patterns happened in the same way at the end of the Medieval Warm Period as the climate moved into the Little Ice Age and the weather sounds just the same as UK has had this year. From the book “The Long Summer: How Climate Changed Civilization” By Brian M. Fagan: –
“Seven weeks after Easter in A.D. 1315, sheets of rain spread across a sodden Europe, turning freshly plowed fields into lakes and quagmires. The deluge continued through June and July, and then August and September. Hay lay flat in the fields; wheat and barley rotted unharvested. The anonymous author of the Chronicle of Malmesbury wondered if divine vengeance had come upon the land: “Therefore is the anger of the Lord kindled against his people, and he hath stretched out his hand against them, and hath smitten them.” Most close-knit farming communities endured the shortages of 1315 and hoped for a better harvest the following year. But heavy spring rains in 1316 prevented proper sowing. Intense gales battered the English Channel and North Sea; flocks and herds withered, crops failed, prices rose, and people again contemplated the wrath of God. By the time the barrage of rains subsided in 1321, over a million-and-a-half people, villagers and city folk alike, had perished from hunger and famine-related epidemics. Giles de Muisit, abbot of Saint-Martin de Tournai in modern-day Belgium, wrote, “Men and women from among the powerful, the middling, and the lowly, old and young, rich and poor, perished daily in such numbers that the air was fetid with the stench.” People everywhere despaired. Guilds and religious orders moved through the streets, the people naked, carrying the bodies of saints and other sacred relics. After generations of good, they believed that divine retribution had come to punish a Europe divided by war and petty strife.
The great rains of 1315 marked the beginning of what climatologists call the Little Ice Age, a period of six centuries of constant climatic shifts that may or may not be still in progress.”
Nowadays people do not blame God – they lay the blame on industrial output of CO2 and try to get rich by taxing it. But the same – someone must have done something to anger God – meme. I think it is a psychological weakness in some people that is being taken advantage of by people like Al Gore, the ‘Club of Rome’ and a multitude of ‘green’ organizations all enriching themselves based on people needing someone to blame for a natural cycle,
Here are some points to remember about extreme weather: Perception heightened by the following.
1) Better detection (Doppler radar, satellites which did not exist in say)
2) People on the ground recording weather events with mobile phones (videos, photos)
3) More property and people today than 50 years ago.
4) Growth of cities and concentration of people (higher % of people in cities than in past)
5) Media cherry picking and alarmism (bad news sells)
6) Outright fairy tales from the likes of Al Gore who uses money to spread brazen propaganda and outright nonsense to the public.
Henry Galt says:
November 23, 2012 at 12:27 pm
“Remind me again, why does anyone listen to Tamino on these issues?”
I sure don’t. Like a child, the more you give him attention, the louder he screams. Just ignore him – he’s not worth it.
Greg Rehmke says: November 23, 2012 at 12:07 pm
Disaster declarations are influenced by elections and political parties. Where congressional seats are in play for upcoming elections, FEMA funding is more likely to be asked for and approved. The academic papers below cite much of the research on the politics of U.S. disasters.
Here is quote from recent WSJ (Cato) article: “Nor has federal disaster aid been immune from politics. History shows that the more politically important a state is, especially to a presidential re-election effort, the more likely it is to receive a federal disaster declaration.”
http://www.cato.org/publications/commentary/disaster-relief-bigger-government-isnt-always-better
Governors as Opportunists: Evidence from Disaster Declaration Requests
John T. Gasper Andrew Reeves September 12, 2012
http://www.andrew.cmu.edu/user/gasper/WorkingPapers/govreqs.pdf
The Political Economy of FEMA Disaster Payments
Thomas A. Garrett and Russell S. Sobel (2002)
http://research.stlouisfed.org/wp/2002/2002-012.pdf
Good stuff, we have a compelling body of evidence to dismiss the FEMA declared disaster chart as a credible of measure of “Extreme Weather”.
Steve C says: November 23, 2012 at 12:55 pm
The FEMA “Disasters Declared” chart an “undeniable plot”? Oh, come on, pull the other one. He expects us to swallow a government-sponsored chart as “evidence” in favour of government-sponsored AGW propaganda? So all they have to do is declare lots of “disasters” and that makes it “fact”? Yeah, right. And we were all born yesterday. Bull. S#¡t.
That about covers it, I’ll be interested to see if Tamino attempts to defend the charts he’s posted, or if he just slinks away…
Thank you
Sorry about my broken link for the ICAT normalized hurricane damage spreadsheet, I mistyped the start of the URL, Try this one.
As an aside, I agree with those who say damage is a lousy proxy for intensity. Since it gets used a lot on the alarmist side, though, I figured an “apples-to-apples” comparison was in order.
Mark Ro says: November 23, 2012 at 12:18 pm National Oceanic and Atmospheric Administration (NOAA) – Storm Prediction Center- Click the pic to view at sourceUnited States (US) Weather Extremes[/caption]
http://www.spc.noaa.gov/wcm/torgraph-big.png
NOAA’S Inflation Adjusted Annual Tornado Running Total ??
Yes, added under Tornadoes:
US Inflation Adjusted Annual Tornado Trend and Percentile Ranks
[caption id="" align="alignnone" width="578"]
Thank you
Anthony: These have references to Canadian wild fires. Number and Acres (hectares) are falling.
http://www.ciffc.ca/index.php?option=com_content&task=view&id=27&Itemid=29
This has a number of charts.
http://www.ciffc.ca/firewire/current.php
This has a table at the bottom, with the 5, 10, 15, 20 and 25 year average for numbers and area.
The 5 year average is the lowest in the record.
On Boreal forest fires.
and
and
and
Enough of observations in a warming world since the end of the Little Ice Age. How about some future speculation eh???
Yeah, right. Observations win every time my friends. We really need a Journal of Future Speculation Driven By Prospect Of Future Funding.
Bob Shapiro says: November 23, 2012 at 12:45 pm
What is Munich Re’s definition of a Weather Catastrophe? If it’s a dollar amount, then maybe it’s a moving target that should be adjusted for inflation and population density.
According to this document;
http://www.munichre.com/app_pages/www/@res/pdf/NatCatService/great_natural_catastrophes/NatCatSERVICE_Great_1950_2011_definition_en.pdf
That document, along with an array of other Munich RE marketing materials can be found in their “Business & Solutions Online Flyer”:
http://www.munichre.com/en/reinsurance/business/non-life/georisks/natcatservice/great_natural_catastrophes.aspx
sorry, justthefacts, I should have read the byeline.
[snip. Labeling others as being in “dnial” violates site Policy. — mod.]
On tornadoes. [my bold]
When it comes to weather and extreme events , the ‘default’ postion being taken by the alarmists seems to be ‘it must be due to global warming’ whether it is true or not . If you cannot explain it , it must be due to man made green house gases. It is the only game in town for them since they got the co2 level rise causing unprecedented warming argument or claim so wrong . I recall during the past several winters ,when there was the slight rise in the number of snowstorms coming up the US east coast, they blamed it on global warming. Yet very few went back and checked the record . During the winter of 1740/1741 there were 23 strong snow storms in New England . During 1747/1748 winter there were 30 snow storms.[ per Perley2001] and the Climate 4You web page. Snow depths reached 3 meters . Yet the alarmists continue to blame every weather event ever so slightly bigger on climate change due to global warming . Some of Greenland glaciers are melting .It must be due to global warming caused by man . Greenland ice core records[gisp2] show that there were major warming periods in Greenland every 1000 years for the past 9000 years ..European winters are getting warmer . Yet the European winter temperatures have been flat for 20 years now , fluctuating yes, but the trend is flat and even cooling since 2007.. The best approach to counter this massive misinformation being spread in the name climate science can only be accomplished by immediately publishing the truth as is being done by this web page. Good work Anthony.
When it comes to weather and extreme events , the ‘default’ postion being taken by the alarmists seems to be ‘it must be due to global warming’ whether it is true or not . If you cannot explain it , it must be due to man made green house gases. It is the only game in town for them since they got the co2 level rise causing unprecedented warming argument or claim so wrong . I recall during the past several winters ,when there was the slight rise in the number of snowstorms coming up the US east coast, they blamed it on global warming. Yet very few went back and checked the record . During the winter of 1740/1741 there were 23 strong snow storms in New England . During 1747/1748 winter there were 30 snow storms.[ per Perley2001] and the Climate 4You web page. Snow depths reached 3 meters . Yet the alarmists continue to blame every weather event ever so slightly bigger on climate change due to global warming . Some of Greenland glaciers are melting .It must be due to global warming caused by man . Greenland ice core records[gisp2] show that there were major warming periods in Greenland every 1000 years for the past 9000 years ..European winters are getting warmer . Yet the European winter temperatures have been flat for 20 years now , fluctuating yes, but the trend is flat and even cooling since 2007.. The best approach to counter this massive misinformation being spread in the name climate science can only be accomplished by immediately publishing the truth as is being done by this web page. Good work Anthony.
Please consider adding the following as a crowdsource reference – Southern California Rainfall from 1769 to 2000. I submitted this reference earlier in response to Dr. John Christie’s WUWT February 2, 2012 WUWT article at
http://wattsupwiththat.com/2012/02/18/christy-on-sierra-snowfall-over-the-last-130-years-no-trend-no-effect-from-co2/
My response was posted as follows.
Neil Jordan says:
February 18, 2012 at 1:00 pm
Dr. Christy: Thank you for your effort in bringing old records to light. There is another set of California records going back to 1769
that you might consider, related to the “Lynch Index” that was in the California Weather Sumary CD. Jim Goodridge sent me a California
Weather CD in 2002 that contained the file “Lynch Index.xls” that tabulates Southern California rainfall from 1769-1770 to 1999-2000.
The CA Weather CD updated to 2009 does not appear to have that file. The state climatologist at
http://www.water.ca.gov/floodmgmt/hafoo/csc/ might provide some information.
The Lynch Index was based on the August 1931 report, “Rainfall and Stream Run-Off in Southern California Since 1769″ by H. B. Lynch,
for the Metropolitan Water District of Southern California. The report is available on-line at
http://cepsym.info/history/RainfallStreamRunoffSoCA_since1769.pdf
and
http://books.google.com/books/about/Rainfall_and_stream_run_off_in_Southern.html?id=sJMJAQAAIAAJ
The Lynch Index spreadsheet correlates the index from the 1931 report with the rainfall record for Los Angeles. The index stops at 1930, and DWR did an extension to 2000. I did a linear regression analysis on the data, and also an extension (ref Bedient & Huber) of the data to present. Slopes of the regression lines are close to zero.
Moderators: The following text is verbatim from the spreadsheet. Truncate if it does not fit within your format and perhaps I can provide the information another way.
Thank you.
6.698624097
Lynch Year LA Rain Los Angeles
155 1770 23.14 1
125 1771 18.66 2
145 1772 21.65 3
110 1773 16.42 4
115 1774 17.17 5
90 1775 13.44 6
135 1776 20.15 7
75 1777 11.20 8
75 1778 11.20 9
125 1779 18.66 10
135 1780 20.15 11
125 1781 18.66 12
55 1782 8.21 13
65 1783 9.70 14
115 1784 17.17 15
110 1785 16.42 16
75 1786 11.20 17
90 1787 13.44 18
75 1788 11.20 19
135 1789 20.15 20
10 1790 1.49 21
90 1791 13.44 22 0.318
115 1792 17.17 23 0.338
85 1793 12.69 24 0.339
65 1794 9.70 25 0.342
65 1795 9.70 26 0.345
95 1796 14.18 27 0.347
65 1797 9.70 28 0.348
55 1798 8.21 29 0.350
115 1799 17.17 30 0.352
85 1800 12.69 31 0.355
95 1801 14.18 32 0.361
73 1802 10.90 33 0.397
80 1803 11.94 34 0.410
125 1804 18.66 35 0.407
75 1805 11.20 36 0.405
125 1806 18.66 37 0.422
65 1807 9.70 38 0.426
75 1808 11.20 39 0.432
65 1809 9.70 40 0.443
115 1810 17.17 41 0.448
155 1811 23.14 42 0.446
110 1812 16.42 43 0.416
85 1813 12.69 44 0.415
110 1814 16.42 45 0.415
195 1815 29.11 0.414
85 1816 12.69 0.410
155 1817 23.14 0.426
135 1818 20.15 0.441
135 1819 20.15 0.435
85 1820 12.69 0.432
145 1821 21.65 0.446
65 1822 9.70 0.450
65 1823 9.70 0.455
65 1824 9.70 0.450
220 1825 32.84 0.446
45 1826 6.72 0.451
65 1827 9.70 0.447
75 1828 11.20 0.456
35 1829 5.22 0.450
75 1830 11.20 0.444
55 1831 8.21 0.438
45 1832 6.72 0.438
165 1833 24.63 0.438
120 1834 17.91 0.452
110 1835 16.42 0.452
105 1836 15.67 0.459
95 1837 14.18 0.444
100 1838 14.93 0.443
145 1839 21.65 0.467
210 1840 31.35 0.482
40 1841 5.97 0.493
145 1842 21.65 0.491
65 1843 9.70 0.490
45 1844 6.72 0.483
65 1845 9.70 0.477
70 1846 10.45 0.470
135 1847 20.15 0.452
110 1848 16.42 0.450
75 1849 11.20 0.448
135 1850 20.15 0.444
60 1851 8.96 0.432
95 1852 14.18 0.427
125 1853 18.66 0.424
100 1854 14.93 0.428
120 1855 17.91 0.424
85 1856 12.69 0.429
45 1857 6.72 0.429
85 1858 12.69 0.431
65 1859 9.70 0.436
125 1860 18.66 0.439
90 1861 13.44 0.480
220 1862 32.84 0.472
40 1863 5.97 0.458
50 1864 7.46 0.459
95 1865 14.18 0.453
110 1866 16.42 0.439
135 1867 20.15 0.455
140 1868 20.90 0.451
110 1869 16.42 0.456
55 1870 8.21 0.461
50 1871 7.46 0.468
75 1872 11.20 0.469
80 1873 14.84 0.470
129 1874 23.78 0.468
92 1875 18.93 0.482
143 1876 26.07 0.498
38 1877 5.54 0.510
124 1878 21.26 0.507
54 1879 11.35 0.499
118 1880 20.34 0.495
71 1881 13.13 0.497
69 1882 10.40 0.497
68 1883 12.11 0.494
240 1884 38.18 0.475
61 1885 9.21 0.462
147 1886 22.76 0.449
90 1887 13.82 0.451
118 1888 13.76 0.450
134 1889 19.78 0.457
206 1890 34.32 0.460
109 1891 13.33 0.462
79 1892 11.80 0.451
158 1893 26.27 0.438
49 1894 7.47 0.434
123 1895 15.37 0.434
62 1896 8.54 0.441
119 1897 16.83 0.447
50 1898 7.15 0.442
41 1899 5.51 0.424
64 1900 7.90 0.431
117 1901 16.41 0.442
72 1902 10.48 0.452
137 1903 19.75 0.450
61 1904 8.74 0.443
137 1905 19.07 0.447
134 1906 18.75 0.398
152 1907 19.20 0.394
88 1908 13.02 0.391
140 1909 17.92 0.390
95 1910 12.64 0.392
121 1911 17.36 0.391
82 1912 10.37 0.345
81 1913 13.45 0.346
163 1914 23.63 0.351
120 1915 17.04 0.342
131 1916 20.69 0.332
100 1917 14.49 0.333
92 1918 14.53 0.377
66 1919 9.20 0.381
97 1920 11.27 0.369
103 1921 14.23 0.350
150 1922 19.04 0.344
72 1923 10.14 0.349
53 1924 6.12 0.345
64 1925 7.94 0.358
115 1926 17.56 0.361
119 1927 17.76 0.366
69 1928 9.77 0.378
76 1929 12.98 0.391
82 1930 11.21 0.395
1931 12.78 0.397
1932 16.83 0.397
1933 11.75 0.397
1934 14.68 0.397
1935 21.63 0.400
1936 12.02 0.410
1937 22.35 0.418
1938 23.44 0.432
1939 18.74 0.434
1940 13.54 0.438
1941 35.60 0.443
1942 11.80 0.439
1943 19.65 0.439
1944 18.78 0.442
1945 10.87 0.436
1946 11.07 0.434
1947 13.08 0.434
1948 7.00 0.438
1949 7.73 0.450
1950 10.65 0.444
1951 7.47 0.442
1952 26.98 0.439
1953 9.76 0.443
1954 13.07 0.447
1955 12.79 0.462
1956 18.17 0.461
1957 10.66 0.466
1958 23.37 0.471
1959 6.13 0.475
1960 9.37 0.495
1961 5.59 0.506
1962 21.46 0.508
1963 10.88 0.478
1964 7.12 0.490
1965 15.57 0.494
1966 18.92 0.503
1967 22.84 0.511
1968 15.72 0.506
1969 27.81 0.505
1970 7.77 0.500
1971 12.09 0.499
1972 7.43 0.496
1973 21.14 0.487
1974 14.92 0.483
1975 14.35 0.489
1976 10.12 0.495
1977 11.67 0.497
1978 31.57 0.498
1979 19.29 0.522
1980 26.46
1981 8.98
1982 11.53
1983 33.63
1984 8.28
1985 12.38
1986 19.82
1987 5.61
1988 12.47
1989 8.34
1990 7.02
1991 16.03
1992 20.86
1993 27.36
1994 8.11
1995 24.37
1996 12.44
1997 12.85
1998 30.57
1999 9.08
2000 11.79
Average 15.02
1884 Max 38.18
1790 Min 1.49
Count 230
I don’t know why some insurance companies are so interested in the climate.
BusinessGreen 3 April 2009
“Insurers seize climate change opportunity with over 600 new products”
[my bold]
Catlin Arctic Survey sponsored by Catlin Insurance
“…I earned an ‘Extreme Denial’ label from Tamino.”
———————————————————————
Excellent! Wear it with pride 🙂
As wealth grows, so do the potential losses from any type event.
We have certainly grown wealthier “globally” over the last 50 years.
I found this an interesting interactive graphic.
http://ngm.nationalgeographic.com/2011/03/age-of-man/map-interactive
Chris B says: November 23, 2012 at 12:55 pm
How about Earthquakes? ( Graph at bottom)
http://www.johnstonsarchive.net/other/quake1.html
Earthquakes have very little to do with weather, i.e. weather is “the state of the atmosphere with respect to wind, temperature, cloudiness, moisture, pressure, etc.”
http://dictionary.reference.com/browse/weather
It is noteworthy that;
and :
As such, while I don’t think that Earthquakes belong on the “Extreme Weather” Reference Page. I did add both charts; Wm. Robert Johnston – JohnstonArchive.net – Click the pic to view at source[/caption]

Annual Energy Release in Earthquakes Magnitude 6.0 or Greater:
[caption id="" align="alignnone" width="564"]
Annual Worldwide Earthquake Deaths, Per Million Population:
to the draft WUWT Earthquake Reference Page.
Thank you
Now I know why the insurance industry is interested in the ‘weatherclimate’
PreventClimateChange was founded by John Rowlinson, the founder of PtS who are into property. Mr Rowlinson should get out of property sales as each sale promotes co2 output. Get off the grid and give your money to the ‘sinking’ Pacific islanders. He sounds like a Gore clone – do as I say and don’t do as I do.
http://www.pts.co.uk/
http://www.preventclimatechange.co.uk/aboutoursite.html
How do these idiots propose we prevent climate change????
Reduce our trace rise of the trace gas co2 (which has already done most of the warming that it can by itself)??? Bollocks. Positive feedback I’m still waiting after over 15 years of steady co2 output and a standstill in global mean temps.
Data is the enemy of warmest orthodoxy.
Warmist. Another auto spell crime.
justthefactswuwt says:
“Earthquakes have very little to do with weather, …”
To the extent that deep underground water can lubricate a fault line so that slippage occurs before more tension can build, there might be a low correlation between increased precipitation and more frequent, but less catastrophic earthquakes. Does anyone know of any research done on this?
Its worth repeating that a Munich Re employee (now ex-employee) was one of the climate “scientists” at the “28gate” meeting, that was cited by the BBC as their shameful justification for abandoning their Charter duty to remain unbiased with respect to AGW.
From
http://www.theregister.co.uk/2012/11/19/the_virus_that_ate_the_bbc/page3.html
Helen Boaden, the BBC’s director of news said she was particularly impressed by the testimony of a representative of the insurance industry at the 2006 seminar. For Boaden, this attendee’s belief that cost of climate change will increase carried enormous weight. This is an odd statement: since profit-seeking insurance companies pocket revenue from premiums, they materially benefit from the higher premiums that accompany predictions of catastrophic climate change. Without the warnings of catastrophe, there is no need for higher premiums, so it’s not an impartial observation.
It was an extraordinary thing to say. An accomplished and experienced factual editor, Boaden has first-hand experience of large corporate lobbying, and works for an organisation suspicious of big business. Yet for that moment, she suspended her judgement. It was the climate virus attacking, once again. Insurance company Munich Re set up a climate division and published some wildly alarming material before being disbanded this year.
And now we know who the “insurance man” was. He was actually a former insurance man called Andrew Dlugolecki, who was attached to the Climatic Research Unit at the Univesity of East Anglia. Tyndall director Mike Hulme described him as a lone gun: “An independent consultant close to the insurance and investment communities.” In 2002 he was promoting climate work sponsored by the UN Environment Program (UNEP), the IPCC’s parent, at the BBC.
http://www.ec.gc.ca/ouragans-hurricanes/default.asp?lang=en&n=23B1454D-1
Unnamed (October 28 to November 2, 1991)
The Storm
A strong extratropical low formed off the coast of Nova Scotia on October 28, 1991. The low moved southward and developed into an extratropical storm 625 kilometres south of Halifax. This storm made a counter clockwise loop and moved northeastward through Nova Scotia and Prince Edward Island. Meanwhile, out in the Atlantic on October 29th, a cold front encountered a dissipating Hurricane Grace and the storm weakened quickly. A new circulation was visible on the GOES photographs late on October 29th forming an extratropical low pressure centre. Moisture that was previously associated with Hurricane Grace moved north-northeastwards and combined with the new low pressure centre. At 1200 UTC on October 30th, this new storm reached its maximum intensity of approximately 975 millibars. At 0355 UTC on October 30th, a buoy 425 kilometres south-southeast of Halifax reported a peak wave height of 30.5 metres. This represents the highest wave height ever measured on the Scotian Shelf. The 30.5 metre max waves reported represent the physical limitations of the instruments on the buoy. The buoy was incapable of reporting a bigger number, so undoubtedly, the max waves were actually bigger.
After reaching peak intensity as an extratropical system, the low turned southward and the central pressure rose to 998 millibars on November 1st. This movement to the south brought the low over the warm waters of the Gulf Stream. At 1200 UTC on November 2nd, the storm was declared by the U.S. National Hurricane Centre to be of hurricane strength. The cyclone accelerated northeastward on November 2nd encountering the much colder waters of the continental shelf and began to weaken rapidly. By the time it reached the Nova Scotia coast near Halifax at 1400 UTC, its maximum sustained winds had diminished to near 40 knots.
Naming This Storm
By the time the tropical system had formed on November 2nd, the extratropical system was on the wane and conditions were improving on the coasts. It was felt by the Canadian Hurricane Centre and the U.S. National Hurricane Centre that naming or re-naming this storm would cause major confusion on the part of the media and the public. The storm is now referred to by meteorologists as ‘The Perfect Storm’, ‘The Unnamed Storm’, and ‘The Hallowe’en Storm’.
Damage
The Hallowe’en 1991 storm caused widespread damage along most of the east coast of North America from Florida to Newfoundland. Many boats, wharves, and seaside properties were damaged or destroyed. Beaches suffered extreme erosion and coastal roads were flooded and damaged. Four incidents took place offshore including the tragic loss of the Andrea Gail, a U.S. swordfishing boat whose normal fishing ground is near 44° North 56° West. On the 31st, she was reported overdue. In the ensuing search, debris from this vessel was found at Sable Island and the crew members were presumed drowned.
(Sandy Shmandy)
http://www.thestormking.com/Weather/Sierra_Snowfall/sierra_snowfall.html
..might be interesting to compare to other areas as well.
[“Denial blogs”? You don’t learn, do you? Read the site Policy for guidance. — mod.]
Michael says: November 23, 2012 at 1:47 pm
http://www.parc.ca/saskadapt/adaptation-options/theme-assessments/water-drought
The information on this site is provided by PARC Prairie Adaptation Research Collaborative whose motto is “climate science informing action”. A statement in the body of the work, “global climate scenarios suggest that we will experience deeper and longer droughts in the future” is contradicted by their own graph showing that the 3 most severe droughts in the past occurred between 1480 and 1570. The drought conditions of the 1930’s and 1980’s pale in comparison.
I’m afraid that the world of climate science is chock-full of this kind of logic. The information that they have in their own possession seems to hold little value when a larger more alarmist narrative has to be told.
@Kurt in Switzerland
Haha, Google Trends shows an unprecedented use of the word unprecedented (2004-12), and when you tick the forecast box, the forecast is for a further unprecedented increase.
http://www.google.com.au/trends/explore#q=unprecedented
Jimbo says: November 23, 2012 at 1:39 pm Reinhard Böhm – Austrian Central Administration For Meteorology (ZAMG) – Click the pic to view at source[/caption]
Here ya go…………..
Solid…
* scroll down a little on this page as I have given several other references which Antony added to his post as an “Update”.
http://wattsupwiththat.com/2012/05/27/another-paper-shows-that-severe-weatherextreme-weather-has-no-trend-related-to-global-warming/
I added a new Europe section, and included this Central Europe Pressure – Temperature – Precipitation chart:
[caption id="" align="alignnone" width="578"]
from the original article and added an Additional Research section at the end:
Anthony Watts – WattsUpWithThat.com
“See also my compilation of extreme weather trends (not).”
Floods – no increase in frequency, less intense
Extreme weather events – no trend
Global precipitation – no trends
Rate of sea level rise – deceleration over 80 years
Weird weather – no trends
Forest fires – decreasing frequency
Tropical Pacific sea level rise – fell
“Little change in global drought over the past 60 years”
http://www.nature.com/nature/journal/v491/n7424/full/nature11575.html
“Dr. Ryan Maue releases new hurricane frequency data showing a negative trend in the last 30 years”
http://wattsupwiththat.com/2012/10/01/dr-ryan-maue-releases-new-hurricane-frequency-data-showing-a-negative-trend-in-the-last-30-years/
http://www.agu.org/journals/gl/gl1114/2011GL047711/2011GL047711.pdf
“U.S. tornado activity near low point in modern record”
After one of the busiest years for tornadoes in 2011, tornado numbers in 2012 have come crashing down to historic lows.
In 2011, there were 1692 twisters – second most on record. This year, only 882 tornadoes have touched down. (Tornado records date back to 1950*).
http://www.washingtonpost.com/blogs/capital-weather-gang/post/about-face-tornado-activity-near-low-point-in-modern-record/2012/11/14/9ee31a2a-2e86-11e2-89d4-040c9330702a_blog.html
All are now covered within the “Extreme Weather” page.
“New paper finds the highest storm activity is associated with cold periods”
http://hockeyschtick.blogspot.com/2012/11/new-paper-finds-highest-storm-activity.html
“We find that high storm activity occurred periodically with a frequency of about 1,500 years, closely related to cold and windy periods diagnosed earlier”
http://www.nature.com/ngeo/journal/vaop/ncurrent/full/ngeo1619.html#ref1
Yes, interesting, changes to storminess absent anthropogenic CO2, who would have imagined?… 🙂
Added to the Additional Research section:
Thank you
I wonder what Leland Palmer believes that skeptics ‘deny’?
Palmer’s mindless pejorative name-calling takes the place of any rational thought. He is the typical ignorant climate alarmist, with no room for honest science in his screwed up belief system. True Believers like Palmer have bought into evidence-free propaganda that CO2 is a problem, but they have zero supporting scientific facts for their belief. There is no evidence showing that CO2 is any kind of a problem. None. The only empirical evidence available shows that CO2 is harmless, and beneficial to the biosphere.
The scary thing is that people like Leland Palmer are actually allowed to vote. No wonder we have such enormous social problems. The lunatics have got control of the asylum, as the last election makes clear.
I’ve had relatives in NY respond negatively to my links to sites (links to source references from WUWT, Steve Goddard, etc) that counter the globaloney warming scare. They come back to me stating that having experienced flooding from hurricanes on Long Island twice in 2 years just couldn’t be coincidence. I’m simply amazed at how college educated people can lack even the beginnings of analytic thought. I send them links to the data graphs from NOAA , the University of Colorado and other sites showing hurricane ACE or frequency trends or sea level trends that are at odds with the alarmist spin. They usually ignore the actual data and simply want to repeat the media’s alarmist spin. It is so disheartening. The alarmists have a fascinating quasi-religious hold on their minds. I see people here and elsewhere put down this closed-mindedness as a type of religious dogmatism. I object to this comparison as I am a Christian and the quality of thought and careful reflection found in the writings of Christian theology and apologetics is by far so superior to that of these green ideologues as to be incomparable. Anyway, the fight for simple sanity continues. I look forward to your further efforts, Consolidating information even more would be very helpful. Thank you, Anthony and company.
noaaprogrammer says: November 23, 2012 at 5:03 pm
justthefactswuwt says:
“Earthquakes have very little to do with weather, …”
To the extent that deep underground water can lubricate a fault line so that slippage occurs before more tension can build, there might be a low correlation between increased precipitation and more frequent, but less catastrophic earthquakes. Does anyone know of any research done on this?
According to the U.S. Geological Survey:
However, this New Scientist article states that;
and from the University of Miami Rosenstiel School of Marine & Atmospheric Sciences:
However, regardless if weather might be able to influence the occurrence seismic activity, a seismic event is fundamentally not a weather event. I would amend my statement above to say that “Earthquakes have very little to do with causing or influencing weather”.
Thank you
Here are a few possible non-natural causes of increasing insurance claims:
1. Greatly increased pleasure boat ownership and average pleasure boat value. (A proxy for this would be number and size of marinas and size of average berth in marinas. Another proxy would be annual sales of such boats, probably available from the Dept. of Commerce and/or some trade association.)
2. Increased use of frozen food, and ordinary food like meats stored in a freezer–which goes bad in an outage. Plus larger modern refrigerators store more perishable items, enabling people to shop less frequently, but putting more value at risk.
3. Increased issuance of official evacuation orders, and increasing compliance with them. These save lives but, with residents no longer in place, there’s less likelihood of vulnerable household goods being sheltered or moved to a safer location within the house during a storm or flood, of broken windows being patched up, etc. Also, there’s greater vulnerability to looting.
4. Increasing forest grow-back in the NE of the US may have made electrical lines more vulnerable to falling trees.
5. Possible lesser strictness with insurance claims by insurers, owing to one or both of these factors: A) Greater off-loading of risk onto reinsurers; B) Legally mandated standards for payment of claims. (I.e., in the litigious US, homeowners whose claims have been denied must have sued and established case law that certain rules of thumb insurers used to use to estimate the value of losses, or allowable types of claim, were too ungenerous. I think this could be a big part of the explanation, and one that outsiders would likely overlook. But my thesis is supported by the much greater increase in insurance payouts in the litigious US compared to other regions, per Munich Re’s figures. I urge researchers to probe this by, as a first step, interviewing veteran insurance agents to see if there’s anecdotal support, then checking trade journals of the industry to see if this trend was reported on in them. One clue might be the cost to insure per unit insured. If the cost of insurance is higher in the areas of the US that haven’t had increased disasters in recent decades, this could point to lesser strictness with claims as an explanation.)
6. Possible higher-insured-house-values, due to pressure from mortgage holders (bankers, etc.). If the bank now wants, say, 90% of a house’s value to be insured compared to 50% 40 years ago, then claims will increase.
7. Possible interaction between creeping inflation and fixed deductibles. If mortgage holders set a standard 40 years ago of $1000 for deductibles (say), or if that is what is habitually chosen, then inflation will ensure that damages over the deductible amount will increase over time.
8. Possible increasing readiness of insureds to file a claim, owing to greater sophistication about interacting with such paperwork, greater ease of doing so (e.g., online), greater assistance from emergency management agencies, more sources of information online, and greater litigiousness and lesser stoical acceptance of fate, etc.
The “inflation” referred to is the increasing number of small tornados that are detected in recent years. What NOAA has done is to figure out the average ratio of minor to major storms in the current period, and then to upwardly adjust the number of small tornados presumed in past periods.
I visited the Yahoo UK site today and read stories about the flooding there. A couple of commenters remarked that the main cause of flooding is the elimination or reduction of river dredging in the past decade or more. In UK comments I’d read in past years the same complaint had been made–and the finger had been pointed at greenies, who don’t want the minnows disturbed (and who might, IMO, enjoy seeing persons who have sacreligiously settled in a flood palin to get their just deserts). (And, or course, at penny-pinching, short-sighted agencies and local governments. This apparently was what happened with the power company (government-owned) in Long Island).
Of course, they don’t want to blame themselves for settling in a vulnerable area or filing to harden their house against water intrusion. They want the finger of blame to point elsewhere. Just like the unprepared politicians above them.
Oops–failing, not filing.
PS: A few months ago, to gather ammo for an online scuffle I was in, I started reading books on critical thinking, fallacies, and logic. It’s terrific stuff. Such courses should be required in every grade–they’re more important than anything else.
Michael says: November 23, 2012 at 1:47 pm Drought Frequency and Severity - 1402 to 2002") SaskAdapt – the Prairie Adaptation Research Collaborative at the University of Regina – Click the pic to view at source[/caption]
SaskAdapt – the Prairie Adaptation Research Collaborative at the University of Regina – Click the pic to view at source[/caption]
Here is the chart.
http://www.parc.ca/saskadapt/adaptation-options/theme-assessments/water-drought
Small regional coverage, i.e. the Prairie Provinces (Alberta, Saskatchewan, and Manitoba Canada), but the length of the record, i.e. 1402 to 2002, makes it noteworthy. Added at the bottom of the North American section:
“Prairie Provinces (Alberta, Saskatchewan, and Manitoba Canada) Drought Frequency and Severity – 1402 to 2002”:
[caption id="" align="alignnone" width="578"]
Thank you
Jimbo says: November 23, 2012 at 1:56 pm
http://onlinelibrary.wiley.com/doi/10.1002/qj.776/full
August 2011
“Fluctuations in some climate parameters
Abstract
There is argument as to the extent to which there has been an increase over the past few decades in the frequency of the extremes of climatic parameters, such as temperature, storminess, precipitation, etc, an obvious point being that Global Warming might be responsible. Here we report results on those parameters of which we have had experience during the last few years: Global surface temperature, Cloud Cover and the MODIS Liquid Cloud Fraction. In no case we have found indications that fluctuations of these parameters have increased with time.”
http://www.sciencedirect.com/science/article/pii/S1364682611000319
Added to Additional Research section:
A.D. Erlykina, B.A. Lakenb and A.W. Wolfendalea – Fluctuations in some climate parameters – Journal of Atmospheric and Solar-Terrestrial Physics:
Paper – http://www.sciencedirect.com/science/article/pii/S1364682611000319
“There is argument as to the extent to which there has been an increase over the past few decades in the frequency of the extremes of climatic parameters, such as temperature, storminess, precipitation, etc, an obvious point being that Global Warming might be responsible. Here we report results on those parameters of which we have had experience during the last few years: Global surface temperature, Cloud Cover and the MODIS Liquid Cloud Fraction. In no case we have found indications that fluctuations of these parameters have increased with time.”
Thx
This really is not fair. Asking for Just The Facts!!!
Sad, but true. The Warmists’ flimsy narratives are vulnerable to readily available facts.
Hi Roger:
“PS: A few months ago, to gather ammo for an online scuffle I was in, I started reading books on critical thinking, fallacies, and logic. It’s terrific stuff. Such courses should be required in every grade–they’re more important than anything else.”
Yes, at least around here.
Around here, the ability to argue endlessly is certainly more important than a sense of vision, for example.
Certainly, the ability to argue endlessly is more important than the ability to see a melting icecap.
Roger Knights says:
November 23, 2012 at 9:36 pm
“… Such courses should be required in every grade–they’re more important than anything else.”
I agree wholeheartedly. The three Rs. Then the nuances of argument, logic and scientific method. Then… whatever you like, as you are armed for life.
The activists believe we should stop at two Rs and delegate everything else.
To Laura’s dad (Mr Palmer) – your vision may be correlated to your dread of ice melt? What if we don’t wish to become infected with your fear(s)?
Take a look at what I’ve just posted here:
http://wattsupwiththat.com/2012/11/23/climate-ugliness-goes-nuclear/#comment-1155993
Anthony
My friend Heinz Thieme – you should have him on your link list –
has an Internet page with (but sorry these are in German – but the pictures are self explaining):
Historic high water marks
Frequency of hurricanes and typhoones since 1990
Eleven-Touwn-Tour ( Elfstedentocht ) skate races in Holland on frozen channels
and two hints from museums for Climate change in recent earth history
The information is very valuable!
I think if we ask him, he may be willing to translate this.
Historic high water marks
http://real-planet.eu/hochwasser.htm
http://real-planet.eu/
Juergen Michele
Chris Landsea did some good work showing hurricanes correlate with AMO
“These multi-year swings in ocean temperature are nearly an exact match to the adjusted number of tropical storms, adjusted hurricanes, U.S. hurricanes, and normalized U.S. hurricane damages. When stratified by the Atlantic Multidecadal Oscillation, there is a doubling in the number of major hurricanes, a 50% increase in the frequency of U.S. landfalling major hurricanes, and over three times as many Caribbean hurricane strikes between the warm and cool phases.”
http://www.aoml.noaa.gov/hrd/Landsea/gw_hurricanes/
Gee, how about snow?
accuweather: endless winter for Alask’s mountains
CHINA: Worst snow in 50 years damages 400 greenhouses
Graphs for Snow Cover in the month of October. This would be the start of cooling in the Northern Hemisphere since Arctic Sea Ice starts increasing in mid September. October would be the most sensitive to the rate of change in heating or cooling of the NH.
NOAA Norther Hemisphere snow cover
North American Snow Cover
Eurasia Snow Cover
Northern Hemisphere Sea Ice extent
Southern Hemisphere Sea Ice extent
Can we predict the duration of an interglacial?
“…thus, the first major reactivation of the bipolar seesaw would probably constitute an indication that the transition to a glacial state had already taken place.”
P. C. Tzedakis, E.W. Wolff, L. C. Skinner, V. Brovkin, D. A. Hodell, J. F. McManus, and D. Raynaud
WUWT discussion of paper: http://wattsupwiththat.com/2012/10/02/can-we-predict-the-duration-of-an-interglacial/
PDFs of the paper:
http://www.clim-past.net/8/1473/2012/cp-8-1473-2012.pdf
http://wattsupwiththat.files.wordpress.com/2012/10/cp-8-1473-2012.pdf PDF raw
http://wattsupwiththat.files.wordpress.com/2012/10/cp-8-1473-2012-hlt.pdf PDF highlighted
Roger Knights
Those are valid points about the rising cost of insurance. In our own experience I have noticed our family is simply buying more insurance; more things to insure at higher values and we seem less willing to carry any of the risk on our own shoulders. My late father had an opinion about insurance and people like us: “on Sunday they place their faith in providence, on Monday they buy more insurance”.
Ah, it looks like Leland Palmer finally got past the moderators, as in, he obeyed site policy. And he ended with:
“Certainly, the ability to argue endlessly is more important than the ability to see a melting icecap.”
So he’s reduced the level of insult from near-slanderous to merely condescending.
Leland, if I may address you thus, it’s good to see you here, because it does at least mean you are not blindly ignoring the fact of really well founded scepticism. But regarding any melting icecap, yes, we are aware of that (it’s late spring in Antarctica now so the icecap is, thank goodness, now melting from its “record” high extent). And yes I know you mean the Arctic icecap, and here we do actually like to see data and reasons and scientific consequences and balanced comparisons with past behaviour. The Arctic icecap, like season for like season, is certainly in decline on average, but has this never happened before? Do you find it interesting that in Greenland ice reduction is leading to archaeological finds of items dated 800-1000 years ago?
Rich.
Is NOAA starting to see real facts are demanded not just computer modeling using faulty data sets? NASA has also pulled in their nasty attitude – what is going on?
We should have all known that the hypothesis of AGW was going to fall apart when the lead “SCIENTISTS” set out their findings for peer review but withheld the base data and the details of the computer model as the information was “PROPRIETARY” and so could not be made available?? So, then invent “CONSENSUS OF SCIENTISTS” and declared the PROOF.
US state max temp records – most set in the 1930’s.
http://notalotofpeopleknowthat.wordpress.com/2012/11/17/us-maximum-temperature-records-by-state/
US state 24 hour precipitation records – last decade below average.
http://notalotofpeopleknowthat.wordpress.com/2012/11/16/extreme-rainfall-events-in-the-usa/
No trend in extremely wet or dry years by US regions.
http://notalotofpeopleknowthat.wordpress.com/2012/04/15/is-our-weather-becoming-more-variable/
NOAA’s Martin Hoerling really said all there was to say, when he responded to Rahmstorf’s paper “A Decade of Weather Extremes”, a few months ago.
Among his choice comments
Exaggerated language, and many unsubstantiated assertions. For instance, in what manner did the last decade experience an “unprecedented” number of extreme weather events? Note that the increase in heat waves was largely balanced by a decrease in cold waves—-
Very few of the [cases of extreme weather listed in the paper] have undergone a scientific investigation of contributing factors, let alone human impacts. I believe that a read of the Lewis and Clark journals would reveal an impressive list of extreme weather also…. so what is one to make of this list for the 2001-2011 period provided in this Perspective by Coumou and Rahmstorf. The fact is that extremes happen, have happened, and will continue to happen. For some, their character, preferred phase, and intensity may be changing (aside from temperature extremes, the detection and attribution evidence to date is weak).
http://notalotofpeopleknowthat.wordpress.com/2012/04/14/rahmstorfs-claims-of-increasing-extreme-weathera-damning-put-down-by-noaa-expert/
It would be helpful to have links to the actual numeric data, not just the charts. Maybe it’s just because I was a math major, but I like to know the precise values and trends.
“Extreme Weather” Reference Page ???? You mean this . . . . coming from those who think tenths of a degree in temperature are extreme???? . . . coming from those who think parts per million of an air component are extreme??? . . . . coming from those who think millimeters of sea level rise compared to the total depths of the oceans are extreme????
The only extremes are the insurance losses, and that’s because the fired all the good acturaries, and hired GIGO experts . . . . . (sadly, a long time ago!)
Laurie,
I like that – lets us think, does water expand when heating or cooling? Humm rising sea level?
CGN writes: …the collective anxiety that is clearly felt by a section of the population with regard to the climate issue.
I think the “collective anxiety” is truly felt by only a small percentage and it’s the main stream media that exaggerates/amplifies it.
justthefactswuwt,
Don’t thank me thank Anthony Watts for opening my eyes and previously posting many of the references which I recalled.
I had been thinking about an extreme weather page for WUWT for some time so I was very happy to see it put up. A one-stop-shop is so time saving. Please consider later breaking it down into:
hurricanes, tornadoes, floods, fires etc.
Good luck.
Neil Jordan says: November 23, 2012 at 3:43 pm John Christy, Director of the Earth System Science Center at the University of Alabama in Huntsville – Click the pic to view at source[/caption]
Please consider adding the following as a crowdsource reference – Southern California Rainfall from 1769 to 2000. I submitted this reference earlier in response to Dr. John Christie’s WUWT February 2, 2012 WUWT article at
http://wattsupwiththat.com/2012/02/18/christy-on-sierra-snowfall-over-the-last-130-years-no-trend-no-effect-from-co2/
I am hesitant to include too many local charts as they may cause confusion and draw attention from the larger scale charts. If there is sufficient interest and material I might create a Local “Extreme Weather” page. With this said, I liked the John Chritie’s Snowfall graph and want to add more info on “Extreme Snowfall”, whatever that means, so I added it at the bottom::
Western Slope Sierra Snowfall Average – 1979 – Present
[caption id="" align="alignnone" width="578"]
Thank you
highflight56433 says: November 23, 2012 at 7:10 pm University of California, Berkeley – Central Sierra Snow Laboratory – Click the pic to view at source[/caption]
http://www.thestormking.com/Weather/Sierra_Snowfall/sierra_snowfall.html
..might be interesting to compare to other areas as well.
Added for now, for the reason you suggest. It is another candidate for the “local” “extreme weather” page:
Central Sierra Donner Summit Snowfall and Snowpack 1879 – 2011
[caption id="" align="alignnone" width="578"]
Thank you
justthefactswuwt says:
November 23, 2012 at 12:08 pm
I am hesitant to use “damage” as a proxy for weather extremes, as “damage” is biased by a multitude of non-weather factors, including population movement/growth, building codes, inflation, preparatory time, coastal defense measures, etc., and thus the results are heavily dependent on normalization procedures, e.g.:
========================================================
When I saw the wildfire/acres per year graph I was reminded that there are man-made contributors.
Environmentalist fight the logging of deadwood from forest. More fuel for a wildfire.
Environmentalist prevent the clearing of brush from homes in case a kangaroo rat might want to move in. More fuel for a wildfire.
I’m sure others can think of more ways that the effects of normal weather (and yes, severe thunderstorms, blizzards and hurricanes are all normal, if undesirable, weather) has been made “extreme” by man-made nonsense.
The posting of the snowfall average has reminded me of my own record l have kept of the date of the first snowfall of the winter since 1977 here in my local area in the UK.
They are as follows.
77/78 21st Nov
78/79 27th Nov
79/80 19th Dec
80/81 28th nov
81/82 8th Dec
82/83 16th Dec
83/84 11th Dec
84/85 2nd Jan
85/86 12th Nov
86/87 21st Nov
87/88 22nd Jan
88/89 20th Nov
89/90 12th Dec
90/91 8th Dec
91/92 19th Dec
92/93 4th Jan
93/94 20th Nov
94/95 31st Dec
95/96 17th Now
96/97 19th Nov
97/98 2nd Dec
98/99 5th Dec
99/00 18th Nov
00/01 30th Oct
01/02 8th Nov
02/03 4th Jan
03/04 22nd Dec
04/05 18th Jan
05/06 28th Nov
06/07 23rd Jan
07/08 23rd Nov
08/09 23rd Nov
09/10 17th Dec
10/11 25th Nov
11/12 5th Dec
12/13 27th Oct
Just like the snowfall amounts they has been no general trend over the years.
( please note)
That these dates are only for my local area in North Lincolnshire, England.
“A Chronological Listing of Early Weather Events 6th ed” James A. Marusek
http://www.breadandbutterscience.com/Weather.pdf
And another (similar) “A Chronology of Notable Weather Events” Douglas V. Hoyt
http://www.breadandbutterscience.com/climatehistory.pdf
Roger Knights says:
November 23, 2012 at 9:19 pm
Mark Ro says:
November 23, 2012 at 12:18 pm
http://www.spc.noaa.gov/wcm/torgraph-big.png
NOAA’S Inflation Adjusted Annual Tornado Running Total ??
The question marks were for Justhtefacts consideration and not due to misunderstanding. But thanks just the same:)
Munich Re is dancing to the tune of the EUs policies on AGW – accentuate the negatives, downplay the positives. In other words, it is not merely economic self-interest at work, as Anthony points out in his post, but actual political malice.
Who guards the EU-AGW guardians? NOT private economic interests! (I wish I knew all of the nefarious details about how this works. Perhaps bloggers, and company, like Andrew Montfort can help out here with some cross posting?)
The ideal customer for an insurer is one with maximum fear but minimum real risk. People that believe in CAGW are perfect.
When I was a kid, flood insurance was not issued for places that flooded a lot (and cost a lot if near one of them) so folks didn’t do things like build homes on barrier islands of sand in hurricane track country. Then the Federal Government decided to subsidize flood insurance. Folks flocked to all sorts of flood prone areas to build ( a local creek channel in particular got a lot of homes).
Now we have more ‘reported floods’ and insurance claims…. so it must be the weather? Naw…
In about 1956 or 58 or so we had dramatic floods near my home town. Nothing like it since. (There were miles of flood water as the land is essentially flat adobe clay). We also had snow dramatically deep in the Sierra Nevada. Nothing as deep since. BTW, I’m pretty sure neither was declared a ‘disaster’ as they just didn’t bother for that stuff then.
The 1800s had some much more dramatic flooding in the Central Valley of California. Darned near the whole thing flooded. Nothing even close since.
There are weather records going back hundreds of years with much more extreme events on them than anything lately. We’ve had about 50 years of exceptionally mild weather.
@ profitup10 says:
November 24, 2012 at 1:32 pm
“””Laurie,
I like that – lets us think, does water expand when heating or cooling? “”””
hmmmm! Both!! . . . and your point is:??
http://www.google.com/#hl=en&sugexp=les%3Bcdymh&gs_nf=3&gs_mss=water%20expand%20when%20heating%20or%20cooling&cp=13&gs_id=1k&xhr=t&q=water+expands+when+heating+or+cooling&pf=p&tbo=d&sclient=psy-ab&oq=water+expands+when+heating+or+cooling&gs_l=&pbx=1&bav=on.2,or.r_gc.r_pw.r_qf.&fp=bc8868a73da6ee0e&bpcl=38897761&biw=1152&bih=562
Anthony,
Perhaps we need another ‘quick reference’ section to counter the “unprecedented” meme. Steven Goddard does an amazing job scouring old newspaper reports.
http://stevengoddard.wordpress.com/
but a ready-reference would be useful.
Ron C. says: November 24, 2012 at 6:30 am National Oceanic and Atmospheric Administration (NOAA) – Atlantic Oceanographic and Meteorological Laboratory – (AOML) – Click the pic to view at source[/caption]
Chris Landsea did some good work showing hurricanes correlate with AMO
http://www.aoml.noaa.gov/hrd/Landsea/gw_hurricanes/
Yes, added US Hurricanes 1851 – 2010:
[caption id="" align="alignnone" width="578"]
Thank you
Jimbo says: November 24, 2012 at 2:23 pm
I had been thinking about an extreme weather page for WUWT for some time so I was very happy to see it put up. A one-stop-shop is so time saving. Please consider later breaking it down into:
hurricanes, tornadoes, floods, fires etc.
Done, thank you.
Gail Combs says: November 24, 2012 at 6:54 am Rutgers University – Global Snow Lab (GSL) – Click the pic to view at source[/caption]
 Rutgers University – Global Snow Lab (GSL) – Click the pic to view at source[/caption]
 Department of Earth, Ocean, and Atmospheric Science – Florida State University – Click the pic to view at source[/caption]
 Florida State University – Department of Earth, Ocean, and Atmospheric Science – Click the pic to view at source[/caption]
 Florida State University – Department of Earth, Ocean, and Atmospheric Science – Click the pic to view at source[/caption]
 Florida State University – Department of Earth, Ocean, and Atmospheric Science – Click the pic to view at source[/caption]
Gee, how about snow?
I added:
Northern Hemisphere Winter Snow Cover – 1967 to Present
[caption id="" align="alignnone" width="578"]
Eurasian Winter Snow Cover – 1967 to Present
[caption id="" align="alignnone" width="578"]
Northern Hemisphere Snowcover with 1995 – 2009 Climatology
[caption id="" align="alignnone" width="578"]
5 Year Northern Hemisphere Snowcover with 1995 – 2009 Climatology
[caption id="" align="alignnone" width="578"]
10 Year Northern Hemisphere Snowcover with 1995 – 2009 Climatology
[caption id="" align="alignnone" width="578"]
20 Year Northern Hemisphere Snowcover with 1995 – 2009 Climatology
[caption id="" align="alignnone" width="578"]
Thank you