
Guest post by Bob Tisdale
I was visiting family in the Northeast U.S. when Sandy came ashore, so I was without power for most of last week. Since my return home, I’ve been catching up with all of the nonsense surrounding Hurricane/Extratropical Storm/Hybrid Storm Sandy. There have been hundreds of articles and blog posts that include references to climate change, global warming, and the warming oceans and their assumed impacts on Sandy. Yet no one has bothered to plot the long-term sea surface temperature anomalies for Sandy’s track. So we’ve had lots of baseless claims. Will the authors of those posts and articles feel foolish when they discover sea surface temperatures for Sandy’s path haven’t warmed in 70+ years? For those reading this post, who have access to the authors of those articles or the blog posts, feel free to leave them a link or two to this post.
The most absurd claim was made by Brian Reynolds in his post How a Warm Earth fueled Hurricane Sandy at The Energy Collective, which heralds itself as “The world’s best thinkers on energy and climate”. It was the topic of discussion in the post Frankenstorm-itis: Five degrees of Separation from Reality and Eleventy Gazillion Joules Under the Sea by David Middleton at WattsUpWithThat.
Apparently the “world’s best thinkers on energy and climate” rely on thought and not on data, because Brian Reynolds’s preposterous claim is clearly fantasy:
The Atlantic ocean [sic] is five degrees warmer than is was when most of you were born. Let that sink in for a minute. The entire Atlantic ocean [sic] averages five degrees warmer.
Oy! Five degrees.
He must believe most of us were born just after the last glacial period. That’s older than Mel Brooks’ 2000 Year Old Man.
What could that “best thinker” have been thinking? Then when he was questioned about it, Brian Reynolds wrote in a comment:
The point of this piece isn’t the exact temperature of the ocean, which is admittedly hard to calculate (You’ll note in reading one other comments that you don’t agree with me or one another after all) but rather that the earth isn’t a closed system.
Actually, Brian, you can’t dismiss your error and state that it’s pointless. You wouldn’t have written what you wrote if you thought it was pointless. Also, sea surface temperature data is available to the public through multiple resources (NOAA’s NOMADS website or the KNMI Climate Explorer) so there are no calculations involved. All you have to do is enter coordinates and the websites produce the data. If you had done that with a long-term sea surface temperature dataset like the Hadley Centre’s HADISST, you would have discovered that the sea surface temperatures anomalies of Sandy’s storm track (12N-40N, 80W-70W) haven’t warmed since 1938, when the another super storm hit the Northeast U.S. See Figure 1.
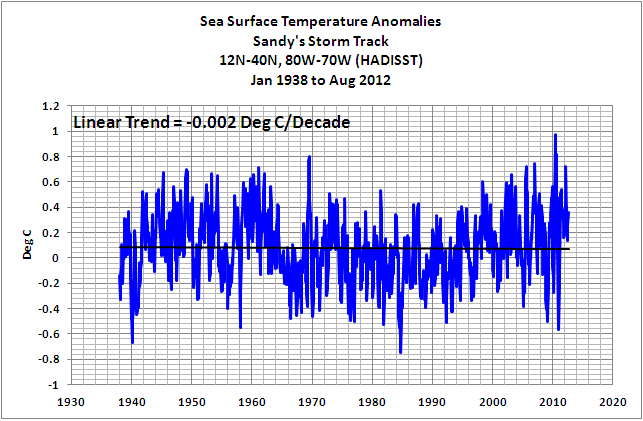
Figure 1
The coordinates are based on the storm-track map from the Jacksonville.com, which I’ve annotated in Figure 2.
Figure 2
For the extratropical portion of the path (24N-40N, 80W-70W), Figure 3, the sea surface temperature anomalies have actually cooled since 1938. It’s not a great deal of cooling, but the trend is clearly negative.

Figure 3
THERE IS NO EVIDENCE OF AN ANTHROPOGENIC GLOBAL WARMING SIGNAL IN THE SATELLITE-ERA SEA SURFACE TEMPERATURE DATA
The satellite-era sea surface temperature records indicates El Niño and La Niña events are the primary causes of the warming of global sea surface temperature anomalies over the past 30 years, not manmade greenhouse gases. I’ve searched sea surface temperature records for more than 4 years, and I can find no evidence of an anthropogenic greenhouse gas signal. That is, the warming of the global oceans has been caused by Mother Nature, not anthropogenic greenhouse gases.
I’ve recently published an e-book (pdf) about the phenomena called El Niño and La Niña. It’s titled Who Turned on the Heat? with the subtitle The Unsuspected Global Warming Culprit, El Niño Southern Oscillation. It is intended for persons (with or without technical backgrounds) interested in learning about El Niño and La Niña events and in understanding the natural causes of the warming of our global oceans for the past 30 years. Because land surface air temperatures simply exaggerate the natural warming of the global oceans over annual and multidecadal time periods, the vast majority of the warming taking place on land is natural as well. The book is the product of years of research of the satellite-era sea surface temperature data that’s available to the public via the internet. It presents how the data accounts for its warming—and there are no indications the warming was caused by manmade greenhouse gases. None at all. The same holds true for Ocean Heat Content data. The warming of the global oceans to 700 meters since 1955 can also be easily explained through natural variables.
Who Turned on the Heat? was introduced in the blog post Everything You Every Wanted to Know about El Niño and La Niña… …Well Just about Everything. The Updated Free Preview includes the Table of Contents; the Introduction; the beginning of Section 1, with the cartoon-like illustrations; the discussion About the Cover; and the Closing.
Please buy a copy. (Credit/Debit Card through PayPal—you don’t need a PayPal account). It’s only US$8.00.
You’re probably asking yourself why you should spend $8.00 for a book written by an independent climate researcher. There aren’t many independent researchers investigating El Niño-Southern Oscillation or its long-term impacts on global surface temperatures. In fact, if you were to perform a Google image search of NINO3.4 sea surface temperature anomalies, the vast majority of the graphs and images are from my blog posts. Try it. Cut and paste NINO3.4 sea surface temperature anomalies into Google. Click over to images and start counting the number of times you see Bob Tisdale.
By independent I mean I am not employed in a research or academic position; I’m not obligated to publish results that encourage future funding for my research—that is, my research is not agenda-driven. I’m a retiree, a pensioner, with a background in fluid dynamics. The only funding I receive is from book sales and donations at my blog. Also, I’m independent inasmuch as I’m not tied to consensus opinions so that my findings will pass through the gauntlet of peer-review gatekeepers. Truth be told, it’s unlikely the results of my research would pass through that gauntlet because the satellite-era sea surface temperature data contradicts the tenets of the consensus.
SOURCE
The Sea Surface Temperature anomaly data used in this post is available through the KNMI Climate Explorer website.
Thanks, Anthony!
The temperature hasn’t changed?
But I just read Trenberth saying that 0.6 degrees of the warming was anthropogenic. When you calculate everything you get lebenty-leben gazillion Joules of raw hurricane energy.
Don’t tell me all that heat has gone missing again! If you lose something once it’s an accident. Twice it’s incompetence.
Bob,
How does this fit with the map you showed of SST anomalies for October? They look pretty high near where Sandy approached the shore.
Excellent info Bob!
I would also personally attest that the book referenced is packed with knowledge and worth every cent. .
I am curious if they maintained the pressure record of 145.5mb to best the prior storms 146mb
Thanks for all you do Bob!
Lewandowsky has pitched in again to help all the stupid people who focus on scientifically irrelevant anecdotes such as above, rather than on data …
A storm of stupidity? Sandy, evidence and climate change
http://theconversation.edu.au/a-storm-of-stupidity-sandy-evidence-and-climate-change-10492?utm_medium=email&utm_campaign=Latest+from+The+Conversation+for+6+November+2012&utm_content=Latest+from+The+Conversation+for+6+November+2012+CID_d1ec84508271ad6eeabcc783d557a308&utm_source=campaign_monitor&utm_term=A%20storm%20of%20stupidity%20Sandy%20evidence%20and%20climate%20change
“There is no longer any reasonable doubt that climate change is happening all around us. There is also no doubt that ideology is the principal driver of climate denial.”
Bob, very nice work. A pound of data is worth more than ten tonnes of computer output.
w.
According to Trenberth, the missing heat is in the deep dark oceans where it can’t be measured (even by Argos).
aka “The dog ate my homework.”
Bob, a well done study,,,, only one tiny objection, you quote:
””’Apparently the “world’s best thinkers on energy and climate” rely
on thought….”’??
I am pretty sure that their thought was completly turned off, if there is
any left of it which is not even proven….
Spreading Warmist hoax does not need any thoughts…., you need “willing”
and not “thoughtful” personell, a big difference….JS
Bob,
Clearly, you aren’t up-to-speed on “climate science” and those AGW supporters who write about it whether or not they claim to be scientists. Making things up is the norm. It appears that Brian Reynolds just makes things up. This behavior is not new, but it does continue. Have you seen the recent post by Jo Nova? A Climate Commission graph with an 11 year running average seems a bit flakey. Just made up stuff – and I haven’t seen that anyone knows what was done.
~~~~~
News and political folks are making a big deal about the damage and deaths near the beach of Staten Island. Some died because they would not (or maybe could not) get out (without help). Even those not familiar with the area can get a look via ‘Street View’ on Google Earth. Houses and apartments line streets that are just slightly above sea level. They don’t look like the traditional Queenslander or a modern version:
http://www.powersiteblog.com/wp-content/uploads/2011/05/house_on_stilts.jpg
Nick,
It fits because of the amount of variability in local sea surface temperatures. For example, look at the temps in Bob’s first chart between 2010 and 2012; in that short span of time the temp varied from about -0.6 to +1.0. So is the current sea surface temperature off the shore of New Jersey anomalously high? Yes, and that could very well have contributed to Sandy’s strength. But that temperature is due to the variability, not a long term trend.
Nick Stokes says: “How does this fit with the map you showed of SST anomalies for October? They look pretty high near where Sandy approached the shore.”
HADISST updates lag by a few months, but it just so happens I prepared graphs with the HADISST since Jan 1870 and Reynolds OI.v2 data since Nov 1981, and with a horizontal line to show the Reynolds values for October 2012. I used the same base years for anomalies: 1971-2000. The Reynolds shows a lot more variability but the October 2012 values get us in the ballpark of the HADISST data. Here’s the graph for the full path of Sandy:
http://i50.tinypic.com/2629yz9.jpg
And here’s the one for the extratropics:
http://i48.tinypic.com/2im0tx3.jpg
Regards
Well, Bob, this almost certainly means it was caused by the lack of Arctic ice!
(/sarc if needed)
Crispin in Seoul says: “But I just read Trenberth saying that 0.6 degrees of the warming was anthropogenic.”
I responded to Trenberth’s nonsensical claim in my video “We Now Control Weather”:
I had made this obervation in a comment as Sady was riding up the coast – somewhere, I noted that SST were not warmer lately until you got past the pine barrens.
well that is all good…but you have to admit a carbon tax going to give us even better weather right?
Geeyore says:
November 5, 2012 at 5:41 pm
I want to know where we might find the “heat elevator” that gets all that deep oceanic heat to the surface to create (rather normal) storms like Sandy. Or is that “heat elevator” invisible, too?
Top notch again Bob !!
Glad you got back safely !!
All the schlock from the Astrologers (‘Climate Scientists’) reads like blatant plagiarism of Monty Python And The Holy Grail!
So Monty Python And The Holy Grail is the cutting edge of Climate Science?
XD
Oh that is a good one! 🙂
Thanks for the inspiration!
6:19 pm – “…I prepared graphs with the HADISST since Jan 1870…” Gee Bob, I didn’t think you were that old.
Brian Reynold’s post “How a Warm Earth fueled Hurricane Sandy” at The Energy Collective is so bad, you could really feel sorry for one of “the world’s best thinkers on energy and climate”. He may still be an expert in energy and perhaps write about that topic.
I saw a Siemens ad on their webpage – an excellent match, well deserved for both.
…The Energy Collective, which heralds itself as “The world’s best thinkers on energy and climate”.
Collective is not cumulative, clearly.
The rough rule of teamwork, arising from ordinary factors such as overlap of skills, timing conflicts, etc:
Two people working together will yield the output of one and three-fourths individuals. Three people yields two and a third. Etc. It’s highly approximate, with varying yields, but the rule is as more people are added, average productivity drops, exponentially. Thus you find equivalences of output, like how five how can do the work of eight. If adding more to the first one yields a rise in average output, up to where the drop-off starts, you’ve identified a minimum working unit size, like a physical job that must be done by two people, etc.
It also applies to intellectual endeavors. With regards to the Energy Collective, the apparent average intellect has apparently dropped below the general population average, precipitously low. If Brian Reynolds’s output is representative, if they add any more people then statistically the individuals may be unable to walk and chew gum.
Nick,
Is your passive aggressive comment an attempted subliminal suggestion that anthropogenic carbon dioxide caused Sandy ?
o/t,.. Happy Guy Faukes day everyone.
Its the difference in temperatures between air masses + humidity that cause storm intensity. So COLDER air (or more extensive area of cold) from the north meeting warm humid air from south probably accounts for Sandy storm intensity plus the fact that there are MORE buildings and people living there. Example: humid cold air -10C meets colder air -40C will cause a storm/disturbance front. Its the DIFFERENCE. There are now 6 Billion humans compared to 2 Billion when I was born. so ANY strom more likely to cause MORE damage DUH…..cheers
“ Geeyore says:
November 5, 2012 at 5:41 pm
According to Trenberth, the missing heat is in the deep dark oceans where it can’t be measured (even by Argos).
aka “The dog ate my homework.”
But of course that is entirely true. Everyone understands that heat sinks. It’s a fundamental rule of physics….oh wait.
/sarc
David Ball said on November 5, 2012 at 8:26 pm:
Happy Guy Fawkes day as well.
How is that off topic? Isn’t Guy Fawkes Night all about unnecessary excessive releases of anthropogenic carbon dioxide from excessive human-induced combustioning of unnecessary carbon-bearing combustibles?
We can say with 100% accuracy there is zero OECD countries can achieve by introducing a co2 tax, even if they were silly enough to try.
http://www.eia.gov/forecasts/ieo/emissions.cfm
Out to 2035 the OECD emissions of co2 only increase by 6%, but Non OECD ( China, India etc) emissions increase by 73%.
The mitigation of AGW is the greatest con and fraud of the last 100 years and the entire OECD could go and live in caves until 2035 and it wouldn’t change the climate or temp by a jot.
Simple kindy maths and a simple graph at the EIA link proves the case.
OT but If Romney wins (aka Ryan Climate Skeptic) lets watch at last resignations in the global warming Industry and academia In the USA.
Geeyore says:
November 5, 2012 at 5:41 pm
According to Trenberth, the missing heat is in the deep dark oceans where it can’t be measured (even by Argos).
—————————————————————————————————
That`s `cos it hides when it sees them thar Argos bouys coming , and that`s how they know it`s manmade heat `cos it`s more cunning and dangerous than the natural heat which is easy to find as it`s too slow to move out the way of the Argo bouys thermometers and gets itself measured .
If You can`t find any sign of heat or worse , find a cooling , THAT`s how You know it`s that thar deadly manmade heat slitherin` just out of reach of yer thermometers
Bob Tisdale says: “… you would have discovered that the sea surface temperatures anomalies of Sandy’s storm track (12N-40N, 80W-70W) haven’t warmed since 1938, when the another super storm hit the Northeast U.S. ”
First problem here is hurricanes don’t just pop out of nowhere in the middle of the Caribbean. They are born in the tropical N. Atlantic , that is where you need to looking. Most of the storm track you are looking at is when the storm is already mature and is not feeding of surface temps, so you plot is irrelevant to the comments on “the warming oceans and their assumed impacts on Sandy”
Secondly, even looking at the area you chose to plot saying ” haven’t warmed since 1938″ is about a stupid as some of the alarmist comments I’ve seen this week.
The plot you show HAS warmed since 1938: in the period 1980 to present. It has also cooled before that. One comment you could make might be that area was AS WARM as present in 1938 when there was a comparable storm.
Noting that would actually point out warming oceans DO matter so we have to look at whether temperatures have warmed more in the recent warming than before.
So if we look at AMO (without detrending it) we see quite a remarkable correlation to accumulated cyclone energy.
http://i49.tinypic.com/xbfqtw.png
We also see the recent warm phase is somewhat warmer than the previous one. That does leave the possibility (but not a proof) that a relatively small part of that warming was AGW.
That is what the data shows, so why not be honest about it? I’m no warmist but if the data shows warming I’m not going to deny it or look somewhere else.
I’ve said it before but I’ll say it again, please try an up your game from fitting straight lines with Excel. Fitting a linear model to a chaotic system with large oscillations is meaningless at best and more often , like here, can be totally misleading.
Billy Liar says at November 5, 2012 at 6:22 pm, “Well, Bob, this almost certainly means it was caused by the lack of Arctic ice!”
let’s be fair to the idea that Sandy was caused by the record low Arctic ice; it isn’t an idea that should be discounted without considering the actual claims that are made.
The idea has been suggested on the Guardian comments (I forget where) that the rapid refreeze after the record low ice has increased the thermohaline flow rate and so altered the probable direction of the Hurricane (later storm) Sandy. Therefore Sandy was pulled north instead of into the Carribean.
This is a claim worth considering as the terrible impact of Sandy was due to where it hit not how hard it blew.
Now, I am not an expert and could neither refute nor support the argument.
But still, I thought it worth considering instead of mocking.
Try heating the surface of water with a heat gun and good luck. Trenberth’s heat is not missing, it did not go in in the first place. Heat will not pass from the atmosphere into the ocean because it will be stopped by surface tension. Only radiation passes through surface tension. Ocean and sun are in lock step.
Oy! Anomalies.
According to your Figure 1 the average temperature anomaly was 0.08 deg C over about 70 years which yield a ca. 5.6 deg C higher temperature in 2012 than in 1942.
Sorry, but what are you telling us? Why must the anomalies have been increasing to reach that result?
P. Solar says: “First problem here is hurricanes don’t just pop out of nowhere in the middle of the Caribbean. They are born in the tropical N. Atlantic , that is where you need to looking. Most of the storm track you are looking at is when the storm is already mature and is not feeding of surface temps, so you plot is irrelevant to the comments on ‘the warming oceans and their assumed impacts on Sandy’”
Once again, P. Solar, you’re arguing from ignorance, like the troll you have become. The Caribbean is part of the Atlantic Main Development Region, P. Solar, which is typically bordered by the coordinates of 10N-20N, 85W-20W. And if had you done your homework, you would have read the NOAA advisory that states that “TROPICAL DEPRESSION [EIGHTEEN, which developed into Sandy] FORMS OVER THE SOUTHWESTERN CARIBBEAN SEA” and lists the coordinates of “LOCATION…13.5N 78.0W”.
http://www.nhc.noaa.gov/archive/2012/al18/al182012.public.001.shtml
P. Solar says: “Secondly, even looking at the area you chose to plot saying ‘haven’t warmed since 1938’ is about a stupid as some of the alarmist comments I’ve seen this week.”
Good-bye, P. Solar.
Rabe says: “According to your Figure 1 the average temperature anomaly was 0.08 deg C over about 70 years which yield a ca. 5.6 deg C higher temperature in 2012 than in 1942.”
The linear trend is negative in Figure 1 and the span of the graph is only 2.2 deg C. Please explain how you arrived at a change of 5.6 deg C.
P Solar says…
First problem here is hurricanes don’t just pop out of nowhere in the middle of the Caribbean. They are born in the tropical N. Atlantic , that is where you need to looking. Most of the storm track you are looking at is when the storm is already mature and is not feeding of surface temps, so you plot is irrelevant to the comments on “the warming oceans and their assumed impacts on Sandy”
Your personal emotions are showing. That tropical storms do not continue to feed on SSTs is astounding news to the scientific hurricane experts. (The fact is that they do, and the effect on a storms strgenth can be very dramatic) Also Bob article was a response to an alarmist who, showing some of the very area Bod tracked, talked about the increase in SST in that area, all though he sumarised the entire Atlantic. And finally Bob’s statement, ““… you would have discovered that the sea surface temperatures anomalies of Sandy’s storm track (12N-40N, 80W-70W) haven’t warmed since 1938, when the another super storm hit the Northeast U.S. ” is
true, as he is talking about a trend which shows no warming. and SSTs today, that are no warmer then SSTs in the late 1930s. (The fact that they cooled, and then warmed, and cooled, and then warmed, is not relevant.)
KT’s missing heat is probably held as latent heat in the water vapour. Difficult to measure given that loss of latent heat will not change temperature.
See:-”A discussion on the Absence of a Measurable Greenhouse Effect” by Joseph E> Postma MSc. October 22, 2012.
A good read and I downloaded through Climate Depot. No Paywall.
Without the internet we would have lost out to this religion a long time ago. Keep up the good fight for the facts and nothing more.
In debating a local warmist about Sandy’s link to AGW I asked him to provide a comment from a real climate scientist that supports his assertion that Sandy was linked to AGW.
He finally came up with this comment with nothing else to support it.
“The thermal ‘inertia’ of the oceans delays the response to temperature changes.”
Thanks, Bob, good information, as is usual.
That, I submit, is what falsification looks like.
This pattern agrees with the findings of the late Roger Pocklington, an oceanographer from Nova Scotia who was studying the temperature trends along a transect from Newfoundland to Bermuda. Ironically, Roger became a victim of climate change because in the1970s when he announced his data was showing cooling he was the toast of the prevailing ‘cooling’ consensus. Then by the early 1990s he became anathema to the new ‘warming’ consensus because his data was still showing cooling.
The attacks were sufficient to make him re-examine what the official science was saying and he became a skeptic. The last time I met with him he was giving a paper at a skeptics conference titled “Global warming:The Science and the Politics,” organized by the Fraser Institute in 1997. His paper was titled “Oceanography and Inferences from Time-Series Data.”
Because of his data and the work I had done on eastern Canada including the Arctic we determined the increased flow of the Labrador Current was a significant factor in fish migrations. The implications and then the result of decreasing water temperatures was a decline in the cod stocks on the Grand Banks. We were trying without success to warn anyone who would listen about this decline. Instead they blamed the fisherman and shut down the entire cod fisheries. It is still shut down after 15+ years and the cod stocks have not shown recovery. This shut down is akin to banning corn in Iowa. In a delightful irony Newfoundland’s economy was saved by the discovery of oil at Hibernia on the Grand Banks. Take that income out of their economy and Newfoundland is an economic basket case.
Just in case P Solar is not trolling, although his manners would suggest it is, perhaps it would be helpful to point out that while a linear trend tells us little about what climate is doing, it tells us more about what it is not doing, and that includes dangerous warming. The CAGW and “AGW caused Sandy” hypotheses fail if there is no discernible positive linear trend in temperatures over such a long period. Such a trend also renders mitigation strategies at best poor value for money and at worst worthless or even actively damaging because of their cost and distorting effect on energy policy, economic output etc.
Thank you, thank you, thank you. I’ve been trying to think a of good way to present that *global* warming cannot effect local weather directly.
Maybe it’s hotter in Greenland, Mongolia, or atop Kilimanjaro (depending on who you believe), but a cyclonic storm can only extract energy from the water it is actually over. This is conduction at the contact surface when it starts.
At the end of the day q-dot = -k *dt … and if dt aint different then q-dot aint either!
Actually, even if a warmer portion of the ocean earlier in the storm pre-warmed the cyclone, the heat flow would be reduced (or reversed) as dt would be reduced (or reversed) 🙂
John Marshall says:
November 6, 2012 at 2:52 am
KT’s missing heat is probably held as latent heat in the water vapour. Difficult to measure given that loss of latent heat will not change temperature.
See:-”A discussion on the Absence of a Measurable Greenhouse Effect” by Joseph E> Postma MSc. October 22, 2012.
A good read and I downloaded through Climate Depot. No Paywall.
_____________________________
That is a bit of a problem because the humidity has gone DOWN. global RH graph and NOAA Global Atmosperic Specific Humidity graph
M Courtney says:
November 6, 2012 at 12:23 am
The idea has been suggested on the Guardian comments (I forget where) that the rapid refreeze after the record low ice has increased the thermohaline flow rate and so altered the probable direction of the Hurricane (later storm) Sandy. Therefore Sandy was pulled north instead of into the Carribean.
This is a claim worth considering as the terrible impact of Sandy was due to where it hit not how hard it blew.
The claim is preposterous. Where are the measurements of ‘thermohaline flow rate’?
Sandy was not a blow hard at any time during its life. Sandy was a Cat 2 hurricane in the vicinity of Cuba, but it spent most of its life as a Cat 1.
Bob Tisdale says: “… if you’d done your homework … “etc
Well if you’d done yours or looked at the graph I linked you would realise that hurricanes do not depend on 70 year linear trends (in fact virtually nothing in climate depends on linear trends which are an inappropriate metric as I have pointed out on many occassions since they also totally depend on where you start and end and as such are meaningless. )
P. Solar says again: “So if we look at AMO (without detrending it) we see quite a remarkable correlation to accumulated cyclone energy.”
http://i49.tinypic.com/xbfqtw.png
Also having identified the area in which it first developed into a formally identified tropical storm you plot everything but that area. Rather odd. So let me help you out. Here is the same hadISST data you chose to discuss from the bit of your chosen area that you did not plot. 12-20N 70-80W
This is the montlhy data with a 12m gaussian filter.
http://i45.tinypic.com/1o3d6w.png
Now without fitting any silly straight lines I will let the reader judge how temperatures in that area have varied over time.
kadaka (KD Knoebel) said @ November 5, 2012 at 8:06 pm
Let’s see, two Shoshone hunting jackrabbits independently catch maybe one per hour. Two Shoshone hunting jackrabbits with a rabbit net catch maybe 10-20 times that number. Let’s add a third Shoshone and double the length of the rabbit net and catch twice as many again for a 50% increase in manpower.
P. Solar says: “Well if you’d done yours or looked at the graph I linked you would realise that hurricanes do not depend on 70 year linear trends…”
I never said they did. I simply plotted the sea surface temperature along Sandy’s track to show that there has been little to no long-term warming in that region–contrary to the unfounded beliefs of many. Why is that so hard for you to digest? If you’d like to write a post about the influence of the AMO on ACE, feel free to and submit it to Anthony, but don’t say my statement is stupid, when you obviously have trouble grasping what I’m discussing.
Of course the Mannian explanation for Bob’s excellent observation is that Bob obviously cherry-picked his data choosing only to look at the area of ocean encompassing the storm track. He neglects to notice that the storm was teleconnected to a group of thunder-struck bristlecone pines high in the mountains of the North American continent, not to mention YAD061.
Maybe it’s just me (MkI eyball,) but fig 1 does indicate the high of a sinusoidal wave.
DaveE.
Bob Tisdale says; “I never said they did. I simply plotted the sea surface temperature along Sandy’s track to show that there has been little to no long-term warming in that region–contrary to the unfounded beliefs of many. ”
Another classic of avoiding the issue from you there Bob.
Let me try again:
Also having identified the area in which it first developed into a formally identified tropical storm you plot everything but that area. Rather odd. So let me help you out. Here is the same hadISST data you chose to discuss from the bit of your chosen area that you did not plot. 12-20N 70-80W
This is the montlhy data with a 12m gaussian filter.
http://i45.tinypic.com/1o3d6w.png
So your “unfounded beliefs of many ” appear not to be so unfounded.
I’m not out to promote AGW but neither do I see any point in criticising Mann and the team for perverting the data and “hide the decline” etc. and then playing the same games of hide and seek with the data.
Why did you chose not to present this information , did you just find what you expected to see and posted without looking properly:
And why do you so studiously avoid commenting on it when I point it out?
OssQss says: “I would also personally attest that the book referenced is packed with knowledge and worth every cent. ”
Thanks for the kind words. Glad you’re enjoying it.
P. Solar says: “Another classic of avoiding the issue from you there Bob.”
I’m not avoiding an issue, P. Solar. My post wasn’t about the subject matter you’re dead set on discussing. You’re acting like a troll. Get it?
Feel free to write up a post about whatever it is you think you’ve discovered and send it to Anthony. I haven’t read your replies in any detail nor looked at any of your links. The reason: you stated that something I wrote was stupid, because YOU, P. Solar, failed to comprehend the subject matter, which is not what you want to discuss.
Adios, P. Solar.
Bob Tisdale says: ” I haven’t read your replies in any detail nor looked at any of your links. ”
Well that is a pretty odd admission since you keep replying whilst ignoring the key point and calling me a troll.
Since you are having trouble reading I’ll keep it short.
You chose hadISST , you defined what you consider to be the birth place of Sandy.
Now look at the temperature record.
http://i45.tinypic.com/1o3d6w.png
You’re probably asking yourself why you should spend $8.00 for a book written by an independent climate researcher.
Better question: Why am I willing to spend $12 or more for it on a USB drive?
I’m on dial-up and wouldn’t want to try a long download of something I’m paying for.
More generally, if I don’t like a printed book then I have a paperweight, or fire-making material, or a target. There is some residual value. If I don’t like an e-book, I could delete it, either way I got nothing show for it.
But an e-book on a USB drive, I’ll still have the drive, which has a much higher residual value than a printed book.
On a quick eBay search, I found lots of 3 sticks, 2GB each, $12.75 with free shipping, from North Carolina. So they’re available for $4.25 just from here for a lot this small.
Look around, you can find local companies offering custom logos for small businesses, from T-shirts and hats to pens. You can get drives with your book title. But even a sticker would be fine, so it’s labeled. But that’s a desired option, not a deal breaker. There are companies that do custom preloaded/duplicated drives (example, not endorsement), if you find the volume of sales too great to do it yourself. You have choices to consider.
So you can pick up sales from the curious, as they’ll have something worthwhile no matter what. Your book will also be in a form that is portable, moveable between devices and also loanable, without the worries among the moral about possible copyright violations. I could read your book on whichever computer I’m using without leaving multiple copies around, etc.
I realize we’re in the digital age, print is dead. But the preference for tangible physical ownership is not.
P.Solar,
there are 3 issues with your post, which I would like to address:
1. You are not talking about the same thing, critizise with harsh words, but don’t give an appropriate (appropriate to the harshness of your critics) reason, why you use a different latitude window.
2. Temperature differences to the peak in the 1940s are still small. And 0.1 degrees of this increase is highly dubious and consequence of a disturbing adjustment:
You are aware of the issue, see last posting in this thread
http://climateaudit.org/2011/07/12/hadsst3/
3. The link between AMO und cyclone energy is interesting. But global tropical cyclone activity has been low in recent times. The latter suggests, there is no temperature link or if any a negative correlation, and the link between AMO and hurricane activity may be caused by an external driver, (such as the sun) which influences both.
kadaka;
As an alternative to your alternative, an external USB drive (160 GB) cost me $40 about a year or two ago (now available larger and cheaper). Can hold thousands of e-books and/or lotsa other stuff. Mine’s sub-divided into 5 letter-drives. Will move to any and every upgrade/new computer I get (imminent, long overdue).
Manfred , thanks for the thoughtful remarks.
1. Bob in his article selected the region he wanted to use and identified the storm as having first been officially logged and followed in the tropical section. However, in his discussion about whether SST was a factor he plots the whole region, then the later, extra-tropical part of the storm track but he expressly ignores the region where he says the storm originated. This region, when inspected DOES show a marked increase in temperature which is totally at odds with what he is trying “prove” in his text.
1b. Yes, language a bit harsh, to anyone not familiar with my long term efforts to discuss issues in Bob’s “work”. He systematically refuses to address any issues raised and tries to sidetrack , as he does once again here. After three calls he has still not commented on the blatant mistake/misrepresentation I pointed out. Preferring to call me a troll than to address the issue.
2. All temperature differences are small when averaged over large areas but because they affect large areas actually represent huge amounts of energy. Yes, there are issues with the SST record (glad you note my highlighting them) but my point here was to accept Bob’s choice of data set and region, using that to question his conclusions.
3. Manfred says: “But global tropical cyclone activity has been low in recent times. The latter suggests, there is no temperature link or if any a negative correlation”
Well, you need to define what you mean by “activity” and “recent” and point to data. You may be confusing this with lack of US land-falling hurricanes, which Pielke Jr. has pointed to. Whether they hit land or are still hurricane force when they do is another question and is less predicable/attributable.
Accumulated cyclone energy is one common measure of cyclone activity and as my graph shows it certainly has not been low.
http://i49.tinypic.com/xbfqtw.png
The sources for the data are marked on the graph if you want to check.
It is fairly well accepted (except by Bob Tisdale) that hurricanes are caused by warmer SST conditions, though I was quite stunned by how closely they matched. This fact does increase the confidence I attribute to both the data sets.
In fact I think the 0.1 K offset I had to put into that plot around 1920 is strong evidence that one of the SST “bias” adjustments is wrong. I have sent this to John Kennedy at the Met Office who works on hadSST and he says he is considering what it means. The counter argument is, it also suggests that the post-war adjustments may not be that bad overall.
Manfred says: “2. Temperature differences to the peak in the 1940s are still small. And 0.1 degrees of this increase is highly dubious and consequence of a disturbing adjustment:”
My main conclusion from the AMO graph is that there is a strong correlation, most of the current peak is just natural variations but there is a slightly higher peak than last cycle.
Objectively this has at least two interpretations: a) a small AGW signal; b) a small increase in the amplitude of the natural variation.
I see both as credible possibilities.
“The Sea Surface Temperature anomaly data used in this post is available through the KNMI Climate Explorer website.”
Let’s check another cherry: http://www.metoffice.gov.uk/hadobs/hadsst2/
Oops. Record warm seas below Sandy. But we knew that, didn’t we.