Guest Post by David Middleton
“Satellites See Unprecedented Greenland Ice Sheet Surface Melt… Right On Time”

I guess Professor Tedesco missed this…
“Ice cores from Summit show that melting events of this type occur about once every 150 years on average. With the last one happening in 1889, this event is right on time,” says Lora Koenig, a Goddard glaciologist and a member of the research team analyzing the satellite data.
How can an ice sheet surface melt be both “unprecedented” and “right on time”?
It can’t. However, nothing is impossible when you combine govt bureaucrats and the junk science of anthropogenic global warming…

Satellites See Unprecedented Greenland Ice Sheet Surface Melt
07.24.12
For several days this month, Greenland’s surface ice cover melted over a larger area than at any time in more than 30 years of satellite observations. Nearly the entire ice cover of Greenland, from its thin, low-lying coastal edges to its two-mile-thick center, experienced some degree of melting at its surface, according to measurements from three independent satellites analyzed by NASA and university scientists.
[…]
“Ice cores from Summit show that melting events of this type occur about once every 150 years on average. With the last one happening in 1889, this event is right on time,” says Lora Koenig, a Goddard glaciologist and a member of the research team analyzing the satellite data. “But if we continue to observe melting events like this in upcoming years, it will be worrisome.”
[…]
Summit Station’s summer peak temperatures flirted with 0°C for a few hours in late July.

Hence the somewhat unusual wide-spread, right-on-time melt.
This melt shows up very clearly in the Greenland Ice Sheet Albedo…

The “normal” summer melt season albedo minimum at 2500-3200m is in the range of 0.79-0.82. This year, it briefly dropped to just below 0.74.

“Normal” is based on 12 years of data. The GRACE measurements upon which the accelerating ice loss claims are based are heavily dependent on the Glacial Isostatic Adjustment (GIA). While not as large as Antarctica (where the GIA’s margin of error is nearly as large as the asserted ice loss), GIA variations can result in totally different ice loss values… And the GRACE time series isn’t any longer than the MODIS time series.
Wu et al., 2010 determined that the GIA commonly assumed for Greenland was way too high and that the 2002-2008 ice loss rate was 104 Gt/yr rather than the oft cited 230 Gt/yr. Even at 230 Gt/yr, it would take 1,000 years for Greenland to lose 5% of its ice mass.
Riva et al., 2007 concluded that the ice mass-loss rate in Antarctica from 2002-2007 could have been anywhere from zero-point-zero Gt/yr up to 120 Gt/yr. Dr. Riva recently co-authored a paper in GRL (Thomas et al., 2011) which concluded that GPS observations suggest “that modeled or empirical GIA uplift signals are often over-estimated” and that “the spatial pattern of secular ice mass change derived from Gravity Recovery and Climate Experiment (GRACE) data and GIA models may be unreliable, and that several recent secular Antarctic ice mass loss estimates are systematically biased, mainly too high.”
So… We have barely a decade’s worth of data and no idea if the modern melt rates and albedo changes are anomalous relative to the early 20th century Arctic warming, Medieval Warm Period or any of the other millennial-scale Holocene warming periods.
I’m gonna go out on a limb and say that unless some alarmist can tell me what the albedo was in 1899, 1127, 1143 and 1939, during the vast majority of the Holocene or during the Sangamonian, my response is, “Very interesting. Now, move along, there’s nothing more to see here.”

http://wattsupwiththat.com/2011/09/29/warming-island-greenland-sea-regional-climate-and-arctic-sea-ice-reconstruction/

(After Alley, 2000)

(NGRIP)
Manhattan-sized Icebergs!!!

(MSNBC)
Manhattan-sized Icebergs are insignificant relative to Greenland-sized ice sheets.
- Manhattan: 34 square miles.
- Greenland ice sheet: 660,235 square miles.
Manhattan = 0.005% of Greenland ice sheet. 99.995% of the Greenland ice sheet did not participate in this event.
If one Manhattan-sized chunk of ice calved into the ocean every year and there was no snow accumulation in Greenland for 1,000 years, Greenland would lose 5% of its ice sheet.

(Wikipedia and Google Earth)

(Climate4you)
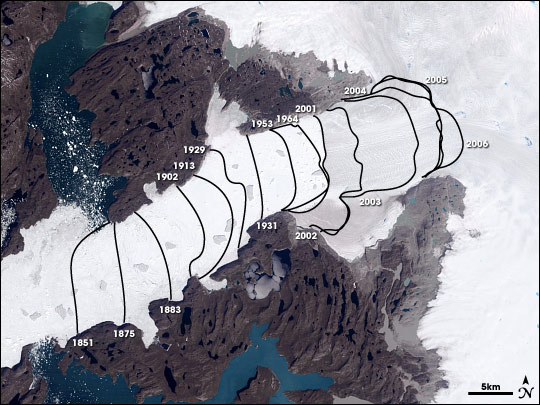
This is a Google Earth photo of Jakobshavn Isbrae, Greenland’s largest outlet glacier…The red lines represent the calving front’s retreat from 1851-1942.If the calving front retreated almost 20 km over that 90-yr period and Greenland’s ice sheet is supposedly vanishing (according to the Warmists), why does the Google Earth image show so much ice downstream of the calving front?
Surely if Jakobshavn Isbrae’s calving front retreated by nearly 20 km before SUV’s, it must have retreated much more than 20 km farther upstream that the 1942 front by now… Right?
(Wikipedia)
It appears to have only retreated by a bit more than 10 km since 1942… But, why is there still so much ice downstream of the calving front? If the Greenland ice sheet is disappearing, surely that must be open ocean… erm… open fjord by now… Right?
All that moving around of the calving front and all that lack of disappearing ice might lead someone to think that glaciers are rather dynamic…
Jakobshavn Isbrae – Greenland Glacier Has Always Changed With The Climate
By News Staff | July 16th 2011
New research on Jakobshavn Isbrae, a tongue of ice extending out to sea from Greenland’s west coast, shows that large, marine-calving glaciers don’t just shrink rapidly in response to global warming, they also grow at a remarkable pace during periods of global cooling. *Glaciers change.
[…]
Jakobshavn Isbrae has been the focus of intense scientific interest because it is one of the world’s fastest-flowing glaciers, releasing enormous quantities of Greenland’s ice into the ocean. It is believed that changes in the rate at which icebergs calve off from the glacier could influence global sea level rise. The decline of Jakobshavn Isbrae between 1850 and 2010 has been documented, mostly recently through aerial photographs and satellite photographs.
“We know that Jakobshavn Isbrae has retreated at this incredible rate in recent years, and our study suggests that it advanced that fast, also,” said Jason Briner, the associate professor of geology at the University of Buffalo, who led the research. “Our results support growing evidence that calving glaciers are particularly sensitive to climate change.”
[…]

(Wikipedia and Google Earth)
“Our results support growing evidence that calving glaciers are particularly sensitive to climate change.”Greenland’s climate is always changing… Always has and always will change… And the climate changes observed over the last few decades are not unprecedented. The Greenland ice sheet is no more disappearing this year than it was last year and it is physically impossible for the ice sheet to “collapse” into the ocean.
Good article by Lomborg over at Slate. Strikes back at the alarmist nonsense spewed by Krugman that global warming is causing everything.
http://www.slate.com/articles/health_and_science/project_syndicate/2012/08/lomborg_paul_krugman_is_wrong_to_say_that_climate_change_causes_extreme_weather_.html
Good stuff Dave Middleton.
If possible, please separate your article into two different articles on WUWT.
Your “Manhattan-sized Icebergs!!!” section is very interesting and should be a stand alone article, so it gets more views. You can still put in links from one article to the other, but I think a lot of people would like to see your Manhattan-sized Icebergs!!! write-up by itself. It could give it more widespread distribution. As it is, it may be buried so far into the first article and missed by too many people, who would like to see it and pass it on. Just a suggestion.
Well here’s the latest in the related junk science education push. NSF just granted $19 million to push the manmade global warming meme in US classrooms on malleable, captive minds.
http://blogs.edweek.org/edweek/curriculum/2012/08/nsf_promotes_climate-change_ed.html?print=1
Part of their on-going campaign to use our tax money and education and the social sciences to influence perceptions of reality. Actual reality that is inconveniently not supporting the useful collectivist political theory and treasury looting scheme for political cronies can be ignored if you can just catch that filtering mindset at the right time.
What an expensive farce that is to be going on in schools.
Seconded!
@Ben,
Thanks!
There are already several separate WUWT articles on these two subjects. I wanted to combine the alarmism into one summary. Much of this post was built from comments of mine on those posts.
I got it, I know where the lost ice has gone – It fell on Canberra!
I do not think they know what “unprecedented” means.
Good grief! How can we put a stop to the federal government promulgating junk science to kids?
Just electing a new President isn’t going to do it. The entrenched bureaucracies aren’t going to change unless people are fired and replaced.
/Mr Lynn
Thanks David, nothing like a little historical perspective to counter the modern hysterical perspective.
I love the way they have nicked the albedo graph from a real scientist, Jason Box’s blog. People should read Jasons blog rather than this empty headed psuedoscience.
REPLY: Pay “dorlomin” no mind, he obviously can’t reconcile the fact that the graphs and discussion he’s whining about don’t show what he wants, so therefore he must issue the usual condemnation. Watching “dorlomin” over the years, he has yet to contribute anything to the debate except complaints. He’s one of those commenters who’s comments are entirely predictable. – Anthony
“Satellites See Unprecedented Greenland Ice Sheet Surface Melt… Right On Time”
David, you appear to imply that Prof Tedesco actually said this whereas I see no evidence of that.
Glaciers reached a peak in the 1700s and have been retreating long before the industrial revolution,” This is posted online here from the National Park Service:
http://www.fs.fed.us/r10/tongass/districts/mendenhall/faq.html
I notice from the graph of albedo against day of the year that mean and 1 sigma values are 80.5+/- 1.5%. This makes the 95% confidence limits (2 sigma)+/-3%.
For the statistically naive among you, sigma is a measure of how much individual measurements spread above and below the mean.The probability of seeing a measurement more than 2 sigma away from the mean is less than 5%.
This is the generally accepted threshold at which a scientist would become interested and start looking for a reason for the divergence, rather than just accepting it as part of the normal variation. The lower 2 sigma boundary for this data is 77.5%. Anything below that indicates that something may have changed in the real world.
The 2010 minimum was 77.2%, just outside 2 sigma and with a probability just below 5%. The 2011 minimum reached 73%, 5 sigmas below the mean and a probability well below 1%.
With each of 2009,2010,2011 and 2012 minima lower than its predecessor and the last two significantly outside the normal range ,it is hard to escape the conclusion that some real world change is affecting the behaviour of the ice sheet surface. Candidates, anyone?
I am intrigued to know what the Warmists thought would have happened to the Peterman glacier if it had not calved off. Would it have continued to grow forever?
Don’t leave out the thoroughly naive/incompetent/duplicitous journalists/editors doing their bit in the spread of disinformation.
Good job David and very enlightening.
I particularly appreciated the amount of work you put into the graphics. They really put the issue into much needed perspective.
P.S. I presume the acronym of your subtitle was an intentional pun : )
Alarmists Gone Wild…AGW…Anthropogenic Global Warming
I suspect that like the more famous Muir Glacier (Glacier Bay, Alaska), this glacier blossomed during the Little Ice Age and has been retreating since the warming commenced around 1850.
Interestingly enough, Indian legends and recent botanical/paleoclimate studies concur on the history of Glacier Bay. And the park rangers up there, some being Indians, have little belief in CAGW. Particularly since their ancestors experienced catastrophic natural cooling.
Thank you, I enjoyed reading your article. What causes this 150 year surface melt cycle?
“The GRACE measurements upon which the accelerating ice loss claims are based are heavily dependent on the Glacial Isostatic Adjustment (GIA). While not as large as Antarctica (where the GIA’s margin of error is nearly as large as the asserted ice loss), GIA variations can result in totally different ice loss values…”
This is very important information I was not aware of.
Can somebody explain in which way is it depending on it? Do I correctly understand that they assume Greenland and Antarctica are lifting up even with the whole ice on them?
So the ice lost measurement by GRACE are again dependent of a modelled quantity…
Speaking of this John Daly had an interesting posting about the whole sea level rise in 20th century:
http://www.john-daly.com/ges/msl-rept.htm
“The world’s public was given the clear impression that the claimed 18 cm sea level rise for the 20th century was an observed quantity. It is now clear that this is not the case. The 18 cm figure arrived at is the product of combining data from tide gauges with the output of the ICE-3G de-glaciation model.
The logical equation here is simple.
an observed quantity ± a modeled quantity = a modeled quantity
Thus, the claimed 18 cm sea level rise is a model construct, not an observed value at all.
Worse still, the model which has created it is primarily focused on the North Atlantic basin which shows relative sea level trends quite unlike those observed outside that region. Thus, global estimates cannot be inferred with any confidence from modeled trends which mainly affect only that basin.”
Somebody said it already…models all the way down..
Mr. Middleton, do you know on what dates your photos in figures 11 and 12 of the Jakobshavn Isbrae were taken? The calving fronts labelled reflect the minimum extent of the glacier at the warmest part of the thaw.
The position of the ice front in the photograph and the lack of snow suggest that the picture was taken considerably later in the season after the ice front had moved seaward once more, but before the first snowfall. That would explain why ice is visible downstream of the minimum extent fronts.
Lars P. says:
August 17, 2012 at 10:33 am
“The GRACE measurements upon which the accelerating ice loss claims are based are heavily dependent on the Glacial Isostatic Adjustment (GIA). While not as large as Antarctica (where the GIA’s margin of error is nearly as large as the asserted ice loss), GIA variations can result in totally different ice loss values…”
This is very important information I was not aware of.
Can somebody explain in which way is it depending on it? Do I correctly understand that they assume Greenland and Antarctica are lifting up even with the whole ice on them?
———————————————————————-
This paper discusses ground level measurements of the isostatic uplift or sinking of Greenland rocks, to give a more accurate GIA to complement the GRACE data.
http://adsabs.harvard.edu/full/2005GeoJI.163..865D
James says:
August 17, 2012 at 10:31 am
Thank you, I enjoyed reading your article. What causes this 150 year surface melt cycle?
There is no 150 year cycle, over the last 1,000 years there have been 4 such events (not including this year, three of them clustered about 1,000 years ago. The 150 year value is the average over the last 10,000 years with the peak occurring about 7,000 years ago, when the frequency was about 1 per 25 years. At that time July insolation was higher than now.
To simplify, the GRACE satellite keeps a running check on its position based on the GPS satellite network. This allows its orbit to be monitored to sufficient accuracy to detect changes due to mass concentrations like the Greenland ice sheet, effectively measuring the mass of the ice sheet.
Greenland floats on the Earth’s mantle like a boat in water. Like a boat, if weight is removed it floats higher. This is the GIA and happens if the ice mass decreases.
Since the effect of the ice sheet’s gravity on GRACE increase with mass and closeness to the satellite, ground based GPS measures of the uplift of the underlying rock are needed. This allows orbital changes due the mass of the ice to be distinguished from changes due to uplift, giving a more accurate measurement of ice mass and a better view of whether ice mass is changing with time.
I don’t know what this author is so excited about. I read several articles on this event. All of them plainly stated that melting of the entire surface has been unprecedented in the satellite era, but scientists are aware from other evidence that it has happened every 150 years or so historically, so on that scale, not particularly surprising.
The potion relating to calving seems to be making the unremarkable point that the is normal during periods of global warming, which he seems to concede is now happening.
The Danish DMI noted on July 27, 2012 that the Greenland Summit regularly gets above 0.0C in the summer.
This DMI report was done in response to the original “science/myth” pushed out by NASA and a NASA-based Greenland ice core scientist Lora Koenig.
Google English translation version of the DMI on July 27, 2012 and they don’t sound pleased.
http://translate.google.ca/translate?hl=en&ie=UTF8&u=http://www.dmi.dk/dmi/t_vejr_pa_gr_nlands_top
http://www.dmi.dk/dmi/groenland2.gif
Record temp at the Summit is +4.4C.
Entropic man says:
August 17, 2012 at 10:05 am
I notice from the graph of albedo against day of the year that mean…
___________________________________
The earth’s climate is not static. You have just found evidence that it is not static. Congratulations.
See my last comment on the ~ 1500 yr Bond events and Dansgaard- Oeschger oscillations and the ~ 88 yr and the ~ 200 yr cycles found by Dr Alexander Ruzmaikin and Dr. Joan Feynman of NASA.
“If the calving front retreated almost 20 km over that 90-yr period and Greenland’s ice sheet is supposedly vanishing (according to the Warmists), why does the Google Earth image show so much ice downstream of the calving front?”
I’m not particularly an expert on the subject, but aren’t you simply confusing sea ice and ice shelves? Every winter, sea ice forms around most of Greenland; every summer most of that seas ice around Greenland melts again. http://igloo.atmos.uiuc.edu/cgi-bin/test/print.sh?fm=03&fd=01&fy=2011&sm=09&sd=01&sy=2011
This sea ice is typically no more than 5 m thick. The front of the Peterman Glacier is ~ 50 m thick. So sea ice several meters thick (varying by season) would be expected “downstream” from the end of the glacier/ice shelf. The calving front could and would be FAR upstream from the end of the thin sea ice.
Gail, please show me, with numbers, that the warming effect observed is consistent with the cycles you mention. You need to show that the overall effect of the three cycles shows a warming trend at present and that the amount of energy they are pumping into the system is consistent with the changes we see. If you want to convince the climate scientists that these cycles, and not cAGW, responsible for the changes we see, you ned to demonstrate that they better fit the real world data.
Neil Gundel says:
August 17, 2012 at 11:24 am
“The portion relating to calving seems to be making the unremarkable point that this is normal during periods of global warming, which he seems to concede is now happening.”
————————————————
A glacier forms inland and flows downhill. On land it melts when it reaches the 0C temperature contour, this defines the tip. In Winter the lower temperatures allow the tip to move downhill and in Summer it retreats uphill. The highest tip position during Summer is used to define the length of the glacier
If the climate warms, the Summer 0C contour moves uphill and the glacier melts higher up the valley. If climate cools the 0C contour moves downhill and so does the melting tip of the glacier.
If a glacier reaches the sea, the end floats and, as well as melting, pieces break off the tip or the entire tip detaches. This is calving and happens every year at the position where the tip of the glacier reaches 0C.
In Winter or in a a cold period the glacier extends the full lenght of its fjord and the tip pushes out into the sea ice. In Summer it calves in the fjord. As the Summer warms the calving front recedes up the fjord, furthest inland at the peak Summer temperatures.
A long-term warming trend causes a trend in calving points, with the Summer minimum moving further inland over the years. This shows in the Jakobshavn Isbrae photos, in which the ice flows from a source on the right towards the sea on the left, while the Summer maximum calving point has moved inland to the right over the last 162 years.
If the calving front retreated almost 20 km over that 90-yr period and Greenland’s ice sheet is supposedly vanishing (according to the Warmists), why does the Google Earth image show so much ice downstream of the calving front?
The calving front is the position where the glacier breaks up into bergs, it does not mean that the bergs cease to exist downstream of the front, in fact a glacier like Jakobshavn which advances at about 20m/day you’d expect a continuous production of bergs to keep the fjord downstream filled.
Entropic man says:
August 17, 2012 at 11:51 am
…..If you want to convince the climate scientists that these cycles, and not cAGW, responsible for the changes we see, you ned to demonstrate that they better fit the real world data. that these cycles, and not cAGW, responsible for the changes we see, you ned to demonstrate that they better fit the real world data.
_____________________
NOPE, you have it backwards. Climate scientists have to convince ME that there is something going on that is not typical of Earth’s climate.
A look at the last five interglacials Vostok Graph show there is no excess heating in the Holocene. The Holocene isn’t even as hot as other interglacials were. A look at the Greenland Holocene Graph shows the earth is not warming but gradually cooling during the Holocene. And more than one paper states were are heading into a glaciation.
Entropic man says:
For the statistically naive among you, sigma is a measure of how much individual measurements spread above and below the mean.The probability of seeing a measurement more than 2 sigma away from the mean is less than 5%.
This is the generally accepted threshold at which a scientist would become interested and start looking for a reason for the divergence, rather than just accepting it as part of the normal variation.
The statistically astute among as would like to ask you to describe the period of observation that produced the distribution against which you are comparing this “extreme” event, and to reconcile that with your use of the terms “divergence” and “normal variation”. Ooh! and “real world”. That is a doozy.
From Tim Folkerts on August 17, 2012 at 11:48 am:
Google Maps: Jakobshavn Isbrae (zoom out as needed)
From DMI: Satellite images of Disko region
Recent AQUA satellite image, Jakobshavn Isbrae calving area clearly visible:
http://ocean.dmi.dk/arctic/images/MODIS/Disko/20120816AQUA.jpg
Do you think that could be sea ice instead of calved-off ice shelf chunks? With the calving front more that 30 miles inland?
Paul Homewood says:
August 17, 2012 at 10:10 am
I am intrigued to know what the Warmists thought would have happened to the Peterman glacier if it had not calved off. Would it have continued to grow forever?
===============================================================
I would have become Peterman’s p ….. no. Better not.
“The world’s most viewed site on global warming and climate change”
Really?
Which is the most viewed site on the science of global warming and climate change?
[Reply: One and the same, note the content and the awards on the sidebar. ~mod]
YIKES! Typo.
“I would have become Peterman’s p ….. no. Better not.”
Should be “IT would have become Peterman’s p ….. no. Better not.”
JJ:
Don’t hold your breath waiting for a reply. The paid troll snows a thread with untrue assertions phrased to imply he/she/they knows something about the subject and makes arrogant excuses if pressed to justify the assertions.
The purpose of this behaviour seems to be to mislead ‘lurkers’ who are unfamiliar with the subject.
Richard
The applicability of statistics to things like sea ice is very questionable. As soon as an event occurs like the wind driven melt in 2007 the baseline period has no meaning. It’s now apples and oranges. These are not random events and the use of statistics requires a little thinking instead of throwing out worthless numbers.
But then why am I not surprised that a true believer would either be ignorant or try to fool people with statistical lies.
Gail Combs says:
August 17, 2012 at 12:50 pm
Entropic man says:
August 17, 2012 at 11:51 am
…..If you want to convince the climate scientists that these cycles, and not cAGW, responsible for the changes we see, you ned to demonstrate that they better fit the real world data. that these cycles, and not cAGW, responsible for the changes we see, you ned to demonstrate that they better fit the real world data.
_____________________
NOPE, you have it backwards. Climate scientists have to convince ME that there is something going on that is not typical of Earth’s climate.
=======================================================================
A few times on different post I’ve asked just what (ice, sea level, temps, climate, etc.) is SUPPOSED to be if Man’s influence were removed from the equation. I’ve never seen anyone answer that.
I didn’t even notice… LOL.
It literally was an unintended pun… Must’ve been Freudian… 😉
The raw GRACE measurements indicate a net mass gain (44 ±20 Gt/yr) from October 2003 through February 2007. Figure 2. Total Mass Difference: TMD = Actual GRACE measurements. TMD – IJ05 and TMD – ICE5G = GRACE measurements adjusted for GIA (Riva et al., 2007).
We know that the crust is rising due isostatic rebound from the last glacial maximum; but we don’t know the rate of crustal rebound. Most GIA’s are model-derived. Over the last 5 years, a lot of work with GPS measurements of isostatic rebound have shown that the model-derived GIA’s “are systematically biased, mainly too high.” The GPS measurements indicate that GIA is generally much lower than the model-derived GIA in both Greenland and Antarctica,
The problem is that the GRACE-based pronouncements of accelerating ice mass loss are based on model-derived, rather than measured, GIA.
GRACE is a really cool instrument package. However, its measurements are nearly worthless if they are modified with a GIGO GIA.
JJ says:
August 17, 2012 at 1:28 pm
The satellite’s been up thirteen years and has so far given 12 years of data. As to the validity of my analysis, if n<30 the variance gets very large, but it does not affect the basic technique.
"Real world"? There is one, unless you are a solipsist. I'm trying to understand it better using whatever comes to hand. What are you doing?
“nothing is impossible when you combine govt bureaucrats and the junk science of anthropogenic global warming”
Would Lora Koenig fall into the category of govt bureaucrat? I guess the important thing to remember is believe the bureaucrat that best expresses your own world view.
Gunga Din says:
August 17, 2012 at 2:35 pm
Gail Combs says:
August 17, 2012 at 12:50 pm
NOPE, you have it backwards. Climate scientists have to convince ME that there is something going on that is not typical of Earth’s climate.
=======================================================================
A few times on different post I’ve asked just what (ice, sea level, temps, climate, etc.) is SUPPOSED to be if Man’s influence were removed from the equation. I’ve never seen anyone answer that.
_-_-_-_-_-_-_-_-_
I get that a lot here, Gunga Din. These people are negative. They are good at sounding doubtful about cAGW, but have problems coming up with alternatives.
Consider Gail Combs. She has a hypothesis that the temperature variations we see are driven by three interlocking cycles of different lengths. Does she present data and calculations to demonstrate that this is so?
She does not.
This double standard is very evident here. I am constantly asked to prove my own ideas, , but few of the sceptics ever even try to prove their own. Those that do try, tend to present strange graphs and say “Look, this proves it!”. They provide no background argument or explaination.
The only time Gail convinced me of anything was to improve my understanding of the complexity of air conditioner/ weather station interactions. Even then I had to do most of the legwork.
In any proper scientific forum these people would be slaughtered, which is probably why they hide here among friends instead of doing real science and taking it out into the real world.
Mr. Watts 2012 paper is a valiant effort to operate at the level of professional scientific debate. I hope it reaches publishable standard. Most of the rest of the sceptic comments here follow the old rule that 90% of everything is rubbish.
David Middleton says:
August 17, 2012 at 3:04 pm
The problem is that the GRACE-based pronouncements of accelerating ice mass loss are based on model-derived, rather than measured, GIA.
GRACE is a really cool instrument package. However, its measurements are nearly worthless if they are modified with a GIGO GIA.
————————-
Maybe this upgrade to the system will help.
http://researchnews.osu.edu/archive/gpsspring.htm
http://www.pnas.org/content/109/30/11944.full?sid=1a3dc591-09fd-46ed-a2c8-fa61848ec70f
KD Knoebel,
Thanks for those links — I learned a bit more about glaciers. In particular:
“Icebergs breaking from the glacier are often so large (up to a kilometer in height) that they are too tall to float down the fjord and lie stuck on the bottom of its shallower areas, sometimes for years, until they are broken up by the force of the glacier and icebergs further up the fjord. ”
and
“Thinning causes the glacier to be more buoyant, even becoming afloat at the calving front, and is responsive to tidal changes. ”
(Both from Wikipedia)
So the calving front is “inland” but not “on land” — still in a deep fjord that can have water in the bottom. Ice breaks free but then can’t easily escape. So we have “crushed ice” potentially 100’s of meters thick getting pushed in front of the actual glacier. This region is neither glacier nor ice shelf nor sea ice
Entropic man says:
August 17, 2012 at 3:32 pm
Gunga Din says:
August 17, 2012 at 2:35 pm
Gail Combs says:
August 17, 2012 at 12:50 pm
NOPE, you have it backwards. Climate scientists have to convince ME that there is something going on that is not typical of Earth’s climate.
=======================================================================
Me: A few times on different post I’ve asked just what (ice, sea level, temps, climate, etc.) is SUPPOSED to be if Man’s influence were removed from the equation. I’ve never seen anyone answer that.
_-_-_-_-_-_-_-_-_
E-man: I get that a lot here, Gunga Din. These people are negative. They are good at sounding doubtful about cAGW, but have problems coming up with alternatives.
==============================================================
OK. So what is the Greenland Ice supposed to be? If the melting is abnormal due to Man, what is normal?
Without knowing what “normal” is, how can anyone say what is happening is “abnormal”?
My question remains unanswered.
Entropic says:
“Climate scientists have to convince ME that there is something going on that is not typical of Earth’s climate.”
^That^ statement shows unequivocally that Entropic is not a scientist. A scientist abides by the scientific method. But Entropic trying to put scientific skeptics in the position of having to prove a negative. That is not the scientific method; that is wild-eyed witch doctor territory.
I recommend that Entropic get up to speed on the null hypothesis, which shows clearly that nothing unusual is happening. Everything we observe today, from Arctic ice cover to temperatures, has routinely happened before. The null hypothesis has never been falsified, which destroys the CAGW science fiction fantasy.
Gunga Din says:
August 17, 2012 at 3:56 pm
OK. So what is the Greenland Ice supposed to be? If the melting is abnormal due to Man, what is normal?
Without knowing what “normal” is, how can anyone say what is happening is “abnormal”?
My question remains unanswered.
My own view is that we are in the later part of an interglacial, with changes in Earth’s orbital eccentricity gradually cooling high latitudes of the Northern Hemisphere as we move towards the next glacial period. Arctic ice should be getting thicker in Winter and gradually more extensive at all times of year. The Greenland ice sheet should be gaining mass and glaciers getting longer. Average temperatures worldwide should be dropping by about 0.6C per milennium and CO2 decreasing from 280ppm towards 200ppm.Sea level should decline as water accumulates in expanding glaciers and ice sheets.
This is what the information available suggests happened at this stage in previous interglacials. The end result in a few millenia should be ice sheets down to about 50N latitude for the next 90,000 years.
Entropic man says:
The satellite’s been up thirteen years and has so far given 12 years of data.
Reasking that which remains unanswered: You hold that 12 years of data produces a distribution that assigns exactly what meaning to the terms “divergence” and “normal variation”, exactly?
As to the validity of my analysis, if n<30 the variance gets very large, but it does not affect the basic technique.
It does affect the relevance of the results that are obtained by applying the basic technique. Principally by adding an “IR”.
“Real world”? There is one, unless you are a solipsist.
Oh, that isn’t in dispute. But your use of the term suggests that you also conceptualize an unreal world which somehow determines sub 2 sigma deivations from the mean here on earth. Do tell.
What are you doing?
Laughing at your posts.
Say, how goes the effort putting numbers to the other scary stories that you were telling about melting ice on the other thread:
http://wattsupwiththat.com/2012/08/13/sea-ice-news-volume-3-number-10-arcus-august-sea-ice-outlook-posted-plus-worries-over-arctic-storm-breaking-up-sea-ice/#comment-1059199
Perhaps when you did, you found it wasn’t so scary anymore, huh?
Entropic man says:
August 17, 2012 at 11:17 am
To simplify, the GRACE satellite keeps a running check on its position based on the GPS satellite network. This allows its orbit to be monitored to sufficient accuracy to detect changes due to mass concentrations like the Greenland ice sheet, effectively measuring the mass of the ice sheet.
Greenland floats on the Earth’s mantle like a boat in water. Like a boat, if weight is removed it floats higher. This is the GIA and happens if the ice mass decreases.
Since the effect of the ice sheet’s gravity on GRACE increase with mass and closeness to the satellite, ground based GPS measures of the uplift of the underlying rock are needed. This allows orbital changes due the mass of the ice to be distinguished from changes due to uplift, giving a more accurate measurement of ice mass and a better view of whether ice mass is changing with time.
In theory, yes.
But the inherent problem with the GRACE results is their very many but very much unknown and unverifiable “corrections” to the basic satellite movement data – and, more important, the many thousands of assumptions over each region that are combined to make the corrections.
The total mass (of icecap + continental crust + surface granite) over a region is probably fairly accurate from the data analysis of the relative movement of the two satellites. The total calculated mass (of continental crust + surface rock) where there is no ice is probably reliable. From a baseline, one can use the corrected GRACE data to probably generate reliable data for the change in continental mass over time.
But here is the problem, the elephant and the gorilla in the room downstairs for GRACE: they know the total of the elephant + the gorilla downstairs are changing, but they can’t tell which is getting larger, and which is getting smaller. They can (sort of) tell the total mass in the room is changing and that it is changing location because they are measuring the movement of the floor in the room above caused by the movement in the floor of the room below, but they can’t tell what is food, what is water, what is manure, and what is elephant and what part of that change in the floor position is gorilla. Nor can they absolutely tell if the whole building is tilting or twisting.
They are literally, measuring a baseline for Greenland isostatic continental bedplate + mountain rebound + mountain growth at the only two visible parts of Greenland that they can measure: the tips of the mountains on both coasts. Between? They have no baseline, no change in baseline, and no change in baseline trend (acceleration) measured over time. It is equal to pretending they are “measuring” the change in Niagara Falls’ whirlpool depth in upstate New York by measuring the height of the seawater water at New York City and the height of the water at Lake Michigan at Chicago by satellite. The distance between measurements of the two mountain tops is just that: the distance between New York and Chicago, and they don’t know the elevation of the Appalachian Mountains in between, much less the smaller Niagara Escarpment, nor the Niagara River bed itself. Worse, they don’t know if the Appalachians in between are raising or lowering elevation.
So they correct for tides, correct for water temperature changes, correct for saltwater expansion compared to freshwater expansion, correct for what they assume is isostatic rebound of the ground at both locations due to the glaciers melting, correct for continental drift, correct for the dredging of the harbor and the new sidewalk on Manhattan coast. Then they calculate the change in the height of the falls from year to year. And decided they can tell us whether the depth of the Niagara River bed is increasing.
They have one bore hole starting into the Greenland cap. No data for whether the icecap is increasing mass, or decreasing mass. Even though we have found aircraft frozen under the ice by hundreds of feet since WWII, they have decided that the Greenland Ice Cap IS melting, and that the entire change in mass they observe is due to the icecap melting, and NOT any other movement of the trillions of tons of rock getting pushed down by the increased icecap load.
Smokey says:
August 17, 2012 at 4:09 pm
Entropic says:
“Climate scientists have to convince ME that there is something going on that is not typical of Earth’s climate.”
^That^ statement shows unequivocally that Entropic is not a scientist.
———————————————————————————
Sorry to disappoint you, Smokey, but Gail Combs made that statement in her August 17th, 12.50pm comment.
8/18/2012 heavy snow fall in australia up to a 1mt 24 hours in some ski resorts more to come bring on global warming read what the CSIRO have to say http://www.abc.net.au/news/2008-05-28/global-warming-to-shorten-ski-season-csiro/2450790
A great post here to use against the endless media blitz on ice melt/sea level rise that we’re used to.
I also read the Lomborg post on Slate referred to above. A lot of confused comments on that. Inconsistent, tho there were the usual regulars who resented anyone from “the outside” treading on what they considered to be their territory (not uncommon on blog site comment threads).
I put up this comment myself on Lomborg’s Slate post, ideas I think the common thread there has never considered:
“Thank you to Slate for getting a rational person like Lomborg to post here. The long litany of carbon dioxide’s ills now sounds like a broken record. Some readers are apparently obsessed. It is not possible to change the weather by driving your car or building a power plant. Droughts come and droughts go, so do hurricanes and tornadoes. A tiny molecule consisting of two atoms of oxygen and one atom of carbon cannot move the jet stream at 200 miles per hour (to direct a storm), or create a giant 1000-mile wide high pressure dome (to bake the earth with descending air).”
“One fatal flaw in CO2 theory is conceptual. Some folks seem to give the molecule a kind of spirtual “essence of evil”. It is to them “The Evil Gas with Roots in Hell”. But CO2 is a material object. It is not an actor in weather, it is acted UPON. The theory’s proponents have never identified a MECHANISM by which CO2 would be capable of doing all the nasty things it is reviled for.”
“It must have quite a potent essence of evil to be able to do what it is accused of. It’s only 4 molecules out of every 10,000 in the atmosphere. That’s a puny amount. We are dealing with theology here, not science.”
From Smokey on August 17, 2012 at 4:09 pm:
*ahem*
Um, Smokey? You must have mis-copied something, as that particular line was from Gail Combs here.
David, It’s somewhat misleading to talk about glaciers flowing downhill in the context of Greenland. Greenland is basically a large ice filled depression surrounded by mountains. The weight of the ice pushes the edges of the ice out through gaps in the mountains forming outlet glaciers. It’s analogous to toothpaste being squeezed out of a tube.
For me the interesting point is the albedo change. Its a +ve feedback and must be contributing a significant proportion of the melt. To what extent is the albedo change natural, and to what extent is it due to anthropogenic particulates? And to what extent is the melt due to insolation changes?
Elsewhere in the world we see south facing glaciers (in the NH) retreating, while north facing ones aren’t (Himalayas, Cascade volcanoes). I strongly suspect this also the case in Greenland.
dorlomin, from the declining Guardian, is living in denial. Get with the program!!! Greenland will not all melt in your grandchildren’s lifetime.
RACookPE1978 says:
August 17, 2012 at 4:28 pm
“Even though we have found aircraft frozen under the ice by hundreds of feet since WWII, they have decided that the Greenland Ice Cap IS melting, and that the entire change in mass they observe is due to the icecap melting, and NOT any other movement of the trillions of tons of rock getting pushed down by the increased icecap load.”
This is the only part of your comment that I can answer in the short time I have left.Talk to David Middleton about GRACE.
The Greenland ice sheet grows from above each Winter as snowfall accumulates.Finding an aircraft like the P-38 now restored as “Glacier Girl” 260 feet down indicates that ice accumulates at about 4 feet a year. The weight on top of the ice sheet causes it to spread, with most melting taking place from the bottom and the edges, with some surface melt from warming in Summer and during occasional flash warming events like July 12th. It might take up to 100,000 years for a water molecule falling as snow on the icecap to return to the ocean. Whether the ice volume increases or decreases depends on the relative rates of accumulation and melting.
You might like to read the links in my 3.41pm comment. Some of these processes are discussed.
Goodnight , all.
Entropic man says:
August 17, 2012 at 3:32 pm
Consider Gail Combs. She has a hypothesis that the temperature variations we see are driven by three interlocking cycles of different lengths. Does she present data and calculations to demonstrate that this is so?……
============================
ROLLS EYES ~~ I am not the one who did the research turning up those cycles in the geologic record. It is people like Dr Richard Feynman’s sister who have.
AND You still have it Ass Backwards. I am not the one who is asking everyone in the world to start living like some medieval monk doing penance for enjoying life and GASP using energy to make my life comfortable. It is Climate Scientists/Activists and politicans who are.
The null hypothesis is nothing abnormal is happening and humankind can continue to use the energy that makes life more than a living hell. Climate Scientists are supposed to provide the proof there is a problem. Said Climate Scientists have had TRILLIONS of dollars thrown at them over a forty year period to do just that. (Which in itself is suspect) So what do they have to show for all that time and money???
1. A mangled, mutilated, ever changing temperature record that even they say is not showing the warming modeled.
2. A record of evading FOIA requests and even the Parliamentary request to get the Australian National Audit Office to reassess the BOM records. In response, the BOM, clearly afraid of getting audited, and still not providing all the data, code and explanations that were needed, decided to toss out the old so called High Quality (HQ) record, and start again. The lawsuit on the same subject in New Zealand has also been evaded. NIWA is squirming and squiggling in response. link A, From the “A goat ate my homework” excuse book: and link B and link C That does not include two lawsuits here in the USA and lots of dancing around the shoddy weatherstation siting that has been reluctantly addressed.
3. Then there is the fact TEMPERATURE is not even a good measure of the energy in the atmosphere! Forty years and they are measuring the wrong parameter. You have to include humidity and that is not increasing but decreasing. Therefore with the temperatures more or less stable for the last 10 to 15 years and the Global Atmospheric Specific Humidity decreasing the system energy is not increasing it is decreasing. graph
Which brings us to point
4. The temperature – CO2 response is logarithmic (actually it is a logarithmic relationship between IR absorption and CO2 concentration.) The more CO2 the less bang for the buck until it saturates and there is no more response. Graph (Wm2) and Graph temp response Also this discussion on the IPCC Logarithmic Formula SEE more technical discussions at Steve McIntyre’s Climate Audit
The Warmist/IPCC view is one of strong positive feedback playing a major role with the main culprit being H20 in all forms increasing in the atmosphere, and being viewed in all forms as a positive feedback on multidecadal and greater time frames. Only in this way can you get a “Run away” global warming from a gas near saturation.
And that is where the theory runs smack dab into reality. There is already enough CO2 in the atmosphere that additional amounts have smaller and smaller effects per the graphs above. More important the all important feed back that multiplies the effect of CO2 by a factor of three, Atmospheric Specific humidity is headed in the WRONG DIRECTION.
All I see at this point is an example of practical politics.
“The whole aim of practical politics is to keep the populace alarmed (and hence clamorous to be led to safety) by menacing it with an endless series of hobgoblins, all of them imaginary.” ~ H. L. Mencken
That means you are going to have to come up with something rock solid with all the data and methods open to validation and verification. Only in this way can you undo all the distrust generated by the scientific fraud being uncovered in all areas of science.
Entropic man says:
August 17, 2012 at 11:51 am
Sorry Entropic,
We do not have to convince “climate scientists”. They have to convince us that the null hypothesis, namely the existence of natural climate change cycles, is not the dominant factor in observed climate fluctuations. On the basis that there are times in the Holocene that have been warmer than the present and that historical evidence shows cyclical advances and retreats in glaciation, the onus is on your vaunted “climate scientists” to prove their hypothesis to us, the tax payer and their ultimate employer. They convince us, not we convince them. Capiche?
Entropic,
If you won’t listen to me, at least pay attention to Robert Austin.
The southern third of Greenland is too far south to have an ice-sheet. The summer solar insolation is too high to allow glaciers to build up. The only reason the ice-sheet is there is because of the ice accumulation in the centre/north during the ice ages.
If the interglacials last for 20,000 to 25,000 years (rather than the typical 10,000 to 15,000 years), the southern third of Greenland melts out and the centre/north height will drop by 500 metres or so.
The last time this happened was the interglacial at 400,000 years ago, which was not a particularly warm one (less than current temperatures probably), and the southern third of Greenland melted out and small trees even grew there.
The Greenland ice-sheet has been shrinking since the last glacial maximum and will continue to do so for 50,000 years or even 120,000 years (when the Milankovitch Cycles turn low enough for the next ice age to begin – they don’t until then).
That is the science .
Mr Lynn says:
August 17, 2012 at 9:19 am
Robin says:
August 17, 2012 at 8:53 am
Well here’s the latest in the related junk science education push. NSF just granted $19 million to push the manmade global warming meme in US classrooms on malleable, captive minds.
http://blogs.edweek.org/edweek/curriculum/2012/08/nsf_promotes_climate-change_ed.html?print=1
Good grief! How can we put a stop to the federal government promulgating junk science to kids?
Just electing a new President isn’t going to do it. The entrenched bureaucracies aren’t going to change unless people are fired and replaced.
/Mr Lynn
========================
Put me in the position and I can show even D. Trump how and when to speak the “two words”. 😉
Entropic man says:
August 17, 2012 at 4:25 pm
Sounds like you believe that we might be able to delay the next ice age through our profligate CO2 emissions. Not exactly the CAGW disaster that most warmists are promoting. Can one believe the hypothesized man made warming to be beneficent without summery excommunication from the warmist congregation?
summery excommunication
lol Best climate pun I’ve seen in a while.
Entropic man says:
August 17, 2012 at 4:25 pm
Gunga Din says:
August 17, 2012 at 3:56 pm
OK. So what is the Greenland Ice supposed to be? If the melting is abnormal due to Man, what is normal?
Without knowing what “normal” is, how can anyone say what is happening is “abnormal”?
My question remains unanswered.
E-Man says: My own view is that we are in the later part of an interglacial, with changes in Earth’s orbital eccentricity gradually cooling high latitudes of the Northern Hemisphere as we move towards the next glacial period. Arctic ice should be getting thicker in Winter and gradually more extensive at all times of year. The Greenland ice sheet should be gaining mass and glaciers getting longer. Average temperatures worldwide should be dropping by about 0.6C per milennium and CO2 decreasing from 280ppm towards 200ppm.Sea level should decline as water accumulates in expanding glaciers and ice sheets.
This is what the information available suggests happened at this stage in previous interglacials. The end result in a few millenia should be ice sheets down to about 50N latitude for the next 90,000 years.
========================================================================
Thanks for giving your view.
As far as Greenland goes, the information from the ice cores in the post shows that the current melting is right on schedule. Nothing “unprecedented”. No indication that Man has made anything “abnormal”.
The only thing that would be abnormal about it would be if the CAGWers passed up the opportunity to spin a headline from it.
A very interesting article, thank you. Also, some excellent comments.
The Entropic Man was making waves for a while there, but ultimate PWNAGE at the hands of Gail Combs, JJ and Robert Austin was inevitable. No wonder he scooted ‘off to bed’!
}:o)
@Gail
TAR
Section 1.3.1 of TAR stated:
…It has been suggested that the absorption by CO2 is already saturated so that an increase would have no effect. This, however, is not the case. Carbon dioxide absorbs infrared radiation in the middle of its 15 mm band to the extent that radiation in the middle of this band cannot escape unimpeded: this absorption is saturated. This, however, is not the case for the band’s wings. It is because of these effects of partial saturation that the radiative forcing is not proportional to the increase in the carbon dioxide concentration but shows a logarithmic dependence. Every further doubling adds an additional 4 Wm-2 to the radiative forcing.
Actually, I’d dispute this as a distortion,the assumption about this falls out of the Comparison of Earth and Venus (1, and 100ATM atmospheres ) Spectrographic analysis shows that the width of the CO2 absorption band is wider on Venus than Earth. But Lets add in Mars, Mars has an atmospheric pressure of 0.007 ATM or about 0.7% of that of the earth, almost all carbon dioxide, while the Earths CO2 partial pressure is about 0.04% (400ppm) so Mars has 0.7/0.04 or 17.5 times the CO2 in its atmosphere than Earth does, but has NARROWER absorption bands than Earth. This leads my mind to conclude that the width of the CO2 Absorption band is related to Atmospheric density and not the amount (partial pressure) of CO2.
The corollary of this is that for CO2 to widen the absorption band, it must add to the volume of the atmosphere, however we note that when we burn things, we combine two oxygen atoms from the atmosphere with carbon from the fuel and produce the same amount of carbon dioxide as the oxygen we extract. CO2 does not therefore add to Atmospheric pressure and is incapable of widening the absorption bands. CO2 will therefore actually saturate. I don’t think the Physics here is quite right.
It may be that I am wrong here, so I’m quite open to being corrected.
I suggest you actually read the post before commenting.
Bobl says:
August 17, 2012 at 9:07 pm
As far as I remember from the course some 45 years ago, it is the total number of molecules in the light pathway which is of interest. In the CO2 case, that is percentage of CO2 molecules x air density x length of the pathway. Thus for Mars, the percentage of CO2 is high, but density and pathway are way smaller than on earth…
Entropic man says:
August 17, 2012 at 10:57 am
Thank you, for the answer and the link, however the link does not seem to work… eventually could you write it in full so that I can copy-paste and try to read the article?
Lars P:
re. your post at August 18, 2012 at 2:08 am which is addressed to the paid troll who posts as Entropic man.
Please see my post addressed to JJ at August 17, 2012 at 2:32 pm.
As you can see, despite repeated requests the paid troll has not answered JJ’s question but he/she/they have made several subsequent posts which include evasions and excuses.
As I said in my post addressed to JJ, this is what that troll always does and I gave my understanding of why he/she/they does it. (I assume it pleases his/her/their paymasters).
I suggest that he/she/they should be ignored.
Richard
Bobl says:
August 17, 2012 at 9:07 pm
@Gail
TAR
Section 1.3.1 of TAR stated:
…It has been suggested that the absorption by CO2 is already saturated ….
Actually, I’d dispute this as a distortion,…..
The corollary of this is that for CO2 to widen the absorption band, it must add to the volume of the atmosphere, however we note that when we burn things, we combine two oxygen atoms from the atmosphere with carbon from the fuel and produce the same amount of carbon dioxide as the oxygen we extract. CO2 does not therefore add to Atmospheric pressure and is incapable of widening the absorption bands. CO2 will therefore actually saturate. I don’t think the Physics here is quite right.
It may be that I am wrong here, so I’m quite open to being corrected.
__________________________________
Bobl, I was only using the TAR quote to validate the log relationship. The widening of the absorption bands may be due to the increase in partial pressure not the absolute pressure. BTW. Even with that you are still not talking ‘CATASTROPHIC’ warming because the evidence says there is no increase in H2O so the factor of three multiplier is just not there and at 400 ppm we are at the diminishing returns end of the logarithmic curve.
So even using their physics, their logarithmic response at higher ppm of CO2 and the proven reduction in Atmospheric Specific Humidity from NOAA they do not have the data supporting the theory of a ‘CATASTROPHIC’ increase in temperature.
You could even say the CO2 curve and the temperature curve for the last twenty years is following the log response curve! (snicker)
Thank you, David.
Every voice helps, when dealing with ignorance.
Off topic I know but the article jogged my memory about the Arctic row 2012 so here is an extract from Thursday:
I would love for someone to contact Dr. Ron Kwok at JPL/NASA and/or Dr. James Morrison at washington.edu to see what the heck is going on out here (both polar weather experts we contacted prior to departure). I suspect the tough conditions have something to do with the unusually cold winter but I don’t know.
Scott Mortensen
August 16, 2012
Off the northwest coast of Alaska
Entropic man says:
August 17, 2012 at 3:32 pm
I get that a lot here, Gunga Din. These people are negative.
So AGW is not the most negative belief on the planet?
Take a look at the satellite images of South West Greenland at r02-c01 and r02-co2. There sure is a lot of melting going on. I realise this is the height of the melt season but I’ve never taken the trouble to look at it before so have no idea if this amount of melting is to be expected.
The 250m images provide exceptional detail and the melt lakes and holes are clearly defined. I wonder what the dark strip running up the western edge of the ice is caused by?
Entropic man on August 17, 2012 at 10:49 am
Mr. Middleton, do you know on what dates your photos in figures 11 and 12 of the Jakobshavn Isbrae were taken? The calving fronts labelled reflect the minimum extent of the glacier at the warmest part of the thaw.
The position of the ice front in the photograph and the lack of snow suggest that the picture was taken considerably later in the season after the ice front had moved seaward once more, but before the first snowfall.
[…]
If the Greenland ice sheet was “disappearing,” it wouldn’t matter what time of year the photos were taken.
Satellite image link for my post above. Sorry about that, perhaps the moderator could include it and delete this to tidy up the thread.
http://rapidfire.sci.gsfc.nasa.gov/imagery/subsets/?mosaic=Arctic.2012230.terra.4km
I should have better explained the differences between the ice cap (~continental glacier) and outlet glaciers. The calving and melt dynamics of the outlet glaciers are often reported as indications of destabilization of the entire ice sheet; which is nonsense. That’s why I included a link to Ollier & Paine.
Jakobshavn Isbrae As of Yesteday 17/083012. Scroll to middle of vertical and Horizontal axis. I have selected outline coasts so it is easier to see where the fjord starts.
http://rapidfire.sci.gsfc.nasa.gov/imagery/subsets/?subset=Arctic_r02c02.2012230.terra.250m&vectors=coast
How come this data from NOAA Aug 17, 2012 shows Greenland more than 90% icecovered? :
http://www.natice.noaa.gov/pub/ims/ims_gif/DATA/cursnow_asiaeurope.gif
Is there a more recent satellite photo available?
Thanks James for the Jakobshavn Isbrae photo!
Reblogged this on Globalcooler's Weblog and commented:
A short time ago I made a comment in one of my articles that the Arctic Ice might be one of the largest summer minimums in at least 5 years. I appears thet will not be the case. That requires that I point out my error and replace my prediction with a rational view of what is actually happening. One of the best is this by David Middleton.
Gail Combs says:
NOPE, you have it backwards. Climate scientists have to convince ME that there is something going on that is not typical of Earth’s climate.
Especially given that “change” is typical of Earth’s (and probably other planets’) climate.
Even if they could do that it would still be necessary to provide good evidence that human activity is a significent causal factor. That they had correctly identified what that factor was. That any proposed “solutions” would actually be effective. Etc.
Lars P. says:
August 18, 2012 at 2:08 am
Entropic man says:
August 17, 2012 at 10:57 am
Thank you, for the answer and the link, however the link does not seem to work… eventually could you write it in full so that I can copy-paste and try to read the article?
Sorry, I cant get back to the accursed link myself!
Try the links in my Aug 17,2012 at 3.41pm comment. I think they cover a lot of the same ground.
David Middleton says:
August 18, 2012 at 9:05 am
ntropic man on August 17, 2012 at 10:49 am
Mr. Middleton, do you know on what dates your photos in figures 11 and 12 of the Jakobshavn Isbrae were taken? The calving fronts labelled reflect the minimum extent of the glacier at the warmest part of the thaw.
The position of the ice front in the photograph and the lack of snow suggest that the picture was taken considerably later in the season after the ice front had moved seaward once more, but before the first snowfall.
[…]
If the Greenland ice sheet was “disappearing,” it wouldn’t matter what time of year the photos were taken.
—————————
It matters considerably. Photos taken at different times in the season will show the solid ice of the glacier, the calving front and the sea ice in different positions along the fjord.. A cynic might wonder if you were trying to present photos of a different part of the season and pretend they represented the maximum retreat of the calving front. This would present the illusion that the long-term retreat had stopped.
Gail Combs says:
NOPE, you have it backwards. Climate scientists have to convince ME that there is something going on that is not typical of Earth’s climate.
Robert Austin says:
August 17, 2012 at 5:49 pm
They convince us, not we convince them. Capiche?
My own view of climate change without humanity was written in my Aug 17, 4.25pm comment. Add “Since 1880 cAGW has reversed the downward trend towards a glacial period.” and you have a complete idea of my thinking.
Can give me your world view in a similar way, in about the same detail, with an idea of the mechanisms you think are controlling the system and some numbers. ( Specifics please, not vague generalisations like natural variation.) Some things we may already agree on. For example do you accept the long term pattern of Milankovich cycle driven glacials and interglacials?
I need to know clearly what you mean by typical, before I can construct proper counter arguments. If you are not clear, yourself, what you believe there would be no point in trying to refute foggy thinking.
Ms Combs, while reading up on Bond events and Daasgaard-Oeschger oscillations I ran across this paper on the effect of various cycles on temperature. You might find it interesting.
http://www.agci.org/docs/lean.pdf
The Standardized Melting Index (SMI) is defined as the number of days where melting occurs multiplied by the surface area. So, the SMI for 2012 in Greenland is at an all time high after 33 years of data. The satellites being used are capable of measuring the area of the melt, but are incapable of measuring the thickness of the melt from the agw crowd. Will someone please tell me what possible significance there is to knowing time multiplied by area? Anyone?
Area of wetness means nothing. The sudden SMI increase could be the result of a parked high pressure area or change in surface albedo.
Volume of melt on the other hand, like cubic kilometers per day,would be of utmost significance. These satellites do measure elevation of ice. However, since there has been no discussion on any ice elevation change, one can only conclude that if the elevation was dropping, indicating an ice loss, we certainly would have heard about it by now.
“Ice cores from Summit show that melting events of this type occur about once every 150 years on average. With the last one happening in 1889, this event is right on time,” says Lora Koenig,
——————————————————————————————————————
The “right on time” is 27 years early.
Gail, I am just pointing out to the assembled readers, that in fact the assumption that the CO2 / Temperature follows a log law, presupposes that CO2 adds to the atmosphere, if that isn’t happening then the log characteristic is actually likely to break down at some point and become saturated.
For example project backwards using the IPCC numbers 390PPM (33 deg GHE) 190 PPM (30 deg GHE) 95 (27 deg GHE), 47, 22, 11, 5.5, 2.5, 1.2, 0.6, 0.3PPM where do I stop, is really the step between 0.15PPM and 0.3 PPM really going to result in a 3 degree temperature rise for 0 deg GHE to 3deg GHE. What happened for the doubling before that 0.075 to 0.015 since we are right back to the black-body temperature does the relationship break down there? Or are we going to get a temperature less than the backbody temperature, a greenhouse cooling ;-). The point is that this will not be a strict log law relationship, there will be practical limits at both ends, one is the available energy input, the other is the infinite slope of the log curve at zero, real world has to be something less than that
CO2 can only ever increase absorption 17% over what it does now (85 % energy saturated). Since the rise from all sources so far is 33 deg, the absolute maximum that could occur even in a 100% CO2 atmosphere is 5.2 degrees, feedback or not. Even if that occurred, it’d still not be catastrophic – Mind you we’d all be dead of asphyxiation, since we’d run out of oxygen long before we get to 100% CO2
Instead we get told 3 degrees per doubling giving more than 5.2 degrees rise by the time we get to 1600 PPM (0.6% CO2) – Just Ridiculous.
Oops
giving more than 5.2 degrees rise by the time we get to 1600 PPM (0.16% CO2)
@Entropic man – Some Numbers for you – you wanted hard numbers right?
1. IPCC 6 Degrees by 1600PPM (0.16% CO2 atmosphere)
BOBL’s calc 33 Deg GHE so far, CO2 85% Saturation, Remaining energy 15% ratio 15/85 17% increase in GHE above amount so far = 5.2 Degree rise (for 1 ATM 100% CO2 Atmosphere) – This is called a bounds test BTW
2. SCIENCE – Rise for last 100PPM 0.7 deg
IPCC Forecast for next 100PPM 1.2 – 2.4 deg
Temperature/CO2 relationship is a log (ln) law – Please reconcile how the rise for the next 100 PPM can be greater than the last 100PPM if the relationship is a log law – Numbers please?
3a. Gain for feedback is a nett of 3 degrees due to feedback, proportion of output fed back to input (loop gain) IPCC – 0.67 – Q 1 – How is it this is stable.
3b – There are significant negative feedbacks in the climate, Lapse Rate feedback, Radiative Loss, Cloud Albedo amounting to an attenuation of the direct effect of C02 by a factor of 5 (1/5th). This implies a counteracting positive feedback resulting in a multiplication of 15 must exist, requiring a total positive feedback loop gain (proportion of output fed back to input) of more than 0.95 – Please explain how this is stable. Bode plot to prove stability please Entropic?
Lets see if Entropic can come up with Post-Normal mathematics?
Bobl says:
August 18, 2012 at 6:24 pm
Mind you we’d all be dead of asphyxiation, since we’d run out of oxygen long before we get to 100% CO2
We will never run out of oxygen since if oxygen gets below 15%, fires cannot burn so no cars or trucks can run, but we would still live. With artificial respiration, the person can be revived with air that has 17% oxygen and 4% carbon dioxide. There just would not be too many olympic records set if oxygen dropped to 15%.
Bobl says:
August 18, 2012 at 6:52 pm
2. SCIENCE – Rise for last 100PPM 0.7 deg
IPCC Forecast for next 100PPM 1.2 – 2.4 deg
You quote a rise of 0.7C for the change in CO2 from 0.028% to 0.038%. You make the elementary mistake of assuming that the temperature change due to this CO2 increase has gone to completion, and is therefore going to be less than the temperature rise due to the change from.0.038% to 0.048%. You forgot that the latter is a prediction to equilibrium while the effect of the former is ongoing as equilibrium has not yet been reached.
As you pointed out temperature is proportional to log[CO2], To suggest that the first quantity should be less than the second is mistaken.
If the rest of your attempt to drown me in mathematics is of the same quality, it is probably not worth answering.
Entropic presumes far too much based on zero scientific evidence. Any effect from human emitted CO2 is too small to measure. And of course, from years to hundreds of millennia, rises in CO2 have always followed rises in temperature, not vice-versa.
And where’s that global warming, anyway? The rise in [harmless, beneficial] CO2 seems to be an especially impotent temperature driver over the past three decades. Sorry about Entropic’s failed CO2 conjecture. Based on real world evidence, it is obviously mistaken.
I’m not getting any closer to finding out what a sceptic consensus on the science looks at.
Should I be talking to the sceptic scientists who regard a doubling of [CO2] as causing 1.1C warming from direct back radiation and 0.3C forcing ( the reference is on WUWT, I think, but a search didnt pick it up), or to Smokey who does not regard it as a greenhouse gas at all?
Should I be talking to JJ and David Middleton who regard n=13 as too small a sample size of years for analysis of Greenland albedo trends, or to Robert Carter who regards n=13 as enough years to confidently predict that global warming has stopped?
Entropic says:
“Can give me your world view in a similar way, in about the same detail, with an idea of the mechanisms you think are controlling the system and some numbers. (Specifics please, not vague generalisations like natural variation.)” And: “I’m not getting any closer to finding out what a sceptic consensus on the science looks at.” And: “…or to Smokey who does not regard it as a greenhouse gas at all?”
First, Entropic cannot find a comment of mine that states that CO2 is not a GHG. That is because Entropic suffers from confirmation bias, and sees what he wants to see, whether it’s there or not.
And it appears that the scientific method cannot penetrate the E-man’s skull. I’ll try one more time, so listen up, Entropic: scientific skeptics [the only honest kind of scientists] have nothing to prove. The onus is entirely on those arguing the failed CO2=CAGW conjecture. Instead, they always try to shift the burden off of themselves, and onto scientific skeptics who are simply questioning their evidence-free belief system.
But the scientific method does not work that way. YOU have to convince US, using testable scientific evidence. Since you lack any such evidence, you try to shift the burden onto skeptics to, in effect, try and prove a negative. But that dog won’t hunt here on the internet’s “Best science” site. It is the CAGW crowd that must produce testable evidence, and they have failed.
CO2 may be a GHG, but its effect is so small that it is literally unmeasurable. Practitioners of the scientific method would see that their conjecture has fallen apart for lack of any evidence, and try to re-formulate a new conjecture that fits the evidence and raw data. But not the alarmist crowd. They want to “adjust” the evidence to fit their failed conjecture. Climate alarmists are to science as astrologers are to astronomy.
Smokey says:
August 19, 2012 at 1:29 pm
Entropic presumes far too much based on zero scientific evidence. Any effect from human emitted CO2 is too small to measure. And of course, from years to hundreds of millennia, rises in CO2 have always followed rises in temperature, not vice-versa.
And where’s that global warming, anyway?
__________________________________
Rather than cherrypicking one graph which shows what you want from the SSMI data , I thought I’d include all four decadal trend maps and let people decide for themselves what is happening.
http://www.ssmi.com/msu/msu_data_monthly.html?type=trend&channel=tlt
http://www.ssmi.com/msu/msu_data_monthly.html?type=trend&channel=tmt
http://www.ssmi.com/msu/msu_data_monthly.html?type=trend&channel=tts
http://www.ssmi.com/msu/msu_data_monthly.html?type=trend&channel=tls
To quote from the SSMI website:-
Globally averaged trends computed over latitudes from 82.5S to 82.5N (70S to 82.5N for channel TLT) are shown in the table below, and include data through July, 2012:
___________Start Time______Stop Time______# Years______Global Trend
Channel TLT__1979__________2012-07________ 30+_______0.133 K/decade
Channel TMT__1979__________2012-07________30+_______0.078 K/decade
Channel TTS__1987__________2012-07________22+_______-0.011 K/decade
Channel TLS__1979__________2012-07________30+_______-0.301 K/decade
Smokey says:
August 19, 2012 at 2:05 pm
“Entropic cannot find a comment of mine that states that CO2 is not a GHG.”
“CO2 may be a GHG, but its effect is so small that it is literally unmeasurable.”
——————————
I think you just provided question and answer together. A GHG whose “effect is so small that it is literally unmeasurable” is not a GHG.
Smokey says:
August 19, 2012 at 1:29 pm
“And where’s that global warming, anyway?”
—————————————
Rather than cherrypicking one channel from SSMI, which shows the trend you want, I thought I would give all four and let people make up their own minds. Remember that these maps exclude the high Arctic and the Antarctic plateau.
http://www.ssmi.com/msu/msu_data_monthly.html?type=trend&channel=tlt
http://www.ssmi.com/msu/msu_data_monthly.html?type=trend&channel=tmt
http://www.ssmi.com/msu/msu_data_monthly.html?type=trend&channel=tts
http://www.ssmi.com/msu/msu_data_monthly.html?type=trend&channel=tls
Sorry to put up duplicates there, and for the untidy table. I hate this word processing software!
David Middleton says:
August 17, 2012 at 2:56 pm
Thank you, great!
richardscourtney says:
August 18, 2012 at 3:33 am
I see, thanks! I always try to check all information that looks reasonable. I found my answer in David’s post, somehow I missed it first time I checked
Entropic man says:
Should I be talking to JJ and David Middleton who regard n=13 as too small a sample size of years for analysis of Greenland albedo trends, …
Don’t put words in my mouth, bucko.
Reasking that which remains unanswered, having been reasked for the same reason previously: You hold that 12 years of data produces a distribution that assigns what meaning to the terms “divergence” and “normal variation”, exactly?
JJ says:
August 19, 2012 at 3:26 pm
You hold that 12 years of data produces a distribution that assigns what meaning to the terms “divergence” and “normal variation”, exactly?
In the context of the albedo data. I regarded the values within 2 Standard Deviations of the minimum albedo mean as normal variation.
The 2011 and 2012 values were more than 2 Standard Deviations from the mean, indicating that the probability of their being part of the normal range of variation was less than 5%. I used divergence as a convenient shorthand for this.
Thinking on the matter later it occured to me that the 6/7 events per milennium frequency quoted gave an annual probability of occurence of about 0.6%, which agreed with my probability derived from the data in the graph.
In other scientific contexts I have tended to find that if two independant lines of evidence relating to the same phenomenon agree, one can have increased confidence in their validity.
As for putting words into your mouth, I interpreted your earlier comment as expressing unhappiness that the sample size was not larger. I would prefer n>30 for statistics involving 95% confidence limits myself, but in the case of the albedo data perforce went with what was available.
I’m not getting any closer to finding out what a sceptic consensus on the science looks at.
Science isn’t about consensus. Science is about constructing theories, looking for evidence and seeing if the evidence supports or falsifies the theory. Remember, no amount of evidence will ever prove a theory correct.
That so many theories are floated here, is evidence of how little we understand about the climate and complex the climate is. It may be that most of them have some truth and climate change results from their composite effect.
I personally think that the warming from 2XCO2 is around 0.3C as calculated by John Daly and more recently here by Willis E. I also think the elephant in the climate room is albedo (and albedo changes from aerosols). But we only have good albedo data from 2000, and global albedo has been flat, as have temperatures. So that doesn’t tell us much.
Philip Bradley says:
August 19, 2012 at 11:48 pm
Entropic man-I’m not getting any closer to finding out what a sceptic consensus on the science looks at.
Science isn’t about consensus. Science is about constructing theories, looking for evidence and seeing if the evidence supports or falsifies the theory. Remember, no amount of evidence will ever prove a theory correct.
————————————–
Within sciece I would agree with you. Unfortunately, in practice, scientists are expected to advise political decision makers.
Politicians have no liking for “a range of probabilities” or ” some of us think ” or “Fred’s theory says this and Charlie’s theory says that” . They demand a consensus opinion on the science to put alongside other factors such as voter pressure, economics, etc.
This creates oddities like the North Carolina state commission on seal level rise.A group of academics were asked to forecast the amount of sea level rise to 2100. Individual estimates varied from 18″ up to 55″. The politicians demanded a single figure and got 39″. They then decided mitigation would be too expensive and tried to pass a law banning anyone from discussing the matter.
http://www.reuters.com/article/2012/07/03/us-usa-northcarolina-idUSBRE86217I20120703
http://www.scientificamerican.com/article.cfm?id=north-carolina-sea-level-rises-desipte-senators
The IPCC reports are the consensus response of climate scientists to the same political requirement for scientific advice on climate change. Like it or hate it, AR4 is what decision makers requested. Their response to it varies with the political and other realities of their own situations. In Tuvalu they are bying land in Fiji to resettle their population if necessary. In the US a strong anti-climate change lobby forces politicians to keep their heads down.
What is missing on the sceptic side is some credible equivalent to AR4, a consensus document advising decision makers what to expect if IPCC are mistaken. I have seen documents describing a consensus among sceptic scientists that the impending doubling of [CO2] would produce a warming of 1.1C, plus 0.3C forcing, but outside the sceptic community that has not been widely reported. It may have been drowned out by the cacophany of different ideas coming from different factions within the community.
Friends:
The paid troll who posts under the name of Entropic man provides a clear statement of the desires of his/her/their paymaster(s) by saying in the post at August 20, 2012 at 3:40 am
Scientists practice science. They do not stop the practice of science because “politicians” want to use the statements of scientists.
Scientists are required to do their research and state what they have found, the uncertainty of their findings, and what they want to find. Anything else is not science.
Scientists are not “expected” to present a “consensus” (i.e. a single) opinion. Indeed, that is the opposite of what is expected of them.
A “consensus of opinion” is a rejection of science. Indeed, it is a prevention of science because it inhibits alternative understandings. And the selection of a single – i.e. a “consensus” – view of scientific opinion has a name: it is Lysenkoism.
(Anybody who does not know how Lysenkoism has already killed millions of people should google for ‘Trofim Lysenko’.)
Politicians obtain information from many sources and science is only one of them: others include economics, military intelligence, popular opinion, etc.. Politicians sift and evaluate this information to determine courses of action. THAT IS THEIR JOB. In democracies it is the job they are elected to do.
Entropic man wants politicians to only be provided with the scientific information which he wants them to have. His Lysenkoism is an attempt to destroy science and to usurp the political process.
Richard
Entropic says:
“What is missing on the sceptic side is some credible equivalent to AR4, a consensus document advising decision makers what to expect…”
The consensus is clearly on the side of scientific skeptics, as stated in the OISM petition, which debunks the UN/IPCC nonsense. More than 31,400 American scientists, 9,000+ with PhD’s, have co-signed an unequivocal statement pointing out that CO2 is harmless, and beneficial to the biosphere. Counter petitions attempted by the alarmist crowd have gotten fewer than 10% of those OISM numbers. Thus, the true consensus is heavily in favor of scientific skeptics. Deal with it, that is reality.
And I see that Entropic is stil fixated on Tuvalu sinking beneath the waves. How often must that patrticular climate alarmism be debunked, before people like Entropic finally accept the reality that Tuvalu is in ZERO danger from rising sea levels? It is simply not happening, yet people like Entropic continue to repeat the Tuvalu/sea level nonsense as if it were factual, when it is not.
Smokey:
There is an alternative to the IPCC AR4 which provides a clear summation of sceptical understandings of the science: it is the Non-Intergovernmental Panel on Climate Change (NIPCC).
The NIPCC document is far more credible than the IPCC AR4 (I contributed to the production of both of them). The NIPCC is the more credible than the AR4 because it presents a variety of understandings of the data while the AR4 presents a monolithic interpretation especially in its summaries.
Richard
@ Entropic man, Physics doesn’t change there may or may not be warming in the pipeline, it was as true of the past as now, therefore the 0.7 deg includes any in-pipeline warming, which by the log law, would have Greater effect than today. (Some pipeline since Global temperatures are heading down). Now where are your Numbers, I gave you numbers I want yours in return. You demand numbers, expect to have the same demanded of you,
Entropic man says:
August 19, 2012 at 1:49 pm
I’m not getting any closer to finding out what a sceptic consensus on the science looks at….
_____________________________
We are not Warmist Scientists, we do not “DO” consensus science because it is antithetical to the scientific method. Instead we argue a lot using the best data and logic we can obtain. If someone has a better understanding we can and will shift views. This is why we have a major problem with the Warmist Scientists who follow the The Philosophy Of Karl Marx and/or Hegel
We hold the position that there is an objective reality.
In both cases reality is in the mind of man and “Consensus” or ” Synthesis” is truth. Consider the old question, if a tree falls in the woods does it make a sound if there is no one there to hear it.
Hegel would say no, those on WUWT would say yes, and Marx seems to think reality is in the collective mind so I guess it would have to be put to a consensus.
Wow! I come in after lunch for a quick look at WUWT and find more than I have time to answer!
Briefly:-
Mr. Courtney- Politicans do indeed take advice from all directions. I do not want Lysenkoism. I want them to get the best advice possible. Did you notice my use of the word credible. From their viewpoint the IPCC have more credibility than NIPCC . Get your sceptic scientists singing from one sheet, get several demonstrably accurate predictions on record and, above all, separate NIPCC publicly and visibly from any perceived links with political lobby groups. They might then have more influence. Dont rail at me, get out there and convince your own population.
Smokey- Science is not a democracy, it is a test of theory versus reality. No matter how many votes it gets, if a theory fails that test it is wrong. Telling that to politicians is, however, an uphill struggle. Like Mr Courtney, stop railing at me and get a convincing case together. If you can successfully reassure the government of Tuvalu you should be able to convert many others too.
Gail-“We are not Warmist Scientists, we do not “DO” consensus science”. This is why you remain on the fringe. A cacophany of different opinions is useless to the man planning sea defences or irrigation systems or wondering whether to buy more snowploughs.
Bobl-“the 0.7 deg includes any in-pipeline warming,” No, it doesnt. Sea temperatures are a long way from equilibrium even for the warming we’ve seen so far. It will be another 50 years before the changes already set in motion reach a stable state.
Ah, I see: Entropic cites the mythical alarmist “consensus” as his authority. Then, when that fictional alarmist consensus is shown to be non-existent, Entropic suddenly reverses course and declares that “science is not a democracy”.
Got it. Confirmation bias and moving the goal posts constitute the entire alarmist argument. Because there is certainly no scientific evidence for the CAGW belief.
And BTW, CAGW is not a “theory”, it is a thoroughly debunked conjecture. Theories and hypotheses are testable. That rules out the CAGW conjecture, which has never been testable.
Entropic man says:
August 19, 2012 at 1:49 pm
I’m not getting any closer to finding out what a sceptic consensus on the science looks at.
The following may interest you:
http://www.quadrant.org.au/blogs/doomed-planet/2010/03/six-myths-about-deniers
One quote:
“5. “Deniers” think CO2 is irrelevant.
The issue is not whether CO2 is irrelevant, but, rather, how relevant is it?”
Entropic man says:
In the context of the albedo data. I regarded the values within 2 Standard Deviations of the minimum albedo mean as normal variation.
The question was, what does “normal variation” mean to you. i.e. what significance do you associate with it? “Normal variation” is not a term with a single connotation. In addition to having a dry and unevocative meaning which describes the result of a statistical calculation, it is also, not surprisingly, a normative term. Unfortunately, people tend to equivocate on the statistical and normative meanings that they associate with that term. This is not the “how did you calculate that” question. This is the “So what?” question.
The 2011 and 2012 values were more than 2 Standard Deviations from the mean, indicating that the probability of their being part of the normal range of variation was less than 5%.
So what?
See.
Thinking on the matter later it occured to me that the 6/7 events per milennium frequency quoted gave an annual probability of occurence of about 0.6%, which agreed with my probability derived from the data in the graph.
The 6/7/mil frequency was quoted for melt events. The graph tracks albedo. You’re making fruit salad.
As for putting words into your mouth, I interpreted your earlier comment as expressing unhappiness that the sample size was not larger.
That was not a comment, it was a question. The size of a sample does not affect my happiness absent an inappropriate use of that sample. I was inquiring as to the nature of the use to which you are putting that sample.
I would prefer n>30 for statistics involving 95% confidence limits myself, …
Why? Why are you not content with n=13? What do you think you would get for n=30 that you don’t have now? Why would that be important? Why N=30, vs say, N=60, or N=100? How are you making these choices?
… but in the case of the albedo data perforce went with what was available.
Why? You seem to be yearning for n=30, as if that would have some important effect on your conclusions, but you go right ahead and draw those conclusions with less than half that sample size. Why would you do that?
Friends:
I quote and deconstruct the comments addressed to me by the paid troll who hides behind the pseudonym of Entropic man. I invite others to whom he/she/they had addressed comments to do the same.
Entropic man says
Point 1.
The two statements
“I do not want Lysenkoism”
and
“I want them to get the best advice possible”
do not equate.
Who decides “best”? The paymasters of of Entropic man?
Politicians need ALL the information so they can assess it using the advice of their civil servants: that is why a government has a civil service.
The statement saying “I want them (i.e. politicians) to get the best advice possible” is an assertion of pure Lysenkoism.
Point 2.
Of course they do, and from the viewpoint of the NIPCC the NIPCC has more credibility than the IPCC. This is why the views of those (e.g. me) who were involved in production of both documents are more credible than the views of people who were involved in the production of only one of them.
However, the phrasing may have been wrong. I am not intending to ‘put words in the mouth of Entropic man, but it is possible that he/she/they intended to write
“From politicians’ viewpoint the IPCC have more credibility than NIPCC .”
If that were the intended meaning of Entropic man then it is clearly wrong. Politicians control the IPCC process (the IPCC is an interGOVERNMENTal panel). Every line of the IPCC documents is approved by representatives of governments (i.e. representatives of politicians) or it is excluded from IPCC Reports. Politicians give the IPCC no more credibility than any other organisation they control as a mouthpiece.
Point 3.
Entropic man says
This is a stated desire for pure Lysenkoism.
Scientists challenge data, they don’t “sing” anything, and they stop being scientists if they sing “from the same sheet”. It is the duty of every scientist to challenge data and not to “sing” it especially not in unison. Advocates do that, scientists don’t.
Point 4.
No! Science is as more about demonstrating an existing idea is wrong than it is about finding supporting information for an existing idea.
And ‘climate realists’ have a record of accurate prediction; e.g. rising CO2 will have no discernible effect on global temperature. Whereas the AGW-hypothesis has failed to correctly predict anything; e.g., the ‘hot spot’ is missing.
Point 5,
The NIPCC obtains funds from the Heartland Institute (HI), but that funding is trivial when compared to thethe funding of the IPCC which is entirely from politicians (i.e. governments).
Stop all funding from the IPCC or give half of that funding to the NIPCC would be a better option.
The gall of Entropic man in calling for the NIPCC to be de-funded is staggering. If he could prove HI influenced the NIPCC in any way then he/she/they might have a point. But the HI does not influence the NIPCC at all. Whereas politicians control the IPCC.
Point 6.
At best this is disingenuous. If the NIPCC is de-funded then it will cease to exist so it will have no influence. And if it is presenting scientific information then “influence” has no importance. People, including politicians, choose information to use.
Point 7.
Nobody “rails” at Entropic man. People regard him/her/them with contempt and some refute his/her/their nonsense (as I am doing) for the benefit of others.
Point 8.
Climate realists don’t have their “own population” but all available polls show we are having success at explaining to the general public the truth that the AGW-scare is nonsense.
I look forward to others deconstructing the nonsense which Entropicman has directed at them.
Richard
Entropic man says:
August 18, 2012 at 3:24 pm
Ms Combs, while reading up on Bond events and Daasgaard-Oeschger oscillations I ran across this paper….
_____________________
Thanks. And yes I do think Milankovitch had it correct.
Where I have a problem is the zeroing in on CO2 before the first step in “Troubleshooting” was ever taken. That step is listing every conceivable possible variable. For chemical batch processes it would be temperature, pressure, mixing time and rate, personel/shift, mix equipment raw material lot/vendor…. As far as I am concerned we are still at that step.
For the sun we know there is a 22 yr Hale cycle.
Gleissberg came up with the 88-year solar cycle, Joan Feyman et al confirmed it with the Nile flooding/aurora records and there is this paper Persistence of the Gleissberg 88-year solar cycle over the last ∼12,000years: Evidence from cosmogenic isotopes
The name of the 200 year cycle is the de Vries or Suess cycle. Again confirmed by Joan Feyman et al and this paper The influence of the de Vries (∼ 200-year) solar cycle on climate variations: Results from the Central Asian Mountains and their global link among others.
Heck even the US government acknowledges these solar cycles.
I am rather surprised you were not aware of these solar cycles.
The there is Variation in Earth Rotation and Global Temperature (An example paper from Colorado State Uni)
And this Solar Activity, Geomagnetic Field, Earth Rotation Rate, and Climate a series of papers presented in 2007?, and this Long Term Variations in the Length of Day and Climatic Change and this from NASA: Giant Breach in Earth’s Magnetic Field Discovered
You should already be aware of Svensmark and Friis-Christensen’s Variation of Cosmic Ray Flux and Global Cloud Coverage – a Missing Link in Solar-Climate relationships and the confirming tests. CERN experiment confirms cosmic ray action Also Article originally appeared in PhysicaPlus: Cosmic Rays and Climate by Dr. Nir J. Shaviv
Also by Shavir on CERN experiment: The CLOUD is clearing
And then there are other factors outside the earth. Shavir’s The Milky Way Galaxy’s Spiral Arms and Ice-Age Epochs and the Cosmic Ray Connection
On top of that is plate tectonics and the movement of the Caribbean plate closing the Isthmus of Panama that is thought to have caused a change in ocean circulation, resulting in the gulf stream and the Ice Ages.
Then there are the oceans that act as climate modifiers and have a major contribution to the climate much of which is still not understood. Bob Tisdale is writing a book on just one part of that.
That is just quickly off the top of my head. Heck they are just now figuring out that CO2 is not uniform in the atmosphere PHOTOS: Global Carbon Dioxide -AIRS Data, July 2008 and July 2009 (scales are not the same)
Do I know what factors regulate the climate? No but I do know it is not just one factor but a combination and CO2 is just a tiny part of it. The Sun, our only source of energy has got to be in the middle of it even though we have not figured out the how and the oceans/water cycle have to play a big roll since land temperature follow sea temperatures and not vice versa.
🙂
Why do I smile?
I have just been harangued from three directions.
I have been haragued about science by a man demonstrating that he knows little of science
I have been harangued about politics by a man demonstrating that he knows little of politics.
I have been harangued about statistics by a man demonstrating that he knows little of statistics.
Ms. Combs, thank you.At least one person is discussing science.
You describe ten different cycles, some I’d never encountered before, and a number of other sources of complexity in the system. From context, I think you regard this complexity as a barrier to understanding it.
This is not necessarily a problem.I worked in ecology and was bedevillied by the same difficulty. The solution was to look for the drivers of the system. In ecology we quickly found that if we concentrated on energy flow and nutrient cycles, plus a limited number of environmental variables like temperature and water, the apparant complexity bcame self cancelling. The non-driving variables were either of small influence or cancelled each other out.
In studying climate the same thing may happen . With a large number of cycles acting simultaneously on the atmosphere, land and oceans, some will be warming, some cooling and some neutral at any time and most will be self cancelling.
The cycles driving the system will be the ones showing strong correalations with the climate data. I suggest five possible candidates.
On the largest scale would be the 100,000 year Milankovich cycle of orbital eccentricity, which matchs the glacial/interglacial cycle well.
If the Sun does show grand minima and grand maxima, then we may have a 1000 year cycle, explaining MWP, LIA and the present warming though I would as yet regard that as speculative, our measured solar data has too short a baseline.
On a decadal scale we have ENSO, and the NAO, both showing in the record. THe 11 year solar cycle also shows in the data, though I would like to see a much more strongly establised link before I accepted that cosmic rays rather than insolation are the mechanism by which it interacts with us.
Models are disliked here, perhaps because the sceptics expect too much from them. A model is a simplified simulation of reality, working, within its limitations, using the same physics. What you can do with a model is to try the things you cannot do with only one Earth available. Different cycles can be included or left out and the effects observed. It quickly becomes apparant which are the drivers and which are not.
If a sceptic scientist is listening, with access to climate modelling software; try producing a workable model in which the driving cycles can be shown to generate the temperature record of the last milennium, overwhelming any variation due to increasing CO2. That would be the sort of evidence which I, and hopefully the rest of climate science, would take notice of.
Werner Brozek says:
August 20, 2012 at 9:13 am
Entropic man says:
August 19, 2012 at 1:49 pm
I’m not getting any closer to finding out what a sceptic consensus on the science looks at.
The following may interest you:
http://www.quadrant.org.au/blogs/doomed-planet/2010/03/six-myths-about-deniers
One quote:
“5. “Deniers” think CO2 is irrelevant.
The issue is not whether CO2 is irrelevant, but, rather, how relevant is it?”
———————————–
Thank you. An excellent article.
It highlights perhaps the biggest problem in judging the inputs to the climate change debate. How does one distinguish the members of the five main groups.
At one extreme are the deniers, peddling dubious ideas and data to suit their agenda.
Next are the sceptic scientists, presenting evidence and data.to support their world view
In the middle are those just doing science with no agenda.
Next are the pro-climate change scientists presenting evidence and data to support their world view.
At the other extreme are the envioronmentalists, peddling dubious ideas and data to suit their agenda.
With political and economic agendas smeared all over the debate as well, how is one to sort wheat from chaff?
Regarding CO2, I regard the match between the lab measured CO2 spectrum, the ground radiometry of the downward radiation spectrum, and Earth’s emission spectrum as consistent with the effect of CO2 acting as a greenhouse gas. My own back-of-the-envelope calculations also give answers consistent with the IPCCs mid-range model for the effect of increasing CO2. I also enjoy thought experiments like the recent statistics on the Greenland albedo data which so annoyed JJ. As a retired scientist and science teacher from a different discipline, this is the best I can do personally.
Beyond that I, and everyone else, are in the hands of the professionals; and which professionals one accepts evidence from depends on ones own [snip . . kbmod] filter settings.
@ Entropic man
Excuse me? Exactly when did we start having a pipeline 1850, 1900, 1970, whenever you were born?. The last 150 years has just as much of in-pipeline warming/cooling and is just as much not in equilibrium as now, climate is a dynamic thing, after all this “Pipeline” is simply speculated to be a Temperature lag produced by a Physical process (presently unknown). The supposed Pipeline (lag) is also a problem with the feedback hypothesis, lags create temporal instability (oscillation) when they are in a feedback loop, to have such a large lag in a feedback loop of such gain, oscillation is inevitable – so now you need to demonstrate that oscillation occurs.
By the way we still haven’t seen your calculations, nor have you proven me wrong …
Hmm guess I remain unrefuted on all three points
bobl 3
Entropic Man 0
Entropic man says:
Why do I smile?
I have been harangued about statistics by a man demonstrating that he knows little of statistics.
Sweetie, you aren’t going to bluff your way out of this.
Answer the questions.
JJ:
Surely you have learned by now that the paid troll does not answer questions. He is employed to spread disinformation but not to substantiate it.
Richard
Bohl- the physical process is called heat transfer.
JJ- Read this. http://en.wikipedia.org/wiki/Confidence_interval
richardscourtney- “This is why the views of those (e.g. me) who were involved in production of both documents are more credible than the views of people who were involved in the production of only one of them.”
This means you were paid by the Heartland Institute. And you call me a paid troll!
Entropic man says:
JJ- Read this.
Nothing there has any relevance to the questions I asked of you. Note that those questions use that word “you” which indicates that they reference your understanding and implementation of the concepts involved.
Your understanding and use of standard deviation and confidence intervals is not correct. Perhaps you gathered that from reading a wiki page, and that is why you run and hide.
Entropic man:
The only payment I have ever had from the Heartland Institute was to cover my expenses attending one of their conferences at which I was a speaker.
I know you are employed to distribute falsehoods but do try not to make personal ones.
Richard
richardscourtney says:
August 22, 2012 at 1:09 pm
Entropic man:
The only payment I have ever had from the Heartland Institute was to cover my expenses attending one of their conferences at which I was a speaker.
I know you are employed to distribute falsehoods but do try not to make personal ones.
What’s ‘sauce for the goose is sauce for the gander’ Richard. In any case you admit that you were paid by Heartland so where’s the falsehood?
The Arctic is melting, not because of any greenhouse effect but because of warm water of the Gulf Stream carried into the Arctic Ocean by currents from the Atlantic. It started suddenly at the beginning of the twentieth century, paused for thirty years in mid-century, then resumed, and is still going strong. It is totally unprecedented because there was nothing but two thousand years of slow cooling before it. Lacking precedents means that it is not part of any long-term climate oscillation that might exist. Summer sea ice cover has been dwindling at the rate of 11 percent per decade for the last 30 years. This year it reached a low point below that of 2007. I expect the reduction to continue in succeeding years but have no idea how to estimate its limits. The unusual Greenland melt is apparently part of this general warming. If so, we can expect more in the future. The warming pause in the middle of the twentieth century was probably due to the resumption of previous behavior of ocean currents. We have no idea why the currents acted like that but what has happened before can happen again if the currents and the winds should so decide. In the meantime, the climate establishment still uses Arctic warming as an example of global greenhouse warming which is totally false. Someone should disabuse them of this fallacy. For a full account of Arctic warming read E&E 22(8):1069-1083 (2011).