Dana1981 at SkepticalScience Tries to Mislead His Readers
Guest post by Bob Tisdale
Dana1981 (aka Dana Nuccitelli) recently authored a SkepticalScience post titled Modeled and Observed Ocean Heat Content – Is There a Discrepancy? Believe it or not, in it, he complained about my comparison of modeled and observed ARGO-era Ocean Heat Content. See Figure 1. But his complaints do nothing more than misrepresent my graph and the modeled and observed trends of the Ocean Heat Content data. His intent is blatantly obvious. It is to mislead his readers. And it’s so obvious, it’s silly.
In this post, I’ll simply respond (once again) to complaints about that graph.
Dana1981’s initial reference to my graph comes in the opening sentence of his post. It reads:
Recently there have been a number of claims of a large discrepancy between modeled and observed ocean heat content (OHC), for example by Roger Pielke Sr., David Evans, and Bob Tisdale.
The post he linked was the WattsUpWithThat cross post of my most recent quarterly NODC Ocean Heat Content (OHC) update titled October to December 2011 NODC Ocean Heat Content Anomalies (0-700Meters) Update and Comments. The only model-data comparison graph in that post is Figure 1. So that simple graph is the only one he chooses to complain about.

Figure 1
Dana1981 uses the ridiculous heading of “Inaccurate, Unskeptical Graphs”.
First, there’s nothing inaccurate about my graphs in general or Figure 1 specifically. The data for Figure 1 is available through the KNMI Climate Explorer, and the model projection is based on Hansen et al (2005). I include a detailed description of that graph in that post. Second, I’m not sure how unskeptical applies to a graph. Unskeptical according to MS Word means open minded. Whatever Dana1981 was yakking about, it’s nonsense. Figure 1 is an accurate presentation of the model projection and the data.
Dana1981 then goes on to write under that heading:
The first cherrypicks have already been discussed above – ignoring OHC below 700 meters, and ignoring the OHC increase prior to 2003.
Figure 1 appears in my post under the heading of “ARGO-ERA OCEAN HEAT CONTENT MODEL-DATA COMPARISON.” That limits the period of discussion, don’t ya think? There’s really no reason to include OHC data prior to 2003 in a graph of ARGO-era OHC data since ARGO floats had such poor coverage before then.
Dana1981 claims that presenting the NODC 0-700 meter OHC data is cherry-picking, apparently believing the NODC’s OHC data for depths of 0-2000 meters should be illustrated as well. There’s a very obvious problem with that logic, and Dana1981 fails to recognize it. The Hansen et al (2005) paper “Earth’s energy imbalance: Confirmation and implications” has been the reference all along in my series of OHC updates. It presents the NODC OHC data for 0-700 meters, not 0-2000 meters. Dana1981 even uses Figure 2 from Hansen et al (2005) as Figure 1 in his post.
Dana1981 then posts a graph from Tamino that represents the problems Dana1981 sees with my model-data presentation in Figure 1. We’ll overlook the obvious difference, which is that he’s looking at annual data and I’ve presented the data on a monthly basis. I’ve added a couple of notes to the SkepticalScience Figure 4 and posted that graph here as Figure 2. My graph in Figure 1 presents the extrapolated trend of the model mean. Tamino’s graph presents the trend for the annual Ocean Heat Content data, not the model mean. He also elected to show a trend for the data for the period of 1993 to 2002. But the period used in the Hansen et al (2005) paper that Dana1981 referenced was 1993 to 2003. The only reason to omit the 2003 data point is because the trend is lower without it. Then Dana1981 notes:
By choosing the baseline such that the models and data are equal in 2003, Tisdale and Evans have graphically exaggerated a model-data discrepancy.
So the point where the trend meets the data is Dana1981’s basic complaint. Yawn. Somehow in Dana1981’s mind the intercept makes the graph inaccurate and unskeptical. Dana1981 linked Tamino’s post Favorite Denier Tricks, or How to Hide the Incline, but he failed to also link my rebuttal here or the WUWT cross post Technical paper training for “Hansen’s Bulldog”. Dana1981 also failed to realize how the Corrections to the RealClimate Presentation of Modeled Global Ocean Heat Content impacted Tamino’s unfounded criticisms. So I’d better point it out to him.

Figure 2
Where should the model intersect with the data? Let’s take a look.
Dana1981 uses the uproariously funny heading of “Accurate Graph”. Dana1981 then presents the corrected RealClimate graph that compares model outputs and OHC data. The graph is from the RealClimate post OHC Model/Obs Comparison Errata. Yup, that was the first time in two and a half years that RealClimate posted an “accurate graph” in one of their OHC model-data comparisons. I’m not sure Gavin Schmidt liked being reminded of that fact by Dana1981, but I sure appreciated it. I’ve reposted the graph here and thrown on another question for Dana1981. It is: Where would an extrapolation of the model mean trend (1993-2003) intersect the NODC OHC data, Dana1981?

Figure 3
Gavin Schmidt was kind enough to post the answer to my question. He provided it when he corrected the OHC model-data comparison graph in his post 2011 Updates to model-data comparisons. See Figure 4. I’ve noted the answer on the graph. They don’t intersect. In my graph, Figure 1, the model and data at least intersect during the ARGO era but in the RealClimate graph that Dana1981 calls an “accurate graph” they don’t intersect. Would you rather I shifted the model trend to the left, away from the OHC data, Dana1981? Would that make it an “accurate graph” for you?

Figure 4
Figure 5 is the same OHC model-data comparison graph from RealClimate. In it, though, I’ve highlighted the ARGO era, which is the period I presented in Figure 1. I removed the NODC data for 0-2000 meters since it has no bearing on this discussion. I’ve also approximated Tamino’s linear trend of the NODC OHC data from 1993 to 2002 that Dana1981 would like us to believe represents the model mean. Does Tamino’s linear trend come close to representing the model mean? Nope! For some reason, things that are blatantly obvious to most of us elude Dana1981 and his cohorts at SkepticalSeance.

Figure 5
What Dana1981 failed to realize is, when Tamino pulled the two sleights of hand with that graph (using the data instead of the model mean and using the trend of the data from 1993 to 2002 instead of 1993 to 2003), the erroneous data that RealClimate was posting at the time, Figure 6, was aligning with the bogus Tamino trend. That erroneous model trend only made it appear that Tamino’s presentation was right. But it never was.

Figure 6
I was going to overlook Dana1981’s complaint that I was neglecting a raft of other sources of OHC data, but I’ve decided to respond to it. I use the KNMI Climate Explorer as the source of data for my quarterly Ocean Heat Content updates. That fact is discussed in the first few paragraphs of those OHC updates. It’s tough to miss it, being right up front. I use data that’s readily available from KNMI in my posts for a reason: so that anyone can reproduce my graphs. Up until a few weeks ago, the NODC Ocean Heat Content data for 0-700 meters was the only updated Ocean Heat Content dataset available at the KNMI Climate Explorer. I would have been more than happy to include other OHC datasets, but there haven’t been any—until recently.
KNMI recently added an Ocean Heat Content dataset based on the UK Met Office EN3 analysis. I haven’t really investigated that dataset in depth (pardon the pun) so I haven’t prepared a full post about it. Figure 7 compares the UKMO EN3 data to the NODC ARGO-era OHC data for 0-700 meters and also to the GISS model trend. The UKMO EN3 data appears similar to the NODC’s ARGO-era OHC data before the NODC’s 2010 modifications. I’ll confirm that in an upcoming post. If you haven’t noticed, the trend of the ARGO-era UKMO EN3 OHC data (0-700 meters) is negative from January 2003 to March 2012.
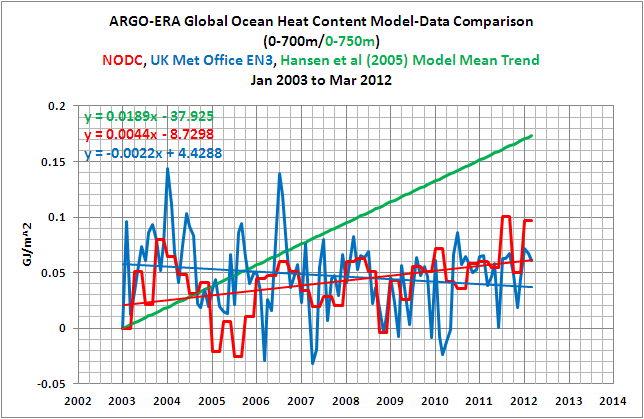
Figure 7
The UKMO EN3 OHC data is presented in 4 depths at the KNMI Climate Explorer: 0-400m, 0-700m, 0-1000m, and 0-2000m. We can compare the global ARGO-era 0-2000 meter UKMO EN3 data to the trend of the GISS model mean for 0-750 meters, Figure 8. The models are still out of the ballpark. There’s no reason to search for the GISS model trend for 0-2000 meters to illustrate that point.

Figure 8
CLOSING
When Gavin Schmidt published those corrections to the RealClimate OHC model-data comparisons, I believed that no one would be foolish enough to ever again complain about where the OHC model trend and data intersected in my ARGO-era graphs. But I was proved wrong. Dana1981 raised the bar on foolishness. And his readers went along with it.
Roger Pielke Sr. also published a post yesterday about Dana1981’s OHC post. Roger’s post is titled Grappling With Reality – A Comment On The Skeptical Science Post By Dana1981 “Modeled and Observed Ocean Heat Content – Is There a Discrepancy?” Yup, Dana1981 and many of the commenters on that SkepticalScience thread are grappling with reality, but they’re losing the wrestling match.
By the way, Dana1981, thanks for allowing me to post the ARGO-era model-data comparison graph once again. It’s one of my favorites.
Bazinga!
Booya!
If he doesn’t understand that the slope of the trend line is the important thing……..it’s just sad.
Bazinga indeed!!!
Really well explained and properly calculated. Thanks for that.
Well thought out and calculated. Thank you for clearly explaining the trends.
I, too, love figure 1. It raises an important and yet unanswered question.
Nice one Bob
Dana1981 always has a nasty undertone about him. He could learn a lot from you and Pielke Sr.
Thank you Mr. Tisdale. The ARGO erra data is much more reliable than the xbt data previous to their deployment/calibration.
It is not surpriseing to observe the divergence problem. Air temps have very little influence on 0-700M OHC. Sunlight does by virtue of wavelength.
I look forward to Mr. Nuticelli answering and understanding your post. I am sure he is welcome to post on this thread at any time by virtue of Anthony’s policy.
Game set and match. Facts sure do get in Dana’s way.
@Dana1981 – please see visual explanation of what just happened – http://i.imgur.com/mUePQ.gif
Jack Cowper says:
Dana1981 always has a nasty undertone about him. He could learn a lot from you and Pielke Sr.
—-
That would involve having an Open Mind…
Great post; please keep them coming. This illustrates yet again why bloggers at Real Climate, Rabbet Run, Climate Progress, Stoat, Tamino, and Skeptical Science routinely practice deception and obfuscation. Clarity is their enemy. They can’t win using available science and data, and they know it.
Re: “the trend of the ARGO-era UKMO EN3 OHC data (0-700 meters) is negative from January 2003 to March 2012.”
For a future post, that last decade ARGO trend may be similar to the temperature trend from the Holocene Climatic Optimum to the present. e.g. “2.0°C warmer in the annual mean temperature at the mid-Holocene (6000 years ago) compared to the recent pre-industrial.”
Climate change between the mid and late Holocene in northern high latitudes – Part 1: Survey of temperature and precipitation proxy data, Sundqvist et al 2010.
Jack Cowper says:
May 30, 2012 at 12:33 pm
Nice one Bob
Dana1981 always has a nasty undertone about him. He could learn a lot from you and Pielke Sr.
============================================
I notice that this is the case for everyone at that Skeptical Science website. I think of it as more of an arrogant undertone.
Bob; it’s not fair to bring a shot gun to a knife fight; you don’t leave the varmints anywhere to run and hide !
George
Snowlover123 says:
“I notice that this is the case for everyone at that Skeptical Science website. I think of it as more of an arrogant undertone.”
But as Bob Tisdale demonstrates, they have nothing to be arrogant about.
Great deconstruction of Nuticelli’s pseudo-skeptical pseudo-science, Mr. T.
Years ago there used to be a CAGW agitator named DanaO (or something similar) that trolled sites like Climateaudit.
Wonder if this Dana1981 is the same…
Ouch! thats gotta sting…nice one Bob
To Dana1981
When doing battle with a master, it pays to know when to quit..and to bring adequate weapons to the field.
To be fair to Dana1981 they are just following normal the Team practice, they are after all RC’s ‘little bitch’ eager to please their gods.
Why bother to feed the trolls? Skeptical Science is neither and the cartoonist in charge of that site is a fool as we all know.
The general direction if their argument is that you’re using the wrong starting point (for a linear trend(!)), thus the models appear to have been throughly falsified as of 1997 or so.
The answer is thus negative fifteen. So fifteen years prior to the first run of any given OHC model, it can be safely assumed that it has already been demonstrated utterly false.
This is the not the first time we’ve seen something like this from Dana so I think he just likes to present “a nice tidy picture” by changing the numbers in his charts so that the lines match up. It is not about accuracy, it is only about “communicating climate change”.
But OHC 0-700 metres from 1990 to 2011 is about 12 W/m2, not the +20 predicted by GISS and the climate models.
OHC 0-2000 metres from 1990 to 2011 is about 18 W/m2, not the +30 predicted by GISS and the climate models.
In the Argo era, 0.3 W/m2/yr is less that the 0.95 W/m2/yr predicted by GISS and the climate models.
It is about PR, like a TV commercial about how good the the new Chevy Volt is.
Other errors in this post aside, you really butchered my name. It’s Nuccitelli.
[Moderator’s Observation: Hey, he got 60% of the letters in the right position! My name has half the letters yours does and very often writers (including my students) don’t even make 60%. Heck, POTUS has half the letters in his name that you do, is more famous, and yet lots of commenters here never seem to spell it the way he does. Is a puzzlement. -REP]
Great deconstruction of the house of cards..
As regarding feeding the trolls – this is not feeding, its literally knocking the ground out from under them.
“Other errors in this post aside, you really butchered my name. It’s Nuccitelli.”
So Dana, are you going to show us anything wrong with this post besides your name or is that the worst error in it?
dana1981 says:
May 30, 2012 at 2:28 pm
Other errors in this post aside, you really butchered my name. It’s Nuccitelli.
WOW!! What an incisive response!!
/sarc
Is this the same Dana1981 who last year ‘explained’ the absence of sea level rise by saying global water had been diverted to the Bangkok floods? 🙂
I prefer Nuttycelli.
Bob performs intellectual judo and defeats Warmist arguments with their own data.
But, they keep getting up for more… (it helps to be funded by Government http://joannenova.com.au/2012/05/does-climate-money-matter-is-a-monopoly-good-for-a-market/ )
“So Dana, are you going to show us anything wrong with this post besides your name or is that the worst error in it?”
Well, I’ve learned that commenting here isn’t a very constructive exercise, to put it kindly. As a quick summary, I should clarify that I don’t know if Tisdale’s graph is in error, because he shows so little data. And that’s really the problem – he’s looking at the mean run from just one climate model, comparing it to one OHC reconstruction, only looking at 0-700m data (with the exception of his new graphic, which is grossly inconsistent with all other 0-2000m OHC reconstructions, which I summarized in my post), and looking at less than a decade’s worth of data. It’s cherrypick upon cherrypick upon cherrypick. Let’s just say my post is a lot more thorough.
And that’s all I’m going to say on the matter because as I noted, commenting here isn’t a constructive exercise.
REPLY: This from a man whose website drove the very Civil Dr. Pielke away:
http://pielkeclimatesci.wordpress.com/2011/10/25/response-to-skeptical-science-on-a-series-of-weblog-posts/
BTW, the misspelling of your name is my fault, not Bob’s. I actually typed it in search to make sure I had it right, it is was erroneously confirmed by this Google Search

http://www.google.com/search?q=Dana+Nutticelli
Apparently, misspelling your name is a common problem on the web, but I offer my apology anyway. Won’t happen again.
Loved the scooter picture at Pielke’s today,
You should get a bumper sticker that says “My other scooter is nuclear powered”. 😉 – Anthony
dana1981 says:
May 30, 2012 at 2:28 pm
Other errors in this post aside, you really butchered my name. It’s Nuccitelli.
That’s his rebuttal? How embarrassing.
Actually I should clarify – it’s a *linear extrapolation* of the mean 1993-2003 run from one climate model. Tisdale (and everyone else doing this analysis, including myself) is assuming that a linear OHC extrapolation is accurate, which is only true if the radiative forcing 2003-2011 is the same as 1993-2003, which very well may not be true due to rising aerosol emissions.
Bottom line is that we can’t say for sure whether or not there’s a model-data discrepancy, but Tisdale’s analysis in particular is nowhere near thorough enough to make that determination. I couldn’t even make that determination in my more thorough analysis. The difference is that I admitted as much.
Usually when the output of predictive models does not match results obtained from actual measured data then the model needs to be recalibrated. Relying on an unvalidated model is silly but in the case the model is invalid.
The problem is model output is used heavilly in green agenda/advocacy to promote carbon trading, so called green energy and wealth redistribution. As the models fail the prospects for advocacy diminish.
I was wondering if someone could justify for me the usage of the projection as if the 1990s and 2000s are comparable in terms of which forcings were acting on OHC; we’ve already posted several times at SkS about the increase in aerosol forcing, the decrease in solar output from the ~2003 peak to a prolonged minimum, differences in ENSO (the 1990s seem dominated by El Nino, whereas that’s not quite the case for the 2000s), so on. How would the model itself respond to these changes in forcing, how would it say the 0-750m OHC should have changed due to these forcings? I cannot see how extrapolating is at all justified from a physical or statistical sense.
I would also ask where you obtained the 0-2000m data for your last figure Bob, the NODC data doesn’t show a decrease over that time period so I’d like to see how and perhaps why the METOffice data does.
Thanks ahead of time for anyone who can give some answers.
Nowadays when I see Warmists grapple with data, trying and make it fit their prejudices – I am always reminded of the Ugly Sisters trying desperately trying to stuff their fat feet into Cinderella’s abandoned slipper!
My previous comment that I was clarifying on appears not to have gone through – probably lost it when I had to sign in. My point was that Tisdale is only looking at the mean run of one model (which I clarified to note that it’s actually the linear extrapolation of that mean model run), compared to one OHC reconstruction, only of 0-700m data (with the exception of his new 0-2000m graph, which is a gross outlier compared to every other 0-2000m OHC reconstruction, which are discussed in my post), and over a timeframe of less than a decade. It’s an uber-cherrypick.
Even analyzing a lot more data, I couldn’t say for sure whether or not there’s a model-data discrepancy in my post. Tisdale certainly can’t make that determination in his post with so little data being analyzed.
REPLY: No, its right there at 3:33 http://wattsupwiththat.com/2012/05/30/dana-nuticellis-skeptical-science-ohc-grapple-down-for-the-count/#comment-997401
Dana it is an utter and complete joke that you say that “commenting here isn’t a very constructive exercise” when, as Anthony showed, Skeptical Science drove Dr. Pielke away, viciously slash out his comments (Source: http://nigguraths.files.wordpress.com/2011/09/comment-deletion1.gif?w=580) and then your commentators resort to ad-hominem attacks instead of debating science.
And you criticize this website as being unconstructive? What a joke!
One tiny tiny problem with your whole argument Bob.
How can you compare what the GISS model supposedly says for the post 2003 period with OHC data for that period?
The GISS graphed data is only showing what the model produced up to 2003. GISS haven’t modelled 2003-2012.!!
You have no idea what the model would show for that period since it hasn’t been done.
So your argument is based on a very ery strange idea. We have GISS modelling for 1955 to 2003 and we can compare this to the observational data and they match pretty well. Not a single fixed trend, not a straight line in sight!
But since GISS hasn’t gone beyond 2003 I will just assume that if we had a crystal ball to let us look at future output of the model we would see some truly amazing behaviour. From 2003 the model stops doing complex things and just turns into a simple straight line!
One can just imagine the computer code involved in this
IF Year <= 2003
Call Full_GISS_Model
ELSE
Y = A*X + B
Essentially you are saying that GISS just gives up modelling after 2003!
Bob YOU HAVE NO IDEA WHAT GISS WOULD SHOW FOR 2004-2012! NO IDEA WHATSOEVER.
So what was the point of your post? To demonstrate your psychic abilities?
If skeptics want to make any sort of case for the merit of their arguments surely step one is to first engage brain!
REPLY: Written by a guy who’s in the food business, I can’t wait for Bob’s response – Anthony
Alex C says: “I would also ask where you obtained the 0-2000m data for your last figure Bob…”
The source of data for Figure 8 was identified in the post as the KNMI Climate Explorer.
http://climexp.knmi.nl/selectfield_obs.cgi?someone@somewhere
Alex C says: “…the NODC data doesn’t show a decrease over that time period so I’d like to see how and perhaps why the METOffice data does.”
The UKMO OHC data trend for 0-2000 meter is positive, Alex C. Not Negative. It’s simply not as positive as the NODC data for that time period.
http://bobtisdale.files.wordpress.com/2012/05/figure-8.png
On the other hand, the UKMO EN3-based global OHC trend for 0-700 meters is negative since 2003. But so was the NODC OHC data when they first released it based on Levitus et al (2009), if memory serves. It wasn’t until the NODC modified the data in late 2010 that it acquired the positive trend that exists now.
http://bobtisdale.files.wordpress.com/2012/05/figure-7.png
Regarding your discussion of aerosols, you’ll need to look to see where the oceans are cooling before your try to say that the additional aerosols from China are causing that cooling.
Interesting that the UKMO EN3 OHC data shows declining OHC down to 700m in the last decade, while NODC shows slight increase. Is the UKMO EN3 a new OHC dataset? What are the differences?
@ AlexC–
Basically what you’re saying is models don’t handle natural variability well, so we should cut ’em some slack. Here’s an idea: just widen the hell out of the error bars.
Give me an error bar long enough and a model on which to place it, and I shall move the world.
dana1981 says:
May 30, 2012 at 3:26 pm
“So Dana, are you going to show us anything wrong with this post besides your name or is that the worst error in it?”
Well, I’ve learned that commenting here isn’t a very constructive exercise, to put it kindly. As a quick summary, I should clarify that I don’t know if Tisdale’s graph is in error, because he shows so little data.
=======================================================
Dana….. you guys and gals continue to amuse me. Admittedly, I’m incredibly ignorant on the issues of OHC. I still haven’t figured out why we don’t calculate the different depths separately….. But, that’s not why I’m commenting.
I’ve decided to start looking into OHC and the various issues and considerations. And so I read. And this is the secret that you alarmists, quite frankly have never learned.
The commenters here can be very brutal. But, they’re not vicious…… (for the most part.) On issues I’m knowledgeable about, I prefer to seek out alarmist blogs and engage. The reason is twofold. 1) I learn. Invariably, because I’m a skeptic, I’ll be challenged. Once in a blue moon, I’ll find an alarmist more knowledgeable. That’s personal growth. But, 2) more often than not, they’re not more knowledgeable in the particular issue I’ve chosen to engage with them. I never go to those sites believing I’m going to change a commentator’s mind. It just doesn’t happen like that. But, always, there are people like me, on this issue. Interested, reading, but not commenting. If one produces well founded accurate information in a calm, clear and cordial manner, the silent reader will read what you have to say. They will also read the responses. Nasty doesn’t sway people. It repels them. (This isn’t a personal observation of you, but alarmists in general) For me, I love a good vitriol filled raucous argument from time to time….. keeps the blood moving.
Way back when, most of the traffic went to alarmist sites. Now, if I have something to say which I want a larger audience to hear, I come to a skeptic site such as WUWT. Stay and play, the worst that can happen is that you learn something. Else, if you present accurate information in a calm, clear and cordial manner……
James
Suggestion to Dana. Try adding a sine fit to your Argo graph from 1993.
Should fit very well indeed. My old fashioned eyeball regression method suggests a wavelength of ~64 years would be spot on.
Oh I forget. CAGW people don’t like sine curves, they only like straight line trends.
@Sleeper:
“Basically what you’re saying is models don’t handle natural variability well, so we should cut ‘em some slack. Here’s an idea: just widen the hell out of the error bars.”
Thanks for quoting me so that people know what I actually said. So I can clarify it for you though, the straight line projection is not the model. Nope, no way, not it. It’s an extrapolation of a trend that was created from how the model responded to forcing during the 1993-2003 period, and you can’t say that’s how the model would say 2003-present would behave.
So, what I *actually* said was that I’m curious how the model would *actually* respond to the forcing data over the past decade. I said zero about the model’s ability to model natural variability, don’t misrepresent me.
@Bruce:
“Oh I forget. CAGW people don’t like sine curves, they only like straight line trends.”
Because sine waves aren’t physically justified, unless you’d like to present a sound explanation based on published literature(?). Tell me too, does this sine wave happen to be around an upward linear trend?
Awaiting citation…
In the current context the long comment towards the bottom of this page may be of interest:
http://www.bishop-hill.net/blog/2011/9/21/the-cook-timeline.html?currentPage=3
Well written James. And very correct.
I used to go to alarmist sites, but most have now decided that my comments should not be seen.
I also went to be challenged, as I paid good money to read the literature and understand it.
I have found Anthony’s site to be very interesting. Sure, there is some highperbole…(sp), but there are also very good discussions embedded.
My occupation requires that I have a more than rudimentary understanding of climate and weather. It affects long range planning tremendously.
What has been obvious, at least in my area, is that the projections, based on modles, are not being fulfilled when it comes to climate. I want to understand the why? they aren’t beinf fulfilled.
We know that ARGO is a much much better source of data than the mixture presented previously. OHC is a large driver of climate AND weather.
Mr. Tisdale has done us all a great service with his well presented blog postings and I thank him for that.
One would assume dana1981 is now 31 – old enough to have developed beyond the gullible 20 somethings – although some never grow out of gullibility.
dana1981 says:
May 30, 2012 at 3:26 pm
“So Dana, are you going to show us anything wrong with this post besides your name or is that the worst error in it?”
Well, I’ve learned that commenting here isn’t a very constructive exercise, to put it kindly.
============================================================
I’m sure Anthony would allow a guest post.
Just ask
It would be a hoot !!!!!
@Bob Tisdale:
Thanks for responding and for the links, and yes you are right that the 0-2000 meter UKMO data shows a positive trend, my mistake. I had mixed up the plots in my head and was absent-minded enough to not double check which one I was referencing before I posted. Again, my mistake.
I’m still curious why the UKMO data shows such a small trend, whereas the NODC does not. I don’t necessarily expect an answer from you though (unless you have one, by all means), I’ll be looking into it myself a bit so I’m just typing out loud, so to speak.
As to the aerosol effect, I’m not curious as to how OHC responded or where, but how the model would have treated such information and how it would have predicted OHC off that information. Again too, it’s not just aerosols but solar, perhaps ENSO and vertical heat transfer downward.
thanks, Bob.
another one bites the dust.
@ Matthew W
Dana is welcome to make a guest post with only these two caveats
1. You can’t call people “deniers”
2. The post must be factual, not opinion based
Contact me to arrange it. – Anthony
If OHC is now such a significant issue doesn’t this kinda show the atmospheric concentration of a trace gas which is completely negligible in terms of mass and heat capacity compared to the physical properties of water in the oceans is actually – well – negligible ??
The Argo program is the most expensive climate science project ever, costing about 100 million Euros (120 million USD) per annum.
I calculated this by extrapolating the European costs found at the link below to the total number of Argo floats (3,000).
http://www.europolemer.eu/en/telechargement.php?id_page=0-86-140-272-343&file=Euro_Argo___LE_TRAON.pdf
The reason so much money is being spent is that the prior methods of measuring Ocean Heat Content were known to be deficient in multiple ways. Equating pre-Argo data with Argo data, without highlighting the difference in data quality, is itself seriously dishonest.
@Dana1981 & Alex C
So you’re trying to fell Bob with the argument that the models might be right if they weren’t wrong?
Genius
Camburn says:
May 30, 2012 at 5:24 pm
Well written James. And very correct.
I used to go to alarmist sites, but most have now decided that my comments should not be seen.
I also went to be challenged, as I paid good money to read the literature and understand it.
========================================
Thanks, but, it seems to no avail. But, we knew that. Anthony allows, and encourages debate….. especially from the alarmist side. I’ve only had very limited dealings with Dana. I’m more familiar with Bob. If I had to bet, I’d bet that Dana won’t come play.
To my remedial questions….. why to we consider the depths inclusive instead of separately? So we can get scarier graphs?
..and in accusing Bob of cherry picking (a perfectly legitimate way of falsifying a weak hypothesis), you might be opening an uncomfortable can of worms for yourselves..
Regarding your discussion of aerosols, you’ll need to look to see where the oceans are cooling before your try to say that the additional aerosols from China are causing that cooling.
I’ll second that. Without empirical data that shows increasing/decreasing aerosols (and particulates) causing ocean warming/cooling, the change in the aerosol forcing is just a fiddle factor in the models.
dana1981 says: “Other errors in this post aside…”
Nice try, dana1981. Show me the errors.
Dana1981 says: “As a quick summary, I should clarify that I don’t know if Tisdale’s graph is in error, because he shows so little data.”
Does this mean you’ve withdrawn your claim of more than one error in my post? Probably not.
The data in the graph is as downloaded from the KNMI Climate Explorer. It is also shifted so that the first quarter data point equals zero. I start the data in 2003 to represent the ARGO era of OHC data. You could go to the KNMI Climate Explorer and download the data if you believe it’s wrong, but you don’t do that. You make nonsensical claims that have no bearing on the conversation. If I start a graph in 2003 to show the ARGO era, there will of course be “so little data”.
Dana1981 says: “And that’s really the problem – he’s looking at the mean run from just one climate model…”
And yet you posted a graph from RealClimate that presents that same climate model, the same model mean. Your argument contradicts itself.
Dana1981 says: “…comparing it to one OHC reconstruction, only looking at 0-700m data…”
Hmm. I addressed this argument in the post. This indicates you didn’t read it. Let me ask you this, dana1981: What part of the title of my post that you linked to your post didn’t you understand? The title was “October to December 2011 NODC Ocean Heat Content Anomalies (0-700Meters) Update and Comments”. It really should be easy to determine the topic of that post from the title.
And let me ask you a second question: Are you aware of any other Ocean Heat Content dataset that’s available online in an easy-to-use format so that my readers can replicate my graphs easily? I’ve only found one. And it was recently added to the KNMI Climate Explorer. But of course you complained about it…
Dana1981 says: “…with the exception of his new graphic, which is grossly inconsistent with all other 0-2000m OHC reconstructions, which I summarized in my post.”
Then I suggest you take your complaints to the UK Met Office. They’re falling on deaf ears here.
Dana1981 says: “…and looking at less than a decade’s worth of data.”
This was also addressed in the post. So I’ll ask you another question: What part of “ARGO-era” don’t you understand?
Dana1981 says: “It’s cherrypick upon cherrypick upon cherrypick.”
You seem to have “cherrypick” on your mind. Do you often crave cherries? Maybe it’s a diet deficiency. Try vitamin C. In other words, you need to find a better argument when you come here, dana1981. That one’s laughable.
Dana1981 says: “Let’s just say my post is a lot more thorough.”
I wouldn’t know. I only looked for discussions of my graph and I commented on your misrepresentations. I’ve assumed the rest of your post was just as error-filled.
Dana1981 says: “And that’s all I’m going to say on the matter because as I noted, commenting here isn’t a constructive exercise.”
And yet you commented again.
Dana1981 says: “Actually I should clarify – it’s a *linear extrapolation* of the mean 1993-2003 run from one climate model. Tisdale (and everyone else doing this analysis, including myself) is assuming that a linear OHC extrapolation is accurate, which is only true if the radiative forcing 2003-2011 is the same as 1993-2003, which very well may not be true due to rising aerosol emissions.”
Hmm. Did you notice that RealClimate simply extrapolates the data also? One would think, if they were concerned that the extrapolation was inaccurate, they wouldn’t do it. It’s only when Gavin corrected his mistakes that you try your new argument, dana1981. Before he corrected them, did you ever ask him whether the extrapolation was correct?
Dana1981 says: “Bottom line is that we can’t say for sure whether or not there’s a model-data discrepancy, but Tisdale’s analysis in particular is nowhere near thorough enough to make that determination.”
Dana1981, you’ve lost sight of reality–if you ever had it in view. Let me phrase it another way: the obvious is beyond you. Here’s a copy of my graph again.
http://bobtisdale.files.wordpress.com/2012/01/figure-112.png
The “analysis” you’re referring to is a simple graph. A very simple graph. It presents the ARGO-era NODC Ocean Heat Content for the depths of 0-700 meters, and compares it to an extrapolation of the GISS model mean. That’s all the graph presents. It’s basically a trend comparison. Nothing more, nothing less. I prepare it so that I can ask the question that also appears on it. That question is, If the model mean continues to diverge from the observations, how many years are required before the models can be said to have failed? It’s intended as a conversation starter, but you and Tamino make a big fuss about it. You go to great lengths to misrepresent it and to mislead your readers. Your overreaction to that simple graph is foolish at best. So I’m happy to point out to all of the readers the ways that you misrepresent that graph and misunderstand the topic at hand.
I published a comment by blogger JJ on my blog after the last argument about that simple graph, dana1981. Here’s a link. I would suggest that you (above all others commenting on this thread) read it.
http://bobtisdale.wordpress.com/2012/02/01/the-comment-of-the-week/
Here’s a quote from it:
“Because when you attempt to distract from it, as Tamino has done here, you end up doing two things: 1) You look desperate, grasping at straws from which to construct sparring partners, and 2) you end up forcing guys like Bob into examining things that don’t turn out well for you.”
And yet you continue to yak on and on, digging the hole deeper. Your need to self destruct is quite remarkable.
Regards
@ beng,
No, to be fair, Dana1981 is not the same person you are thinking of. That would be a guy who calls himself “Dano”. I too am familiar with him as he resides in my state–CO–and used to post on the local paper’s site until he was banned–twice–for being overly abusive.
He still appears at some sites from time to time, but not nearly as much as in the past.
Glenn Tamblyn says: “How can you compare what the GISS model supposedly says for the post 2003 period with OHC data for that period?”
It’s called linear extrapolation. That is, the linear trend from the earlier period is extended into the one we’re discussing. Scroll up to Figure 4. Gavin has extended the linear trend lines from 2003 forward. It’s common practice.
phlogiston: I can’t answer your questions yet about the UKMO EN3 OHC data. I haven’t researched yet.
Bob Tisdale says (May 30, 2012 at 6:35 pm): “And yet you continue to yak on and on, digging the hole deeper. Your need to self destruct is quite remarkable.”
I wouldn’t mind the self destruct part, but the alarmists are trying to take us with them.
No thanks, Dana. I’ll pass, but I hope you enjoy that Kool-Aid.
well bobs comparison between a single model mean and observations isnt exactly full and plain disclosure as those of us at climate audit demand.
1. you should note how many runs are in the mean. id say 5. maybe less.
2. if you choose to extrapolate a model you must state the uncertainty. with a small number of runs and the short time peroid your going to find out that you cant say much
Anthony, was that a genuine offer for a blog post? Because I tried that once before, and you didn’t publish it, which is of course your choice, but I don’t really want to waste the time and effort if nothing’s going to come of it. Not that I’m particularly interested in getting in a blog post war with Tisdale, who amazingly seems to be even more sarcastic than myself.
Regarding Pielke, nothing I said drove him away in tears. To be blunt, he was rather thin-skinned in our discourse with him. Somebody would challenge something he said, and he would run off to his blog and write a post about what big meanies we were at SkS. To be fair, he was in a tough position, having to respond to about a dozen different commenters on his own. Nevertheless, the exchange was quite polite as a whole, as Pielke himself remarked several times.
In fact, there have been several comments in this very post much ruder to me than anything said at SkS to Pielke. One commenting about me being gullible as a 20-year-old; that’s very constructive, thanks. If we’d said something similar to Pielke, you all would have an absolute conniption over it.
REPLY: Well if you aren’t interested in responding to Tisdale, then I think you’ve set the conditions that pretty much exclude a guest post. If you want to reply to Tisdale (which was the whole point of my offer) that avenue is open.
You really should go back and review how Dr. Pielke was treated on SkS. Your view is a bit rosy. People here might be a bit rude at times, but then again you don’t command the same level of respect and expertise that Dr. Pielke does, and to be frank, a lot of the commentary at SkS primes the response here. We all have our faults, and our baggage of history, but don’t expect kid gloves. – Anthony
Alex C : May 30, 2012 at 3:42 pm
Firstly, kudos to AlexC and Dana 1981 for engaging in the debate here.
Secondly, AlexC mentions a few ‘confounding uncertainties’ re models. Add to that the other uncertainties as per IPCC publication, and I feel perhaps the point that the models may not be the ideal ‘backbone’ to the pro-CAGW argument is upheld.
AlexC said:
….
Add to that the other “uncertainties”:
http://ipcc.ch/publications_and_data/ar4/wg1/en/ch2s2-9-1.html
Listing 10 of the 15 from that page – Now while the IPCC is pretty certain all of these are important, the there seems to be a distinct lack of consensus and understanding:
Showing consensus (3 is lowest) and ‘scientific certainty’ as high, med or low:
Stratospheric water vapour from CH4: 3 Low
Stratospheric water vapour from causes other than CH4 oxidation: 3 Very Low
Direct aerosol: 2 to 3 Medium to Low
Cloud albedo effect (all aerosols): 3 Low
Surface albedo (land use): 2 to 3 Medium to Low
Surface albedo (BC aerosol on snow): 3 Low
Solar irradiance: 3 Low
Volcanic aerosol: 3 Low
Cosmic rays: 3 Very Low
Other surface effects: 3 Very Low
I can’t quite muster up the faith in the models that some seem to have.
Why give Dana1981 the time of day? He has not produced any peer reviewed published studies in any journal. He has absolutely zero education in atmospheric physics or anything related to climate science. He is just some climate science wannabe who toes IPCC dogma and rides a stupid “green” scooter. Sorry, but he has not earned the right to produce a “guest post” on WUWT.
REPLY: I welcome knowledgeable posters, with or without PhD’s and with or without peer reviews. Some guest posts previously published on WUWT fall into the “without” category so that really can’t be a basis for exclusion. – Anthony
@JJB MKI:
“@Dana1981 & Alex C
So you’re trying to fell Bob with the argument that the models might be right if they weren’t wrong?
Genius”
I am astounded how many times people seem to like writing “So you’re trying to say” – following Yoda’s advice I didn’t “try,” I *did* say quite clearly that I want to see what the model *actually* predicts. Please see my response to Sleeper, this is getting boring answering such comments.
Bob:
I tried to download the 0-2000m data, I got the data from the monthly observations link here:
http://climexp.knmi.nl/selectfield_obs2.cgi?id=someone@somewhere
The Heat Content, UKMO EN3 Analysis, like you said, 0-2000; the graphs I get when plotting the data are not the same as the ones you gave, did I get the source correct? Which did you use?
Roger @ 5.22. Your comment on Bishop Hill you link to makes great reading . Thanks.
Alex C says:
May 30, 2012 at 5:19 pm
Tell me too, does this sine wave happen to be around an upward linear trend? Awaiting citation…
AMO sinusoidal that I linked is clear in Fig 1 of Knight et al 2005 (in GRL). But is not mentioned in the paper, perhaps due to the last named coauthor. If there is no physical justification of a sinusoidal cycle then why has this figure been included in the paper? Perhaps they also should not have put the evil word ‘cycles’ in the paper title. Or done power spectrum determinations.
It is my hypothesis that a sine fit would be effective for the Argo data…with the problem that we have only 1/4 of a wavelength of data. However given this signal is present in the PDO, AMO (see citation and my previous link upthread), ENSO and HadCRUT data it seems a fair bet it is present in the Argo data. I am happy extending such a hypothesis because I have been extending many hypotheses to explain datasets in my 30 years as a practicing scientist.
Yes I agree with your comment about a rising trend, until recently. It turns out that rising trend fits neatly with both the Spencer & Braswell 2010 CERES measure of climate sensitivity and the Friis-Christensen finding of the effect of solar magnetism on the long term temperature trend. Which, as the Sun has now moved out of the de Vries grand maximum, means the rising trend has now almost certainly switched to a declining trend.
This is half on topic. They have a recent post talking about Himalayan Ice Loss where the following quote is called out in discussion,
“In the high mountains of Central Asia, GRACE imagery found mass losses of -264 mm/a for the 2003-2009 period”
-neg loss i.e. a gain. Trying too hard to paint a negative picture.
Bob is correct not to include error bars, as Gavin Schmidt explains in the link below, model spreads aren’t probability statements, but some people think they are or will interpret them that way.
http://www.thebulletin.org/web-edition/roundtables/the-uncertainty-climate-modeling
Steven Mosher says:
May 30, 2012 at 7:16 pm
“2. if you choose to extrapolate a model you must state the uncertainty. with a small number of runs and the short time peroid your going to find out that you cant say much”
Which is the entire point of IPCC climate science, is it not, Steven? Scare everybody sh1tless without showing refutable predictions.
Bob,
I gotta’ say I have always respected you for your dispassionate deconstructions of alarmist data.
However, this post has been anything but dispassionate . . . and I have enjoyed it immensely. Thank you for your great work.
Dana1981 writes “is only true if the radiative forcing 2003-2011 is the same as 1993-2003, which very well may not be true due to rising aerosol emissions.”
It could be a lot of things Dana. But given that we have increased our CO2 output significantly over that period, whatever it is trumps that effect and has done so for a decade.
Can someone answer why there is such a huge difference in the OHC (0-2000) actual data between figure 4 and figure 8? Thanks.
Obviously, Dana has now moved to the skeptic side.
Noting that hardly any waming is occuring (his own charts show this), then either:
– the Anthro-forcing must be over-stated / the theory has missed something very consequential;
– it is escaping from the Earth faster than predicted; or,
– it is hiding somewhere other than the ocean, the atmosphere, the ground or ice-sheet melt (which leaves Madagascar or something).
Trenberth doesn’t talk about “missing energy” and publish papers about it and give talks about it because it is already found in the oceans.
The IPCC AR5 ensemble mean (already submitted) for the whole oceans down to 3000 metres is pretty close to 1.4 W/m2/yr. From 0-700 metres, it is 0.82 W/m2/yr
So we are at about 0.3 W/m2/yr down to 700 metres and 0.4 or 0.5 W/m2/yr down to 2000 metres. That is alot missing and one can’t sugar-coat the actual numbers by playing around with the baselines in “Dana-Charts ™”.
I’d just liek to add my support to Bob and the good work he does and just a quick warning about Dana1981, I remember him from BH when the SkS boys invaded and he is a very angry young man (Funny I’m Shevva1975 and I guess those 6 years make a diffrence).
Side comment, who wouldn’t want an aerosol button on there tax returns.
Thanks Bob, I’d been waiting for confirmation that ARGO data got ‘adjusted’ after 2009. I look forward to your post about that. It seems the UKMO isn’t playing along any more. Good.
Combine the UKMO OHC with the recently terminated ENVISAT sea level data and a more consistent picture emerges. Add in Peter Berenyi’s analysis of CERES flashflux data in relation to the OHC and it starts to make sense.
The ‘missing heat’ is somewhere past Alpha Centauri by now.
Philip Bradley: Thanks for the link to the model uncertainty discussion.
Bob Tisdale said:
“It’s called linear extrapolation. That is, the linear trend from the earlier period is extended into the one we’re discussing. Scroll up to Figure 4. Gavin has extended the linear trend lines from 2003 forward. It’s common practice.”
Thats the whole point of my criticism Bob. The gist of your post is about a supposed divergence between actual ocean data and what the models predict, ergo ‘the models must be wrong’ or some such thing.
When in fact you have no idea what the GISS model predicts for 2004-2012. They haven’t modelled it. you are simply assuming that if they were run for that latter period they would predict exactly the same trend as they did for the previous decade.
Your extrapolation says absolutely zero about what the models actually predict. And yet you are trying to comment on a supposed divergence between model data and real world data. When in fact you have no model data.
And saying that extrapolation is a common practice doesn’t cut it. Many forms of faulty thinking are common.
Here is a simple reality check for your method Bob. If extrapolating the 1993-2003 trend into the future is meaningful, then surely it is just as meaningful to do the same extrapolation into the past. On Fig 6, extrapolate the 1993-2003 trends backwards. Both trend lines (0-700m & 0-2000m) drop of the bottomof the graph around 1980. But the actual ocean data is obviously in total disagreement with that.
Doesn’t that say that the GISS model totally disagrees with all observations before 1993 as well? Good Golly Miss Molly. GISS only really got it right for one decade according to your analysis technique.
Not just 1 decade wrong, but 5 out of 6 decades wrong. Why aren’t you highlighting that fact Bob? Isn’t that the real story?
But wait a minute; the GISS model data for all those prior decades doesn’t agree with your ‘GISS Trend’ either! How could GISS’s own model data not agree with the trend calculated from their data?
Because the 1993-2003 trend is just that, the trend for 1993-2003. Not the trend from 1955-1963. Or 1963 to 1972. Not 1973-1983. Not 1983 to 1993. In fact, between 1955 and 2003 it seems that the only period that the 1993-2003 GISS trend actually agrees with the GISS data is – 1993-2003.
Yet you seem so confident that this suddenly changes and that applying the 1993-2003 trend to 2003-2012 will say something meaningful when doing that in any other previous decade has produced absurd results. Why this change of opinion?
By using an extrapolation (yes Bob, I do understand what an extrapolation is) what you are doing has no more meaning than if you were playing pin-the-tail-on-the-donkey!
‘How does the GISS model compare to the observations over the last decade?”
“I dunno, they haven’t modelled it! But if we stick a pin in here and here, and draw a straight line between here and here, Presto Gizmo, this might, perhaps, be what the might have modelled, if that had modelled it, which they haven’t of course, and if their model produced exactly the same results as the previous decade, which we can’t know because they haven’t actually done that modelling, but, you know, maybe this might be what they might have perhaps shown, if they had actually done it, which they didn’t, but …. welll…. you get the way I have drifted haven’t you? Anyways, their model is obviously WRONG! Or it WOULD BE if they had actual done this stuff that I have done. So if they modelled things the way I have modelled them then their model would be just so damn wrong! Time for a beer….”
Just some guy says: “Can someone answer why there is such a huge difference in the OHC (0-2000) actual data between figure 4 and figure 8? Thanks.”
I’m looking into it and don’t have an answer for you. They both should use ARGO data during that period. Are we seeing the effects of the NODC’s adjustments to the ARGO data? Dunno. NODC also used XBTs during that period but I’m not sure about the UKMO EN3 data. Is that the reason for the difference? Dunno. The NODC recently changed its climatology for OHC anomalies, but that should not have an impact.
Mosher should stick to Gleick type investigations. Hes been.m wrong about nearly all his climate predictions like Gore. Maybe stick to DA and Corbyn? LOL
Alex C says: “The Heat Content, UKMO EN3 Analysis, like you said, 0-2000; the graphs I get when plotting the data are not the same as the ones you gave, did I get the source correct? Which did you use?”
The first graph at the KNMI Climate Explorer “time series” page is the raw data. That includes a seasonal signal. The second is the climatology. The third is the anomalies. I used anomalies. Click on “raw data”.
http://i48.tinypic.com/21e69sy.jpg
The UKMO EN3 data is presented in terms of Joules/meter^2 while the NODC data from the Climate Explorer is in Gigajoules/meter^2, so I converted the UKMO EN3 data to Gigajoules/meter^2. I then zeroed the data in 2003 for Figure 8, same as Figure 1.
Steven Mosher says: “well bobs comparison between a single model mean and observations isnt exactly full and plain disclosure as those of us at climate audit demand.”
It is not posted at ClimateAudit. The graph is presented because it contains a question.
Here is another example where, I believe, Dana1981 at SkepticalScience tries to mislead his readers: Nordhaus Sets the Record Straight – Climate Mitigation Saves Money
I’ve posted a comment explaining that, I believe, Dana1981 has misrepresented Nordhaus and also explaining that the Australian CO2 tax and ETS would cost nine times more than the benefits, cumulative to 2050; and this estimate assumes the whole world acts together to implement an economically efficient CO2 pricing regime. If this assumption does not apply, the benefits to Australia are virtually zero.
For the benefit of readers here and in case my comment at SkepticalScience gets deleted I’ll post it here (I hope this is allowed).
@Glenn Tamblyn says: “How can you compare what the GISS model supposedly says for the post 2003 period with OHC data for that period?”
Take a look at Lucia’s Blackboard Ocean Heat Content Kerfuffle(May 2011) She says:
“Bob Tisdale wrote to ask my opinion on the Ocean Heat Content Kerfuffle which involves Bob’s blog, Tamino’s blog,….I also explained what I consider to be the main question mark in his post: How in the heck can we test the model E projections after 2003 when we don’t actually have any?” (Emphasis added)
Glenn Tamblyn says: “When in fact you have no idea what the GISS model predicts for 2004-2012. They haven’t modelled it. you are simply assuming that if they were run for that latter period they would predict exactly the same trend as they did for the previous decade.”
Of course they have modeled it as part of the models they submitted to the CMIP3 archive. Gavin simply elects not to include it in his presentation at RealClimate. Why? His answer from this post:
http://www.realclimate.org/index.php/archives/2009/12/updates-to-model-data-comparisons/
There he writes, “Another figure worth updating is the comparison of the ocean heat content (OHC) changes in the models compared to the latest data from NODC. Unfortunately, I don’t have the post-2003 model output handy, but the comparison between the 3-monthly data (to the end of Sep) and annual data versus the model output is still useful.”
And he continues, “(Note, that I’m not quite sure how this comparison should be baselined. The models are simply the difference from the control, while the observations are ‘as is’ from NOAA). I have linearly extended the ensemble mean model values for the post 2003 period (using a regression from 1993-2002) to get a rough sense of where those runs could have gone.”
And what does the GISS Model-ER mean look like through 2010? It looks like a trend extrapolated from 1993-2003:
http://i52.tinypic.com/3536rsm.jpg
Refer to the discussion of Figure 3 in my post here:
http://bobtisdale.wordpress.com/2011/06/14/giss-ohc-model-trends-one-question-answered-another-uncovered/
@Glenn Tamblyn
========================
Not modelling ocean heat content but you might learn something about climate modelling before you come up with silly hack cocked critiques of Tisdale. Start here:
http://climateaudit.org/2011/05/15/willis-on-giss-model-e/
The problem Glenn, is that the sceptics aren’t as dumb as you think they are and you’re not half as smart as you think you are either. 😉
Just in case dana1981 feels he’s being mistreated here, let’s see how the denizens at SkepticalScience respond to my comment to one of the bloggers on the thread of dana1981’s post:
http://i50.tinypic.com/15d2rd0.jpg
Note that the moderator removed the graph Tom Curtis had posted, which was this one:
http://i41.tinypic.com/dmvbxj.jpg
And if you’re having trouble reading my comment, it reads in full:
Tom Curtis says at 09:16 AM on 31 May, 2012: “The graph was produced by Bob Tisdale, whose analysis is normally massively flawed, so I am not providing a link.”
You presented obsolete NODC OHC data from a 3-year-old May 13, 2009 post. The NODC has updated their dataset twice since then. Is there any reason you presented obsolete data?
Also, my website requests that you provide a link to the post when using a graph. You failed to do that. As opposed to asking you to remove the graph, I’ll provide the link:
http://bobtisdale.wordpress.com/2009/05/13/levitus-et-al-2009-ocean-heat-content-%e2%80%93-comparison-of-the-ocean-basin-data/
Your claim that my “analysis is normally massively flawed” is baseless. And you’ve expressed your misunderstandings in the rest of your comment. The variations in tropical Pacific OHC are in fact a function of ENSO, but there is no difference in tropical Pacific OHC for depths of 0-700m and 0-2000m:
http://i46.tinypic.com/dbi51j.jpg
The data contradicts your claim of “greater conduction of water to the depths, and hence an overall cooling of the surface waters (0-700 meters).” BTW, 0-700 meters is not the surface. And did you mean subducted?
Also, you must not have looked very hard for a paper that discusses the additional variability of the North Atlantic OHC. Lozier et al (2008) “The Spatial Pattern and Mechanisms of Heat-Content Change in the North Atlantic” identifies the NAO as the driver of decadal North Atlantic OHC variability. Link:
http://www.sciencemag.org/cgi/content/abstract/319/5864/800?rss=1
Have a nice day!
I agree with Glenn here, re Fig 1. Yes, in the absence of other knowledge you can extrapolate plotted data. It gives the best estimate in the circumstances.
The model and the data have similar trend from 1993 to 2002. So you could have equally extrapolated using the data trend, with a similar line.
Then the data after 2003 turns out not to follow the extrapolated line. That is said to be a model-data discrepancy. But what if you said the line was extrapolated data. Same trend. Then you’d have a data-data discrepancy. What sense is there in that?
The fact is that you can try extrapolation, but if reality turns out to bend, the extrapolation will fail, whether it’s model or data. That’s what happened here. And the true test of a model is whether it would have predicted the bend. And as Glenn says, we just don’t know.
This whole “debate” is extremely disappointing… not just for its lack of content, but also for its tone. I’ve seen more mature discussions in schoolyards.
I’m done with this topic. Waste of time.
Nick Stokes: All of this could be remedied if GISS presented the model outputs for OHC in an easy-to-use format. Since they don’t and since it’s acceptable to a member of GISS to extrapolate the model mean at RealClimate, I’ll extrapolate too. For that graph, I’ve offered a number of times to use the model mean with a base period of 1955 to 2011, assuring that I’m not cherry-picking a base period. But no one has come forth with the GISS output. As soon as I’m aware that the GISS Model-ER simulations of OHC have been added to the CMIP5 archive, I’ll ask KNMI to include it on their Climate Explorer. I’d love to look at the model simulations on hemispheric and ocean-basin bases for the full term of the OHC data.
One works with the best data that one has at his/her disposal. At this point, this is the best data that is available.
ThePhysicsGuy said: May 30, 2012 at 7:35 pm
Why give Dana1981 the time of day? He has not produced any peer reviewed published studies in any journal. He has absolutely zero education in atmospheric physics or anything related to climate science.
======
Wow. Damning Dana1981 and Christopher Monckton in one-fell-swoop. Well done.
I’d suggest reading the comment from Steven Mosher to get a little perspective regarding the value of the original post and possible points for followup discussion.
Interesting discussion, thanks for sharing.
I feel I should point out, though, that this question still hasn’t been answered: how many years are required until the models can be said to have failed?
Falsifiability is perhaps the most basic tenet of science. Without an answer, how can the modelling be called science?
“Suggestion to Dana. Try adding a sine fit to your Argo graph from 1993.
Should fit very well indeed. My old fashioned eyeball regression method suggests a wavelength of ~64 years would be spot on.
Oh I forget. CAGW people don’t like sine curves, they only like straight line trends.”
@ Bruce of Newcastle,
Bravo Bruce!
My problem with both the skeptics and the believers alike is EVERYONE tries to fit straight lines to a system that EVERYONE KNOWS IS CYCLIC.
Dr. Roy Spencer always says that his 3rd order polynomial fit to the UAH temperature data is just for fun, and not meant to be predictive, but has anyone noticed that that 3rd order polynomial fit generates….. wait for it…..
A SINE-LIKE FUNCTION!
Freaking surprise, no?
My request. EVERYONE (and I do mean EVERYONE) please stop trying to fit straight lines to data which we KNOW FOR A FACT comes from a cyclical system!!!!
Of course, if the believers admitted that it was a cyclical system, they would have to admit that at WORST all we were doing was shifting the baseline of the sine-wave-like function upwards a tiny bit by adding a tiny amount of CO2 to the atmosphere… they couldn’t POSSIBLY want to admit THAT, now would they!?!?!?!?
Bob Tisale:
Thanks for responding. I’d be interested in getting to the bottom of that. Seems like an important question to me. One graph provides warmists with an answer to “where has all the warming gone for the past 10 years?”. The other graph implies virtually no warming anywhere for 10 years; land, air or sea.
Just as a quick response to ThePhysicsGuy’s ad hominem ([SNIP: Dana, gratuitous snotty asides will be snipped. -REP]), I happen to currently have 2 papers in the journal review stage and 2 more in draft. I also have a BS in astrophysics and an MS in physics. Not that my qualifications are at all relevant (my post stands on its own merits), but I thought it would be worthwhile to set the record straight.
I also concur with Glenn and Nick Stokes’ points, which are important ones. Cherrypicks aside, we’re not actually even comparing real model runs to the observational data here, and thus it’s not possible to determine if there’s a model-data discrepancy. Claims to the contrary are over-reaching.
Naughty naughty Bob, how dare you take a combative tone when defending your “normally massively flawed” analysis.
What a bunch of kids.
[insert Josh’s treehouse cartoon here]
“Falsifiability is perhaps the most basic tenet of science. Without an answer, how can the modelling be called science?”
1. the models are “falsifiable”
Falsifiability refers to whether or not the statement has “empirical” content
2+2=4, has no empirical content. “god is all” has no empirical content.
“yellowstone will erupt within 100K years” has empirical content. So, the criteria of
falsifiability refers to whether or not the statement has empirical content.
2. Falsifiability is not a tenet of science. It is a tenet of the philosophy of science
and is generally not a very good description of how science actually works.
That is, its not a scientific description of science.
In practice, theories are built and refined and changed and sometimes replaced. They are rarely “falsified”. They are falsifiable in principle ( have empiricial content) but in practice, scientists dont universally operate by rejecting a theory that fails to account for all observation.
So rather than having theories about how science actually works, its a good idea to actually look at how its done.
Steven Mosher says:
“So rather than having theories about how science actually works, its a good idea to actually look at how its done.”
What is your opinion of how ‘science’ is done regarding Mann, Briffa, etc.?
Bob.
My point about full and plain disclosure is simple. I refer to CA to give due credit to steve mcintyre for the notion. You’ve plotted data. You’ve plotted an extrapolation of a model mean.
If we use the CA criteria as a fair standard I’m suggesting that you havent made full disclosure.
Pretty simple. You cannot compare model results to observations without showing all your work.
I know the other side does it, but I’d rather raise the bar for everyone than seek the lowest common denominator
DirkH says:
May 30, 2012 at 9:05 pm (Edit)
Steven Mosher says:
May 30, 2012 at 7:16 pm
“2. if you choose to extrapolate a model you must state the uncertainty. with a small number of runs and the short time peroid your going to find out that you cant say much”
Which is the entire point of IPCC climate science, is it not, Steven? Scare everybody sh1tless without showing refutable predictions.
###################
You basically have two choices. If you dont like the way the IPCC does things and are critical of them, you can engage in the behavior you criticize OR you can do things the way you suggest is correct. In other words you cant complain about hiding the decline ( which really hides uncertainty) and then practice the hiding of uncertainty yourself.
You cant demand data and code and then turn around and not provide it yourself.
You cant attack cherry picking and engage in it.
well, you cant do these things and expect to convince fair minded people
Steven Mosher says:
May 31, 2012 at 11:43 am
”In practice, theories are built and refined and changed and sometimes replaced. They are rarely “falsified”. They are falsifiable in principle ( have empiricial content) but in practice, scientists dont universally operate by rejecting a theory that fails to account for all observation.”
Hmm, I agree, perhaps ”scientists don’t universally operate by rejecting a theory that fails to account for all observation” BUT they sure as eggs are eggs are likely to reject (or at least NOT accept) a theory that is seemingly falsified by the MAJORITY of actual observations!! aka – in this case the alleged theory of AGW/CAGW.
Smokey says:
May 31, 2012 at 11:50 am (Edit)
Steven Mosher says:
“So rather than having theories about how science actually works, its a good idea to actually look at how its done.”
What is your opinion of how ‘science’ is done regarding Mann, Briffa, etc.?
##########
i would say that many posts here fall to the sub standard practice that Mann and Briffa employed in the past.
The problem Smokey is that I’m not a team player. That means I get to hold everyone to the same standard. As long as skeptics stood on the sideline explaining the flaws in methods and data, they stood on solid ground. Now, over the past couple years, some skeptics have started to do their own ‘science”. That means, real skeptics, get to hold them to the same standards they held others to. Sometimes the shoe fit is uncomfortable.
But, that you should try to personalize the application of methods ( hey Mann and Briffa did it) really shows that the scientific method is not your concern. Your concern is the “fight”
So, start with some principles that you are willing to hold everyone to.
1. share your data as used ( dont point us to GHCN as Jones tried to do with Willis)
2. share your code as run
3. Show the uncertainty.
Uphold those principles. in all cases.
Steven Mosher: Regarding your May 31, 2012 at 11:52 am comment, here’s a link to the post the graph in question last appeared:
http://wattsupwiththat.com/2012/01/26/october-to-december-2011-nodc-ocean-heat-content-anomalies-0-700meters-update-and-comments/
It is presented under the heading of ARGO-ERA OCEAN HEAT CONTENT MODEL-DATA COMPARISON. That graph is discussed in the next section under the heading of STANDARD DISCUSSION ABOUT ARGO-ERA MODEL-DATA COMPARISON. And discussed further under the heading of HOW LONG UNTIL THE MODELS ARE SAID TO HAVE FAILED? (STANDARD DISCUSSION).
I believe that’s about as full a disclosure as I need to make.
Steven Mosher,
Thanks for your response.
You are wrong on so many levels.
First, it’s not just ‘the fight’. That is a means to an end. The central problem is those named individuals [and many others] have their hands deep in our pockets, and they not only refuse to disclose their methods, data, methodologies and metadata — paid for by taxpayers like me — but they hide out from any public debates. That is a clear indication that they know absolutely that their ideas can easily be deconstructed.
I would ‘personalize’ anyone who used the devious means that Mann and his clique use, on anyone who gamed the system at my expense. Why do you think they put the names and pictures of lawbreakers in Post Offices? The names of dishonest scientists should be put on public display.
Scientists as a group are no different than any other group: some are exceedingly honest, most are average folks with average ethics, but some are thoroughly dishonest charlatans. Unfortunately for taxpayers, that last group has learned to control the system. If you have any doubt at all, read The Hockey Stick Illusion. Or go over your Climategate emails again.
As for the actual science, I note that neither you nor any other climate alarmist has ever taken my challenge to try and falsify this testable hypothesis:
At current and projected concentrations, CO2 is harmless and beneficial to the biosphere.
That is an eminently testable hypothesis: simply provide verifiable physical evidence showing conclusively that anthropogenic CO2 is causing global harm. We already know the planet is greening due to higher CO2 levels, therefore the added CO2 is beneficial. QED
So there is your real science. It cuts to the chase. Without any evidence of global harm due to CO2, AGW is merely a conjecture; an untestable opinion. If/when it becomes testable it will be a hypothesis, or possibly even a theory. But for now it is an evidence-free opinion. Much like a computer model.☺
dana1981 says: “I also concur with Glenn and Nick Stokes’ points, which are important ones. Cherrypicks aside, we’re not actually even comparing real model runs to the observational data here, and thus it’s not possible to determine if there’s a model-data discrepancy. Claims to the contrary are over-reaching.”
Refer to my reply to Nick and Glenn above. Since you and Gavin are apparently on speaking terms, please ask Gavin Schmidt to have KNMI publish the GISS Model-ER simulations of OHC that exist in the CMIP3 archive. Then there’s no question about the extrapolation.
BTW, everyone reading this thread can readily see that you’ve never responded to my earlier comment to you at May 30, 2012 at 6:35 pm.
Mosh says:
So rather than having theories about how science actually works, its a good idea to actually look at how its done.
Institutional science is actually done in accordance with philosopher of science Paul Feyerabend’s observation that when it comes to promoting a scientific theory:
Anything goes.
Databending, journal jockeying, editor threatening, peer review sandbagging, adverse result hiding, media courting, over-hyped/under-sourced press releases, flat denial of the foregoing, etc.
No wonder people have little faith in institutional scientists or their output these days.
[SNIP: Sorry, Sean. I think it’s funny but we really don’t want to do this. -REP]
For all who criticise Bob’s methods, surely it is up to the compilers of the models to prove their models work, not for Bob or others to disprove them, (or indeed Dana and co to try to prove it for them).
Is anyone aware if they have done so?
Bob, you asked for easily accessible sources of OHC data. NOAA has a bunch for 700m here:
http://www.ncdc.noaa.gov/bams-state-of-the-climate/2009-time-series/ohc
Unfortunately there aren’t many easily accessible sources of 2000m OHC data online. NODC (Levitus) have pentadal averages (and annual starting in 2005) available here:
http://www.nodc.noaa.gov/OC5/3M_HEAT_CONTENT/heat_global.html
dana1981 says: “Bob, you asked for easily accessible sources of OHC data. NOAA has a bunch for 700m here:
http://www.ncdc.noaa.gov/bams-state-of-the-climate/2009-time-series/ohc”
Dana1981, thanks for the link. But if there are links through that website to the actual data used to create those graphs, they are not easily visible. A clarification: I’m not looking for graphs. I’m looking for the data. I’m also looking for a website that allows me to download the data on a gridded basis. That way I can divide the data into logical subsets (ocean basins, hemispheres, tropics v extratropics) and attempt to determine when and why ocean heat content has risen since 1955. Global datasets are useless for that.
DavidA: Sometimes people mistake direct and to-the-point word useage for hostility. At least the moderator gave me a warning and didn’t snip the comment. Now the question is: how long will my comments remain on that SkepticalSeance thread? A month? Six months? I’ve saved screen caps just in case.
Bob, if you click on the authors names within the graph (by way of the link dana gave you) the data shows up.
Steve Mosher and everyone here, please take 5 minutes to read Gavin’s post at Realclimate BUT don’t just look at the graph he places in that post (which I told him I felt was not very informative considering that his post was on correcting an error in graphs that he has used for the past 4 years to show how the models were doing). You need to clicks on the links of the 4 year posts to see the new graph, then click on the link to the “incorrect” graph which he has a link to under the corrected graph. The difference is dramatic.
sue says: “Bob, if you click on the authors names within the graph (by way of the link dana gave you) the data shows up.”
Thanks. That at least gets me the annual data. Someday, somewhere, someone will post them on a gridded monthly basis.
dana1981, sorry. I missed the links.
Anthony: As always, thanks.
One thing I’ve truly enjoyed about this is that most everyone has already forgotten that Gavin admitted the models didn’t work out once he made the correction.
http://www.realclimate.org/index.php/archives/2012/05/ohc-modelobs-comparison-errata/comment-page-1/#comment-236042
The comment and reply:
armando says:
22 May 2012 at 12:11 PM
That must (have) hurt: http://www.realclimate.org/images/ohc11.jpg
[Response: not really. I learnt a long time ago that a) I’m not infallible, and b) that one should never get personally invested in the results of a model. When things work, one should always remain pleasantly surprised, when they don’t there is possibly a reason that can found – which may be interesting. This is why science is fun. – gavin]
Steven Mosher says:
May 31, 2012 at 11:43 am
I pretty much agree with what you said concerning falsifiability and empirical content, but disagree with your last sentence.
I think you miss the point of what Popper and others were trying to do. Rather than think of their efforts as a ‘philosophy of science’, think of it as a ‘theory of science’.
A friend of mine cites building lighthouses as an example of people knowing how to do things that worked without having a scientific understanding of why they worked. Similarly, this was the case with science up until the 20th C. It worked, but no one could adequately explain why it worked.
Popper and others tried to rectify that situation.
So rather than arguing we should focus more on how science actually works, we should endeavour to make science more like the ways in which the theory of science predicts the process of science will have more empirical content, that is, produce better scientific theories, predictions, etc.
More attention to falsifiability is the main means to do that.
regard
the notion of ‘falsifiability’ applies exclusively to a logical proposition
the study of how one can know anything at all is called epistemology
it is an axiom that cause precedes effect.
it is an axiom that if an effect does not follow the alleged cause, then the proposition is falsified.
the simple, abstract form that the logic follows is ‘if A then B’.
this has as corollary: ‘if not B, then not A’. this is falsification.
epistemology was inverted, perverted and rejected at the outset in this co2 climate religion by the assertion that the effect (increase in co2) was the cause of temperature rise when data shows that co2 lags temperature rise.
this falsifies the notion entirely because if there is a cause, it precedes the effect.
it never ever happens backwards. truth can not be falsified – that is how one knows it is true.
truth exists in context, though. if one drops the context of the proposition, then it is a faulty proposition and not subject to logical analysis.
that which is not subject to logical analysis is also false.
but it’s next to impossible to perform logic without proper words.
proper english is no longer current. it has been replaced with an orwellian creole.
that was done, progressively, with the purpose of thwarting logic.
without logic, reasoning can not be done.
this is the age of unreason.
‘state’s rights’, indeed. not one man in a thousand has a clue how that anticoncept has functioned to destroy his ability to consider the nature of rights – and therefore not one man in a thousand can hold a valid concept of rights. it was intellectual disarmament and now there is no defense.
and that’s why we have the predators in ascendance.
why do you think they call it preying?
Steven,
1. “They’re falsifiable” is not an answer to a question about what constitutes falsification. The problem here that the answer seems much too malleable; that makes the model difficult to falsify, and thus less like science and more like mere speculation. Hence the original request for some measure of falsity, and my repeating of the request.
2. Have to disagree quite forcefully. “How science is done” is much, much less important than what science is, e.g. the tenet of falsifiability. Defining science as whatever people calling themselves scientists happen to be doing is a terrible degradation of the term “science.” That sort of muddled thinking is how we got in this mess in the first place!
3. There is still no answer to the question.
Bob, I realize how much time you have put into your work and how frustrating it has been. A couple of interesting things about this situation: Gavin was a co-author of the Hansen 2005 paper and the reference for the OHC model was to Gavin’s paper in preparation at the time. I find it odd that he would make the mistake of assuming it was scaled for the ocean area only but it was actually scaled for the entire global area. The other thing is that I know for a fact that he hadn’t planned to make this correction when he did. He may have planned to in the future, but definitely not the day he did or even the week he did…. Not that you could tell by his errata post. I almost contacted you that week, but Gavin made the correction publicly and I noticed that you became aware of it. Best regards and good luck with your future work.
sue: Thanks for the kind words. Your apparent inside track at GISS makes me wonder which Sue you are.
Bob, I have absolutely no inside track at GISS, I’m just an observant person. In the thread prior to Gavin’s errata post at realclimate someone posted links to the previous posts regarding model/observation comparisions. I clicked on them and noticed one of them was updated in May 2012. I posted a question to Gavin if this was pointed out or any discussion was made about this on realclimate and if other graphs also needed to be updated.. He kept me in moderation but answered me (where I assume I could only see) that he needed to make an errata and change some other graphs, hopefully by the end of the week. I was willing to wait until the end of the week but was pleasantly surprised to see that he posted the errata the next day, along with allowing my original comment through BUT with a new response to me that he had posted an errata. I was unhappy with the new graph which did not show the model past 2003 like he did in past comparisons. I was also unhappy that he plugged Skepticalscience which IMHO is not trustworthy.
Sue, Thanks for the clarification. I found your comment.
http://www.realclimate.org/index.php/archives/2012/05/another-fingerprint/comment-page-1/#comment-235989
Looks like you may have prompted his errata post.
Regards