Guest post by Michael Pacnik
Especially in the context of recent discussion of the Shakun et al. paper, a look at other sources for temperature history versus CO2 can be helpful, examining timescales ranging from the past century to the past 11000 years and even the past 500 million years.
Recent discussion of the Shakun et al. (Nature 2012) paper has illuminated issues in its presentation of the history of CO2 versus temperature (commentaries here, here, here, and here).
In addition to those investigations, another helpful approach may be to take a step back and cross-check with other sources. In general, does CO2 correlate with temperature in climate history?
The answer is often yes on “medium” timescales, but no on “short” timescales and also no on the very longest timescales of all. If one looks at all three timescales, overall observations are consistent with temperature rise causing the oceans to release part of their dissolved CO2 after substantial lag time, yet not consistent with CO2 being the primary driver of climate.
Over the past few hundred thousand years of ice core data, a “medium” time
scale in this sense, CO2 superficially appears to change in step with
temperature if a graph is so zoomed out as to not show sub-millennial time
scales well:

Source: http://www.brighton73.freeserve.co.uk/gw/paleo/400000yearslarge.gif
Yet, what about a closer look at a “short” time scale, the past few thousand years instead?
Showing from 200 to 11000 years ago, the subsequent graph is based on ice core data, readily visible in files hosted on the servers of the U.S. National Oceanic and Atmospheric Administration (NOAA): GISP 2 and EPICA Dome C:

Source:
A lack of correlation between temperatures (in the above from a Greenland ice core) and atmospheric CO2 becomes very apparent at that timescale and level of detail.
With the focus on the bulk of the past 11000 years of the Holocene, the most recent rise in CO2 is not shown in the preceding because the EPICA ice core data ends in 1777 A.D., while the GISP 2 ice core temperature data extends up to a century ago.
Greenland is relatively indicative of changes in Northern Hemisphere temperature over time. Throughout the Holocene, warm periods have tended to have more warming in the upper Northern Hemisphere than nearer the equator (including the Modern Warm Period, a.k.a. global warming).
In the prior chart, much of around 7000 to 8000 years ago was particularly warm, more so than now. Such was part of the Holocene Climate Optimum. Research at Oak Ridge National Laboratory remarks (bolding added):
“By 8,000 14C y.a., the Earth was under a full interglacial climate, with conditions warmer and moister than present in many parts of the world. Tropical forest in Africa (and probably also Asia) was expanded in area, and the areas of desert in Africa and Asia were much reduced.”
Source: http://www.esd.ornl.gov/projects/qen/nerc.html
In fact, that atlas of palaeovegetation led to a conclusion which may surprise those used to hearing claims of how global warming would mean overall more deserts: When the climate was warmer, overall desert extent was actually less (because the ocean surface, 70% of Earth’s area, was warmed as well as land, causing more thermal-driven evaporation and circulation through rainfall of water onto land). Conversely, there was far greater
desert extent 18000 years ago during the cold Last Glacial Maximum, including polar deserts which are cold but have a lack of precipitation.

Sources: http://www.esd.ornl.gov/projects/qen/nerc.html
However, at the “short” time scales in the last ice core graph, showing fluctuations down to relatively small fractions of a millennia, atmospheric temperatures over Greenland would not be the same as ocean temperatures far below the surface, as the ocean depths can take centuries to warm much.
Only at greater time scales is there time for even seawater thousands of meters deep to fully warm and release more CO2. Accordingly, only at greater “medium” time scales does CO2 and temperature correlate highly, as can be seen contrasting the 400,000-year graph to the 11,000-year graph.
Evidence for how CO2 in ice core data lags temperature by centuries has been discussed before at Watts Up With That, including articles in 2009 by Frank Lansner and R. Taylor.
A simple Henry’s Law formula is applicable to a glass of water on a table releasing more previously-dissolved gas when warmed, but it is not literally valid when there are chemical reactions with the solute (CO2). The oceans are a far more complex system in general. However, still, more CO2 is released eventually when the planet warms. The atmosphere and the ocean surface (or shallow zones) warms much first, then deeper waters later.
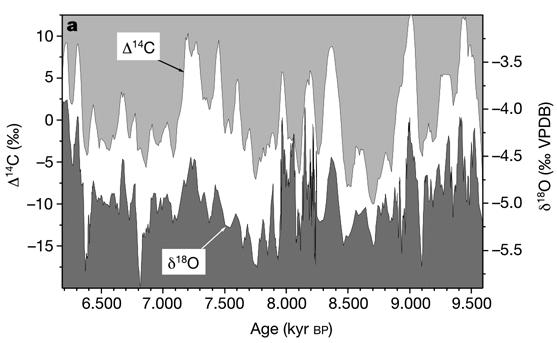
If CO2 does not usually correlate well with temperatures on the scale of variation over shorter time intervals, what does? A look at a reconstruction of Indian ocean temperatures is fitting:

Source: http://sciencebits.com/files/pictures/climate/crcFig1.jpg
Such is showing the history of temperature versus cosmic ray flux. The Oxygen-18/Oxygen-16 isotope ratio is a common temperature proxy, where the trends in it correspond to the trends in temperature.
Many papers describe Carbon-14 as a solar activity proxy, which it is indirectly, aside from some caveats on other time scales than depicted here. However, more directly, it is a cosmic ray proxy. Aside from more recent artificial sources, 20th-century atmospheric nuclear tests, carbon-14 is a cosmogenic isotopeproduced in nature by cosmic rays.
On these time scales, most variation in incoming galactic cosmic ray flux is caused by changes in the solar-driven interplanetary magnetic field. Those changes have a major relationship to sunspot trends but are not exactly identical in timing. For example, the authors of a paper by NASA’s JPL remark (terminology clarification in brackets added):
“Cliver et., (1998) has compared the minimum aa [index of geomagnetic activity] values with the Earth’s surface temperature record and found a correlation of 0.95 between the two data sets starting in 1885. The solar irradiance [solar activity] proxy developed from the aa minima continues to track the Earth’s surface temperature until the present (Cliver et al., 1998).
This is in marked contrast to reconstructions based on sunspot number [Solanki and Fligger, 1998 in which the irradiance and the temperature are not correlated after 1978. In a study of 14C [Carbon-14 history] Stuiver and Quay (1980) found that the cosmic ray flux at the magnetopause was anticorrelated with [the] aa [index of geomagnetic activity].”
With that said, there is significant correlation between sunspot number trends and temperature in many time periods, provided that an appropriate temperature indicator is utilized. One example is the following chart from the NOAA archive for 1860 – 1985, where the global mean sea surface temperature trend (SST) is fortunately not skewed by Urban Heat Island (UHI) effects on land:

Source: http://www.oar.noaa.gov/spotlite/archive/images/sunclimate_3b.gif
However, as noted previously, trends in the aa index of geomagnetic activity
display even better correlation than sunspot trends to terrestrial temperatures. When the aa index of geomagnetic activity rises, more galactic cosmic rays are deflected in interplanetary space, and fewer cosmic rays reach Earth.
The following shows correlation between temperature and Be-10 over the latter part of the Little Ice Age and then into the 20th-century Modern Warm Period:

Source:
http://www.appinsys.com/globalwarming/GW_Part6_SolarEvidence_files/image009.gif
The Be-10 cosmogenic isotope is frequently labeled a solar activity proxy, which is true, but, once again, it is also and more directly a cosmic ray proxy.
On the short term, solar activity in terms of total solar irradiance (TSI) changes only by around 0.1% typically over solar cycles, but the interplanetary magnetic field varies vastly more in percentage terms, with correspondingly substantial changes in cosmic ray flux.
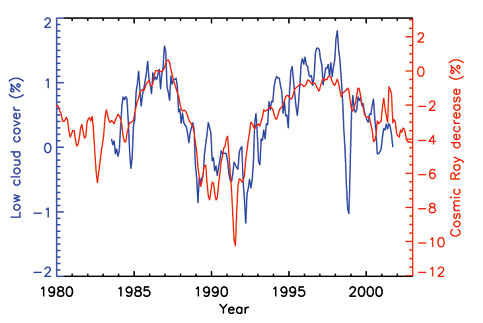
On Earth, tropospheric ionization changes by typically 5% over a single solar cycle (Shaviv, 2005). Global cloud cover has been observed to vary 3-4% in a solar cycle in a manner strongly correlating with cosmic ray flux change (Svensmark, 1997).
Cosmic rays are minuscule in direct energy delivered compared to sunlight but can seed clouds. Evidence supporting how cosmic rays contribute to cloud condensation nuclei has been discussed at Watts Up With That previously, including a last month’s update.
Some common mistakes can lead to missing observation of the effect of cosmic rays, discussed by Dr. Shaviv in remarks on the Hebrew University debate, another debate,
and a recent paper. (Also, counterintuitively, fluctuations in galactic cosmic ray flux matter little for the highest altitude clouds but more for lower altitude clouds, because the former are in an enviroment where GCRs are always in relative surplus and not the limiting nutrient, so to speak).
However, if those mistakes are all avoided, substantial correlation can be seen between cosmic ray flux variation and cloud cover variation, such as this illustration (discussed more at Dr. Shaviv’s site, following Marsh & Svensmark 2003):

Source: http://sciencebits.com/files/pictures/climate/crcFig3.jpg
There are other examples. For instance, as might be expected from cosmic ray variation slightly modifying average cloud cover, a study from a much different source notes a relationship between galactic cosmic radiation and tree rings:
“There was a consistent and statistically significant relationship between growth of the trees and the flux density of galactic cosmic radiation. Moreover, there was an underlying periodicity in growth, with four minima since 1961, resembling the period cycle of galactic cosmic radiation. We discuss the hypotheses that might explain this correlation: the tendency of
galactic cosmic radiation to produce cloud condensation nuclei, which in turn increases the diffuse component of solar radiation, and thus increases the photosynthesis of the forest canopy.”
An article by Dr. Svensmark on cosmoclimatology is excellent reading:
Cosmoclimatology: A new theory emerges (PDF)
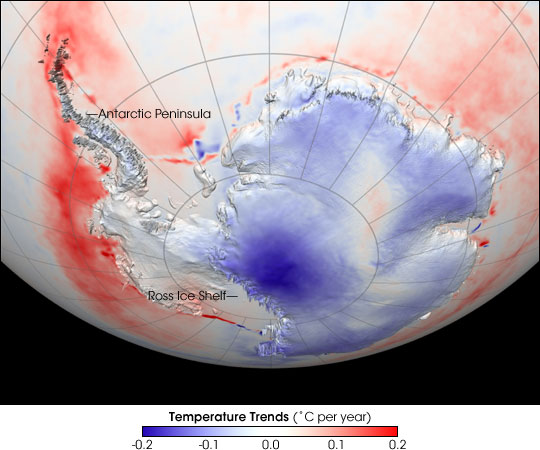
As implied there, a relative smoking gun of evidence exists for variations in cloud cover driving much of temperature change: Usually low-level cloud cover cools the surface, but cloud cover over the Antarctica ice sheet itself is the opposite situation, because the ice is such a particularly high albedo as to be literally more white (more reflective) than the cloud tops. The following NASA graph indirectly provides a rather good illustration if interpreted in that context:

Source:
http://eoimages.gsfc.nasa.gov/images/imagerecords/6000/6502/antarctic_temps.AVH1982-2004.jpg
Over the 1982 – 2004 period depicted above, there is a very sharp contrast between observed temperature trends over the exceptionally reflective continuous permanent ice sheet in Antarctica (cooled when average cloud cover decreased over that particular period) versus the less reflective surrounding ocean even a short distance away (warmed when cloud cover decreased).
Another NASA graph shows the past century of temperature variation on the opposite end of the world, the Arctic (which warmed far more in the late 20th century than more tropical regions):

Source:
http://earthobservatory.nasa.gov/Features/ArcticIce/Images/arctic_temp_trends_rt.gif
As can be seen, there was major decline in temperatures from the 1930s to the 1960s. CO2 emissions went up constantly meanwhile, in utter lack of correlation not fitting the theory of CO2 being the primary climate driver. What does fit for more correlation there is solar activity, both solar irradiance and the solar-driven interplanetary magnetic field affecting
comic rays:
Sources: http://www.appinsys.com/globalwarming/GW_Part6_SolarEvidence.htm
Even on a time scale of a century, CO2 trends do not correlate with temperature well. What about very “long” timescales in geological terms? Back in 2001, a study of atmospheric carbon dioxide levels for the last 500 million years (Rothman, MIT) remarked:
“Because the long-term evolution of carbon dioxide levels depends similarly [to a strontium-isotope record] on weathering and magmatism, the relative fluctuations of CO2 levels are inferred from the shared fluctuations of the isotopic records. The resulting CO2 signal exhibits no systematic correspondence with the geologic record of climatic variations at tectonic time scales.”
On those extreme long time scales, atmospheric CO2 levels are driven largely by geological processes other than the temperature-dependent release of CO2 from the ocean predominant on “medium” time scales. Accordingly there is lack of correlation between CO2 and temperature. The prior study also noted apparent long-period climate fluctuations, of around 135 million years, existing from some cause, with cycling between warm and cool modes several times over the past 600 million years.
Others have guessed that cause. Inthe words of Dr. Antonino Zichichi, president of the World Federation of Scientists:
“In the last half billion years, earth has lost, four times, its polar caps: no ice at the North Pole and none at the South Pole. And, four times, the polar caps were reconstituted. Man did not exist then, only the so-called cosmic rays, discovered by mankind in the early twentieth century. The last cosmic ice age started 50 million years ago when we entered into one of the galaxy arms.”
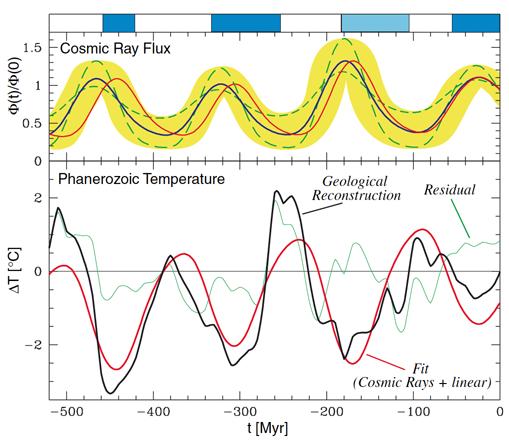
A non-coincidental match between a climate cycle of near 140 million years and the time it takes the Solar System to pass between spiral arms of the galaxy was observed by Dr. Shaviv after reconstructing past cosmic ray variation from iron meteorites:

Source: http://sciencebits.com/files/pictures/climate/crcFig5.jpg
Everything from ozone change to volcanoes, human activities, and ocean cycles has a non-zero effect on climate, but much of temperature history fits together well if changes in cosmic rays and solar activity have a major effect on climate. The preceding contrasts with those who would assume CO2 to be the primary climate driver and who, in practice, predominantly simply entirely ignore the effect of cosmic rays (aside from the occasional attempt at rebuttal to justify continuing to ignore them), acting as if solar activity variation only mattered for direct irradiance alone.
However, claims about massive forcing from CO2 variation have always been based not on its direct observed spectral effect but upon hypothetical major net positive feedback from water vapor vastly amplifying CO2’s small direct effect. Evidence supports rather a climate system with low climate sensitivity, with predominantly negative feedback.
The GISP2 ice core record is more than enough for demolishing the whole AGW BS. And the instrumental record in red should peak under the MWP one. There are still frozen Viking graves up there.
More, looking in detail, the modern GISP warming ocurred until 1940, then cooled, then warmed back to 1940s level. There is no relation with “human influcence”. Period.
All that solar/geomagnetic/cosmic ray stuff related to temperature is simply falsified by recent data: the sun is now as quiet as it was a century ago, geomagnetic activity and interplanetary magnetic fields are at record lows, cosmic rays at record high, and yet temperatures are much warmer now than a century ago. This does not mean that the rise is man made, just that it is not solar made.
I just love intelligent, measured, precise and completely devastating scientific debate.
Oops, sorry, the debate is over isn’t it?
A nice summary; thanks.
CO2 behaves like a dependent variable; back-forcing is a pain in the brain.
The problem is not convincing us, and scientists unconstrained by grant applications, but the givers of the “best scientific advice” that polititians are constrained to adhere to. There is a long list of acronyms of these advisors, and the enemy is within.
There are tales circulating about the sanity of our Prime Ministers’ by the time they leave office, (Australian) I can only think that that applies to Govt. Scientific departments, August Scientific Institutions and many Heads of State world wide.
A very solid investigation. I learned. Thanks.
Michael Pacnik sounds far too realistic, aka authoratative, to be taken seriously by the CAGW trash — or, perhaps, too frightening?
Thank you, Michael.
Ain’t, real scientific investigation wonderful? We get to see things in timescales hundreds and thousands of times our on lifespans… and we still believe we humans are significant.
Excellent post, many thanks.
So the prediction must be for the climate to get colder (in the short term), because of the inactive sun?
Wow. This is much more detailed that I did a decade ago. I simply went through the vostok ice core data in fairly small chunks to find that you could pretty much use it to plug any theory you liked. There are short periods where CO2 seem to lead temperature though most of the time it CO2 rises lag temperature. — John M Reynolds
From 1917 to 1937 the Arctic increase is double of the recent one(0.48 oC/decade) with one third of the global population
If the effect of cosmic rays is the main driver of global temperature changes as suggested, has anybody made any predictions for the next few years?
The Be-10 vs deltaT plot stops at yr 2000. Anybody know what cosmogenic Be-10 levels are doing now? Rising, signalling a potential cooling? Thanks
Oh – great article, by the way.
Leif Svalgaard says:
April 11, 2012 at 12:19 am
All that solar/geomagnetic/cosmic ray stuff related to temperature is simply falsified by recent data: the sun is now as quiet as it was a century ago, geomagnetic activity and interplanetary magnetic fields are at record lows, cosmic rays at record high, and yet temperatures are much warmer now than a century ago. This does not mean that the rise is man made, just that it is not solar made.
_____________________________________________________________________
BS.
Do you think, that warming what has happend in 60 – 100 years, disappears in two or five years. Because of oceans it takes at least 7 years before anything measureable happens, then at least one whole solarsycle to find how large influence Sun has to climate.
The sun is quiet now… Let us wait 5-10 years to see whether the temperature has dropped…
The problem of this article is that it does not stick to its own topic. If the topic is to prove CO2 is not correlated with temperatures, it should prove it instead of looking for other correlations. It shows the correlation exists on ice age timescales and is much lower on shorter time periods – and that’s all, the rest are statements which are either unsourced or unrelated to CO2.
“However, claims about massive forcing from CO2 variation have always been based not on its direct observed spectral effect but upon hypothetical major net positive feedback from water vapor vastly amplifying CO2′s small direct effect.Evidence supports rather a climate system with low climate sensitivity, with predominantly negative feedback.” – yes, that’s what I personally also wish to believe but I see no evidence for it in the article.
Hansen always claims that he’s got a proof of high climate sensitivity from the paleoclimatic record. I never figured out what arguments exactly are his claims based on but if you want to prove him wrong, show where exactly is he wrong. Pointing out all kinds of other correlations doesn’t do the trick.
The sun is weak now… Let us wait 5-10 years to see the effect on temperature…
Quote -“The isotopic composition of the water molecules in the ice cores does not only tell us about the local temperature back in time at the drill site. It also tells us about the conditions where the water initially evaporated. When water evaporates from an ocean or land surface, it is typically transported aloft in the atmosphere after which it follows the winds. Eventually it condenses and precipitates out as rain or snow a completely different place from where it evaporated. Because the history of the precipitation influences the isotopic composition, the isotopes can reveal past changes both at the source areas far from the drill site and in atmospheric circulation patterns. ”
From ‘Modelling Greenland Precipitation Sources’ http://www.iceandclimate.nbi.ku.dk/research/climatechange/modelling_dynamics/greenland_precipitation_sources/
Consider the same logic for the Antarctic, especially for drill core from near to the pole, or more particularly near to the centre of circulation of the polar weather system. Hypothetical. It is a cold era, the ice sheets over the oceans stretch far, far beyond the land mass of the Antarctic. The points of evaporation are closer to the equator and has been graphed by Willis Eschenbach so vividly, the tropical surface sea temperature tends to plateau at about 30 deg C. Evaporation of open water gives a mixture of isotope compositions which become well mixed and by convention are taken as a single figure at a given time at the point where evaporated waters form a solid at the future drill site. Alternative hypothetical. It’s a warmer era and there is essentially no ice over the ocean adjacent to the Antarctic. Evaporating water arises much closer to the pole and would be expected to average to a number different to hypothetical A.
Somehow, the complexity of these scenarios seems to have been lost as the story has been told. I can see no way in which a ratio of isotopes can be included in a linear expression relating only to temperature. Also, these are static scenarios that do not include the complex dynamics of a change from one to the other. Leads, lags, noise.
Been in an airplane many a time, and have yet to see the glass ceiling that stops convection.
There is, in reality, no such thing as the greenhouse effect in an open atmosphere. !!!!!
The Earth’s atmosphere is controlled by the combined gas laws, which lead to the lapse rate, which is based on the specific heat of the composition of the atmosphere.
Phase changes, such as the condensation of H2O, is the only thing that can affect the lapse rate because it changes the specific heat of the atmosphere (but still transports the same amount of energy).
Mnor increases in CO2 , if anything, speed up the lapse rate (by a tiny, tiny amount) that controls the upward transfer of energy within the atmosphere
The ~60-yr climate cycle doesn’t correlate with the amplitude of solar activity at any point in the instrumental record… SSN vs SST; but something caused a ~13 gazillion Joule increase in ocean heat content from 1910-1941. That heat had to have a source and I doubt it was geothermal and know it wasn’t CO2.
I do not have the full Beer paper yet so this is just a quote form the abstract
“These findings point to an active role of theSun in past climate changes beside other geophysical factors, internal variability of theclimate system, and greenhouse gases. In fact a non-linear regression model to separate natural and anthropogenic forcing since 1850 is consistent with a solar contribution of about 40% to the global warming during the last 140 years.”
Nobody disputes an effect of the sun on global temperatures. But clearly the authors state that GHG play a role are some of the key players. And since most of the graphs are derrived from Wikipedia why not show one of the other ones http://en.wikipedia.org/wiki/File:Temp-sunspot-co2.svg which is just making the point of J. Reynolds a few posts up.Yes the Sun is a key player in our climate but it is not the only one.
Regards
smu
Reblogged this on Climate Ponderings.
For me a fascinating article.
Interesting to see research confirming that cold causes more desert while warmth more
vegetation due to more rainfall. So many factors to be accounted for, sun spots, geomagnetic activity, changes in solar radiation, the effect of the interplanetary magnetic field, the activity of cosmic rays and the way they seed low clouds resulting in more photosynthesis affecting tree rings, the climate cycle of the solar system, the way Antarctica cools with less cloud cover and how they all interrelate.
If “those who would assume CO2 to be the primary climate driver and who, in practice, predominantly simply entirely ignore the effect of cosmic rays” were to relinquish their CAGW obsession there seems to be a tremendous amount of genuine research to be done into the factors affecting climate and many discoveries waiting to be made.
As implied there, a relative smoking gun of evidence exists for variations in cloud cover driving much of temperature change: Usually low-level cloud cover cools the surface, but cloud cover over the Antarctica ice sheet itself is the opposite situation, because the ice is such a particularly high albedo as to be literally more white (more reflective) than the cloud tops. The following NASA graph indirectly provides a rather good illustration if interpreted in that context
Low level cloud cover changes drives much of the measured temperature change.
The reason for this is that minimum temperatures generally occur when solar insolation exceeds outgoing longwave radiation. This occurs some time after dawn as the sun rises.above the horizon. Low level cloud will block solar radiation and and allow longer for radiative cooling and thus lower minimum temperatures. Less low level cloud will allow less time for net radiative cooling and cause higher minimum temperatures.
All the warming on the Antarctic Peninsula has been in minimum temperatures.
There is a serious problem with rising air temperatures causing ice melt along the Antarctic peninsula. Which is, while the glacial icesheets (Larsen A,B and C) have indeed have retreated rapidly, the surrounding sea ice has rapidly increased in extent. Warmer air temperatures can not possibly cause ice from one source to rapidly retreat while ice from another source to rapidly expand.
Briefly, what is happening is that increased solar insolation from decreased low level clouds is melting the icesheets, which do not form over the ocean and are only susceptible to rate of melt. Whereas sea ice extent is determined by rate of formation and less low level clouds will overall increase heat loss from LWR and hence lower temperatures and result in more sea ice.
You may find this graph interesting. It shows how the graph displaying solar cycle lenght vs temperature may possibly be used to tell us something about the cause of the recent warming… Just a food for thought…
http://agust.net/images/Armagh-Solarcycle-Length-English-feb2010.jpg
(This is an updatet graph from an article I wrote for the Icelandic magazine Þjóðlíf and copied to my blog in May 2008. The name of the article is “Global Cooling Following Global Warming?”
http://agbjarn.blog.is/blog/agbjarn/entry/528875/ ).
I have been convinced by Murry Salby that net emissions of CO2 are independent of human emissions. I have believed that emissions were caused by warming of the oceans leading to outgassing. The Holocene interglacial is cooler than the previous four interglacials but we have more CO2? If humans are not causing this rise in atmospheric CO2 then where is it coming from? Are there mechanisms at work which we do not understand?
8.6 earthquake near Aceh, Indonesia. 8.2 aftershock. Tsunami alert for 28 countries. Cue the global warming prophets of doom, linking earthquakes and tsunamis to climate change.
The effect of lag times are important to consider but they are considered less often than I would like to see.
Some suggest the lag times are at least 2-3 years, others think 7-10, Hansen decided a few years ago it was exactly 50 years, others think it is as long as 200 to 1,000 years. These of course, also depend on whether you consider the deep oceans as well.
In another 15 years, I think we will have a much better handle on all of this. If it turns out the CAGW threat has been greatly exaggerated, do we get to harp on it and have daily diatribes for the next 20 years to match the last 20 years of hysteria? I somehow doubt it. Actually, I think that there are many who will downplay or ignore the fact that it was hyped and still keep it as a semi-truth in their own minds much like DDT or nuclear power or even communism today.
Leif,
I know you to be more intellectually honest than your post in this thread, so am having a hard time understanding why you wrote what you wrote. If you really believe a few years of low solar activity can instantaneously (less than five years) reverse SST’s to previous levels, I don’t know what to tell you. Maybe you just forgot the sarc at the end.
Leif…..you forget about time lags in ocean heat storage!
There was no ‘antrhopogenic’ global warming before 1950 (IPCC model runs demonstrate this though they don’t highlight the fact, and between 1950-1980, a natural down cycle meant global temperatures did not rise to 1950 levels until 1980 (roughly). The earlier contention that warming was obscured by sulphur emissions has been disproved (see my chapter in ‘Chill’ which reviewes the papers in Science and to which I still have no reply from people at the Metoffice).
Thus 1980-2000 is the global warming period that potentially is man-made, but during which the solar magnetic field did increase, as well as the UV flux – both of which may affect cloud cover – and cloud cover is recorded as falling by 4% over that time (International Satellite Cloud Climatology Programme) – quite enough to generate the rise in upper ocean heat content.
About 80% of all land temperature rise is due to heat transfer from the ocean (Compo and Sardeshmukh, NOAA labs). The heat is storedin the upper 200m.
In 2001, cloud cover recovered by 2% over the whole decade – thus global warming ‘stalled’ but the oceans were still warm (the lag) and are cooling slowly.
In 2006 the field fell to its current low, as did UV flux, and the jetstream has shifted the cloud cover such that it lowers insolation equatorially and accelerates heat loss poleward, and hence the North Atlantic and North Pacific have cooled significantly in the last five years. This will knock on to land temperatures. The changes are less marked int he southern hemisphere because there is more ocean and different gyre dynamics around the southern polar region.
So – keep an open mind and watch the future behaviour of ocean heat storage.
Indeed a strong post.
Anyone who looks at temperature at longer timescales is on the right track, IMHO.
For instance, the “sane” version of Jeff Masters looking at the last 110,000 years:
“Ocean and lake sediment data from places such as California, Venezuela, and Antarctica have confirmed that these sudden climate changes affected not just Greenland, but the entire world. During the past 110,000 years, there have been at least 20 such abrupt climate changes. Only one period of stable climate has existed during the past 110,000 years–the 11,000 years of modern climate (the ‘Holocene’ era). ‘Normal’ climate for Earth is the climate of sudden extreme jumps–like a light switch flicking on and off.’
In the other direction, we have the insane version of Jeff Masters looking at U.S. temperatures for a single month, namely March 2012:
“Yesterday (Tuesday), the analysis showed that Michigan experienced temperatures that were 4-5 climatological anomalies warmer than average (4-sigma to 5-sigma), the type of extreme that occurs between once every 43 years and once every 4,779 years.
“Of course, using 30 years of data to estimate extreme events with a return period of centuries is a sketchy proposition. However, keep in mind that had we used a century-long climatology instead of using the past 30 years, yesterday’s warmth would have been classified as much more extreme, since the climate has warmed considerably in the past 30 years.
“It is highly unlikely the warmth of the current ‘Summer in March’ heat wave could have occurred unless the climate was warming.”
Again, it’s as though these people don’t realize there’s an interweb.
Olavi says:
April 11, 2012 at 2:50 am
I also think Leif is being a little simplistic! Solar influences will be somewhat hidden in the timelag for any warming/cooling phases due to oceanic, atmospheric and land heat ‘content’. A cool sun will not have an instant effect on global temps.
In simple terms – the earth is one bloody big storage heater – which takes ages to warm up and also ages to cool down. I thus find it hard to believe that decadal scale solar changes/influences will be easily detectable within centennial or millenial palaeo proxies but that doesn’t mean they don’t occur or don’t have a cumulative effect!
Nothofagus dombeyi is a South American tree. It procuces pollen every year and the levels of pollen are a good proxy for the number of trees. We know that it likes things warm and wet, because we know where it grows today.
Looking at a biological proxy gives on an idea of what the growing conditions were like, its not a thermometer, but an ecology proxy.
Here is a pollen record from Patagonia, most are behind paywalls.
http://ars.sciencedirect.com/content/image/1-s2.0-S0277379111003519-gr4.jpg
Nothofagus dombeyi goes a 50 fold expansion in levels from 16000 to 9500 years before 1950.
This shows that Patagonia became warm and wet, Now when you have a huge change in the amount of carbon fixing trees, you have changes in the levels of other biotica, all of which fix carbon, and some fraction of that carbon ends up under ground or in marine sediments.
What is interesting is that ecosystems change long before CO2.
Where all the CO2 go?
Dung says:
April 11, 2012 at 3:57 am
To be fair, I think most geologists have taken that view in respect of AGW issues since geologists see ‘scale’ in dimensions both temporal and spatial. I have certainly been advocating the scale problem of anthropogenic CO2 since I first got to look into the AGW scam.
You simply cannot have the oceans and soil mass of the earth ‘sneezing’ up some CO2 (or sinking it back in?) and expect to detect a titchy anthropogenic signal on top. The AGW CO2 signal is based on an assumption that the rest of the much more massive CO2 cycle is entirely static, which is complete fantasy! (as simple things like algal or foraminiferal blooms, deforestation, etc, easily demonstrate).
In the words of Monty Python, Salby’s work in a sense, justy points out ‘the bleeding obvious’, but he backs it up with valid science IMO and should be far more prominently promoted in the media.
.
I see where Lief is going with this, but forgive me if I am repeating myself. The atmosphere surely acts more like the air in your house. You come home at 6pm, it’s cold & dark. No central heating on. You turn the heating on, & depending upon the efficiency of the insulations, the boiler, building materials, (feedbacks shall we call them?) etc, it could anything up to a hour or more before the temperature rises to a comfortable level. When you turn the heating off, the house doesn’t immediately turn cold for some while afterwards! If the Sun is quiet, & I don’t doubt that for one second, then it will take several years to demonstrate significant cooling of the atmosphere!
“The atmosphere and the ocean surface (or shallow zones) warms much first, then deeper waters later.”
….and most of the Shakun temperature proxies appear to be from coastal locations in shallow waters, representative of neither continents nor bulk oceans.
Kasuha says:
April 11, 2012 at 2:59 am
I never figured out what arguments exactly are his claims based on but if you want to prove him wrong, show where exactly is he wrong.
I would think just looking at the first graph showing that the last interglacials were all warmer than today with less CO2 should be sufficient. CO2 lacks the logical blame for temperature rise as it is neither necessary nor sufficient. Case closed.
The warning that needs heeding has to do with oscillation rhythms. In a system replete with oscillations of various speeds and variable time spans, correlation will occur. And when correlation occurs, it may take, depending on the oscillations being compared, many, many thousands of years to pass each other by. One must delve into mechanisms, mathematically determining the energy needed to create such couplings and keep them in sync. Without plausible (again with the maths) mechanism, this discussion is about two windshield wipers on a school bus that occasionally, and for several swipes of the glass, look to be connected.
This is interesting, but not that much. Does cosmic-ray intensity cause glacial/interglacial cycles? Those cycles have been shown to correlate tightly w/the Milankovitch orbital characteristics. Does cosmic-ray intensity correlate w/Milankovitch cycles? No. So tho I don’t discount cosmic-ray having an effect on clouds, it isn’t the elephant in the room, it’s just a little kitten. I’m mostly interested in the elephant.
Peter Taylor says:
April 11, 2012 at 4:34 am
Leif…..you forget about time lags in ocean heat storage!
Look at the ‘studies’ cited. How many of those incorporate a lag? and what is it?
Solar activity did not just drop a couple of years ago. Here is the average sunspot number per cycle the past 100 years: http://www.leif.org/research/Solar-Cycle-Average-SSN.png
RE spiral arms of the milky way and ice ages every 100.000 years:
Check out Veizer and Shaviv, GSA Today, July 2003 (EOS dumped all over it, so it must be good.)
http://stephenschneider.stanford.edu/Publications/PDF_Papers/shaviv-veizer-03.pdf
smu says:
April 11, 2012 at 3:12 am
…. And since most of the graphs are derrived from Wikipedia why not show one of the other ones…
_______________________________
Wikipedia information on climate is carefully massaged by the gatekeeper William Connelley.
Wikibullies at work. The National Post exposes broad trust issues over Wikipedia climate information- 12/19/2009
More on Wikipedia and Connolley – he’s been canned as a Wiki administrator – 12/19/2009
Wikipedia climate revisionism by William Connolley continues – 10/13/2010
At that point I lost all faith in Wiki as a source for anything as have most others here at WUWT.
> A lack of correlation between temperatures (in the above from a Greenland ice core) and atmospheric CO2 becomes very apparent at that timescale and level of detail.
But why do you expect correlation with Greenland T? CO2 is global. You need to look at global temperature, which you don’t have. You don’t see those spikes in the Antarctic record, for example.
> Greenland is relatively indicative of changes in Northern Hemisphere temperature over time.
{{cn}}
> http://eoimages.gsfc.nasa.gov/images/imagerecords/6000/6502/antarctic_temps.AVH1982-2004.jpg
Funny you should use that. You obviously wouldn’t want to use a more up to date pic:
http://earthobservatory.nasa.gov/IOTD/view.php?id=8239
Indeed, if you look at http://earthobservatory.nasa.gov/IOTD/view.php?id=6502 which uses your version, it helpfully says “(Editor’s note: This image was first published on April 27, 2006, and it was based on data from 1981-2004. A more recent version was published on November 21, 2007. The new version extended the data range through 2007, and was based on a revised analysis that included better inter-calibration among all the satellite records that are part of the time series.)” Put another way, your version is wrong. There is some discussion around this issue at http://en.wikipedia.org/wiki/Talk:Antarctica_cooling_controversy#Satellite_pic which you might find interesting.
David Middleton says:
April 11, 2012 at 3:02 am
======================================
Yes Sir, and solar activity, by any metric, stayed relatively high until recently. To expect instant changes in the long term massive residence time of the worlds ocean heat content, appears a little silly for one of Leifs qualifications. The burner on the large pot of water was set to medium, I turned it up to high for 20 seconds, then down to medium high for five minutes, gee the pot kept warming the entire time. The ocean is a very large pot indeed.
Leif: “and yet temperatures are much warmer now than a century ago. This does not mean that the rise is man made, just that it is not solar made.”
1) Temperatures are not much warmer than they were 68 or 70 Years ago,
HADCRUT3 – http://www.cru.uea.ac.uk/cru/data/temperature/hadcrut3gl.txt
Jan 1878 0.160
Jan 1942 0.215
Jan 1944 0.240
Jan 2011 0.194
Jan 2012 0.218
2) Sunshine is up.
http://i40.tinypic.com/xgfyok.jpg
I’m trying to read this great article, however, there is an amazingly horrible ad for “loyaltyradio” that just won’t shut up and go away. It keeps refreshing and turning on the sound.
SS number is not the only metric of solar activity
Dozens of peer-reviewed studies have found a very high degree of correlation (.5 to .8) between solar-magnetic activity and global temperature going back many thousands of years (Bond 2001, Neff 2001, Shaviv 2003, Usoskin 2005, and many others). In other words, solar activity “explains,” in the statistical sense, 50 to 80% of past temperature change. Far more then CO2
The high degree of correlation also suggests that solar activity is the primary driver of global temperature on every time scale studied (which is pretty much every time scale but the Milankovitch cycle).
Literally dozens of studies finding .5 to .8 degrees of correlation with temperature
Continuing man-made global warming fraud triggers a mass NASA rebellion. Rebels demand U.S. government pulls plug on the climate catastrophe cult. Dozens of top experts including astronauts and engineers trigger meltdown in American space agency.
http://johnosullivan.wordpress.com/2012/04/11/nasa-in-mass-revolt-over-global-warming-fraud/
Do I see a 1500 year cycle of CO2 levels or am I imagining it?
“Tucker says:
April 11, 2012 at 4:34 am
Leif,
I know you to be more intellectually honest than your post in this thread,”
_______________________________________________________________________________ I find it a bit hard to believe this is the real Leif.
That should have said 15000 year cycle.
Looking at your last figure, cosmic rays vs. temperature due to the sun’s position in the galaxy, it appears that temperature precedes cosmic ray number. That would invalidate the supposition that long-term temperature changes are caused by the sun’s orbit through the galaxy.
David A says:
April 11, 2012 at 7:10 am
Yes Sir, and solar activity, by any metric, stayed relatively high until recently. To expect instant changes in the long term massive residence time of the worlds ocean heat content, appears a little silly for one of Leifs qualifications. The burner on the large pot of water was set to medium, I turned it up to high for 20 seconds, then down to medium high for five minutes, gee the pot kept warming the entire time. The ocean is a very large pot indeed.
To repeat myself: how many of the studies cited incorporate a log? how long is the lag?
Here is solar activity the past 100 years: http://www.leif.org/research/Solar-Cycle-Average-SSN.png
Blue is average sunspot number, red is integrated SSN over the cycle. So, what is the lag?
TomT says:
April 11, 2012 at 7:40 am
I find it a bit hard to believe this is the real Leif.
It certainly is.
David A says:
April 11, 2012 at 7:23 am
SS number is not the only metric of solar activity
All the other ones correlate strongly with the sunspot number, so it does not really matter which one we use.
David A says:
April 11, 2012 at 7:23 am
Dozens of peer-reviewed studies have found a very high degree of correlation
How many peer-reviewed studies have found AGW?
Wow. I struggled through the article (as it is all a new thing for me to study), but I think I learned a lot. thanks. Silly question: “How much of this whole debate is politicized by our leaders?….for gain?”
Other_Andy says:
April 11, 2012 at 1:55 am
If the effect of cosmic rays is the main driver of global temperature changes as suggested, has anybody made any predictions for the next few years?
___________________________
Cosmic rays has been identified as ONE of the possible drivers. CERN Experiment Confirms Cosmic Rays Influence Cloud Seeds
There are others. See the article In defense of Milankovitch for a more recent take on the Milankovitch cycles.
And do not forget the oceans. For example: Global Warming as a Natural Response to Cloud Changes Associated with the Pacific Decadal Oscillation (PDO)
Or tectonic plates: A shift in the Caribbean tectonic plate joined North and South America… changed the flow of the ocean currents and caused the creation of the Gulf Stream.The Gulf Stream introduced warm and saline water masses to the north creating deepening of the thermocline. http://www-odp.tamu.edu/publications/202_SR/synth/synth_5.htm
I find it idiotic to think there is one “Control Knob” for the earth’s climate. Nothing in nature is that simple.
“How many peer-reviewed studies have found AGW?”
Follow the money.
Leif Svalgaard says:
April 11, 2012 at 12:19 am
Falsified? Sorry, no sale. The small amount of observed change even with what could be a strong driving force simply adds constraints to the rate of change. We should hope the Earth is not prone to wild swings, since that would make the survival of complex forms of life difficult. Extinction events would have been more common and more effective.
Leif Svalgaard says:
How many peer-reviewed studies have found AGW?
Leif, that is an excellent question! How many peer-reviewed studies (based on empirical data) have found AGW?
I’ve been searching for years and have yet to find more than a handful. Please educate us by providing a list of the articles that have convinced you. I for one would very much appreciate it. This is a serious request, no sarcasm intended.
wmconnoly: “CO2 is global”
So is H2O I assume. And Methane.
Why didn’t this paper use water vapor and methane proxies too?
CO2 is not the #1 or only GHG. And knowing that dry areas cool off quickly at night (deserts) and humid areas do not, Co2 is quite impotent.
Leif: “Here is solar activity the past 100 years:”
I’d be more interested in the area under the graph for each cycle graphed against temperature, not just the peak value.
Think of a pot of water on the stove. It may make no difference to the temperature to the water if the heat is set at 5 for 2 minutes versus 10 for 1 minute.
Interesting. Still another revision that adds warming. What is that now, 1476 warming adjustments to 2 cooling? (yes, those numbers are hyperbole). Even a true believer like you should start being suspicious of such a predominance of adjustments in one direction.
Guest post by Michael Pacnik
In general, does CO2 correlate with temperature in climate history? The answer is often yes on “medium” timescales, but no on “short” timescales and also no on the very longest timescales of all.
I think this question has no relevance on the way understanding a successful explanation of the physical processes of the solar heat system. Because of the minor heat of the nuclear oven in the Earth we have to look for the processes which include the heat modes of the Sun and can try to understand first the heat current floating from the warm Sun to the cold universe. We have long records which can tell about the global temperature level despised the local anomalies. It seems that this work never have been done, but it is an essential basis for the understanding the thermal processes of the solar heat system. Without these thermal calculations, which can verify the global temperature level, it is senseless to speculate on secondary effects like output of gas as a function of temperature.
If one do not agree with this plan, because he argues that a variation of the amount of gas isolate the heat from the Sun on Earth because of a thermal shielding effect of the gas, then it is clear, that prior to this, he has to explain – in the same way – which physical oscillation process with a main frequency of about 94300 years-1 generate the gas shield like a clock. But to my knowledge there are no papers available which argue on geometry of a saw tooth oscillator which such low stable frequency for a million of years.
Looking for such low frequency but also some special higher frequencies they can be connected ton the inner Sun geometry and physics and can be simulated:
http://www.volker-doormann.org/images/bentic_f_graph.gif
The minor anomalies of the last 5000 years also can be simulated by a solar tide function of a couple in the solar system:
http://www.volker-doormann.org/images/vo_m4k.gif
The records are witnesses of real heat currents from the Sun, if one agree with that there must be a heat source which is able to realize ~8K heat steps with relaxing times of +94300 years ending in ice ages.
Remark: If the idea of shielding only the Earth would has any relevance, the light magnitude of Neptune would not have the same profile as the Earth profil measured by hadcrut3.
http://www.volker-doormann.org/images/lockwood_neptune2.gif
It’s a gas:
Not more.
V.
Louis Hooffstetter says:
April 11, 2012 at 9:03 am
Please educate us by providing a list of the articles that have convinced you.
None of the articles on AGW or Solar control have been convincing, including some that I have published.
sunshinehours1 says:
April 11, 2012 at 9:29 am
I’d be more interested in the area under the graph for each cycle graphed against temperature, not just the peak value.
Perhaps you could look at the Figure. Its does not show peak values, but [blue] cycle averages and [red] integrated over each cycle [=area under the sunspot curve for each cycle].
Think of a pot of water on the stove
I wish you and everybody else would refrain from that old saw. Go through all the solar control papers cited and apply that thought to each of them and see how they hold up [then perhaps report back how many and what the lag is].
In addition how long time it takes the oceans to warm up is irrelevant to climate on the scale of decades or even a few centuries. Think of a mine or a cave. The temperature at depth is almost constant, because the slow diffusion of heat through the ground filters out daily, seasonal, and decadal changes and the temperature [if you are not too deep] will simply reflect the long-term average of the mean temperature at the surface. On much longer time scales, we can begin to see changes even underground, so there is information in the so-called ‘borehole’ data. Your argument is essentially that there are no decadal/century changes in climate because we don’t see them deep underground. You may have been snookered into believing that, but I have not.
Leif Svalgaard says:
April 11, 2012 at 10:07 am
sunshinehours1 says:
April 11, 2012 at 9:29 am
“I’d be more interested in the area under the graph for each cycle graphed against temperature, not just the peak value.”
Perhaps you could look at the Figure. Its does not show peak values, but [blue] cycle averages and [red] integrated over each cycle [=area under the sunspot curve for each cycle].
You can yourself add the temperature curve of your choice [or just in your mind’s eye]. I don’t see any correlation, at any reasonable lag. Perhaps a lag of 4713 years would improve the correlation if one could find the data.
beng says:
April 11, 2012 at 6:12 am
I agree – but the trouble is that there are several elephants and a multitude of kittens in the room (to use your phrase!).
When the relative scales of each of the forcings/feedbacks and interlinking of the eco/climate system are actually identifiable, instead of being guessed or ‘lumped’ together for model analysis, we may be able to actually isolate an anthropogenic signal and ’cause’ – but somehow, I doubt it.
If it goes much below 200 almost everything dies. There is nether a lead or lag. Seems that CO2 is in synch with production (and therefore, detritus generation, which gives the O2 dependent decomposers life).
Leif: “Your argument is essentially that there are no decadal/century changes in climate because we don’t see them deep underground. ”
That isn’t my argument at all. I do think teasing out solar effects is quite difficult when the amount of bright sunshine in places like the UK and Spain and others can change by very large amounts.
http://i40.tinypic.com/xgfyok.jpg
http://i51.tinypic.com/eb3pmb.jpg
http://sunshinehours.wordpress.com/2012/03/13/ebro-observatory-spain-and-bright-sunshine/
And the Albedo has changed.
http://i39.tinypic.com/34oc184.jpg
SteveSadlov says:
April 11, 2012 at 11:02 am
If it goes much below 200 almost everything dies….
_______________________
And that is the main point.
I just wish the CAGW fear mongers would get that through their thick heads. CO2 has been a lot higher in the past without runaway warming but if we go below 200 ppm most of the earth’s biosphere is DEAD.
CO2 concentrations are directly related to the amount and rate of ukariote metabalism. This is in turn directly realted to tempurature, at least over the ranges we care about. Soda fizz is only a part of the story.
I have been keeping and experimenting with extream bio-type aquariums for close to 30 years. I’ve built CO2 enhanced systems with the only source of CO2 being organic activity. The warmer the water, the more CO2. Fungus is a major player. Granted, this is still experimenting with modles, but at least my modles were more directly tied the the systems being modeled!
Gotta get back to work…
sunshinehours1 says:
April 11, 2012 at 11:32 am
Leif: “Your argument is essentially that there are no decadal/century changes in climate because we don’t see them deep underground. ”
That isn’t my argument at all.
I read your argument as invoking a lag as so many others [if you don’t then I don’t follow you]. But if you do [and for all the whiners about lags and glorious correlations, here is my version of the 5th figure of the current thread: http://www.leif.org/research/SSN-SST-Disconnect.png
I updated the graph to the present and overplotted the SST [grey curve] and SSN [green]. Any lag would be less than a solar cycle if you want to contend there is a strong correlation and the correlation simply breaks down after 1980 [see red rectangle: green curve goes down to where it was around 1900, grey curve continues up].
So, I ask why nobody commented on that Figure [small lag, breakdown after 1980]? Hide the increase, perhaps. Or confirmation bias: it showed what you want to believe. At least, I’m not that gullible.
BTW, the claim that the Sun is responsible for most of climate variation is one of the strongest weapons in the AGW crew’s arsenal [explains variations before SUVs] and the disconnect in 1980 is proof positive of AGW. I’m at a loss, why opponents of AGW are playing into the AGW hands by conceding to them that weapon. Especially since the effects are as shaky as AGW, go figure…
Leif Svalgaard said:
> All that solar/geomagnetic/cosmic ray stuff related to temperature
> is simply falsified by recent data: the sun is now as quiet as it was
> a century ago, geomagnetic activity and interplanetary magnetic
> fields are at record lows, cosmic rays at record high, and yet
> temperatures are much warmer now than a century ago.
Leif,
Look at the recent Shakun paper — the graph of CO2 vs. combined temperature proxies taken from sources other than the ice cores (which generated the CO2 data) shows global temperatures rising SEVERAL HUNDRED years after CO2 is seen to increase.
Setting all the problems with the paper aside, let’s assume the observations from the Shakun paper believable.
By your logic, you should also believe that the several hundred years delay that occurs before temperatures are seen to increase falsifies the presumption that CO2 was the cause of the temperature increase at the end of last Pleistocene glaciation. True?
Extending your logic, then looking into paleoclimate observations, temperature increases should be observed as simultaneous with all corresponding increases in atmospheric CO2. Any deviation in this correlation, either forwards or backwards in time, falsifies the link between CO2 and global temperature. Correct?
http://wattsupwiththat.com/2012/04/08/did-shakun-et-al-really-prove-that-co2-precede-late-glacial-warming-part-1/
Only one remark here: I do agree (this time) with William Connolley that the temperature proxy graph is for the NH only, which is more land based, while CO2 releases are mainly ocean based. That is the reason that the temperature/CO2 graphs from jigh altitude inland Antarctic ice cores do show a much better correlation.
The MWP-LIA difference of ~0.8°C is visible in the medium-resolution (40 years) Law Dome DSS ice core with a lag of ~50 years after the onset of the cooling:
http://www.ferdinand-engelbeen.be/klimaat/klim_img/law_dome_1000yr.jpg
That gives about the same 8 ppmv/°C change in CO2 levels after temperature changes as over the glacials/interglacials for the past 800 kyr.
Max Phillis says:
April 11, 2012 at 12:56 pm
falsifies the link between CO2 and global temperature.
I think I have said several times that IMHO neither CO2 nor the Sun is responsible for the observed climate changes, so what are you trying to say or imply?
A+ for consistency then.
This article is why I read WUWT.
Spotless sun today
http://www.landscheidt.info/?q=node/50
Excellent article, thanks for the Paleoclimate link.
Leif Svalgaard says:
April 11, 2012 at 12:53 pm
…and the disconnect in 1980 is proof positive of AGW…
The entirety of which is adjusted in. Unless you are talking satellite data, which is indeed turning down.
Leif Svalgaard says:
All that solar/geomagnetic/cosmic ray stuff related to temperature is simply falsified by recent data: the sun is now as quiet as it was a century ago, geomagnetic activity and interplanetary magnetic fields are at record lows, cosmic rays at record high, and yet temperatures are much warmer now than a century ago. This does not mean that the rise is man made, just that it is not solar made.
The important words here are “a century ago”. Our actual detailed measurements of things like cosmic rays are over a small time scale, they do not include the Dalton or Maunder minimum even, much less older minimums. However…there is considerable evidence that the next solar cycle (when it ever gets here) will be a true minimum, perhaps about equel to the Dalton. Then we should be able to tell if a truly quiet sun makes for significant cooling.
Basically, we have not seen a sun quiet enough to count as really quiet, the minor variations we have seen over the last 100 years are just that, minor. If the sun really does go named minimum style quiet in a few years, then and only then will we be able to tell what effectsa a true quiet sun has on climate.
Of course, that’s an if, I have seen predictions before of what people were sure the sun would do, so far, few have been true. The only recent prediction, however, was of a queiter sun when everyone else predicted a noisy one, which then predicted a true minimum (as different from the very minor variations of the last 100 years) in a few years.
The good news, if this prediction of a truely quiet sun come true, Leif will have something really new to observe.
Leif,
Having just finished solar cycle 23, isn’t it a little premature to use projections for cycles 24 and 25 as indications of a dramatic drop in sunspot activity? It hasn’t occurred yet, let alone had time enough for thermal lag effects to show any temperature response.
peterhodges says:
April 11, 2012 at 2:27 pm
Unless you are talking satellite data, which is indeed turning down.
Just the usual straw man. The satellite data is not turning down: http://www.drroyspencer.com/latest-global-temperatures/
Legatus says:
April 11, 2012 at 2:41 pm
The important words here are “a century ago”.
Sunspots, Geomagnetic activity, Magnetic fields on the sun, UV radiation have all been well measured over the entire last century. So, we cannot blame anything on ‘poor’ data. And there were several good [and physically valid] predictions of a low cycle 24 as far back as 2003.
bones says:
April 11, 2012 at 2:48 pm
Having just finished solar cycle 23, isn’t it a little premature to use projections for cycles 24 and 25 as indications of a dramatic drop in sunspot activity? It hasn’t occurred yet, let alone had time enough for thermal lag effects to show any temperature response.
We are nearing maximum of cycle 24 and experience shows that once we have 3-4 years of data at the beginning of a cycle, the rest of the cycle is pretty well determined. Cycle 25 will likely be small too, but that is not critical to the argument.
bones says:
April 11, 2012 at 2:48 pm
let alone had time enough for thermal lag effects to show any temperature response.
If you look t all the papers cited, they all show a time lag of less than one solar cycle, so time lags are not important as activity has been ebbing for decades.
Ignoring whether CO2 causes or contributes to warming out of a glacial phase, the first graphic clearly shows that during the cooling out of an interglacial, CO2 lags temperatures, and thus doesn’t prevent cooling.
Its obvious but the effect of CO2 should be the same irrespective of whether the climate is warming or cooling. If CO2 is the primary driver of the warming phase then what over-rides it to cause the cooling? Milankovitch Cycles shouldn’t be enough on a 100k year cycle.
Too many people have fallen into the warmenist trap. CO2 is not the only GHG.
What happens when you melt ice? More H2O in the atmosphere.
Why didn’t this paper use water vapor and methane proxies too?
CO2 is not the #1 or only GHG. And knowing that dry areas cool off quickly at night (deserts) and humid areas do not, Co2 is quite impotent.
“Wind-driven upwelling in the ocean around Antarctica helps regulate the exchange of carbon dioxide (CO2) between the deep sea and the atmosphere, as well as the supply of dissolved silicon to the euphotic zone of the Southern Ocean. Diatom productivity south of the Antarctic Polar Front and the subsequent burial of biogenic opal in underlying sediments are limited by this silicon supply. We show that opal burial rates, and thus upwelling, were enhanced during the termination of the last ice age in each sector of the Southern Ocean.
In the record with the greatest temporal resolution, we find evidence for two intervals of enhanced upwelling concurrent with the two intervals of rising atmospheric CO2 during deglaciation. These results directly link increased ventilation of deep water to the deglacial rise in atmospheric CO2.”
http://www.sciencemag.org/content/323/5920/1443.abstract
Leif Svalgaard says:
BTW, the claim that the Sun is responsible for most of climate variation is one of the strongest weapons in the AGW crew’s arsenal [explains variations before SUVs] and the disconnect in 1980 is proof positive of AGW. I’m at a loss, why opponents of AGW are playing into the AGW hands by conceding to them that weapon. Especially since the effects are as shaky as AGW, go figure…
Perhaps they are arguing it because they think it is true, rather than because it fits the “correct” message?
Nature is spectacularly good at ignoring what Man wants it to do.
Mooloo says:
April 11, 2012 at 6:16 pm
Nature is spectacularly good at ignoring what Man wants it to do.
And Man is spectacularly good at ignoring what Nature tells him.
Leif Svalgaard says: “…I think I have said several times that IMHO neither CO2 nor the Sun is responsible for the observed climate changes, …”
As painful as I find it to let go the hope Michael Pacnik inspires in this piece I will throw my lot in with Leif and his “humble opinion” expressed in the quote above.
The integrity Leif has demonstrated time and again on WUWT? demands it — but, sheesh, I do wish it was as straightforward as Michael’s piece seemed to show.
It certainly would be useless to try and use GISS temperature anomalies to find any correlation with solar activity. It would be in NASA’s interest not to publish temperature data that might correlate with solar activity.
Leif Svalgaard says:
April 11, 2012 at 12:19 am
All that solar/geomagnetic/cosmic ray stuff related to temperature is simply falsified by recent data: the sun is now as quiet as it was a century ago, geomagnetic activity and interplanetary magnetic fields are at record lows, cosmic rays at record high, and yet temperatures are much warmer now than a century ago. This does not mean that the rise is man made, just that it is not solar made.
This conclusion is a fallacy. If it is true that the named stuff is simply falsified by recent (your) data, this does not mean in general that the rise is not solar made, because an alternative or more alternatives could exist of solar functions which can be correlate with the rises and falls of the terrestrial global temperature.
And there is in fact a simple solar function which has a weak relation to the terrestrial temperature proxies. The sun spot frequency is increased if the related terrestrial global temperature frequency is increased and vice versa. : Because the outer Sun is a fluid, it is possible that forces along the solar longitude, per example tide forces can shift the frequency of the outer solar fluid in respect to the fixed oscillator in a non linear way. The average frequency of the sun spot oscillator is f = 1/11.196 y-1. There is a significant agreement about the phases and polarities of the frequency shifts:
http://www.volker-doormann.org/images/sun_shift_buent.gif
It is clear that the low frequency of the sun spots cannot exhibit possible higher temperature frequencies than the sun spot frequency, but as argued since two years, higher solar tide function frequencies than the sun spot frequencies shows strong correlations with terrestrial proxies.
http://www.volker-doormann.org/images/ghi_6_lockwood_1.gif
An other evidence of a connection between solar functions and the terrestrial climate is the relation of the solar neutrino rate to the global terrestrial SST:
http://www.volker-doormann.org/images/ghi_had_sno_ghi8_2.gif
I think the problem with the Svalgaard method is treefold: i.) There are always only (personal) claims what is NOT, ii.) valid arguments on relations of solar functions to terrestrial climate proxies are ignored, iii.) his method never have explained or answered the questions from the historic proxies of the physical heat/cooling processes of 8K pp or minor, but discredits alternative arguments which claims Sun functions are involved in the terrestrial climate.
This method is not a method of science. It is a method of power claimed as peer.
V.
*****
Kev-in-UK says:
April 11, 2012 at 10:21 am
I agree – but the trouble is that there are several elephants and a multitude of kittens in the room (to use your phrase!).
*****
Hi Kev. If there was a significant “mass” of kittens, that should disrupt/decrease the correlation between the Milankovitch cycles/rate of ice melting. The correlation between those is something like 96+%! It doesn’t look like the kittens are having much effect….
For those invoking time-lags, I disagree. The ocean mass is huge, but is mostly stratified — the cold water below is rather effectively isolated from the air. So only a thin layer of warm water at the top participates in the atmospheric coupling (areas of ocean upwelling are exceptions, but these are only a small percentage of the total ocean area). Leif linked to a paper some time ago that showed fairly convincingly that the time-constant for the surface was only a couple yrs for land & 10 yrs or so for areas above deep oceans. So I discount decades/centuries for “lag times” — if you’re on continental land, it’s just a matter of a few years!
Volker, your mechanistic climate-Solar correspondance appears to be cloudy. Care to be clear on what it is? Exactly? With maths? And models? With a bit of physical science thrown in perchance? And maybe narrowed down to just one of your suggestions? In classical debate, Leif wins this hands down. You, on the other hand, appear to be handwaving.
Volker Doormann says:
April 12, 2012 at 4:33 am
It is clear that the low frequency of the sun spots cannot exhibit possible higher temperature frequencies than the sun spot frequency, but as argued since two years, higher solar tide function frequencies than the sun spot frequencies shows strong correlations with terrestrial proxies.
without detracting from the entertainment value of your comments, it seems reasonable [at least to me] to discount claims based on the tidal influences of Quaoar and Pluto. There are perhaps hundreds of other dwarf planets out there [some bigger than Pluto], perhaps you could improve the correlation [if not now, then certainly in the future] by taking their effect into account…
“What is not considered is the fact that the North American Glacier was so massive that it created it’s own weather. The run off of ground water was one thing. However, as the temperature warmed and the Ice Sheet Melted, there was an equally incredible amount of water vapor being released into the atmosphere.
” In fact, an ice sheet of this scale would have probably made its own local weather. Sudden cooling of warm, moist masses of Gulf air encountering the cold ice sheet would have created torrential summer rains and near-constant “glacier-effect” snow in winter.” Indiana Geological Survey
The atmosphere became saturated with water vapor. There would have been an almost incessant fog and raining from this vapor. Torrential rain fell over the entire Mississippi Drainage area, including the Ice Sheet itself. As this warmer rain fell on the ice pack, the ice sheet began to dissolve at an astonishing rate.
(see map above) This created an incredible run off into the Mississippi Valley. Both the massive runoff and the atmospheric moisture kept the Mississippi flowing with astonishing power. The Ice Age Mississippi was much more massive than todays river.”
http://www.losthistorypublishing.com/Catastrophe.html
Atmospheric moisture? Hey, isn’t moisture a GHG?
Pamela Gray says:
April 12, 2012 at 6:22 am
Volker, your mechanistic climate-Solar correspondance appears to be cloudy. Care to be clear on what it is? Exactly? With maths? And models? With a bit of physical science thrown in perchance? And maybe narrowed down to just one of your suggestions? In classical debate, Leif wins this hands down. You, on the other hand, appear to be handwaving.
Hi Pamela,
I think you misunderstand the plot. First I’m a guest here in the room of Anthony, and so I think it is not the right place to write a long dissertation about my discovery. Second it needs only the standard knowledge of the science of astronomy to understand heliocentric synodic solar tide functions. Because of this it becomes clear that is a thing which can verified with astronomical knowledge. Especially the solar (heliocentric) tide function of the main couple of Pluto and Quaoar is relating to the highest temperature anomalies with a frequency of 1/913.5 y-1 . It is shown here in a number of graphs that the relation of spring tide functions to global warm times and vice versa the relation of nip tide functions to global cold times as the LIA is true over several 1000 years. The very point you may misunderstand is that it is not my duty to give a prove that the shown astronomic function is correct; it is the very duty of the members of the science community. This is to be understood, because it is the rule in science, claimed astronomic functions, which are suspect to the other to refute as wrong. Since this is not done, I think I must not discuss further on this matter.
For You. There is an important point on this matter which is ruled by the sciences of philosophy. It reads that the sciences of metaphysics like logic, geometry, maths are the basis of science. In this view physics is like a religion or a belief system. There are some great insights in physics like the sayings in thermodynamic, but a lot of ancient idols like space, time, causality, or velocity, which are claimed to be holy, still never has proves as physical observables. Near to me on my desk is a 966 pages book written by Isaac Newton and it is interesting what he tells about gravity and density. But I have found nothing about the fact, that the (measured) gravity is decreased while the moon eclipses the sun. The density of Quaoar is most high of the objects behind Neptune, and although the temperature of Quaoar is only ~ 50K (-223 °Cel) it must have eras given where the objects must heated up over ~150K because of the measured crystalline ice on it. The fits I have done to the magnitude of the several solar tide function from the different couples have its best matches taking the density of the objects involved into account. The simple point is Sir Newton’s inverse quadratic gravitation has nothing to do with these tide like magnitudes, and I have no time to fight a mind fight on it with ignorant’s and followers of Sir Newtons law, while the geometric facts are still facts.
The other simple point is, I have a valid tool (given to public) to calculate the global climate in month resolution from the solar tide functions for the whole next millennium, Leif has not.
V.
Leif Svalgaard says:
Legatus says:
April 11, 2012 at 2:41 pm
The important words here are “a century ago”.
Sunspots, Geomagnetic activity, Magnetic fields on the sun, UV radiation have all been well measured over the entire last century. So, we cannot blame anything on ‘poor’ data. And there were several good [and physically valid] predictions of a low cycle 24 as far back as 2003.
The important words are “over the entire last century”. The entire last century did not include the Dalton or Maunder minimums or any other actually recognized period of named minimums. Therefore, we have yet to measure during an actualy minimum.
It may be that, if predictions are true, we are about to enter into an actual, real minimum. Then we will have our first chance to see and actually measure what an actual minimum looks like, and observe what effects (if any) it has. The current record breaking quiet sun may have all it’s records broken and then some if an actual real minimum happens with the next cycle.
What I am saying is that belief that a quiet sun has little or no effect doesn’t mean much, science is not about belief, it is about observation. <b.If we have an actual, real minimum, then we will, for the very first time, be able to actually observe it. Until then, we are not really doing a science of minimums, since we have never actually seen one.
Legatus says:
April 12, 2012 at 1:11 pm
The important words are “over the entire last century”. The entire last century did not include the Dalton or Maunder minimums or any other actually recognized period of named minimums. Therefore, we have yet to measure during an actualy minimum.
No, you are a bit too formalistic here. We have geomagnetic data back to the 1740s, and good solar data covering the named Gleissberg minimum 1890-1920. Also, there is good evidence that at every minimum the Sun returns to the same state which we have observed many times. The real issue is not what happens a minimum, but what happens at maximum and we may see in the future a replay of the Maunder Minimum. The Dalton minimum was not deep enough to be of interest.
Volker Doormann says:
April 12, 2012 at 10:49 am
I have a valid tool (given to public) to calculate the global climate in month resolution from the solar tide functions for the whole next millennium, Leif has not.
To put it mildly, I think you are deceiving yourself. Luckily, that may be the only one you can deceive.
Leif Svalgaard says:
April 11, 2012 at 3:32 pm
Just the usual straw man. The satellite data is not turning down: http://www.drroyspencer.com/latest-global-temperatures/
Well that was only half my argument. I see you one UHCSN adjustments, and raise you two RSS 😉
http://www.ncdc.noaa.gov/img/climate/research/ushcn/ts.ushcn_anom25_diffs_urb-raw_t.gif
ftp://ftp.ssmi.com/msu/graphics/tls/plots/rss_ts_channel_tls_global_land_and_sea_v03_3.png
ftp://ftp.ssmi.com/msu/graphics/tts/plots/rss_ts_channel_tts_global_land_and_sea_v03_3.png
Some people seem to have hoped this article would demonstrate absolutely all effects whatsoever of human activity could be ruled out, down to the tiny slice of climate fluctuations which is looking at tenths and hundredths of a degree in the past 2 or 3 decades (although what is seen is an astronomical contrast to the “public education” of the global warming alarmism movement which really tries to make the public think most climate history in the 20th century and far beyond was driven by CO2 primarily).
Such would not happen. Even this article, if you read it fully and closely, has remarks like “in marked contrast to reconstructions based on sunspot number [Solanki and Fligger, 1998 in which the irradiance and the temperature are not correlated after 1978” … as well as “everything from ozone change to volcanoes, human activities, and ocean cycles has a non-zero effect on climate.” Moreover, the heavily referenced cosmic ray theorist Professor Nir J. Shaviv of sciencebits.com in his papers does not argue that human emissions have 0.00 degrees effect but rather that they have had a small fraction of a degree Celsius effect.
In fact, for on the order of a degree Celsius or less temperature rise (aside from when overwhelmed by other factors) to occur from hypothetical future doubling of CO2 compared to pre-industrial levels matches the estimates of most of the very top skeptic scientists including Roy Spencer (google Spencer Global Warming 101) and Richard Lindzen. That reduces the warming from it to being minor and less than the Holocene Climate Optimum, a period warmer than now which the polar bears survived fine and which was beneficial to mankind, when warmth in near-arctic northern hemisphere regions increased vegetation as we can see in the fossil record.
A while back, someone posted somewhere on this website a graph of carbon-14 versus temperature in the years preceding and then up to the Maunder Minimum. I recall looking at it and noticing how there were essentially two lags, each of several years. There were three stages IIRC:
1) First, the final semi-regular solar cycle must peak.
2) Secondly, after several subsequent years of greater decline in solar activity, there is relatively extreme cumulative ramp-up in cosmic rays as seen in carbon-14 levels.
3) Thirdly, only then is there the really major temperature decline, after *another* several years lag.
Even assuming the predictions of a second Maunder Minimum coming soon (finally the end of the current Modern Maximum) turn out to be correctly (which they probably will), we are not in a Maunder Minimum yet. In fact, right now, solar activity is increasing at the moment as the current cycle 24 has not peaked quite yet. Anyway, if so, you can expect the doom of the global warming movement roughly around a decade from now, once really major temperature decline appears, too much to hide from the public even with data fudging, at which nobody will be get away as well with how their climate models implicitly treat cosmic rays as 0% effect by neglecting them entirely (an omitted variable fallacy). According to the estimates of Shaviv, during the Modern Maximum, the solar effect with cosmic rays included was around triple that of looking at TSI change alone, which fits observed results.
We can not predict the weather reliably so don’t expect anything about a single year or couple years at a time. I have never seen anybody utterly properly account for everything from cosmic rays to El Ninos all at once. Probably that is because it would take hundreds to thousands of pages to discuss, plus a huge number of manhours. Those with enough funding are environmentalists hardly inclined to do so, while skeptic scientists don’t have that level of funding and work more individually.
In fact, most skeptics seem to focus either on ocean cycles (like the AMO and PDO) or on solar activity / cosmic rays but not both at once. The fascinating question of how exactly they superimpose and relate is underanswered yet.
Personally, I periodically like to look at Spencer’s graph of UAH satellite temperatures:
http://www.drroyspencer.com/wp-content/uploads/UAH_LT_1979_thru_March_2012.png
Right now, the curved black line which is the purely-unofficial overall curve fit is just starting to curve down. Later this decade is when we should start to see true global cooling. In the next decade, it may become so blatant even to the public in direct consequences that the global warming enviropolitical movement collapses by some time in the 2020s. A second Little Ice Age doesn’t develop overnight.
peterhodges says:
April 12, 2012 at 4:40 pm
Well that was only half my argument.
There is a long way to go before we are down to 1900s level and so far you are just playing the adjustment game. I’ll still go with http://www.drroyspencer.com/wp-content/uploads/UAH_LT_1979_thru_March_2012.png where the thin black curve has no predictive value [for Henry Clark] according to Roy Spencer “The 3rd order polynomial fit to the data (courtesy of Excel) is for entertainment purposes only, and should not be construed as having any predictive value whatsoever”.
peterhodges says:
April 12, 2012 at 4:40 pm
Well that was only half my argument.
To present the whole of your argument you could overplot the satellite record you prefer on http://www.leif.org/research/SSN-SST-Disconnect.png
then let’s see.
Leif Svalgaard: Like I said, the “purely-unofficial overall curve fit.” I have read that remark before on the curve fit. Dr. Spencer is keeping himself legally or otherwise covered, and I don’t blame him. Anyway, just watch temperatures in the UAH data over rest of this decade and beyond; if they decline much after this solar cycle 24 peaks followed by the two several-year lags combined, the averaged-out curve line on top of the short-term temperature readings won’t even be needed to see what happens.
sunshinehours1 says:
April 11, 2012 at 4:27 pm
Too many people have fallen into the warmenist trap. CO2 is not the only GHG.
What happens when you melt ice? More H2O in the atmosphere.
Why didn’t this paper use water vapor and methane proxies too?
CO2 is not the #1 or only GHG. And knowing that dry areas cool off quickly at night (deserts) and humid areas do not, Co2 is quite impotent.
_____________________________
Why didn’t this paper use water vapor and methane proxies too? That is easy. CO2 is the byproduct of energy generation unless you use nuclear. Therefore you want to target CO2 not methane or water if you want to grab control of the world economy.
It is no coincidence that in 1970 Kissinger said “Who controls the energy controls nations, who controls the food supply controls the people, who controls money controls the world.” and in 1972 Maurice Strong chaired the First Earth Summit and the began the global warming craze.
Nothing but a political motive can explain the consistent refusal by government funded scientists to entertain anything by a minute amount of a trace gas as THE CONTROL KNOB of the climate.
Henry Clark says:
April 12, 2012 at 5:38 pm
Anyway, just watch temperatures in the UAH data over rest of this decade and beyond; if they decline much after this solar cycle 24 peaks followed by the two several-year lags combined, the averaged-out curve line on top of the short-term temperature readings won’t even be needed to see what happens.
It has a long way to drop to get down to the 1900s level. And you miss my point: The evidence NOW is what we have to judge, not what we think, hope, or wish it will be beyond this decade. If the temperature in the 2030s drop to the level of the 1900s, then I might revise my opinion [if still alive by then], but for now the ‘evidence’ is not convincing.
Leif Svalgaard says:
April 12, 2012 at 5:51pm
“The evidence NOW is what we have to judge, not what we think, hope, or wish it will be beyond this decade. If the temperature in the 2030s drop to the level of the 1900s, then I might revise my opinion [if still alive by then], but for now the ‘evidence’ is not convincing.”
But convincing of what exactly? As noted in the first of my two recent comments, Nir J. Shaviv’s research is not that variation in cosmic rays accounts for 100.0% of past climate fluctuations but rather that it plus solar irradiance variation has around 3 times the effect of solar TSI variation alone, multiple times more than IPCC models which implicitly treat GCRs as 0% effect.
He has never claimed that El Ninos, Milankovitch cycles, anthropogenic GHGs, and much else have not existed or have not had effects on climate too.
Your argument in comments about sunspot number and temperature divergence corresponds to the article’s quote of “reconstructions based on sunspot number [Solanki and Fligger, 1998 in which the irradiance and the temperature are not correlated after 1978.”
The effect of incorporating the cosmic ray theory into analysis of a wide range of timeframes up to hundreds of millions of years back is illustrated on Nir J. Shaviv’s site at http://www.sciencebits.com/OnClimateSensitivity
John Kehr made a good post destroying the paper:
Flagrant Attempt to Mislead the Public about the Holocene Onset
http://theinconvenientskeptic.com/2012/04/flagrant-attempt-to-mislead-the-public-about-the-holocene-onset/
Henry Clark says:
April 12, 2012 at 6:21 pm
But convincing of what exactly? As noted in the first of my two recent comments, Nir J. Shaviv’s research is not that variation in cosmic rays accounts for 100.0% of past climate fluctuations but rather that it plus solar irradiance variation has around 3 times the effect of solar TSI variation alone, multiple times more than IPCC models which implicitly treat GCRs as 0% effect.
If the solar variations cannot explain climate the past 200 years [or the past 30 years] I doubt that we have the ability to do that for millions of years past. TSI is only known back to 1978 so I’m not so sure that the ‘finding’ you cite is solid. The TSI we know of has a solar cycle effect of 0.07 degrees and is cyclic with no trend, so 3 times that is 0.2C cyclic with no trend. Is that what you are claiming?
Cosmic rays, galactic and otherwise, not only form condensation nuclei; they convert nitrogen to 14C. Enough of this and you get a heavy greenhouse gas with a half-life of, I forget,5000 years?
Anyway this stuff reverts back to nitrogen leaving no trace because the critters prefer 12C.
The Spiral Arm cycle is the precession of the eliptic, the orbital cycle Milankovitch was unaware of.
The dates change all the time, but the Sturtian glacial period was about 710mya, the Marinoan about 635mya, the Ordovician about 450mya, the Carbo-Permian about 300mya, and the Pleistocene about 2mya. Small statistical sample, but no apparent beat. The Pleistocene thus far (I do not recognize the Holocene or the Anthropocene) has not bottomed as low as the Paleozoic glaciations.
Who is Michael Pacnik? What is his area of expertise?
gymnosperm says:
April 12, 2012 at 11:19 pm
Cosmic rays, galactic and otherwise, not only form condensation nuclei; they convert nitrogen to 14C. Enough of this and you get a heavy greenhouse gas with a half-life of, I forget,5000 years?
The total global production of 14C is 17 pounds per year.
The reasons for a lack of correlation with CO2 are explained in my paper, so it is perhaps relevant to summarise some of the main points in the paper, and add further explanation, such as that regarding microwave ovens. This should answer questions raised above. However, any who advocate that all radiation causes a transfer of thermal energy regardless of the temperatures of the source and target, or that there is some entity representing “net” radiation are asked to read the paper for my response.
Of course radiation can go in all directions. It does so in a microwave oven, but not everything gets warmed in the oven by normal atomic absorption. In fact there is absolutely no atomic absorption involving changes in electron energy states. Instead, liquid water molecules in the food are quickly rotated (flipped or “snapped”) through 180 degrees twice with each passing wave of radiation. It is molecular friction which warms the water, not atomic absorption such as happens in the Sun. The molecules in ice are too close to rotate, so ice is not melted this way. (See experiment in an earlier post above.) The defrost cycle turns power on and off in order to allow time for heat conduction from water to ice. The oven demonstrates that low frequency radiation does not act like high frequency radiation, even if the intensity (flux) is greater.
This is because of the main hypothesis in the paper that radiated energy from a source which is cooler than a target is not absorbed and converted to thermal energy by such changes in electron energy states at the atomic level. If the radiation from such a source is spontaneous, then the peak frequency in its Planck curve is proportional to its absolute temperature by Wien’s Displacement Law. If thermal energy were transferred from such a cooler source to a warmer target then that process, if independent, would violate the Second Law of Thermodynamics (SLoT.) There are several pages in the paper explaining why this is the case, so I ask you to read Sections 1 to 5 in this regard.
Radiated energy is not thermal energy. It has to be converted to thermal energy, and that only happens if the source of the radiation was warmer than the target. Some or all of the radiation can and will resonate with the target. When this happens it supplies energy to the target, yes, but the energy is used by the target to do some of its own radiating. It can use it because it is identical in frequency to what it can emit itself. And this happens because the Planck curve for a cooler body is always fully contained within that for a warmer body. So the two-way radiation which corresponds to the area under the Planck curve for the cooler body just resonates in each body and gives it energy that can only be used for new radiation. Because the new radiation is identical, it looks as if the original radiation has been scattered. Hence the term “pseudo scattering” or, as I call it in my paper, “resonant scattering.”
So the process is not in any way violating the Second Law of Thermodynamics (SLoT) because the radiated energy is never converted to thermal energy. However, there is additional radiation in the warmer body which corresponds to the area between the Planck curves. This is the energy which does get converted to thermal energy in a cooler target. And, since S-B calculations are based on the integrals of Planck functions, the normal calculations (subtracting the two S-B values which represent areas under the large and small curve) still apply, because the difference is the area between the curves.
So you may think of radiation being scattered each time it strikes a target, but only “dropping off” some of its thermal energy when it meets a cooler target. The new radiation then continues just as if emitted by that target, so more thermal energy is only dropped off iff the next target is cooler than the last one.
Because the incident radiation supplied radiated energy to the cooler target, that target does not have to convert some of its own thermal energy in order to radiate what it is “allowed” to radiate as per the Planck function. Hence the target’s rate of radiative cooling will be slower, as we observe. So, yes, a wooden table in your back yard may stop dew forming on the ground below it because the table is warmer than the atmosphere and thus slows the cooling more. This is because gases in the atmosphere are cooler, and also because ones like carbon dioxide don’t radiate with a full Planck spectrum. Instead they just have a few spectral lines of radiation which can resonate with the surface. So carbon dioxide is like a picket fence with most of its pickets missing, standing up against a full flood of radiation from the surface. Even water vapour molecules can do much better when it comes to slowing radiative cooling of the surface.
Whilst the calculations are the same, there are huge differences in the physical consequences. These are explained in the FAQ’s in Appendix Q.7 of my paper. Because there is no conversion to thermal energy, there can be no subsequent heat transfer to other bodies instead of radiation. Hence, in the case of radiation from a cooler atmosphere, there can be no effect upon the rates of cooling by evaporation, conduction and other sensible heat transfer mechanisms. Nor is there any slowing of the radiation that gets through the atmospheric window to space. So only about a quarter of all the surface cooling is affected, and only by a minuscule amount by carbon dioxide with its limited range of frequencies.
Now, the temperature of the surface is stabilised by both the underground temperatures and, more importantly, the amount of solar radiation reaching the surface. The temperature gradient in the atmosphere is governed by the adiabatic lapse rate, and that in turn is controlled by the force of gravity. So, if that gradient is represented by a simple linear equation y = mx + b then m is fixed by gravity and b is controlled by solar insolation which only varies a little beyond our control. Thus surface climate is beyond our control and any slowing of the radiative cooling is simply compensated by an increase in sensible heat transfer.
So there is no overall slowing of the rate of surface cooling, no transfer of thermal energy from the atmosphere back to the surface, and so no greenhouse effect.
Leif Svalgaard:
April 12, 2012 at 8:58 pm
“If the solar variations cannot explain climate the past 200 years [or the past 30 years] I doubt that we have the ability to do that for millions of years past. TSI is only known back to 1978 so I’m not so sure that the ‘finding’ you cite is solid. The TSI we know of has a solar cycle effect of 0.07 degrees and is cyclic with no trend, so 3 times that is 0.2C cyclic with no trend. Is that what you are claiming?”
If an expectation was for a single factor to “explain” past climate in terms of account for 100.0% of its variation, climate would never, ever, ever be explained because no single factor is the only influence. Correlation as a major influence, though, extends up to, for example, that seen in Bond et al. 2001 ( one.geol.umd.edu/www/preprints/Bond_et_al.pdf ). Referring to periodic cold periods like the Little Ice Age but over a lengthier timespan than looking at the past several centuries alone, they note “our correlations are evidence, therefore, that over the last 12,000 years virtually every centennial time scale increase in drift ice documented in our North Atlantic records was tied to a distinct interval of variable and, overall, reduced solar output.”
They do not guess such is from cosmic rays in part in particular, unsurprising for multiple reasons including how its 2001 publication predates recent cosmoclimatology publications, but, as much as there are some who want to pretend the LIA correlation with solar activity was mere coincidence (like the recent paper for the purpose currently discussed on WUWT), the LIA was far from the only cold event in the Holocene with similar correlation.
Such as the Indian ocean graph in the article we are commenting on is far too much correlation to plausibly be coincidence.
Regarding trends or not, there are more than individual short solar cycles, beyond a typically ~ 11 year cycle. For instance, as Solanki et al. 2004 note:
“According to our reconstruction, the level of solar activity during the past 70 years is exceptional, and the previous period of equally high activity occurred more than 8,000 years ago.”
cc.oulu.fi/~usoskin/personal/nature02995.pdf
Of course, 8000 years ago was in the Holocene Climate Optimum, a warm period like this “does CO2 correlate with temperature history” article mentions including the link to http://www.esd.ornl.gov/projects/qen/nerc.html where the ORNL research in turn notes that “by 8,000 14C y.a., the Earth was under a full interglacial climate, with conditions warmer and moister than present in many parts of the world.”
Not particularly surprisingly for an article managing to get past the gatekeepers at the Nature journal, the Solanki et al. 2004 paper references another paper which said solar variation could not account for post-1970 warming, but, among other aspects of note (1) solar variation is not responsible for 100% of climate variation as I have always emphasized in these comments; the likes of the PDO, AMO, even GHGs, and other influences also exist (2) the particular figure was based on comparison to CRU temperature data, so its upper limit estimate on the effect of solar variation would indirectly not be a valid upper limit from my perspective. Those are not the only 2 things which could be noted, but they are part.
The amount of fraud going on with CRU temperature data, such as “adjustments” consistently predominantly the opposite direction of what any proper correction for urban heat island effects would constitute, is a whole giant other topic but familiar to some readers of Watts Up With That. (CRU was even infamous from Climategate). CRU temperature data has partial resemblance to reality, but enough skewing in quantitative terms to screw up an exact calculation.
captain pithart said:
April 13, 2012 at 1:20am
Who is Michael Pacnik? What is his area of expertise?
I don’t think that is said. But, in any case, the majority of what is said in the article comes from or relates to that at the sciencebits.com site (which is by Dr. Nir J. Shaviv, not the author of this article but author of that site). For checking references, the GISP 2 data is online at
ftp://ftp.ncdc.noaa.gov/pub/data/paleo/icecore/greenland/summit/gisp2/isotopes/gisp2_temp_accum_alley2000.txt
(Hopefully this is not a duplicate comment submission … connection issue briefly)
Leif Svalgaard said:
April 12, 2012 at 8:58 pm
“If the solar variations cannot explain climate the past 200 years [or the past 30 years] I doubt that we have the ability to do that for millions of years past. TSI is only known back to 1978 so I’m not so sure that the ‘finding’ you cite is solid. The TSI we know of has a solar cycle effect of 0.07 degrees and is cyclic with no trend, so 3 times that is 0.2C cyclic with no trend. Is that what you are claiming?”
If an expectation was for a single factor to “explain” past climate in terms of account for 100.0% of its variation, climate would never, ever, ever be explained because no single factor is the only influence. Correlation as a major influence, though, extends up to, for example, that seen in Bond et al. 2001 ( one.geol.umd.edu/www/preprints/Bond_et_al.pdf ). Referring to periodic cold periods like the Little Ice Age but over a lengthier timespan than looking at the past several centuries alone, they note “our correlations are evidence, therefore, that over the last 12,000 years virtually every centennial time scale increase in drift ice documented in our North Atlantic records was tied to a distinct interval of variable and, overall, reduced solar output.”
They do not guess such is from cosmic rays in part in particular, unsurprising for multiple reasons including how its 2001 publication predates recent cosmoclimatology publications, but, as much as there are some who want to pretend the LIA correlation with solar activity was mere coincidence (like the recent paper for the purpose currently discussed on WUWT), the LIA was far from the only cold event in the Holocene with similar correlation.
Such as the Indian ocean graph in the article we are commenting on is far too much correlation to plausibly be coincidence.
Regarding trends or not, there are more than individual short solar cycles, beyond a typically ~ 11 year cycle. For instance, as Solanki et al. 2004 note:
“According to our reconstruction, the level of solar activity during the past 70 years is exceptional, and the previous period of equally high activity occurred more than 8,000 years ago.”
cc.oulu.fi/~usoskin/personal/nature02995.pdf
Of course, 8000 years ago was in the Holocene Climate Optimum, a warm period like this “does CO2 correlate with temperature history” article mentions including the link to http://www.esd.ornl.gov/projects/qen/nerc.html where the ORNL research in turn notes that “by 8,000 14C y.a., the Earth was under a full interglacial climate, with conditions warmer and moister than present in many parts of the world.”
Not particularly surprisingly for an article managing to get past the gatekeepers at the Nature journal, the Solanki et al. 2004 paper references another paper which said solar variation could not account for post-1970 warming, but, among other aspects of note (1) solar variation is not responsible for 100% of climate variation as I have always emphasized in these comments; the likes of the PDO, AMO, even GHGs, and other influences also exist (2) such was based on comparison to CRU temperature data, so its upper limit estimate on the effect of solar variation would indirectly not be valid upper limit from my perspective.
The amount of non-accidental inaccuracy going on with CRU temperature data, such as “adjustments” consistently predominantly the opposite direction of what any proper correction for urban heat island effects would constitute, is a whole giant other topic but familiar to some readers of Watts Up With That. (CRU was even famous or infamous from climategate). CRU temperature data has partial resemblance to reality, but enough skewing to screw up an exact calculation.
Leif Svalgaard says:
April 12, 2012 at 5:04 pm
There is a long way to go before we are down to 1900s level and so far you are just playing the adjustment game.
Well it is nearly impossible to see where we would be without all the adjusting, value adding, and homogenizing. A look at
Raw data from individual sites can be revealing. At a minimum, warming trends dissapear and the present looks cooler than the first half of the last century.
I will agree with you that ultimately, we don’t really know where things are going, only what we have now.
But I will have to admit to a coolist prejudice…I did have to shovel out this morning and drive to work in a white out 😉
Henry Clark, you might like to look at this research by Richard Feynman’s sister: NASA Finds Sun-Climate Connection in Old Nile Records It looks at ancient Nile and auroral records.
http://www.woodfortrees.org/plot/rss/from:2002/plot/rss/from:2002/trend
Even the jury-rigged hadcrut etc show cooling. Will it continue? I guess we’ll see…
Henry Clark says:
April 13, 2012 at 8:43 am
Regarding trends or not, there are more than individual short solar cycles, beyond a typically ~ 11 year cycle. For instance, as Solanki et al. 2004 note:
“According to our reconstruction, the level of solar activity during the past 70 years is exceptional, and the previous period of equally high activity occurred more than 8,000 years ago.”
I’m not trying to convince you of anything. Experience shows that in the game it is impossible to overthrow entrenched dogmas by rational arguments or reliable data. I was bringing forward the reasons why I am not convinced by the multitude of claims [Hoyt and Schatten list ~2000 papers proving sun-weather-climate correlations]. Take for example the one you refer to by Solanky. There is ongoing research giving good reasons why that claim does not hold. I refer to some of that here: http://www.leif.org/research/The%20long-term%20variation%20of%20solar%20activity.pdf
Next month the researchers active in this field are holding a workshop in Switzerland to discuss this problem [to ‘settle’ the science if we can]: http://www.leif.org/research/Svalgaard_ISSI_Proposal_Base.pdf so more on this a bit later.
(1) solar variation is not responsible for 100% of climate variation as I have always emphasized in these comments
The 100% is a bit of a straw man. some people would say 90% or 70%. That would satisfy your criterion, but there is no real difference between 100% and 70%. I would go along with 10% for solar and 10% for CO2.
Gail Combs said:
April 13, 2012 at 10:45 am
“Henry Clark, you might like to look at this research by Richard Feynman’s sister: NASA Finds Sun-Climate Connection in Old Nile Records It looks at ancient Nile and auroral records.”
Indeed that is a good example. (I did not know before now that Feynman had a sister, but, looking up the name, I see you are right).
Leif Svalgaard says:
No, you are a bit too formalistic here. We have geomagnetic data back to the 1740s, and good solar data covering the named Gleissberg minimum 1890-1920. Also, there is good evidence that at every minimum the Sun returns to the same state which we have observed many times. The real issue is not what happens a minimum, but what happens at maximum and we may see in the future a replay of the Maunder Minimum. The Dalton minimum was not deep enough to be of interest.
One thing, when I was talking about minimum, I was talking about named minimums such as the Maunder, I was not talking about the maximums and minimums we have observed many times in solar cycles. I would agree that with those “minimums” and “maximums”, it is the strength (if you can call it that) of the maximum that is what may, or may not, effect things like whether we have a little ice age or not.
If the Dalton Minimum (capitalizing to separate it out from solar cycle minimums and maximums) was not deep enough to be of interest, then the Gleissberg Minimum may not be either. The prediction of another (named) Minimum is that it will be about the strength of the Dalton, but longer. This may mean that we will not go into another little ice age, more like a little frost age, if the Dalton was not strong enough to effect weather. The predictions (which have been known to be wrong) also say that sun spots will fade by 2015, which would definitely effect the maximum (not capitalized because I am talking about a solar cycle maximum here).
We do, however, have a problem here. There was definitely a Little Ice Age, and it was definitely cold, and cold world wide. Something caused it. The latest posts here strongly suggest that it was not vulcanism (Willis pretty much shot down that idea in flames). So what does that leave? The most likely place to look for a lack of heat is, of course, the sun, since that’s where the heat comes from (News Flash, sun produces Global warming!). If not the sun, then what? It appears to go from warm to cold periods approximately every 500 years or so. Something must cause that. It could be cycles of things like ocean currents or some such, however, without a time machine handy, it is rather hard to say if the last little ice age even was from that, much less ones before that. There is, however, evidence of this here Maunder Minimum, which points to the sun, which makes it the most likely culprit. We at least should follow up on that to see if it might be true. One possible way, IF we go into a Named Minimum type solar change with the next cycles maximum (and it is “deep enough to count”), we may then be able to tell if such a Minimum can change weather, and if so, how much.
Also, the suggested ways that the sun may change weather, increased cosmic rays due to lower solar wind, and/or changes in UV radiation, are not things I believe have been measured until extremely recently. Since those are the things I am chiefly looking at, and they were not measured during, say, the Gleissgerg Minimum, that is why I am interested to see what those measurements are IF the prediction holds true and we go into an actual Minimum in the next cycle here (assuming that either of those actually do anything to weather). Unless proven proxies can show what the solar wind speed was, say, during the Maunder Minimum, then we will just have to wait for another Minimum and see what happens then.
Of course, it is always possible that little ice ages happen because of something we don’t know about yet. Maybe every 1000 years or so the earth passes through an area of the galaxy with higher than normal cosmic rays, strong enough to not care what the sun is doing (or not doing). However, for right now, the sun seems the most likely culprit. The only way to tell for sure is to wait for a Named Minimum type event (deep enough to be of interest) , which may mean only waiting till the next non maximum in the next solar cycle. However, that could still be years off.
I hate waiting…http://www.youtube.com/watch?v=y0Y7ScfaVHs
Lief said: I would go along with 10% for solar and 10% for CO2.
This is exactly the problem. Something was big enough to cause a full blown Little Ice Age. If what you say is true, we have a problem, something is causing the change and we don’t know what it is. If the above is true, and the sun only causes 10% of it, what is the other 90%? 90% is pretty big, you would think we could find something that big. The sun is, well, big.
Currently, the sun looks like the most likely guilty party, so we need to at least investigate the sun. We may not be ready to make an arrest yet, but we should at least gather some more clues. I mean, we got this here crime, somebody had to have done it!
Leif Svalgaard said:
April 13, 2012 at 5:32 pm
I’m not trying to convince you of anything. Experience shows that in the game it is impossible to overthrow entrenched dogmas by rational arguments or reliable data. I was bringing forward the reasons why I am not convinced by the multitude of claims [Hoyt and Schatten list ~2000 papers proving sun-weather-climate correlations]. Take for example the one you refer to by Solanky. There is ongoing research giving good reasons why that claim does not hold. I refer to some of that here: http://www.leif.org/research/The%20long-term%20variation%20of%20solar%20activity.pdf
Partially setting aside for the moment whether one trusts different Be-10 reconstructions and separate from the direct topic of sunspot number estimates, there is an indirect aspect to the matter. Indirectly, part of the matter comes down to how current temperatures compare to those in prior eras.
If current temperatures were utterly unprecedented compared to past history, a particularly high magnitude of late-20th-century solar activity would be required for solar activity to be much of a contributor.
But current temperatures are not really extreme. Here is a graph of temperature history … actually NSF (National Science Foundation), yet more honest than the hockey stick:
http://www.nsf.gov/news/mmg/media/images/monsoon1_h.jpg
Recent “global warming” has been relatively little outside of the upper northern hemisphere, outside of the Arctic. For instance, in the following for satellite data by zone for 1979-2012, there is roughly on the order of maybe 0.1 degrees Celsius meaningful temperature rise over that period beyond the oscillations in the tropics, as can be seen looking at the graph:
http://climate4you.com/images/MSU%20UAH%20TropicsAndExtratropicsMonthlyTempSince1979%20With37monthRunningAverage.gif
In contrast, for the Arctic, the following plot of a 5-year average went up by roughly around 0.7 degrees Celsius over the 1979-2000 period as can be seen:
http://upload.wikimedia.org/wikipedia/commons/5/53/NASAarctic_temp_trends_rt.jpg
corresponding to
http://earthobservatory.nasa.gov/Features/ArcticIce/Images/arctic_temp_trends_rt.gif
Yet the prior graphs also show how arctic temperature in the late 1930s was higher than it was in the late 20th century. Especially as ideological polarization continues to self-reinforce and skeptical “deniers” get more fully deterred from even being inclined to try entering the field as a career, there may be additional historical revisionism gradually revising until such is no longer so in future versions of graphing the same period, hockey stick style. However, whether in an act of subtle rebellion or otherwise, someone at NASA did post the preceding graph to their official server as can be seen.
Thus, for instance, solar activity does not even need to be far higher in recent decades than before for temperatures to have no inconsistency with solar activity being a major influence on them (not sole but major).
Leif Svalgaard said:
April 13, 2012 at 5:32 pm
I would go along with 10% for solar and 10% for CO2.
As might be guessed, I can’t agree with the 10% figure.
Out of curiosity, though, how is your other 80% divided?
Personally I think some part is from ocean cycles, partially, but not lengthy events like the LIA vs the MWP vs the Holocene Climate Optimum (and others).
Leif Svalgaard:
In my last comment, which will probably appear simultaneously with this one, there was a typo or carelessness where I said “current temperatures” when referencing the NSF graph which doesn’t extend past most of the way through the 20th century. However, other graphs referenced in my comment show more recently.
Legatus says:
April 13, 2012 at 7:00 pm
If the above is true, and the sun only causes 10% of it, what is the other 90%? 90% is pretty big, you would think we could find something that big. The sun is, well, big.
And just because of that, it is not easy to change the sun. It is amazing that people who cannot accept that the climate system has internal cycles gladly assume that the sun has.
Henry Clark says:
April 13, 2012 at 8:48 pm
As might be guessed, I can’t agree with the 10% figure.
10% is in the noise and so cannot be falsified nor confirmed. Theoretically, known variability of TSI must cause a 0.07C variation which is consistent with a 10% effect.
Out of curiosity, though, how is your other 80% divided?
Not divided, just internal climate variability.
Henry Clark says:
April 13, 2012 at 8:48 pm
But current temperatures are not really extreme. Here is a graph of temperature history … actually NSF (National Science Foundation), yet more honest than the hockey stick:
http://www.nsf.gov/news/mmg/media/images/monsoon1_h.jpg
By the same token, the LIA temperatures were not really extreme either [Legatus take note].
Leif Svalgaard said:
April 13, 2012 at 10:21 pm
Theoretically, known variability of TSI must cause a 0.07C variation which is consistent with a 10% effect.
But then you would be getting that 10% figure from implicitly assuming more or less 0% effect from cosmic rays, since then you are implicitly assuming only TSI counts.
That’s what the IPCC does, but them doing so does not support it being a valid approach, as, in general, they skip what they don’t like. For instance, as the NIPCC report chapter 7 comments on, the IPCC report has only a few brief remarks in passing on the biological growth effects of CO2 (and those misleading) in their collosal otherwise verbose report, despite how there is a vast number of studies showing effects including high gain in water usage efficiency, fewer open stomata needed, etc.:
http://nipccreport.org/reports/2011/pdf/07TerrestrialPlants.pdf
Anyway, treating cosmic rays as zero effect would be implicitly assuming the following (and a bunch of other evidence) is mere coincidence and accidental chance:
http://sciencebits.com/files/pictures/climate/crcFig3.jpg
Incidentally, for CO2 vs solar correlation:
The following is lousy correlation:
http://www.appinsys.com/globalwarming/GW_Part6_SolarEvidence_files/image024.gif
The below is better correlation (not my favorite quantity to have plotted compared to cosmic ray flux itself but still illustrative in this case):
http://www.appinsys.com/globalwarming/GW_Part6_SolarEvidence_files/image023.gif
Much more than 0.07 degrees Celsius and far more effect than TSI alone fits the latter best.
Leif Svalgaard said:
April 13, 2012 at 10:21 pm
Not divided, just internal climate variability.
Such as the ENSO, PDO, and AMO definitely exist, in those examples temperature-affecting ocean cycles of years to decades respectively.
But I’m not really seeing what you would envision matching the particular pattern of lengthy temperature diversions on the scale of centuries like the LIA.
For me, for my hypotheses, everything matches Occam’s Razor style: observed change in solar activity / cosmic rays during the LIA and MWP (plus some volcanoes but not the primary explanation); observed temperature change; etc.
I end up considering only with a grain of salt a few studies which just happen to conveniently utterly overturn the results found before the politicized era of climate science, but that is nothing new. I can’t even recall seeing any top pro-alarmism site report Doran & Zimmerman 2009 (the 97% “consensus” study asking respondents if temperatures rose relative to the “pre-1800s” — the LIA — so almost everyone answers yes) with enough shreds of honesty to ever mention the trick in its poll questions rather than implying it shows agreement with CAGW.
Henry Clark says:
April 14, 2012 at 1:37 am
But then you would be getting that 10% figure from implicitly assuming more or less 0% effect from cosmic rays, since then you are implicitly assuming only TSI counts.
No assumption here. The argument is this: TSI should give up to 10%. I see no signal above the noise above 10%. Any TSI connection is strong, valid physics, if we can get a good reconstruction for TSI we can calculate what the effect must be. The cosmic ray hypothesis is shaky from the outset and as an extraordinary claim demands extraordinary evidence [which is not there].
implicitly assuming the following (and a bunch of other evidence) is mere coincidence and accidental chance: http://sciencebits.com/files/pictures/climate/crcFig3.jpg
Worse than coincidence: cherry picking. What would the graph look like if extended to the present?
The below is better correlation (not my favorite quantity to have plotted compared to cosmic ray flux itself but still illustrative in this case):
http://www.appinsys.com/globalwarming/GW_Part6_SolarEvidence_files/image023.gif
Much more than 0.07 degrees Celsius and far more effect than TSI alone fits the latter best.
The 0.07 is a solar cycle effect: goes up then down then up then down, etc with no trend.
The TSI you show is not the TSI construction currently thought to be valid.
But I’m not really seeing what you would envision matching the particular pattern of lengthy temperature diversions on the scale of centuries like the LIA. For me, for my hypotheses, everything matches Occam’s Razor style: observed change in solar activity / cosmic rays during the LIA and MWP (plus some volcanoes but not the primary explanation); observed temperature change; etc.
The problem is that people cherry pick what they like and consider that settled to the degree that the razor is applicable. Although Solanki is wrong about how the 20th century should be spliced to the cosmic ray record, his reconstruction before is reasonable. Moberg has a global temperature reconstruction. Compare the two here [suitably scaled]: http://www.leif.org/research/Moberg-Solanki-Correlation.png
I have put ovals where the correlation obviously fails. I will predict that you will think the correlation is good, nevertheless.
sorry for the bold. Should have been:
The 0.07 is a solar cycle effect: goes up then down then up then down, etc with no trend.
The TSI you show is not the TSI construction currently thought to be valid, but is clearly picked to make your point.
But I’m not really seeing what you would envision matching the particular pattern of lengthy temperature diversions on the scale of centuries like the LIA. For me, for my hypotheses, everything matches Occam’s Razor style: observed change in solar activity / cosmic rays during the LIA and MWP (plus some volcanoes but not the primary explanation); observed temperature change; etc.
The problem is that people cherry pick what they like and consider that settled to the degree that the razor is applicable. Although Solanki is wrong about how the 20th century should be spliced to the cosmic ray record, his reconstruction before is reasonable. Moberg has a global temperature reconstruction. Compare the two here [suitably scaled]: http://www.leif.org/research/Moberg-Solanki-Correlation.png
I have put ovals where the correlation obviously fails. I will predict that you will think the correlation is good, nevertheless.
Something that is big has more internal state than something that is small, so it is also more likely to have “internal cycles”, IMHO.
Leif Svalgaard says:
April 13, 2012 at 2:34 am
The total global production of 14C is 17 pounds per year.
Feedbacks. Gnarly feedbacks.
DirkH says:
April 14, 2012 at 9:11 am
Something that is big has more internal state than something that is small, so it is also more likely to have “internal cycles”, IMHO.
I’m not saying is does not, on the contrary I think it does have internal cycles. My point was that people should also accept that the climate has. Or is your argument that the Earth is too small to have internal climate cycles? I don’t buy that.
gymnosperm says:
April 14, 2012 at 10:07 am
“The total global production of 14C is 17 pounds per year.”
Feedbacks. Gnarly feedbacks.
How much feedback can you get from 17 pounds per year?
Your gnarly faith must be strong.
BTW, the global total production of the other radioisotope 10Be is 2 ounces per year.
Leif Svalgaard says:
April 14, 2012 at 10:10 am
“Or is your argument that the Earth is too small to have internal climate cycles? I don’t buy that.”
No, it most definitely has; the ocean’s mass is big enough for that, and the thermohaline circulation takes a long time, so we should see century-scale repercussions of past events. No argument about that.
Leif Svalgaard said:
April 14, 2012 at 7:19 am
The problem is that people cherry pick what they like and consider that settled to the degree that the razor is applicable. Although Solanki is wrong about how the 20th century should be spliced to the cosmic ray record, his reconstruction before is reasonable. Moberg has a global temperature reconstruction. Compare the two here [suitably scaled]: http://www.leif.org/research/Moberg-Solanki-Correlation.png
I have put ovals where the correlation obviously fails. I will predict that you will think the correlation is good, nevertheless.
I would agree with there being lack of correlation if that graph summed up the situation, but rather see this in contrast (clicking it to enlarge if needed):
http://www.freeimagehosting.net/newuploads/319xq.jpg
(references given below)
In fact, writing additional text in my comment here would mostly only distract from the above important graphical illustration I created, so just click on it, aside from that I’ll quickly note see Svensmark 2007 for a GCR versus low-lying cloud cover plot extending up to its publication date (not cherry picked).
Sources used in making the giant image above:
Be-10 reconstruction:
http://napink.com/Global%20Warming%20and%20Phanerozoic%20Climate%20Changes_Page_17.jpg
(which corresponds to Solar Variability Traced by Cosmogenic Isotopes, by Beer et al. 1994)
Loethle 2007 temperature graph (actually not a lot different from Moburg overall although
vastly different from the fraudulent hockey stick):
http://www.drroyspencer.com/global-warming-background-articles/2000-years-of-global-temperatures/
though Loethle 2007 temperature data was utilized more exactly from:
http://www.ncasi.org/programs/areas/climate/LoehleE&E2007.csv
Svensmark 2007:
http://www.space.dtu.dk/upload/institutter/space/forskning/05_afdelinger/sun-climate/full_text_publications/svensmark_2007cosmoclimatology.pdf
Quick edit to my prior comment: I meant to reference Beer et al 1994, not the 1997 typo in the image.
Leif Svalgaard says:
http://www.nsf.gov/news/mmg/media/images/monsoon1_h.jpg
By the same token, the LIA temperatures were not really extreme either [Legatus take note].
Well, I looked at this graph, and it got me thinking…
First, I do see a LIA, a MWP, etc. I also see a lot of wiggles, you can see the LIA if you step back, but it gets harder to see much but the wiggles on smaller scales or if you look really close. Leif looks really close at the sun, he sees all it’s wiggles and changes. He then looks really close at the earth, he does not see wiggles and changes that match the suns, He concludes that the suns changes do not make the earth’s changes. This is because he has looked really closely at the sun and knows all its wiggles, and does not see the same matching wiggles down here. The rest of us (well, some of us) do see a match, because we do NOT know about all those little wiggles the sun makes, and thus can only see the big picture, that is, that the sun did something unusual, and around the same time, so did the earth. Thus the differences between what Leif thinks and what others think may be largely because of scale.
Second, I notices things on this graph like fall of Tang/Yuan/Ming dynasty. Well, I know a little about history from that region, and there may be just a little more to the fall of a dynasty than just weather. For instance, if this change in weather had hit when the dynasty was young and strong, would it have the same effect as if it hit when it was falling into massive corruption as periodically happens to ancient Chinese dynasties? In other words, what the effect on the dynasty may be from the weather may have a lot to do on the initial conditions of the dynasty when the weather hits.
And the same may be true of the climate, when the sun does it’s Grand Minimum thing (characterized by a change in solar cycle maximums, like very slow and weak solar wind, spots fade to nothing, etc), that change will meet the conditions of the earth at that time. Conditions like PDO and AMO warm or cold phases, speed and direction of ocean currents, the reactions of various forcings and feedbacks and thermostat effects. These all have their own timings of how fast and in what way they will react to the changes in the sun, and thus down here on earth one place may see an immediate change, another may not see any change for decades. Thus, when Leif looks at it, he does not see a matching wiggle of change on earth that matches the suns changes. He also won’t see one if he assumes a lag, because depending on the initial conditions and the place we are talking about, the lag (if any) may be very different in one place than another, and thus it won’t show up as one noticeable lag world wide, indeed the different time lags may average out if added together and not even be noticeable on say a world wide average temperature chart, even though their effects on one locality may be very noticeable (some earlier, some way later). Thus some people are saying the LIA may be entirely from cycles, another says it is entirely the sun, well, could we get away from this either/or idea and admit that it obviously could be a lot of both in a complex interaction? Not so much the sun effecting earth immediately and noticeably, but the sun effecting already acting cycles and those effecting the earth. In other words, the sun not doing it directly, the sun effects the cycles, then the cycles do it. We can see this already, most of the heating of the air on this earth is not the sun heats the air, but the sun heats the oceans which heat the air. And sometimes the sun heats the ocean which then sends that heat around the world to show up as effects decades later.
Possible examples: lets try two different places. Just a randomish pick, place, Jakarta Indonesia, initial starting condition, PDO in warm phase. Now the sun decides to have a Grand Minimum, what will the effect on this one place be? What will the effect be if the PDO is in cold phase when this happens? Now, lets try Shenyang in northeastern China, same conditions, what effects there? One place, say Jakarta, may not notice much if the PDO is in warm phase at the time for many years, the other, in northern China, may suddenly be effected by a change in the jet stream which could result in an immediate succession of very harsh winters. From an ivory tower many years later, if we average the two temperatures together, we may not see much, and assume the effect was small. Meanwhile, back then, the people of Shenyang could have seen a sudden drastic change in weather followed by famine, revolution, and war.
And about this statement “the LIA temperatures were not really extreme either”, well, they don’t have to be. One late spring frost, or one pre harvest rainstorm or hailstorm, and 75% of the crop is gone, followed by famine, revolution, and war. Example, also to show how initial starting conditions, in this case cultural, can effect this (and mask it if you average out things), these sorts of crop destroying effects hit Europe a while back. There was hardship but much of Europe adapted their farming practices and coped. However, in France, the peasants could not adapt because of their culture (much of it was a top down culture like the CAGW supporters are trying to remake our society into today), result, famine, the French Revolution, and a continent at war. Thus, if it meets the right conditions, even if the average temperature does not change by a great amount, all it needs is enough change that one day, just one, say a hard deep spring frost repeated year after year wiping out the crops, is enough to warrant the name Little Ice Age, because of the changes that it made. It is all very well for a professor in their air conditioned ivory tower today to make grand sweeping gestures at the map and say that the world wide average didn’t change much, yet the view of the man on the street back then in the real world may be very much different. Mann tried to get rid of the LIA. He failed. Don’t make the same mistake.