Guest post by Bob Tisdale
INTRODUCTION
Chapter 4-7 of If the IPCC was Selling Manmade Global Warming as a Product, Would the FTC Stop their deceptive Ads? included comparisons of the CRUTEM3 Land Surface Temperature anomalies to the multi-model mean of the CMIP3 climate models. For those who have purchased the book, see page 99. As you will recall, CMIP3 stands for Phase 3 of the Coupled Model Intercomparison Project, and CMIP3 served as the source of the climate models used by the Intergovernmental Panel on Climate Change (IPCC) for their 4th Assessment Report (AR4). CRUTEM3 is the land surface temperature data available from the Met Office Hadley Centre and the Climatic Research Unit at the University of East Anglia.
This post compares the new and improved CRUTEM4 land surface temperature anomaly data to the same CMIP3 multi-model mean. CRUTEM4 data was documented by the 2012 Jones et al paper Hemispheric and large-scale land surface air temperature variations: An extensive revision and an update to 2010. I’ve used the annual time-series data, specifically the data in the second column here, changing the base years for anomalies to 1901 to 1950 to be consistent with Figure 9.5 of the IPCC’s AR4.
And, as I had with the other 20th Century Model-Observations comparisons, the two datasets are broken down into the 4 periods that are acknowledged by the IPCC in AR4. These include the early “flat temperature” period from 1901 to 1917, the early warming period from 1917 to 1938, the mid-20th Century ‘flat temperature” period from 1938 to 1976, and the late warming period. The late warming period in the chapter 4-7 comparisons in If the IPCC was Selling Manmade Global Warming as a Product, Would the FTC Stop their deceptive Ads? ended in 2000. For the late warming period comparisons in this post, I’ve extended the model and CRUTEM4 data to 2010.
COMPARISONS
As shown in Figure 1, and as one would expect, the models do a good job of simulating the rate at which the CRUTEM4-based global land surface temperatures rose during the late warming period of 1976 to 2010.

Figure 1
But like CRUTEM3 data, that’s the only period when the IPCC’s climate models came close to matching the CRUTEM4-based observed linear trends.
According to the CMIP3 multi-model mean, land surface temperatures should have warmed at a rate of 0.043 deg C per decade from 1938 to 1976, but according to the CRUTEM4 data, global land surface temperature anomalies cooled at a rate of -0.05 deg C per decade, as shown in Figure 2.

Figure 2
Figure 3 compares the models to the global CRUTEM4 data during the early warming period of 1917 to 1938. The observed rate at which global land surface temperatures warmed is almost 5 times faster than simulated by the IPCC’s climate models. 5 times faster.

Figure 3
And in Figure 4, the models are shown to be unable to simulate the very slow rate at which land surface temperatures warmed during the early “flat temperature” period.
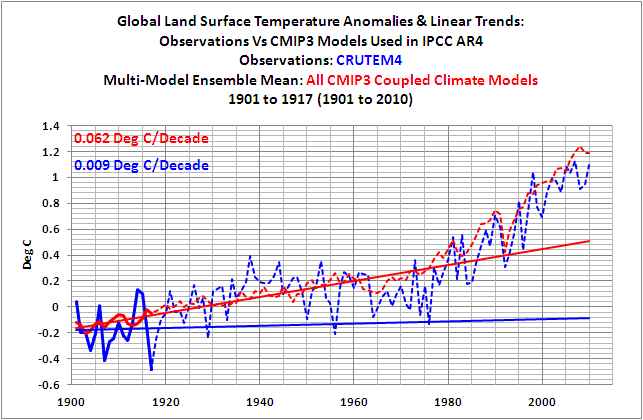
Figure 4
According to the models, the linear trend of the global land surface temperatures during the late warming period should be 6.6 times higher than during the early warming period. See Figure 5.

Figure 5
Yet according to the new and improved CRUTEM4 land surface temperature data, Figure 6, the land surface temperatures warmed during the late warming period at a rate that was only 40% higher than during the early warming period.

Figure 6
CLOSING
The models show no skill at being able to simulate the rates at which global land surface temperatures warmed and cooled over the period of 1901 to 2010. Why should we have any confidence in their being able to project global land surface temperatures into the future?
ABOUT: Bob Tisdale – Climate Observations
ebook (pdf and Kindle formats): If the IPCC was Selling Manmade Global Warming as a Product, Would the FTC Stop their deceptive Ads?
SOURCES
The CMIP3 multi-model mean data is available through the KNMI Climate Explorer
http://climexp.knmi.nl/selectfield_co2.cgi?id=someone@somewhere
And as noted in the post, the annual CRUTEM4 data is available through the Met Office website:
http://www.metoffice.gov.uk/hadobs/crutem4/data/diagnostics/global/nh+sh/index.html
Specifically:
http://www.metoffice.gov.uk/hadobs/crutem4/data/diagnostics/global/nh+sh/global_n+s
Thanks, Anthony.
How does this CMIP3 performance using CRUTEM4 data compare to CMIP3 performance using CRUTEM3 data? Any indications that the changes from CRUTEM3 to CRUTEM4 have been hand-adjusted to improve CMIP3 backtesting (even if it is still pretty bad)?
Presumably somebody will answer that rather than the ensemble we could just pick the “best model” for each subperiod. Also they’ll point out on multidecadal scales the differences don’t appear to be much.
Anyway…if you could also show Version 3 alongside version 4, things will look very very suspicious especially at the right end…
I am with Alec on this one.
Are the adjustments making the the data fit the models better for the last 36 years?
Because that would really be a coincidence wouldn’t it?
Thanks, excellent article Bob!
I’m hoping WoodForTrees will soon have the new data base.
Models are laboriously tuned to match the latest warm AMO period. Period. They are not able to model even the 20th century, since they a) deny any natural variability in the best tradition of hockey-stick BS, b) they are based on unphysical background, or at least many times exaggerated radiative effect which has never been directly measured.
Once again; the warm AMO period 1910-1945 is INDISTINGUISHABLE from the warm AMO period 1975-2005. See how the models are absolutely unable to model the North Atlantic natural variability.
http://oi56.tinypic.com/wa6mia.jpg
The only period they match has already ended. North Atlantic SST peaked in 2006 and now it is heading down for another 30 years, exactly as it did in 1945-1975, dragging the whole global record with it. Models are alchemy, AGW is nonsense which can not withstand full information: deal with it.
The defense is that the differences between observation and models are due to “natural” variations that have higher amplitudes but shorter frequencies than expected from modelling. It is not an unreasonable defense. Not that I am a warmist, but I can justify the claim that, so far, observations are enough of a match that their position is not falsified. (The adjustment bias is the only reason that they both have a case for CAGW that holds some water, it is noted. We need the adjustments to stop!)
The important difference for me is the immediate excess warming the models show relative to observation. The models look like they need to be tamped down, which of course drops the projected 2100 outcome to the bottom of the CAGW narrative, and into the solar/natural regime at the same time, UNLESS there is a near-future, sudden climatic response to CO2.
I’m happy that the models are off right now, on the serious warming side. The time when the difference is too great to arm-wave away comes quicker the more potent the warmists think CO2 is. Although they may claim that the future holds sudden increases, their models don’t provide for it right now. They can’t have it settled and certain unless, very soon, there is an uptick in both global temperatures and sea-level.
The newspapers today are touting the global warming winter of today. In North America. I wonder what the European-by-themselves stats are? Of course the biggest believers and most dangerous politically are in the States, so Europe, being in a different universe, doesn’t count.
Did you MASK the output of the models to match the spatial coverage of the observations?
For example: in the early part of the record the entire globe is NOT sampled. So the average has some spatial bias in it. If you used the complete model output to come of with the average for this period, then you are doing the comparison wrong. First, you have to extract the MONTHLY observation mask from the observation dataset. That will tell you which GRIDS there are samples for. Since CRU do NOT interpolate or extrapolate U must extract this data.
Then you have to take the monthly grids from all the models. You have to decimate those grids to match the observed grids.
If you do that you have a valid comparison. This is the method used in attribution studies and one which must be used in evaluating model fit to observations.
Ok, so when the data shows we have entered a cooling cycle we need to fix the data to show even more warmth so it can match the models that cannot even back predict over the last 100 years. Got it. Why is this farce/fraud not shouted from the highest rooftops……?
Why dont you put in the 3 horizontal lines (#1. before 1920, #2. 1940-80, #3. 2000 continueing
the present temp. plateau ? These mark the stepwise temp increase with the tipping
points 1822-1881-1941-2000, when temp plateaus always set in according to the
Scafetta 60-year cycle…..
Please put the lines in and the graph will be highly enhanced in heuristic value….
JS
The new Crutemp4 increase over Crutemp3 on a monthly basis. Not so much difference except for the early 1850s and then the last 15 years which rises to +0.1C or so.
http://img28.imageshack.us/img28/3845/crutemp4vscrutemp31851t.png
HadSST3, of course, has more of a change compared to HadSST2 – particularly in the 1883 to 1886 period (cooling this period), 1936 to 1944 period (cooling it) and the 1945 to 1971 period (warming it). It looks a little strange right now so I will wait till they release the final.
Mr. Mosher, as much as I appreciate your devotion to detail I must confess the explanations are appearing more and more to be long reaches to justify the unjustifiable. I am weary of the constant adjustment to exsisting data in order to make it fit the false models. The real observations do not back the modeling, but when that occurs we hear weather isn’t climate unless of course the weather might seem to portray AGW then it is acceptable data.
Did they really think that no-one would notice that they had their thumb on the scales?
here you can see the CMIP5
crutem4 is adjusted for it 🙂
http://www.climate-lab-book.ac.uk/2012/on-comparing-models-and-observations/
Steven Mosher says:
March 20, 2012 at 11:37 am
Did you MASK the output of the models to match the spatial coverage of the observations?
For example: in the early part of the record the entire globe is NOT sampled. So the average has some spatial bias in it. If you used the complete model output to come of with the average for this period, then you are doing the comparison wrong. First, you have to extract the MONTHLY observation mask from the observation dataset. That will tell you which GRIDS there are samples for. Since CRU do NOT interpolate or extrapolate U must extract this data.
Then you have to take the monthly grids from all the models. You have to decimate those grids to match the observed grids.
Alternatively we cold just admit that prior to 30-40 years ago we dont know what global temperatures were.
The new ‘meme’ is that only 30-year trends can detect climate changes. On my web site I’ve plotted 30-year trends for the old CRU temperature, GISS, NCDC and a 23-model ensemble. They show that with all three data sets the models failed to simulated the rate of change in temperature.
http://www.climatedata.info/Discussions/Discussions/opinions.php
Mosher’s comment contains a truth I wish would be observed more often when discussing climate model purporting to address “global” warming. Truth is that we have observed global temperatures only for about 30 years and no amount of adjustments, interpolations, or corrections can make the current kludged together data be physically meaningful on a global scale. No amount of matching models to data for the last 30 years can give a meaningful confidence that the model will match data for the next 30 (every time we get a mismatch a new physical factor is cited to be included such as dust particles or clouds). No amount of corrections can give you an absolute temperature that a sensor failed to measure correctly nor can any massage of proxy data give an accurate monthly temperature measurement from before thermometers were invented, nor can we ever recover the spatial distributions of temperatures in the southern hemisphere that we didn’t gather early in the 20th century.
The real truth is that some climate scientists are pretending to certainty in a way that constitutes scientific fraud. We don’t know that the model has failed in rates in the early 20th century because we don’t know what the early 20th global measurement are. But to pretend that we can use a model to predict the future is a great fraud because we can’t test it over a well documented period to have confidence that it accounts for the significant climate factors.
Steven Mosher says: “Did you MASK the output of the models to match the spatial coverage of the observations?”
We’ve been through this before, Steven. I’ve shown you that there was little to no difference between a replication of the IPCC’s Figure 9.5, cell a, with and without the spatial adjustments. Don’t you recall? I could find my reply to you from 4 to 6 months ago, if you’d like. It’s like comparing infilled GISS and NCDC data to HADCRUT data, which, of course, hasn’t been infilled. The differences are so small they have no impact on simple comparions like this.
Steve Mosher says…
Steve: I enjoy your posts, primarily because you’re a straight shooter and also because I learn from them (although the details can be slightly over my head). I think most of us agree with Juaj V. who says “Models are laboriously tuned to match the latest warm AMO period. Period.” and johnmcguire who says “I am weary of the constant adjustment to exsisting data in order to make it fit the false models.”
What’s your opinion on the constant ‘tuning’ of the models & ‘adjusting’ of the data until they finally match?
Frankly, eyeballing the two seems to give quite a good correlation … a faked one of course. Most importantly Hadcrut4 does away with Jonesy’s most embarrassing admission to parliament that there’s been no warming for the past 15 years.
Is data accessible enough for some climate realists to create a new version ?
THe question remains.
Were the models tuned to match CRUTEM4, or was CRUTEM4 tuned to match the models.
I wonder how the graphs would look if the horizontal component were stretched out so that the increment was one year per vertical bar. I’d bet the graph would look very dissimilar.
Alec Rawls says: “How does this CMIP3 performance using CRUTEM4 data compare to CMIP3 performance using CRUTEM3 data? Any indications that the changes from CRUTEM3 to CRUTEM4 have been hand-adjusted to improve CMIP3 backtesting (even if it is still pretty bad)?”
And A. C. Osborn says: “I am with Alec on this one.
Are the adjustments making the the data fit the models better for the last 36 years?
Because that would really be a coincidence wouldn’t it?”
I had a funny feeling people would ask. The differences between the models and observations improved (lessened) with CRUTEM4 during the “flat temperature” periods, but worsened (increased) during the warming periods, especially during the early warming period.
http://i40.tinypic.com/k1fkeg.jpg
Ron Manley says:
March 20, 2012 at 12:31 pm
On my web site I’ve plotted 30-year trends for the old CRU temperature, GISS, NCDC and a 23-model ensemble. They show that with all three data sets the models failed to simulated the rate of change in temperature.
_____________________________
I like your analysis, it does not rely on noise in source data like the original article does. The difference between models and reality is not big – 1C/century for a few years is really very little – but it indicates there might be some real-world periodicity missing in models. That might be even more important than minute differences in trends. It’s just hard to say if it’s not just an artefact of the method combined with some shorter period. It kinda reminds me of Scafetta’s work.
Note that CRUTEM4 seems to end at the peak of the 2010 El Nino, so the match looks better than it actually is. If a few years of extra data are added, the divergence becomes more apparent. Obviously this won’t be an issue if temperatures shoot up again shortly. If that doesn’t happen, it will be impossible to not notice the divergence. The bottom line is that even with these adjustments always occurring in the same direction (increased warming) it is still a relatively trivial amount when compared to what models project should be happening. Interesting times.
Me thinks these people are simply masturbating the data in a corner ignoring the reality of reality and the foolishness of this unscientific modeling garbage.
Interesting first analysis Bob, however one think I think is dubious:
” These include the early “flat temperature” period from 1901 to 1917, the early warming period from 1917 to 1938″
Are you sure these are “4 periods that are acknowledged by the IPCC in AR4. ” ?
I don’t recall IPCC mentioning such precise dates. I think that is false attribution. It’s also cherry picking. Trough to peak period for calculating a linear trend. very naughty. If you went from 1915 to 1940 the result would not be quite the same, would it?
I am strongly critical of this sort of mis-representation by warmists and I’m not going to say I like it any more when you do it.
The forced response will show up in all model ensembles, so will be reinforced by the averaging involved in making the multi-model mean. Contributions to the global average temperature from internal variability will appear in various instances within an ensemble, but may not occur at the same time or to the same degree, so the process of averaging will reduce the contribution of internal variability.
The post 1975 warming is hypothesised to be a forced response to anthropogenic forcing. The earlier periods of warming do not show a similar global pattern. That the post 1975 warming shows up robustly in the ensemble mean supports the hypothesis that it is a forced response. That the preceding changes do not suggests they are not predominatly forced responses but are mainly due to internal variability.
It seems every day that some “official” agency is changing the data to suit the propaganda message. Is “science” now dead in the modern era?
I wish people would stop calling it ,”the rate of temperature change”
PLEASE can we use the proper terminology, “the rate of temperature manipulation”
I 2nd, 3rd and 4th, the sentiment below…
Louis Hooffstetter says:
March 20, 2012 at 1:05 pm
Steve Mosher says…
Steve: I enjoy your posts, primarily because you’re a straight shooter and also because I learn from them (although the details can be slightly over my head). I think most of us agree with Juaj V. who says “Models are laboriously tuned to match the latest warm AMO period. Period.” and johnmcguire who says “I am weary of the constant adjustment to exsisting data in order to make it fit the false models.”
What’s your opinion on the constant ‘tuning’ of the models & ‘adjusting’ of the data until they finally match?
Dr Burns says:
March 20, 2012 at 1:17 pm
Most importantly Hadcrut4 does away with Jonesy’s most embarrassing admission to parliament that there’s been no warming for the past 15 years.
I hope Hadcrut4 will be on woodfortrees soon. But in the meantime, RSS still shows no warming for 15 years and 3 months.
http://www.woodfortrees.org/plot/rss/from:1995/plot/rss/from:1996.9/trend
P.S. There are at least 3 different versions of Hadcrut3 and the one on woodfortrees right now is apparently NOT the one being adjusted. I wonder if that will still be around after Hadcrut4 is out. They deleted the January anomaly of 0.218 and the February one is not up yet. I wonder if we will ever see it.
I find it interesting (and suspicious) that a model temperature trend of the Earth and samples supposedly taken from the earth (without benefit of geostatistical interpolation to represent the volume of the Earth) match so gloriously well. I’ve never seen such a phenomenal (and most unlikely) correlation.
Consider the corrollary question: Is the model a sample-generating scheme? No?
Bob Tisdale – Curious; you don’t seem to have shown the range of model variations around your model mean (unlike http://www.ipcc.ch/publications_and_data/ar4/wg1/en/figure-9-5.html and also http://www.realclimate.org/index.php/archives/2012/02/2011-updates-to-model-data-comparisons/).
Given that the temperature record falls within the range of variation of those models, your depiction here is a wee bit unfair.
[Steven Mosher says:
March 20, 2012 at 11:37 am
Did you MASK the output of the models to match the spatial coverage of the observations?
For example: in the early part of the record the entire globe is NOT sampled. So the average has some spatial bias in it. If you used the complete model output to come of with the average for this period, then you are doing the comparison wrong. First, you have to extract the MONTHLY observation mask from the observation dataset. That will tell you which GRIDS there are samples for. Since CRU do NOT interpolate or extrapolate U must extract this data.]
If this is enough to make a difference then there is no meaning in graphing the CRUTEM data at all. It would be like (this is of course an exaggeration) graphing Europe’s temp in 1910 then Asia’s temp in 1920 then North America’s in 1930. I.e. You’re graphing different measurements at different dates thus the composite graph has no meaning what so ever. Thus any trends drawn from it also have no meaning. Is that what you really intended to imply?
On the other hand if the differences in what is being measured is sufficiently small to draw trends etc. then I can’t see that it would make a noticible difference in Mr. Tisdale’s analysis.
“Bob, How does this ‘HalfCut 2.0’ performance using ‘CUT-EM-UP4’ data compare to Olympic performance using ‘HadCuT3’ data?” (<– fake quotes)
[I had a funny feeling people would ask Too]
JK
Sorry Bob, I know you were waiting for a question like this your entire life. 😉
Bloke down the pub says (March 20, 2012 at 12:13 pm)
Did they really think that no-one would notice that they had their thumb on the scales?
———————————–
Or the large checkout lady who had her breasts on the scales when charging for fruit! 🙂
Are you sure CMIP3 isn’t really CHIMP3 ??
johnmcguire says:
March 20, 2012 at 12:07 pm
I see that you, too, have discovered that Mosher has no instinct for raw data but is bustling with energy for endless adjustments to the statistics. Mosher, would you mind telling us in what way raw data finally snaps the leash and calls statistics to heel? Or is that impossible in your universe?
Steven Mosher says:
March 20, 2012 at 11:37 am
Did you MASK the output of the models to match the spatial coverage of the observations?
Did the the models used in the multimodel mean have their observations MASKED so they have the same coverage?
And, as you pointed out, spacial coverage in the early data was sparse and non uniform. So it’s basically worthless from a global standpoint. Hence there is no way anyone can validate whether the models on a global scale were valid during the early part of the last century.
KR says: “Bob Tisdale – Curious; you don’t seem to have shown the range of model variations around your model mean …Given that the temperature record falls within the range of variation of those models, your depiction here is a wee bit unfair.”
Unfair? I don’t believe anyone has ever before said my data presentations were unfair. Consider yourself a first.
Refer to the discussion here, under the heading of CLARIFICATION ON THE USE OF THE MODEL MEAN:
http://bobtisdale.wordpress.com/2011/12/12/part-2-do-observations-and-climate-models-confirm-or-contradict-the-hypothesis-of-anthropogenic-global-warming/
Which models are predicting new record high temps? Highs like the current record-breaking run in the US? In International Falls, which threatened suit when a Colorado city tried to steal its “Nation’s Icebox” moniker, the mercury went to 77 degrees on Saturday — which was 42 degrees above average, and 22 degrees above the old record.
Most climate models predict rising temps. Looks like they’re on the money!
P. Solar says: “Are you sure these are ‘4 periods that are acknowledged by the IPCC in AR4. ‘?”
The IPCC clearly states that there are two level temperature periods and two warming periods during the 20th Century. Refer to Chapter 3 Observations: Surface and Atmospheric Climate Change.
http://www.ipcc.ch/pdf/assessment-report/ar4/wg1/ar4-wg1-chapter3.pdf
Under the heading of “3.2.2.5 Consistency between Land and Ocean Surface Temperature Changes”, the IPCC states with respect to the surface temperature variations over the period of 1901 to 2005 (page 235):
“Clearly, the changes are not linear and can also be characterized as level prior to about 1915, a warming to about 1945, leveling out or even a slight decrease until the 1970s, and a fairly linear upward trend since then (Figure 3.6 and FAQ 3.1).”
The years and approximations listed by the IPCC are for global land plus sea surface temperature data. They vary slightly if land or sea surface temperatures are presented separately.
Gillian, I hope you are being sarcastic – except for North America, temperatures during this winter in the Northern Hemisphere were below normal.
So what happened to your computers?
REPLY: I took them back to my office, repaired them to demo another day – Anthony
Barry,
Everyone knows that the data from the early part of the century are even more worthless than the data available for the following years, up to the satellite era. But for momentous policy decisions we need something to go on, so we just pretend that it is sufficient for the purpose.
Not yours! I meant Bob’s!!! From the confiscation! I’ve been dying to find out what happened to his computers after they were carted off to the Secret Service, or CIA, or was that the batcave? 007’s boss?
For KR and Mosher, you both need to be more clear about the obfuscations you are attempting.
Hadcrut3 and GISS and the NCDC are right now lower the lowest runs in the 23 models used in IPCC AR4. Hadcrut4 looks like it will not be more than 0.1C higher than Hadcrut3, so yeah, FAIL again.
http://img99.imageshack.us/img99/5937/ipccmodelspreadvshc3jan.png
http://img818.imageshack.us/img818/3300/ipccspreadhindforecast2.png
Of course, the lower troposphere satellite temps are off the charts below.
http://img827.imageshack.us/img827/8535/ipccforecastsobsfeb2012.png
An interesting reminder, and the only precedent I am aware of, where citizens (“sceptics”) took the Crown Research Institute, NIWA, to court over their updated adjustments. They eventually abandoned their adjustments and the country was apparently .7C cooler as a result.
http://www.scoop.co.nz/stories/SC1012/S00054/climate-science-coalition-vindicated.htm
Philip Finck says:
March 20, 2012 at 11:41 am
///////////////////////////////////////////////////////////
Philip
The new Crutem4 which has been revised so that it is warmer than the earlier Crutem3 version at any rate warmer from the 1970s onwards does now show an accelerated rate of warming.
The 1920 to 1940 warming is now 0.2degC per decade, whereas the 1980 to 2000 warming is 0.28degC per decade.
This new upwardly revised data set (which also cools earlier periods) therefore overcomes one of the most significant arguments that sceptics use to have, namely where is the CO2 signature when the rate of warming between 1980 to 2000 (when manmade CO2 levels were rising and said to be significant) is no greater than the rate of warming bewteen 1920 to 1940 (when manmade CO2 was not a significant factor)? Crytem4 now allows then to say the rate of warming has increased by some 40% up from 0.2 degC per decade to 0.28 degC per decade. It is up by some 40% due to CO2.
So what was the cloud cover in all this years?
We are in Northern Hemisphere and entering Spring a cloudy day just drops 5ºC or more in temperature at day time…
The land warming from 1976 to 2010 is 0.284 C/decade. And according to UAH, from December 1978 to the present is 0.17 C/decade. Over that period of time, this demands a very good explanation.
I’m rather puzzled by all this fuss over CRUTEM4. More data, particularly in previously under-sampled high latitudes (where ‘polar amplification’ should be most visible), and better handling of changing sampling techniques for SST…. I would have thought there would be celebration over better data.
Better data should be an improvement. Regardless of your previous outlook, better data means a more solidly based set of information going forward.
Bill Illis – The models represent ‘best guesses’ of how the physics works. And the range of results represent numerous possible paths for the climate to take if those models are anywhere near accurate.
There is absolutely _no_ physical requirement that the evolution of climate (based upon all the natural variations, influences, etc.) should pin itself strictly to the _mean_ of physically possible outcomes. Modelling indicates that decadal high or low trends are to be expected – the norm, not the exception – with the climate following the mean only over climatically significant periods of ~20-30 years.
You are asking for pin-point, short term replication, in models that make no such claim. That’s a strawman argument (http://en.wikipedia.org/wiki/Straw_man). Not at all reasonable.
—
And., as I noted before, Bob Tisdale has _neglected_ to show the range of modeled outcomes – and has therefore painted the models in an unwarranted, unfair comparison.
KR says:
March 20, 2012 at 8:59 pm
I’m rather puzzled by all this fuss over CRUTEM4. More data, particularly in previously under-sampled high latitudes (where ‘polar amplification’ should be most visible)
Why did all the polar amplification just amplify all the years from 2001 to 2010 but neglect to amplify 1998? That is what I find puzzling. See
http://www.metoffice.gov.uk/news/releases/archive/2012/hadcrut-updates
Well, I’m happy about this.. it proves that “REVISIONS” have given us more than 50% of the warming in the 1976-2010 period, and guessimating that UHI effects and station loss/disappearance/removal (where did they go, I wonder ?) also accounts for some 50% of the warming, that means that it has actually gotten COLDER !!!
Which coincides with my experience of the situation.
Certainly been a pretty yucky summer or two down here !!
It is such a pity that the main temperture databases are controlled by the AGW priesthood.
They have become meaningless because of this.
Doug Proctor says:
March 20, 2012 at 11:31 am
The defense is that the differences between observation and models are due to “natural” variations that have higher amplitudes but shorter frequencies than expected from modelling. It is not an unreasonable defense.
So during periods when temperatures are flat or declining, ‘natural variations’ in the Earth’s climate system lose heat as fast or faster than the heat gain from increases in forcings.
Were forcings completely independent from ‘natural variations’, then this would be a reasonable position, but of course they are not independent in the Earth’s climate, although perhaps they are in the models.
The alternate view is that “natural” variations that have higher amplitudes but shorter frequencies means the Earth’s climate is determined by processes operating on shorter timescales than anthropogenic forcings and that the Forcings Model is invalid, with has no predictive value.
“It’s not possible to know what the future holds, of course, and such modelling – economic or scientific – is a highly imperfect way of making predictions. Even so, some idea is better than no idea”
http://www.theage.com.au/opinion/politics/human-cost-of-inaction-incalculable-20120320-1vhrv.html#ixzz1pijjmvlM
Well he’s right about reaching those tipping points. MINE!!!!
The evil that men do lives after them; the good is oft interred with their bones, and so let it be with HadCRUT3.
HadCRUT3 had the potential to stop the CAGW fraud dead in its tracks, as it clearly showed a ZERO warming since 1998 and a definite downward trajectory from 2001 to the present, with plummeting temperatures from the start of solar cycle 24.
I’m sure that when AR5 comes out, the only images that will hit newspapers and TV screens will be this “new and improved” tortured HadCRUT4 graph (ending at 2010 of course) showing politicians and the world that IPCC “nailed” it and that CAGW is racing towards, “seas boiling away”, as Hansen so graphically and erroneously put it.
Behold Hockey Stick 2.0. A craftily designed tool, designed not for understanding, but rather to beat the world into submission. Like it’s predecessor, HadCRUT4 will be unceremoniously airbrushed out of AR5 when it’s proven to be unrepresentative of reality.
One major flaw to this chicanery is what to do with the MASSIVE discrepancies between the laughable HadCRUT4 temperature data and the RSS and UAH satellite temperature data records. Are these nefarious “scientists” going to simply “recalibrate” the satellite data, too? To pull this scam off, they’d almost have to “deal” with the satellite evidence as it clearly shows gross manipulation of terrestrial data.
“Modelling indicates that decadal high or low trends are to be expected – the norm, not the exception – with the climate following the mean only over climatically significant periods of ~20-30 years.
You are asking for pin-point, short term replication, in models that make no such claim. That’s a strawman argument (http://en.wikipedia.org/wiki/Straw_man). Not at all reasonable.”
Since Bob’s analysis is over 30 year periods or longer what point are you trying to make here? I can’t follow your jumbled logic, sorry.
KR says: “I’m rather puzzled by all this fuss over CRUTEM4.”
There’s no fuss, just discussion and persons venting. If this thread had 200 comments in 24 hours, that would be a fuss.
KR says: “More data, particularly in previously under-sampled high latitudes (where ‘polar amplification’ should be most visible), and better handling of changing sampling techniques for SST…. I would have thought there would be celebration over better data.”
This post was about CRUTEM4. There’s no sea surface temperature data included. Also, polar amplification is a natural process.
KR says: “And., as I noted before, Bob Tisdale has _neglected_ to show the range of modeled outcomes – and has therefore painted the models in an unwarranted, unfair comparison.”
I’ve already replied to your “unfair” comment, providing a link that explained why I presented only the model mean. I’m only interested in presenting the trends of the “forced signal”, not the “noise”, to put it in the terms used by Gavin Schmidt in the link I provided earlier. Or to use the terminology presented by NCAR, I’m interested in showing the trends of the “best representation of a scenario” that is presentable by all of the climate models in the CMIP3 archive.
I am not buying this. The surfaces temp observations and the modeling agree very well. The agreement is not so great around the 1970 dip, where the models plateau slightly. That observation would be consistent with the common recognition that that dip was due to post WW2 aerosol production and the general opinion the models are not good with aerosols.
In fact considering the difficulties inherent in the modeling and the surface temperature estimates, and the fact that they are independant of each other, the agreement is brilliant.
On the other hand Bob’ s gradient drawing exercise has a bad small about it. Anyone else notice that all the end points are chosen so they just happen to coincide with a local maximum/minimum.. And that the early starting point of each segment is chosen to have a down tick, while the ending point is chosen to show an up tick. This has the effect of exaggerating positive gradients. And negative gradients show the same trick in reverse.
Bob must be saying “whip me Tamino, whip me!”.
Will Nitschke says:
March 20, 2012 at 7:25 pm
An interesting reminder, and the only precedent I am aware of, where citizens (“sceptics”) took the Crown Research Institute, NIWA, to court over their updated adjustments. They eventually abandoned their adjustments and the country was apparently .7C cooler as a result.
————-
Will it seems that the temperature series shown here still shows warming:
http://www.niwa.co.nz/climate/nz-temperature-record
Juraj V. says:
March 20, 2012 at 11:28 am
Models are laboriously tuned to match the latest warm AMO period. Period.
————–
Prove it. Wishfully thinking on your part is not good enough.
johnmcguire says:
March 20, 2012 at 12:07 pm
. I am weary of the constant adjustment to exsisting data in order to make it fit the false models.
———————-
Unless you can prove this happens, I am calling this a concocted fantasy.
The fact of the matter is that anyone can take the raw data and process it and come up with a temperature series and none of them deviate much from what is shown in CRUTEM. No reference to any model is made.
So in this thread we now have had two mutually contradictory assertions, both by people who know nothing of the internal processes by which things are done.
One guy asserts the models are adjusted to fit the observations.
The other guy asserts the observations are adjusted to fit the models.
They can’t both be right.
More than likely they are both wrong.
And making stuff up.
Bob Tisdale – “This post was about CRUTEM4. There’s no sea surface temperature data included…”
Headslap – My apologies, I had just been reading the HadCRUT4 thread and the press releases on it…
LazyTeenager says: “I am not buying this.”
That’s because you’re gullible and you believe in the hypothesis of anthropogenic global warming, the existence of which can only be demonstrated through poorly performing climate models.
LazyTeenager says: “The surfaces temp observations and the modeling agree very well…”
Apparently you have trouble reading graphs. The only period when the models appear to perform well, based on the linear trends, is the late warming period.
LazyTeenager says: “On the other hand Bob’ s gradient drawing exercise has a bad small [sic] about it. Anyone else notice that all the end points are chosen so they just happen to coincide with a local maximum/minimum…”
You’re complaining about the most logical way to select break points between cooling and warming periods. Would you select other years? If so, please identify which years and present the reasons for selecting those years.
So if I’m reading this right, in the last 30 years, despite all talk of start points and endpoints, the model mean was off 5 fold early in the 20th century, 2 fold middle of century, and right on the last 30 years or so? Sounds like the model mean is just fine, just that forcing inputs becoming more accurate with better data and time, keep up the good work climatologists!
Bob:
“I’m only interested in presenting the trends of the ‘forced signal’, not the ‘noise'”. But the observed temps which you’re comparing trends from obviously do present the noise. Apples to oranges it seems…
LazyTeenager says:
Will it seems that the temperature series shown here still shows warming:
http://www.niwa.co.nz/climate/nz-temperature-record
==========================
Did you read the article or just look at the graph? The “sceptics” disputed adjustments that increased NZ temperatures by around 1C. Because the adjustments could not ultimately be defended, they got thrown out and temperatures declined by .7C. Leaving an actual .3C of warming over the century. Or as sceptics would characterise this, about what one might expect as a result of natural variability.
AndyG55 says:
March 20, 2012 at 10:12 pm
///////////////////////////////////
Yes.
But of more significance is that for the main part they do not measure energy content and therefore are useless to the consideration as to whether the Earth is gaining energy as a consequence of IR trapping by GHGs.
They should be thrown away and a new data set created from scratch which is based upon the higherst quality siting, proper spatial coverage and one which measures energy content. It should be designed and set up in such a way that there is no need for any adjustments to be made to the raw data collected.
They should also track min/max energy content (including tracking time) as well as average energy content.
We might then begin to understand what is going on. At least we would have a data set which is of some relevance to the issue at hand.
LazyTeenager says:
One guy asserts the models are adjusted to fit the observations.
The other guy asserts the observations are adjusted to fit the models.
They can’t both be right.
==============
Why can’t you do both? In fact that’s exactly what can happen. My understanding is that RSS MSU temperature data is based in part on a model. Why wouldn’t one then take that data and try to tune a climate model to fit that data? A model should do more than just tune itself to a signal of course, but some amount of tuning is probably inevitable.
Lazy, I always find your logic baffling, if “logic” is the right word here…
Who cares ? Unfortunately almost ALL of the historical data, regardless of source, is trash quite simply because there is no way to know how well a single non-random, unreplicated daily observation from nearly ALL recording sites (n=1) reflects the actual population of that site-day’s temperature. None of the assumptions/requirements about the data required for the stats employed are actually met. Neither Type 1 nor Type 2 errors can be estimated from n=1.
Historical land-temps are not even pseudo-science; they are simply BAD science. Your reported precision is simply absurd given the instrument limits of observability and unknown variance.
Frankly, even the more recent data is problematic, as evidenced by readings of over 400 degrees C reported from the great lakes, disparate values from each sat, and failure to consistently calibrate sat values with real world observations.
I certainly appreciate your efforts, even as useless as they are. Sorry, to be so rude about all this but science is all about the wet fish slap in the face that is reality.
BioBob says:
March 21, 2012 at 9:30 pm
Who cares ? Unfortunately almost ALL of the historical data, regardless of source, is trash quite simply because there is no way to know how well a single non-random, unreplicated daily observation from nearly ALL recording sites (n=1) reflects the actual population of that site-day’s temperature. None of the assumptions/requirements about the data required for the stats employed are actually met. Neither Type 1 nor Type 2 errors can be estimated from n=1.
Historical land-temps are not even pseudo-science; they are simply BAD science. Your reported precision is simply absurd given the instrument limits of observability and unknown variance….
________________________________
Agreed.
We know it is trash thanks to Anthony’s surfacestations.org project in the USA and the more recent Australian survey Australian temperature records shoddy, inaccurate, unreliable In that study they found the readings were often to the nearest degree.
If the data from the USA and from Australia is shoddy, the data from Africa at times non-existent. If the USSR data before the fall was artificially cooled to increase the coal allotment from the government, the New Zealand data artificially made to show an increase and the ocean surface temperature completely dependent on random bucket measurements.
Given all that how can they claim to know the actual temperature increase over the 20th century to the nearest degree much less add decimal points?
AJ Strata, a NASA aerospace engineer, does a good analysis of the error in the temperature data here: http://strata-sphere.com/blog/index.php/archives/11420
On 2012.03.05 and 2012.03.11 I was able to plot HADCRUT3gl data up to 2012.08, but note that maybe in an effort to ‘hide the decline’ on March 11, 2012 HADCRUT3 was truncated from 2012.08 to 2011.92.
Also, October, November and December 2011 were “warmed” in the data.
Can anyone explain this?
Can anyone please post the truncated data points in HADCRUT3gl; 2011.92 to 2012.08?
See my WoodForTrees graph at http://www.oarval.org/ClimateChangeBW.htm
Utahn says: “But the observed temps which you’re comparing trends from obviously do present the noise. Apples to oranges it seems…”
We’ve covered that, Utahn. The additional ENSO-related variations (and volcano-related dips and rebounds) have little impact on these comparisons. Refer to Figures 6 through 9 in this post…
http://bobtisdale.wordpress.com/2011/12/12/part-2-do-observations-and-climate-models-confirm-or-contradict-the-hypothesis-of-anthropogenic-global-warming
…under the heading of ENSO- AND VOLCANO-ADJUSTED OBSERVATIONS AND MODEL MEAN GLOBAL SURFACE TEMPERATURE DATA.
Regards