In today’s report
- Arctic Sea Ice on the rise again, presently in the range of normal levels
- Antarctic Sea Ice is at slightly above normal levels
- Why is early satellite data for Arctic and Antarctic Ice extent referenced in the first IPCC report missing from today’s data?
- Is revisionism going on with the date of the famous USS Skate photo in the Arctic?
- Bonus – it seems NOAA is taking Arctic soot seriously
First the Arctic from NSIDC:

Source: http://nsidc.org/data/seaice_index/images/daily_images/N_stddev_timeseries.png
After being out of the ±2 STD area since before peak melt last year, Arctic extent has spent most of March in near normal territory. After what looked like a maximum earlier this month, it was false peak, and ice is on the rise again.
NORSEX SSM/I shows the current value within ±1 STD

Source: http://arctic-roos.org/observations/satellite-data/sea-ice/observation_images/ssmi1_ice_area.png
A caution, as we saw in 2010, extent hugged the normal line for quite awhile, and that didn’t translate into a reduced or normal summer melt. So, forecasting based on this peak might not yield any skillful ice minimum forecasts.
Antarctic Sea Ice is at slightly above normal levels, as it has been for some time:

Source: http://nsidc.org/data/seaice_index/images/daily_images/S_stddev_timeseries.png
Why is early satellite data for Arctic and Antarctic Ice extent referenced in the first IPCC report missing from today’s data?
In a post last week, Steve Goddard pointed out that in the original IPCC FAR in 1990, there was an interesting graph of satellite derived Arctic sea ice extent:

This is from page 224 of IPCC FAR WG1 which you can download from the IPCC here
And here is figure 7.20 (a) magnified:

The IPCC descriptive text for these figures reads:
Sea-ice conditions are now reported regularly in marine synoptic observations, as well as by special reconnaissance flights, and coastal radar. Especially importantly, satellite observations have been used to map sea-ice extent routinely since the early 1970s. The American Navy Joint Ice Center has produced weekly charts which have been digitised by NOAA. These data are summarized in Figure 7.20 which is based on analyses carried out on a 1° latitude x 2.5° longitude grid. Sea-ice is defined to be present when its concentration exceeds 10% (Ropelewski, 1983). Since about 1976 the areal extent of sea-ice in the Northern Hemisphere has varied about a constant climatological level but in 1972-1975 sea-ice extent was significantly less. In the Southern Hemisphere since about 1981, sea-ice extent has also varied about a constant level. Between 1973 and 1980 there were periods of several years when Southern Hemisphere sea-ice extent was either appreciably more than or less than that typical in the 1980s.
I find it interesting and perhaps somewhat troubling that pre-1979 satellite derived sea ice data was good enough to include in the first IPCC report in 1990, but for some reason not included in the current satellite derived sea ice data which all seems to start in 1979:

Since the extent variation anomalies in 1979 seem to match with both data sets at ~ +1 million sq km, it would seem they are compatible. Since I’m unable to find the data that the IPCC FAR WG1 report references so that I can plot it along with current data, I’ve resorted to a graphical splice to show what the two data sets together might look like.
I’ve cropped and scaled the IPCC FAR WG1 Figure (a) to match the UUIC Cryosphere Today Arctic extent anomaly graph so that the scales match, and extended the base canvas to give the extra room for the extended timeline:

Click image above to enlarge.
Gosh, all of the sudden it looks cyclic rather than linear, doesn’t it?
Of course there will be much wailing and gnashing of teeth over my graphic, and the usual suspects will try to pooh-pooh it, but consider the following
- Per the IPCC reference, it is data from NOAA, gathered by the American Navy Joint Ice Center
- It is satellite derived extent data, like Cryosphere Today’s data
- The splice point at 1979 seems to match well in amplitude between the two data sets
- The data was good enough for the IPCC to publish in 1990 in the FAR WG1, so it really can’t be called into question
- If Mike Mann can get away with splicing two dissimilar data sets in an IPCC report (proxy temperature reconstructions and observations) surely, splicing two similar satellite observation data sets together can’t be viewed as some sort of data sacrilege.
Of course the big inconvenient question is: why has this data been removed from common use today if it was good enough for the IPCC to use in 1990? Is there some revisionism going on here or is there a valid reason that hasn’t been made known/used in current data sets?
If any readers know where to find this data in tabular form, I’ll happily update the plot to be as accurate as possible.
Is revisionism going on with the date of the famous USS Skate photo in the Arctic?
It seems our favorite photo of the USS Skate has had it’s date revised.

Since yesterday was the anniversary of the March 17th surfacing of the USS Skate, WUWT contributor Ric Werme was interested in what the photographic conditions might look like on March 17th 1959 when the sun was just below the horizon, and so found a sub and attempted to recreate the photo conditions himself to see if the photograph was actually possible.
See: http://wattsupwiththat.com/2012/03/17/submarines-in-the-winter-twilight/
Turns out it was, but then he stumbled on something he didn’t expect to find. The date for the surfacing has been changed from March 17th, 1959 to August, 1958 (with no day given) in Wikipedia and in NAVSOURCE. He at first thought I’d made a mistake in citation, but it turns out dates have been changed since I wrote my original article on the USS Skate on April 26th, 2009.
I wrote about how the original date remains on NAVSOURCE in the Wayback machine
Anthony Watts says:
Navsource, in the Wayback machine, had it stated as March 17th 1959, just days before my original article. This is the April 18th 2009 snapshot from Wayback:
http://web.archive.org/web/20090418161606/http://www.navsource.org/archives/08/08578.htm
The caption then reads:
Skate (SSN-578), surfaced at the North Pole, 17 March 1959.
I remember checking NAVSOURCE for accuracy before publishing, my caption then says:
Skate (SSN-578), surfaced at the North Pole, 17 March 1959. Image from NAVSOURCE
History on that photo changed there at NAVSOURCE since then, probably due to alarmist pressure from Wiki etc. and other folks like Neven who went ballistic over the picture when I highlighted it. It is “inconvenient” in March (during peak ice season) but soothing for them in August (during near peak melt season).
The picture may have been taken a couple of days after the funeral photo in March alluded to upthread.
Se EM Smith comment in my original thread. http://wattsupwiththat.com/2009/04/26/ice-at-the-north-pole-in-1958-not-so-thick/#comment-122932
Oddly, NAVSOURCE now shows a caption of:

So what had been certain and unchallenged for years now all of the sudden is uncertain and may be in August 1958. Seems like a case of the tail wagging the dog.
Obviously there is a need to pin this date down, but I’m amused that so much attention has been brought to this photo since I first blogged on it.
BONUS: I’ve always said that the current drop in Arctic Ice Extent might have roots in soot from the industrialization of Asia causing an albedo change which really took off in the 1990’s, would show up in the summer melt season when solar irradiance is at a peak in the Arctic. Now it seems NOAA is taking Arctic soot seriously:
From the video description:
Small, new, remotely-operated, unmanned aircraft are being flown in the Arctic to measure black soot. The soot is produced by burning diesel fuel, agricultural fires, forest fires, and wood-burning stoves. It is transported by winds to the Arctic, where it darkens the surface of snow and ice, enhancing melting and solar warming. See http://saga.pmel.noaa.gov/ and http://www.pmel.noaa.gov/edd/manta.html
As always, check the latest sea ice conditions on the WUWT Sea Ice Reference page.
UPDATE: Robert Grumbine disputes some the the points related to the IPCC1 report and sea ice with EMMR equipped satellites here. – Anthony
August 1958, not 1959
REPLY: Yup. typo fixed, thanks – Anthony
Surely someone in the US Navy reads this blog?
It also seems that from about 1980-1990 the “old” data swings about the zero anomaly point. Eyeballing the present data from 1980-1990 the average is about +0.5 million sq kM. Were we remaking history back in 1990 at the IPCC to increase the past?
So it was up there in August 1958 and March 1959 and both times the water was basically Ice free.
LOL
As for Hiding the Incline prior to 1979, that is standard practice isn’t it.
Hide any data that would be inconvenient to have to explain.
I have been reading WUWT for a few years now and I have been perplexed about the Sea Ice average. Why is it averaged from 1979-2000? Why is it not 1979-2009, since 30 years is the “holy grail” of time periods for climate?
There is a book about the Skate’s voyage called “Surface at the Pole”. This is from one of the reviews on Amazon:
“Captain James F. Calvert describes tactics developed for operating in the Arctic Ocean during the summer. … the USS Skate was able to surface in a polynaya …. (the summer ice was to thin and weak for a plane to land on).
Polyanyas do not exist near the pole in winter so new tactics were required for a winter operation. Taking their clue from beluga whales, the sub was modified and tactics for winter arctic operations were developed during the 2nd cruise discussed. During this trip the USS Skate became the 1st ship to surface at the North Pole by breaking through the relatively thin ice that occurs when ice flows crack forming “leads”. In the winter these leads immediately start to re-freeze but the ice remains thin enough for a sub (modified for this task) to break through for over a week.”
Source: http://www.amazon.com/review/R3ICNLJ0XTXEQZ/ref=cm_cr_pr_perm?ie=UTF8&ASIN=0548388628&nodeID=&tag=&linkCode=
One interesting trend I notice with sea ice was that the years with high sea ice minimums tended to translate to cold and snowy US winters. This year and 2007 were the two lowest summer sea ice extents, and those winters that followed were relatively warmer. The two years with high summer sea ice extents, like 2009 and 2010 produced following winters that were cold and snowy, of course we remember the 09-10 winter being quoted as “snowmaggedon”. This year is currently running above all of these years and if we do get a high summer sea ice minimum, I would look towards a cold and snowy winter overall in the US. Maybe, these trends I’m seeing are coincidence or are they not?
Also from http://www.navalhistory.org/2011/08/11/uss-skate-ssn-578-becomes-the-first-submarine-to-surface-at-the-north-pole/
Graham P Davis says: (October 30th, 2011)
“USS Skate did indeed surface at the North Pole but not until 17 March 1959. Ice conditions in August 1958 were too heavy at the Pole for the Skate to surface, as they were for the Nautilus some days earlier. The Skate did surface in several other leads and polynya that August, including one near Ice-station Alfa. The above picture may have been from one of those.
When the Skate sailed for the Arctic the following year, the sail had been strengthened to allow it to break through thin ice. At the Pole, they eventually found a small, refrozen lead, or skylight, and managed to break through it. Later, many of the crew gathered for a service at which the ashes of Sir Hubert Wilkins were sprinkled in the wind. The temperature during this service was -26F (-32C).”
Anthony:
The following is found at Navsource.org regarding USS Skate (SSN 578). The warmists forgot to look farther down at the photo of Vice Admiral Calvert the following is the caption with his photo note that it says that Skate surfaced at the North Pole in February 1959. I included the entire biography for completeness.
“Vice Admiral James F. Calvert played a key role in developing nuclear submarine Arctic tactics during his tour as commanding officer of the Skate (SSN-578) from December 1957 to September 1959. Skate surfaced at the North Pole in February 1959. During this tour, Calvert also helped define the operational capabilities of the Navy’s first series-production class of nuclear submarine.
Originally from Cleveland, Ohio, Calvert graduated from the U.S. Naval Academy in June 1942 and from Submarine School in September of that year. He was awarded the Silver Star and the Bronze Star while serving aboard the submarine Jack (SS-259) during World War II.
He also served as executive officer aboard the Haddo (SS-255) in 1945. Following the war, he served as executive officer aboard the Charr (SS-328) and Harder (SS-568) and as commanding officer of the Trigger (SS-564).
Calvert served as Superintendent of the U.S. Naval Academy from 1968 to 1972.”
David O. Smith
Rogers, AR
I went to the Skate SSN 578 page in Wiki and rated it, lacks reputable sources. I suggest everyone do this. The rating input is at the bottom of the page.
http://www.navsource.org/archives/08/0857809.jpg
Maybe this confirms the original date?
Caption reads “Commemorative postal cover issued on the occasion of the Skate (SSN-578), as the first Submarine to surface at the North Pole, 17 March 1959.”
The ‘old’ John Daly site still exist:-. http://www.john-daly.com/ The following is based on a report on arctic ice dated 2nd Feb 2001. http://www.john-daly.com/polar/arctic.htm He gives the date for the surfacing of the Skate at the North Pole as ‘late March’ 1959, adding that it was a first to the North Pole. On the same voyage the Skate surfaced at 10 other locations finding open water or very thin ice. He also mentions that the Skate undertook a similar cruise in August 1958, but (since the surfacing at the North pole in March 1959 was a first) presumably NOT at the North Pole.
Verity Jones says:
March 18, 2012 at 10:15 am
“Also from http://www.navalhistory.org/2011/08/11/uss-skate-ssn-578-becomes-the-first-submarine-to-surface-at-the-north-pole/
Graham P Davis says: (October 30th, 2011)”
Thanks, Verity. Now, instead of citing this very plausible account, somebody has decided that it’s much better to simply falsify the historical record. CAGW science communication at its best…
There is a short piece on the voyage of the Skate at this eBay site. The picture shows the sub with fairly thin ice sheets draped over it. There is no date on it but it looks like Verity Jones’ ice lead breakout site.
http://www.ebay.com/itm/Submarine-USS-Skate-SSN-578-1959-Arctic-Voyage-/200678722636
Bernie
Brian Johnson Uk – Great find!
And… the Wiki article on the Skate itself goes into great detail: http://en.wikipedia.org/wiki/USS_Skate_%28SSN-578%29
Skate surfaced through ice: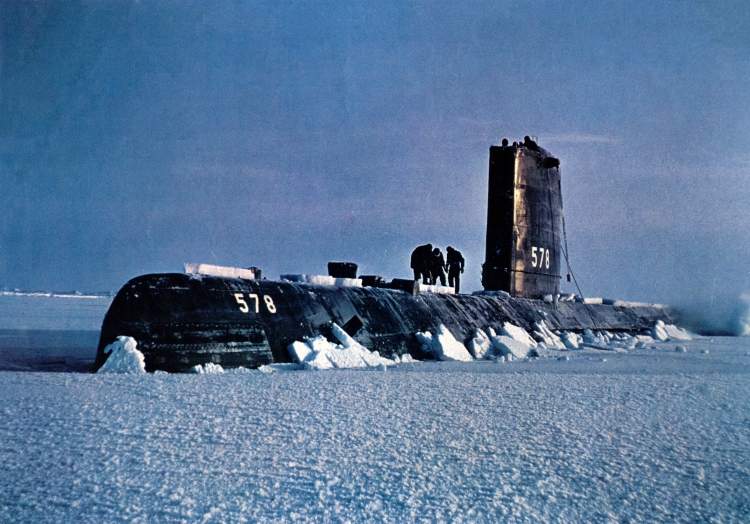
Incorporating the 1974-1978 data would significantly change the running norm. Say 1974-2000.
And i agree that there seems to be no predictive value in winter ice growth versus summer recession.It would be interesting to graph sea surface temperatures versus ice extent (individual years, not normed), to see if that lends some information as to the probability that soot is an important factor in summer melt.
The top picture here http://americanhistory.si.edu/subs/work/exploring/exploration/index.html is cited as the North Pole surfacing of the Skate. As you can see the sub has ice draped over it.
Quote
“On March 17, she surfaced at the North Pole to commit the ashes of the famed explorer Sir Hubert Wilkins to the Arctic waste. When the submarine returned to port, she was awarded a bronze star in lieu of a second Navy Unit Commendation for demonstrating ” … for the first time the ability of submarines to operate in and under the Arctic ice in the dead of winter … .”
From here:
http://www.submarinesonstamps.co.il/History.aspx?h=215
“why has this data been removed from common use today if it was good enough for the IPCC to use in 1990?”
It’s just another example of team CAGW Zohnerism. Noticing these convenient start and end dates and comparisons is what lead me to become a skeptic. Back then (1994) there was no WUWT. How did I ever get by without WUWT? How has a movement that is contingent upon consideration of only a particular subset of available data to make any sense at all lasted so long? It’s like we’ve lost the ability to critically analyze a presentation (sales pitch) to any degree at all.
A quick search in newspaper archive.
I found a United Press report from March 7, 1958 reporting the completion of a crossing of the Arctic by the Skate “almost entirely underwater”.
I also found a news report on August 13, 1958 reporting the completion of a second crossing of the Arctic by the Skate, the crossing by the Nautilus in the opposite direction having been reported a few days earlier. This report says that the Skate surfaced 40 miles from the North Pole to report its position.
Isn’t this correction in the post also needed : August, 1959 to August, 1958?
“Turns out it was, but then he stumbled on something he didn’t expect to find. The date for the surfacing has been changed from March 17th, 1959 to August, 1959 (with no day given) in Wikipedia and in NAVSOURCE. He at first thought I’d made a mistake in citation, but it turns out dates have been changed since I wrote my original article on the USS Skate on April 26th, 2009.”
REPLY: Yep, too early, not enough coffee, kids needing breakfast all conspired to make this post be written in segments of attention. Thanks for catching that, will fix – Anthony
Here’s a link to the photp provided by Alan Cheetham in an earlier WUWT thread.
http://www.appinsys.com/GlobalWarming/RS_Arctic.htm
I have the photo on my PC with the filename “uss-skate-open-water march 1959.jpg”
Anthony, you can combine the IPCC FAR WG1 Figure (a) and UUIC Cryosphere Today Arctic extent anomaly graph, but keep in mind that they both have different baselines.
““USS Skate did indeed surface at the North Pole but not until 17 March 1959. (…) At the Pole, they eventually found a small, refrozen lead, or skylight, and managed to break through it. Later, many of the crew gathered for a service at which the ashes of Sir Hubert Wilkins were sprinkled in the wind.”
An image of the ceremony can be found here. Maybe show it in an update or in the next Arctic sea ice blog post?
REPLY: Well aware of that photo, but I’m interested in nailing down the date on the one in question, not substituting another you would prefer – Anthony
Scrubbing the internet is on ongoing issue. Always save a screen shot of something found that may be historically important in your view. Having written many aeronautic safety papers, I always kept the screen shot as well as the web site address. It is amazing how may of the sites are no longer up or the article is gone missing from the site. Not all of this is devious behavior, but a function of server space or just cleaning what does not receive hits. On the other hand, some of the scrubbing is for political control. It is important as Anthony points to in this post to reveal such things around subjects that are being used to persistently drive some creepy dude agenda.
Here’s to holding their feet to the fire. Prost!
And, it gets better than that. Steve also has a climate assessment from the CIA in 1974 talking about a 10-15% increase in the ice. http://www.climatemonitor.it/wp-content/uploads/2009/12/1974.pdf Contrast that to NOAA’s representation of ice extent prior to the satellites….. and then try and figure out how some cartographers knew where to put some islands (circa 1875) that by all reckoning, if our ice extent was as stable and massive as they insinuate…… both NOAA’s representation and old map may be found here…… http://suyts.wordpress.com/2012/03/12/how-did-they-know/
I’m off to study the trig and calculus of spheres on planes with reflective boundaries…….
> Why is early satellite data for Arctic and Antarctic Ice extent referenced in the first IPCC report missing from today’s data?
Because it became clear that the data from the different instruments can’t be merged; the ESMR stuff is incompatible with the SSMR. http://nsidc.org/data/nsidc-0077.html perhaps.
REPLY: Ah the king of Wiki revisionism speaks. I’ll have to disagree. The folks at NSIDC are putting together an almost continuous record of sea ice to 1961 from satellite, they are pulling up old imagery and data, even going so far as to find old equipment to play it back. So they must be able to make use of it. Since you guys on the Team love “adjustments” so much, it would seem straightforward to come up with an adjustment to address such incompatibilities.
We’ll see how it pans out – Anthony
Anthony,
I was pleased to see that you didn’t have to hide the decline when you combined the two figures to come up with the sea ice anomaly from 1971 to present.
Skate (SSN-578), surfaced at the North Pole, 17 March 1959.
I can not find that.
Skate does not appear to have been there in 1959.
The Northwest Passage: Arctic straits By Donat Pharand, Leonard H. Legault
Published 1984 (History)
Page 148. Table 6.
Known Submarine Opeations in the Arctic (1931-1893)
Aug 1958, USS Skate, Trasnsit of Arctic Ocean and Surfacing.
Also.
First person (Raymond Aten) interview trascript
http://lcweb2.loc.gov/diglib/vhp/story/loc.natlib.afc2001001.23457/transcript?ID=sr0001
Also the Aug 1958 date.
Interview with Raymond Aten [5/30/2004]
“That’s a hard question. There’s a lot of, I think probably got to go with Zapter (ph) War and nuclear powered submarines. I put the USS Skate in commission, the third nuclear power submarine back in ’78 and putting shake down and everything and August, August the 5th — 5th — 12th, 1958, we went to the North Pole. First submarine ever to surface at the North Pole. And we had met the Notlets (ph) at the same time we left the West coast coming to the East coast under the ice, completely submerged. First time ever a submarine had been surfaced at the North Pole. They’d come out and we’d follow them in. And we surfaced nine times through the ice and found this Ice Station Alpha there which was there and that was where they announced to the world that the USS Skate was surfaced at the North Pole.
”
This 1967 navy film puts Skate (and a buch of other submarines) there in there in 1958 and 1960
12:10 to 13:00 are relevent.
Here is a non-wikipedia reference to Sir George Hubert Wilkerson referencing some time in March being when his ashes were scattered at the North Pole.
http://adb.anu.edu.au/biography/wilkins-sir-george-hubert-9099
It would appear that there is ‘actionable evidence’ for revisions being made to history to placate the proponents of AGW. So there are written documents giving the dates but the revisionists who only really understand the Internet have changed several areas in an attempt to ‘win’ an argument.
This cannot be allowed to continue surely there is some ‘keeper’ of Navsource’ that could be formally warned to correct the revision. Similarly, the of Wikipedia revision could be used as a ‘cause célèbre showing yet again the lack of ethics of AGW proponents.
What is normal. The only thing that is NOT normal are the last 10.000 years.
Normal is warmer.
http://c3headlines.typepad.com/.a/6a010536b58035970c0162fdd74ba3970d-pi
or
Normal is colder.
http://c3headlines.typepad.com/.a/6a010536b58035970c01538f886886970b-pi
Arghhh. I’m punchy today.
His last name is Wilkins not Wilkerson.
Two videos one possibly of the event in question:
Atom sub at pole 1959
http://www.britishpathe.com/video/atom-sub-at-pole
Atom subs meet at pole 1962
http://www.britishpathe.com/video/atom-subs-meet-at-north-pole
Arctic ice % of normal = 13.449 divided by 14.053 = 95.70%
Antarctic ice % of normal = 2.695 divided by 2.431 = 110.86%
Averaged together as a grade that comes to 103.28% which is an A+ in college.
I don’t see a crisis.
“forecasting based on this peak might not yield any skillful ice minimum forecasts.”
I think that is what people need to keep in mind. I don’t think the maximum extent is nearly as important as the minimum extent. We will see, for example, a rather significant increase this year in 4yo ice. This is due to last year’s significant increase in 3yo ice. Also, the wind patterns this year have been such that the ice has been packed tighter. This can mean thicker ice that lasts longer this summer but we will have to see how things play out. The problem with Arctic ice is that if floats and because it floats the wind plays a huge role in what happens to that ice. The wind can, as it did in 2007, blow an unusually large amount of ice into the Atlantic during the summer. Or the wind can keep the ice fast against the Asian or North American continent. More storms than usual can break up ice earlier, fewer storms and calmer seas can mean ice lasts longer. So it really depends on the fickle weather and the fickle sea conditions more than it depends on temperature.
Has anyone in the AGW camp chirped up an explanation for the minimum in 2007? Clearly not a long-term CO2 / Global Warming Trend at work. Is this another example of “‘natural variablility, but the long-term trend will be obvious..er..any year now.”?
On historical sea ice extents: Is it not possible to take just one year from the first half of the 20th Century (preferably one in which journalists were warning of a Hansenesque submerging of New York) and collate all the shipping observations to try to get a good snapshot of that year? This would surely cost a small fraction of the funds consumed weekly by the Computer Models, and would just take a few slaves – oops, grad students – to research. As you point out, the absence of real data used prior to 1979 is a travesty. Especially when we are told about the ‘unprecedented decline’ of sea ice, and we can’t go back more than 30-odd years.
Anthony. re: USS Skate. I noticed the dates on Navsource.org didn’t mesh when surfing around just after your last post on this but just thought your info was better than was available at the site, not that anything sly had happened. I would have made a crummy detective!
Oh, I forgot….
Increasing ice and snow at the poles is caused by the warming…
Yeah well there’s the crisis… a belief-brain freeze by climate science.
Open your eyes guys. All is well.
Does the log book for the Skate still exist? I bet it does in US Navy archives somewhere.
http://www.hazegray.org/danfs/submar/ssn578.txt
On 17 March, she surfaced at the North Pole to commit the
ashes of the famed explorer Sir Hubert Wilkins to the Arctic
waste. When the submarine returned to port, she was awarded
a bronze star in lieu of a second Navy Unit Commendation for
demonstrating “. . . for the first time the ability of
submarines to operate in and under the Arctic ice in the
dead of winter . . .”
Anthony– This is off thread, but I don’t know how else to inform you. There’s a movie out called “Windfall” that’s critical of wind farms. I haven’t seen it myself, but here’s where you can find a review: http://seattletimes.nwsource.com/html/movies/2017636820_mr02windfall.html
[REPLY: Maxbert, at the bottom of the WUWT banner on each page is a tool bar that includes a Tips and Notes page. Please submit things like this there. Thank you. -REP]
I haven’t read every thread or comment but it seems the Skate was there on several occasions.
When there was both ice and clear water.
It would seem logical that the March surfacing was when Ice had to be there and that on an August surfacing it was clear of ice.
Is it even fathomable that there would be no ice in any March?
Whoever took the photo would have left the sub. I can see in the updated photo (where the sub is covered with ice) that it is possible to walk out onto the ice. But how did the photographer get away from the sub in the first photo (not much ice) to take the shot? Do they have portable dingys on board?
Plus, you need someone from the photo to verify its date if the sub surfaced multiple times in both summer and winter as seems to be the case. The caption should be updated to “some time in 1958 or 1959”.
The Wikipedia entry for James F. Calvert, Captian of the Skate, (read it quick before someone changes it) states: “The Skate went under the North Pole on August 11, 1958, and became the first to surface near there when it found a lead of open water and surfaced to report its success by radio.”
Note the use of the word “near” not “at” the North Pole.
It then continues: “The following year, after traveling 3,000 miles (4,800 km) to the pole in 12 days, the Skate became the first submarine to surface through the ice when it reached the North Pole on March 17, 1959.”
Maybe someone could research library old newspapers , around the above mentioned dates .
Google still has not revised their information and state that Sir Hubert Wilkins ashes were scattered in the Arctic by USS Skate on March 17, 1959.
From NIC :
Data Sources:
The global sea ice analysis effort at the NIC requires the fusion of many data sources having widely varying scales, capabilities and resolutions. Theses operational data sources have evolved over the years and can be grouped into the following categories: satellite data, ship and shore station reports, aerial ice reconnaissance observations, drifting buoy reports, data and analyses from other national and international ice centers, and climatology. During the 1950s and 1960s, sea ice information was gathered almost exclusively from visual observations from US Navy aerial reconnaissance missions and from observations reported by ships at sea or shore stations. At that time, ice analyses were typically done only in direct support of ships operating in the ice. In 1972, newly acquired visual and infrared imagery from NOAA weather satellites were combined with aerial reconnaissance data to give the NIC the capability to produce weekly Arctic sea ice analyses year ‘round. Today, approximately 85 percent of the data used for sea ice analysis are satellite-derived products. The two largest sources of satellite data are AVHRR aboard the TIROS series of satellites and OLS aboard the US Air Force DMSP satellite series. Both provide imagery in the visible and infrared portions of the spectrum. AVHRR data has a 1.1 km resolution and is received in both the HRPT and LAC transmission modes on a daily basis. DMSP OLS Fine has a 0.55 km resolution and is received daily at the NIC. ERS-1 SAR data also provided a small and infrequent contribution to the overall composited global analyses from 1992 – 1994.
============================================================================
That seems to imply they have satellite data back to 1972. Interesting.
The following ‘retro’ page from the The Polar Science Center website models the sea ice volume back to 1948.
http://psc.apl.washington.edu/zhang/IDAO/retro.html#Satellite_ice
They estimate there was much less sea ice volume in the 1950’s- similar to today.
Seems indeed that somebody tried to alter the dates. Here is something interesting :
http://www.navsource.org/archives/08/0857809.jpg
Caption :
“Commemorative postal cover issued on the occasion of the Skate (SSN-578), as the first Submarine to surface at the North Pole, 17 March 1959. ”
By the way, lots of interesting photos about the skate here : http://www.navsource.org/archives/08/08578.htm
This might help.
It splices the pre and post sattelite data sets.
—-
An Analysis of Arctic Sea Ice Fluctuations, 1953–77
John E. Walsh and Claudia M. Johnson
Laboratory for Atmospheric Research, University of Illinois, Urbana 61801
Abstract
Arctic sea ice data from the 1953–77 period are digitized onto a set of 300 monthly grids covering the polar cap. Each grid contains 1648 ice concentration points at a spacing of 1° latitude (60 n mi). The synthesis of the regional ice data sets is described.
The digitized data are used to evaluate quantitatively the normal seasonal cycle of ice extent, the 25 year extremes for winter and summer, and the longitudinal dependence of the variance and trend of ice extent. Interannual variations of ice extent exceeding 5° latitude are found at most longitudes. The time series of total Arctic ice extent shows a statistically significant positive trend and correlates negatively with recent high-latitude temperature fluctuations.
Received: August 8, 1978; Accepted: October 26, 1978
http://journals.ametsoc.org/doi/pdf/10.1175/1520-0485%281979%29009%3C0580%3AAAOASI%3E2.0.CO%3B2
Here is a near surface map of temperature which shows a temperature of -25 C (-13 F) near the North Pole on 17 March 1959:
http://www.atmos.washington.edu/marka/1959031718.1000mb.temp.gif
Open water would be very unlikely in mid March of any year including 1959 given a likely temperature well below zero F. 17 March is only about 2 weeks beyond the date of lowest temperature in the deep Arctic in a normal year. In fact, if you take a look at Alert at the far northern end of Ellesmere Island you will see monthly normal temperature varies little from January through March at the peak of winter chill:
http://www.atmos.washington.edu/marka/west/yt/yt.normals.html
I think it is much more likely this picture was taken during the August 1958 cruise to the Arctic and was later mislabelled somehow.
-Mark Albright
Arctic Ice Dynamics Joint Experiment (1974-1978)
There is an article in the January 1959 National Geographic covering the historic 1958 trips of both Nuatilus and Skate.
Page 21
” …that superb atomic submarine in attaining her “first”: a west-to-east crossing of the Arctic via the North Pole, August 1-4, 1958.
One week later the nuclear-powered Skate appended a highly significant chapter to our own tale of exploration. On August 11, captained by Comdr. James F. Calvert, she became the second vessel in history to reach the Pole, entering and departing the Arctic Ocean by the Atlantic side.
Skate surfaced several times in open leads in the ice pack, once within 40 miles of the Pole, and another time directly in front of the manned IGY Drifting Station Alpha on a huge ice floe.”
Sorry, should have been Nautilus
Even more interesting, there you hava actually two distinct polar cruises, an easy one in summer 1958, and a not-so-easy one in 1959. In both cases Skate surfaced at the pole severa times :
http://www.northofseveycorners.com/history/skate.htm
“In August 1958, SKATE made her first cruise to the Arctic where she operated under the ice packs for ten days. During this period she surfaced nine times through openings in the ice, became the second ship to reach the North Pole, and successfully navigated over 2,400 miles beneath the ice. On her return to the United States, the ship was awarded the Navy Unit Commendation for “… braving the hazards of the polar ice pack…”
In March 1959, SKATE again headed north, this time to pioneer arctic submarine operations during the period of extreme cold and maximum ice thickness. In twelve days under the pack, SKATE forced her was up through the thin ice to the surface ten times and steamed over 3,000 miles. In a dramatic high of this cruise, on March 17, 1959, SKATE became the first submarine to surface at the North Pole… Where the ashes of famed explorer Sir Hubert Wilkins were committed to the arctic waste. On her return to port, SKATE was awarded a Bronze Star in lieu of a second Navy Unit Commendation for demonstrating “…for the first time the ability of submarines to operate in and under the arctic ice in the dead of winter…” “
Go here…..
http://www.natice.noaa.gov/products/products_on_demand.html
……and click on “Arctic weekly”. The charts go all the way back to January 1st. 1972. Appears to be a pretty complete record too.
17 march 1959 seems confirmed – The US Navy should have a lot of pre-satelite arctic ice data complied during all these polar voyages. The abilty to surface in all seasons was crucial for the mission – firing missiles towards USSR.
http://www.history.navy.mil/danfs/s13/skate-ii.htm
Last but not least, John Daly had it too, and with a winter 1959 photo as an illustration :
http://www.john-daly.com/polar/skate.jpg
Photo taken from US Navy archive :
http://www.csp.navy.mil/asl/ScrapBook/Boats/Skate1959.jpg
Caption :
“Fig.6 – USS Skate during an Arctic surfacing in 1959. (US Navy Photo)”
Reference :
http://www.john-daly.com/polar/arctic.htm
Skate-related section :
“As early as 1959, the first US submarine to surface at the North Pole, the USS Skate, did so in late March, and surfaced at 10 other locations during the same cruise, each time finding leads of open water or very thin ice from which to do so. It did a similar cruise a year earlier in August 1958, again finding numerous open leads within which to surface. Here is a photo of the Skate during one of its surfacings in 1959. As can be seen in all three photos, the flat new ice is scarcely different between 1959 and 1999, while the 1987 photo shows the extent to which open water can occur.”
Bob B says:
March 18, 2012 at 10:02 am
As Bob noted, eyeballing the stitched graph suggests that the scaling is different in that the ice extent was relatively underestimated in the prior-to satellite records. Which seems reasonable.
The impact of different scales or ability to estimate extent, however, AGAIN works in the alarmists favour. The range of change is much greater when both growth and loss are underestimated. If you were to scale up the pre-1979 data so that the 1977-1979 time looked like the 1979-1981 range style,
I’ve photoshopped the image to at least LOOK like it fits the post-79 data. Now it looks like the Arctic sea-ice extent did not dip below the 1972 level until 2005. Which means we have only 7 years of “anomalously” low extent.
The issue of start date is, by this crude thinking-it-through, of supreme importance to the sea-ice debate of the Arctic. Whatever cyclicity exists to sea-ice waxing and waning – of course the CAGW assumption is that prior to ’79 the Arctic sea-ice was stable to the terms of +/-1.0E6 km2, it appears that we have not have a full-cycle historical dataset.
I will post this image to my website (if I can figure it out, being only the second attempt).
The winter surfacing at the North pole was described in May 1959 in Life magazine, by the captain. From his account is is clear that there was enough water to surface a nuclear sub.
http://books.google.com/books?id=YEgEAAAAMBAJ&lpg=PP1&pg=PA130#v=onepage&q&f=false
To help set the record straight, the Universal Ship Cancellation Society http://www.uscs.org/
records at http://www.uscs.org/collectingtopics/submarine/submarine4.htm
Collecting Submarine Covers – Page 4 of 4 by Ned Harris (USCS # 3608)
The photo shows the official date on the cancellation stamp.
I would like to thank William M. Connolley for showing up here, observing local guidelines regarding civility and on-topic posts, and attempting to engage the science and not the politics.
I’d like to thank the moderators for allowing him to hold that presence.
I’d ask comments to respect civility guidelines when responding to Mr Connolley.
I’d remind those interested what happened when, and after, Judy Curry began to engage the denizens at Steve McIntyre’s “Climate Audit” page.
I challenge all who, like me, have doubts about one or another aspect of the conventional consensus regarding catastrophic unprecedented anthropogenic global climate change to see our mission as changing Mr Connolley’s mind on that topic; not destroying his general opposition.
And that said, meant, and documented…
Why, in principle, CAN’T early records of one or more types (say, tree ring density, varve thickness, etc) be harmonized (I won’t say “spliced”, that would be a non-sensible thing to do) with later records of other types? If in principle the harmonization is possible, why has the IPCC made the decision not to make an attempt in this case? Are you saying the IPCC lacks technical skill? Are you saying the Ford administration was unreliable in data-gathering? Please elaborate on your conjecture.
looks like if NSIDC included 2001-2008 (making it a full 30 period) in their ‘average’ period, current ice levels would be well into the normal and maybe even above-normal range. Its the same with NORSEX choosing a rather strange cutoff date for their average period (2006).
have you ever contacted them Anthony to ask why they dont use at least 30 years of data now that its available?
“Skate” was in the arctic in both Aug. 1958 and Mar. 1959. Excerpt from a scan of the Encyclopædia Britannica, 1962 ed., vol. 2, pp. 306a, “ARCTIC”: http://twitpic.com/8y5h2y/full
Navsource has an enlarged image of the commemorative stamp of the USS Skate March 17, 1959 North Pole
http://www.navsource.org/archives/08/0857809.jpg
So no death spiral then?
And the July 1959 National Geographic covers the Skate winter trip to the Arctic.
Skate surfaced at the Pole 10:54 GMT March 17.
There are a number of photos in this article showing Skate surfaced though the ice. The ice seems to vary in thickness between 6″ and 9″. This is not the overall ice thickness but places of thinner ice. Photos on pages 14 & 15 show Skate at the Pole, but it is hard to work out how thick the ice is.
Sorry to spoil your fun but that splice is wrong by about half a million square kilometers baseline shift. Take a look:
Your version: http://i43.tinypic.com/igwx2v.png
My version: http://i41.tinypic.com/5ulpu8.png
It’s still good to know it was lower sometime in the past but 1975 was not really below 1992 and later values.
Eric says:
March 18, 2012 at 10:08 am
I have been reading WUWT for a few years now and I have been perplexed about the Sea Ice average. Why is it averaged from 1979-2000? Why is it not 1979-2009, since 30 years is the “holy grail” of time periods for climate?
Actually, it should now end in 2010. Ending date for “normals” will have a zero.
To do this means the average gray line and gray area in Anthony’s first graphic (cut and pasted from NSIDC) would be lower – and more embarassing to the “cause” – because an average is highly influenced by the outliers, for example, the warmists’ favorite year 2007.
Hope that answers your question. John
Warming makes for more ice.
http://en.wikipedia.org/wiki/Lewis_Gordon_Pugh
“”Arctic kayak
In September 2008, Pugh, accompanied by a team aboard a ship where he slept, attempted to kayak the 1200 km from Svalbard, across the Arctic Ocean, towards the North Pole, but team abandoned the effort 135 km from the start.[14] The aim was to further highlight the melting sea ice. The expedition coincided with some scientists predicting that the North Pole could be free of sea-ice in the summer of 2008, for the first time in thousands of years.[15] Pugh stated that despite several attempts, they were unable to find a gap in the ice. In 2002, Thomas and Tina Sjogren had skied and swam their way to the North Pole without any external support.[16] In his autobiography Pugh wrote:
“Ironically, global warming played no small part in undermining the entire expedition. We believed that the greater melting of summer ice would open up large areas of sea and allow us to paddle north at good speed. What we did not fully appreciate was that to the north of us there was a widespread melting of sea ice off the coast of Alaska and the New Siberian Islands and the ice was being pushed south towards us … The evidence of climate change was stark. Fourteen months before I’d sailed north and I’d seen a preponderance of multi-year ice about three metres thick north of Spitsbergen, but this time most of the ice was just a metre thick.”[17]””
From: The Papers of Sir George Hubert Wilkins at The Ohio State University
Anthony
Here are two further photos of the USS Skate (#578)at the North Pole after stating:
USS Skate surfacing at the North Pole, March 17, 1959. Wilkins 35-5-1.
Crew of the USS Skate during the memorial ceremony for Wilkins on March 17, 1959. Wilkins’ ashes were scattered over the Arctic ice. Wilkins 35-5-4.
T Gough says:
March 18, 2012 at 10:19 am
“He also mentions that the Skate undertook a similar cruise in August 1958, but (since the surfacing at the North pole in March 1959 was a first) presumably NOT at the North Pole.”
That’s probably the reason why they now claim that the picture was taken in 1958, so that it couldn’t have been taken at the North Pole…
Kasuha, this splice looks wrong by eyeball but to me the ordinate scale looks expanded on the right.
The BBC are showing a PIOMAS graph indicating a possible ice free arctic by 2015.
http://www.bbc.co.uk/news/science-environment-17400804
Climate ‘tech fixes’ urged for Arctic methane
This is from page 224 of IPCC FAR WG1 which you can download from the IPCC here
Here’s the relevant part, the actual individual chapter 7:
http://www.ipcc.ch/ipccreports/far/wg_I/ipcc_far_wg_I_chapter_07.pdf
Presented for those with a slow connection, and this chunk alone is 4.7MB.
USS SKATE SSN-578 Submarine Color Cachet 50th NorthPole (In philately, a cachet is a printed or stamped design or inscription, other than a cancellation or pre-printed postage, on an envelope, postcard …)
There are two postmarks: 17 MAR 1959 = SKATE = 17 MARCH 2009
It is the ice encrusted photo. See it here: http://www.ebay.com/itm/USS-SKATE-SSN-578-Submarine-Color-Cachet-50th-NorthPole-/360248275767?pt=LH_DefaultDomain_0&hash=item53e0787337
Puzzled
“■Arctic Sea Ice on the rise again, presently in the range of normal levels”
I assume you mean in the range of the 1979-2000 average…
How do you know that range gives “normal levels” ???
How do you know that the range say 2000-2009 isn’t the normal level ?
A few weeks back in this thread there was this intriguing comment:
Sounds like a possible primary source. If you are still reading this thread could you elaborate on his status? If he is still with us perhaps you might arrange for an interview of him on the record so he can at least get his important eyewitness experience documented! Maybe he has his own private photos.
ZT says:
March 18, 2012 at 12:17 pm
The winter surfacing at the North pole was described in May 1959 in Life magazine, by the captain. From his account is is clear that there was enough water to surface a nuclear sub.
Actually from that account it’s clear that there was no water: “It took two hours of careful manoevering before at last our sail buckled the ice at the precise top of the world.”
From his descriptions of the March 1959 Arctic cruise all of the surfacings were through ice and the photo from the original post: http://wattsupwiththat.files.wordpress.com/2009/04/uss-skate-open-water.jpg?w=640
can’t be from that cruise but most likely from the previous summer’s cruise, possibly even taken from the floating station they met then. Here’s a contemporary newspaper article about the 1959 cruise.
http://news.google.com/newspapers?nid=1955&dat=19590327&id=JhQrAAAAIBAJ&sjid=upsFAAAAIBAJ&pg=6271,4829110
@Andrew30
Eyeballing the graph in your link leads to an average max of 14 million square km and an average min of 7 million square km for the ’53-’77 era (without error bars). This compared to current max average of 15.5 and 7.5 min (NORSEX ’79-’06). Of course, the methods are different so I guess this is comparing apples with oranges. But still interesting.
Stephen Skinner says (March 18, 2012 at 1:14 pm)
“The BBC are showing a PIOMAS graph indicating a possible ice free arctic by 2015.”
——–
BBC = Richard Black, showing the most alarmist info he can possibly find, in this case doubtless borrowed from a Guardian doom story:
http://www.guardian.co.uk/environment/2011/sep/11/arctic-ice-melting-at-fastest-pace
PIOMAS = another GIGO computer *MODEL* at the U. of Washington (Pan-Arctic Ice Ocean Modeling and Assimilation System (PIOMAS) at the Polar Science Center).
Although I may get an answer to one of my earlier questions from the Polar Science Centre:
Schweiger, A.J. , J. Zhang, R.W. Lindsay and M. Steele,’ Did unusually sunny skies help drive the sea ice anomaly of 2007′, Geophysical Research Letters, Vol. 35, L10503, doi:10.1029/2008GL033463, 2008.
Blimey! Sunny days = melting ice? Whodathunkit?
Anthony.
The NSIDC and Walt Meir’s group has now released sea ice extent going back to 1964 from Nimbus I, II, and III data. A couple of years ago someone found virtually all of the AVCS images from Nimbus (visible light). These were discovered in a room open to the weather at the National Records Center at Suitland Maryland and these are being put in mosaics that have 400 meter resolution on the ground.
There is also a NASA publication, I think the number is SP-489 that shows sea ice extent on a monthly basis from 1973-1976.
The folks at NSIDC are putting together an almost continuous record of sea ice to 1961 from satellite. There is far more of this information in existence than is commonly known. The folks at NSIDC are doing a good job in tracking this down and some of it has been released in peer reviewed publications.
You would really love the daily Nimbus HRIR stuff that shows hurricane tracks, and the first estimate of the global temperature came from the HRIR data from Nimbus II!.
REPLY: I found the reference to the SP-489:
Parkinson, C. L., J. C. Comiso, H. J. Zwally, D. J. Cavalieri, P. Gloersen, and W. J. Campbell. 1987. Arctic sea ice 1973-1976: Satellite passive-microwave observations. NASA Spec. Publ. SP-489. 296 p.
Now I just have to find the actual document – Anthony
UPDATE: Found it, http://ntrs.nasa.gov/archive/nasa/casi.ntrs.nasa.gov/19870020588_1987020588.pdf
Reading it now – Anthony
So… there is a bit of contention about when the Skate was surfaced.
FOIA may not be needed if some one can get ahold of the Deck Log.
If they were on the surface, the Deck Log will show it.
http://www.history.navy.mil/faqs/faq73-1.htm
And then there is this:
March 17
1898 – USS Holland, first practical submarine, launched
1942 – United States Naval Forces Europe established to plan joint operations with British
1958 – Navy Vanguard rocket launches 3.25 pound sphere from Cape Canaveral
1959 – USS Skate (SSN-578) surfaces at North Pole
Ref. http://www.history.navy.mil/wars/datesmar.htm
cheers,
gary
Anthony,
I’ve been looking for the possible source of the NOAA data from a FAR reference. Found this list:
http://climate.rutgers.edu/snowcover/pubs.html
It contains the reference:
Wiesnet, D.R., C.F. Ropelewski, G.J. Kukla & D.A. Robinson (1987)
A discussion of the accuracy of NOAA satellite-derived global seasonal snow cover
measurements. Large Scale Effects of Seasonal Snow Cover, International Association
of Hydrological Sciences Publication 166, 291-304.
The important part, it also has this listed:
Pielke, R.A., Sr., G.E. Liston, W.L. Chapman & D.A. Robinson (2004)
Actual and insolation-weighted Northern Hemisphere snow cover and sea-ice between
1973-2002. Climate Dynamics, 22, 591-595.
So it appears Dr. Pielke Sr could help with pre-1979 Arctic sea ice data, possibly NOAA satellite data.
GeoLurking says:
March 18, 2012 at 1:45 pm
“So… there is a bit of contention about when the Skate was surfaced.
FOIA may not be needed if some one can get ahold of the Deck Log.”
I hear they’re still working on “scanning” it… expect a multi-layered PDF RSN…
Wow–in Figure 5 the sea ice in 1960 took a huge dip—making 2007 look small!
http://journals.ametsoc.org/doi/pdf/10.1175/1520-0485%281979%29009%3C0580%3AAAOASI%3E2.0.CO%3B2
USS Sargo SSN-583 surfaced 25 feet from North Pole at 1049 hours on 9 February 1960 through 36 inches of ice. Ship’ log. Website USS Sargo
http://web.archive.org/web/20071024145541/http://nwpi.krc.karelia.ru/climas/Ice/Ice_no_sat/XX_Arctic.htm
Two prominant photos keep repeating, one black and white, one colour. It is interesting that the ice on the deck appears to be about the same thickness in both.
I was eagerly hoping that WUWT would post this important item which I first saw on Goddard’s website. I was amazed to learn that pre-1979 sea ice records existed and how the IPCC removed it from subsequent reports.
Hide the Medieval Warm Period, hide the decline and hide early 1970s Arctic ice extent.
Anthony, your splicing sir is not hiding but revealing. 😉
http://www.real-science.com/ipcc-early-1970s-arctic-sea-ice-persistently
http://www.real-science.com/arctic-fraud-worse
Hull number gives a short history of Skate; http://www.hullnumber.com/SSN-578
On 30 July, Skate steamed to the Arctic where she operated under the ice for 10 days. During this time, she surfaced nine times through the ice, navigated over 2,400 miles under it, and became the second ship to reach the North Pole. On 23 August, she steamed into Bergen, Norway. The submarine made port calls in the Netherlands, Belgium, and France before returning to New London on 25 September 1958.
In the following months, Skate, as the first ship of her class, conducted various tests in the vicinity of her homeport. In early March 1959, she again headed for the Arctic to pioneer operations during the period of extreme cold and maximum ice thickness. The submarine steamed 3,900 miles under pack ice while surfacing through it 10 times. On 17 March, she surfaced at the North Pole to commit the ashes of the famed explorer Sir Hubert Wilkins to the Arctic waste. When the submarine returned to port, she was awarded a bronze star in lieu of a second Navy Unit Commendation for demonstrating … for the first time the ability of submarines to operate in and under the Arctic ice in the dead of winter . . . In the fall of 1959 and in 1960, Skate participated in exercises that were designed to strengthen American antisubmarine defenses.
Phil. says:
March 18, 2012 at 1:28 pm
ZT says:
March 18, 2012 at 12:17 pm
“The winter surfacing at the North pole was described in May 1959 in Life magazine, by the captain. From his account is is clear that there was enough water to surface a nuclear sub.”
“Actually from that account it’s clear that there was no water: “It took two hours of careful manoevering before at last our sail buckled the ice at the precise top of the world.””
That appears to be correct. The August 58 surfacing were through openings in the ice and the Mar 59 were through places of thin ice. They knew that March was the worst time to find somewhere to surface due to the expected thickness of the ice. However, they used upward facing TV cameras to look for thin ice and to monitor the ‘sail’ as it came into contact with the ice. Of interest to the sailors was the relative warmth of the water below the ice and how everything froze when they broke through to the surface. When they submerged again ice formed on the surface of the sail under the ice in the warmer water. While the submarine was surfaced it’s surface was cooled by the -30 outside air and when it sank into the ‘warmer’ water this water then froze to the sub. They could see this on the TV monitors.
Surface At The Pole http://www.amazon.com/Surface-At-The-Pole-Extraordinary/dp/1166128768/ref=sr_1_1?s=books&ie=UTF8&qid=1332103197&sr=1-1 , written by the Captain of the USS Skate makes it clear that the USS Skate did surface at the North Pole in Mach but also that the photo often presented (with clear water around the sub) was NOT taken in the winter. Most like it was made on the Skate’s 1st trip to the Arctic to developed summer tactics.for operating under the arctic ice.
A second trip was made in the winter. A sub-goal was to surface at the N pole and deposit ashes of an Arctic explorer. That was a long shot. Here is how it was done. First the sub was outfitted to crash through thin ice (perhaps up to a foot thick). The ice flows are about 12′ thick but they are “flows” and the drift with the current so cracking (called leads) is normal. These cracks were identifiable via an “up-looking sonar” and though they immediately started to freeze over (~ 3″ per a day the 1st day and less the following days as the ice provides insulation) the Skate could break through such ice for about a week after such a lead was formed. Not only are such leads common but since the ice is flowing about 2.5 miles per day near the pole the possibility of finding a lead and waiting for it to drift over the North poll was a realistic hope. That is what happened.
The photo taken of the winter surface at the pole is also available. In it there are chunks of ice laying against the sub. They appear to be at least 6″ thick. It was very cold and windy so they completed the ceremony and left. There was no blue water around the sub during any the many winter surfacing. In fact, a major danger was to surface in a thin lead (ice an inch or two thick) and then have the ice flow crash into the sub. This was prevented by crashing through ice several inches thick as this ice would hold the sub and allow it to drift with the ice-flow.
Vice Admiral James F. Calvert played a key role in developing nuclear submarine Arctic tactics during his tour as commanding officer of the USS Skate (SSN-578) from December 1957 to September 1959. Skate surfaced at the North Pole in February 1959. During this tour, Calvert also helped define the operational capabilities of the Navy’s first series-production class of nuclear submarine. Originally from Cleveland, Ohio, Calvert graduated from the U.S. Naval Academy in June 1942 and from Submarine School in September of that year. He was awarded the Silver Star and the Bronze Star while serving aboard the submarine USS Jack (SS-259) during World War II. He also served as executive officer aboard the USS Haddo (SS-255) in 1945. Following the war, he served as executive officer aboard the USS Charr (SS-328) and USS Harder (SS-568) and as commanding officer of the USS Trigger (SS-564). Calvert served as Superintendent of the U.S. Naval Academy from 1968 to 1972.
http://www.navy.mil/navydata/cno/n87/history/pioneers4.html#James%20F.%20Calvert
http://books.google.com/books/about/Surface_at_the_Pole.html?id=rCQGAAAAMAAJ
Bob B – Wow !
See also
http://i680.photobucket.com/albums/vv161/Radiant_2009/popularmechanics1957-2.jpg
http://www.real-science.com/new-giss-data-set-heating-arctic
http://www.real-science.com/1950-shock-news-earth-warming-sea-level
http://www.real-science.com/1947-time-magazine-the-disappearing-cold
http://www.real-science.com/phony-skeptic
http://www.real-science.com/1928-antarctica-volume-ice-lessening-rapidly
Naval history blog puts this as Aug 11, 1958.
http://www.navalhistory.org/2011/08/11/uss-skate-ssn-578-becomes-the-first-submarine-to-surface-at-the-north-pole/
“Climatic Atlas of Arctic Sea Ice Extent and Anomalies 1953-1984” by D.K. Manak and L.A. Mysak.
CRG Report 87-8 Sept. 1987 can be found by googling.
The sea ice anomaly between 1974 and 1979 is almost 2 million km2. Take almost 2 million km2 off latest charts showing from 1979 only and then it reduces to around 2005 levels. 2006 onwards are still generally lower ice levels than 1974. (2009 excluded)
Re pouncer says:
March 18, 2012 at 12:26 pm
“Why, in principle, CAN’T early records of one or more types (say, tree ring density, varve thickness, etc) be harmonized. . .”
Rainfall gage record can be “harmonized” for estimation of missing data, or to provide a consistent record over a period of time. See Section 4.4 Gage Consistency in Hydrologic Analysis and Design by Richard H. McCuen, 2nd ed., Prentice-Hall,1998 for examples. Perhaps this might provide guidance for the problem of discontinuous sea ice record.
The first on-line reference provides examples of infilling missing rainfall data and rain gage consistency analysis. The second reference illustrates some of the problems with rainfall records that are likely to be encountered in other records.
http://scholar.lib.vt.edu/theses/available/etd-05242004-085649/unrestricted/080_Appendix.pdf
http://shop.willyweather.com.au/media/pdf/Rainfall.pdf
Hope this helps.
http://www.navalhistory.org/2011/08/11/uss-skate-ssn-578-becomes-the-first-submarine-to-surface-at-the-north-pole/ shows the sub at August 11 1958
There are more undated photos at http://ssn578.com/gallery/index.php?gallery=./Skate%20Photo%20Gallery/Historical%20Images
Now it seems NOAA is taking Arctic soot seriously
———-
And the message is:
Human activity, aka anthropogenic soot produced thousands of kilometers away, can have significant effects on arctic ice extent. Even though it is soot built up over just one year perhaps.
Looks like you guys were wrong when you claimed that human activity can have no effect on the climate.
It also looks like you were wrong when you claimed over and over again that tiny quantities of some substance can have no effect on the climate
No surprises for me there.
On Wikipedia…though bound to change…
The Skate-class submarines were the United States Navy’s first production run of nuclear powered submarines. They were an evolution of the Tang class in everything but their propulsion plants, which were based on the experimental USS Nautilus. The four Skate class boats re-introduced stern torpedo tubes. Although among the smallest nuclear powered attack submarines ever built, the Skate class served for several decades, with the last being decommissioned in 1989. USS Skate was the first submarine to surface at the North Pole, on March 17, 1959.
http://en.wikipedia.org/wiki/Skate_class_submarine
That splice by Kasuha (12:43pm) looks quite good, could be tweaked further. It does look like Anthony joined the 1972-78 data a bit too far down. William Connelly’s link shows an ftp to get the original data, but they are in binary files.
REPLY: Of course you would. I joined the data at the zero anomaly line, there’s no reference in Kashua’s version that says why the baselines should be offset from zero. If I’d joined them offset below, there’d be caterwauling, if I joined them high you’d be happy. There’s nothing to suggest that an offset is needed of than some anonymous commenter thinks it should look that way. – Anthony
About Sir Hubert Wilkins whose ashes were scattered on March 17, 1959
Being “second” in 1958, the USS SKATE was the first in 1959 (March 17), as marked by its own special on-board, one-day only fancy cancellation, documenting its being the first nuclear submarine to surface at the North Pole, where it conducted some scientific experiments and scattered the ashes of recently deceased Sir Hubert Wilkins. The special cancellation was only available to those who were on board.
See picture of letter with the March 17, 1959 stamp on it.
http://www.south-pole.com/aspp05.htm
And picture of crew on March 17, 1959 at the North Pole standing on ice next to the USS Skate while Wilkins’ ashes get scattered.
http://www.vintagehikingdepot.com/2012/02/scattering-sir-hubert-wilkins-ashes/
So, all in all, it looks like the USS Skate picture in open water as seen in WUWT is that of the sub taken in August of 1958…and not March 17, 1959 during winter.
William M. Connolley says:
March 18, 2012 at 10:45 am
> Why is early satellite data for Arctic and Antarctic Ice extent referenced in the first IPCC report missing from today’s data?
Because it became clear that the data from the different instruments can’t be merged; the ESMR stuff is incompatible with the SSMR. http://nsidc.org/data/nsidc-0077.html perhaps.
Who says the ESMR and SSMR data are incompatible? Your link to the NSIDC web site certainly doesn’t say that. I can’t find anything in IPCC AR4 that says that. Indeed, section 4.4.2.1 of AR4 WGI says “The most composite record of sea ice extent is provided by passive microwave data from satellites that are available since the early 1970s.” Yet actual data provided on Arctic sea ice extent in section 4 begins with 1978 satellite data? Why start with 1978 data when it is already acknowledged that satellite data from the early ’70s is available? If there is an explanation (such as your incompatibility between ESMR and SSMR), please provide a citation. Otherwise, I can only conclude that the 1972-1977 data was omitted because it was … inconvenient.
Still, from past news print showed that Northwest Passage was ice free several decades earlier.
Before 1969 six ships completed the Northwest Passage when it was ice free at the time. Earlier than that you had Roald Amundsen back in 1903 made his ice-free trip in the late summer month using his 70 foot long wooden fishing boat during his three year trip to find the “holy grail” Northwest Passage. That passage was ice free then when he discovered the route. It was also ice free in the 1940s.
“St. Roch had serviced RCMP posts and Inuit settlements in the western Arctic since 1928, but it is for her epic voyages through the Northwest Passage from west to east between 1940 and 1942, and the return voyage in 1944….”
http://www.time.com/time/magazine/article/0,9171,901369,00.html
http://www.pbs.org/wgbh/amex/ice/peopleevents/pandeAMEX87.html
Ice free even in the 1940s – http://www.cnrs-scrn.org/northern_mariner/vol03/tnm_3_4_63-107.pdf
Found these links in – http://kokonutpundits.blogspot.com/2011/11/gallaudet-universitys-quiet-climate_28.html
In the mid 60s I had a book covering the voyages of Skate and Nautilus. It was quite a large book (an imperial size a little smaller than A4) and it had many pictures. No doubt it would have contained caption dates which would have been a useful independent source of verification. Unfortunately, whilst I still have a few of my childhood books, I do not seem to have that book.
When discussing the surfacing of SKATE at the North Pole, are we talking about the magnetic pole?
If so, where was it in relation to the present magnetic pole?
Not sure if it’s mentioned here already, newsreel from March 59 on the surfacing at the NP.
Disclaimer: I haven’t viewed it myself (work firewall blocks the vids) but the caption indicates this could be real.
Good to see that polar ice is neither in decline nor in growth. Steady as she goes.
But if Anthony will indulge me as far as I can ascertain the photo of the Skate was not taken at the North pole in March 1959 but somewhere in the Arctic in the Summer of 1958
From my post yesterday:
The photo at Navsource is credited to Graham P. Davis and he had this to say about it Oct 30th 2011
“USS Skate did indeed surface at the North Pole but not until 17 March 1959. Ice conditions in August 1958 were too heavy at the Pole for the Skate to surface, as they were for the Nautilus some days earlier. The Skate did surface in several other leads and polynya that August, including one near Ice-station Alfa. The above picture may have been from one of those.
When the Skate sailed for the Arctic the following year, the sail had been strengthened to allow it to break through thin ice. At the Pole, they eventually found a small, refrozen lead, or skylight, and managed to break through it. Later, many of the crew gathered for a service at which the ashes of Sir Hubert Wilkins were sprinkled in the wind. The temperature during this service was -26F (-32C).”
http://www.navalhistory.org/2011/08/11/uss-skate-ssn-578-becomes-the-first-submarine-to-surface-at-the-north-pole/
>:( The entire sea ice issue has a sour taste of buying into the AGW agenda to me. Wassa matta with warmer, and who wouldn’t want an open summer Arctic Ocean? The “rising ocean” link is provable BS; the calcs on speed of land-ice melt needed prove it’s an issue for hundreds, or even thousands, of years. NOT urgent for the next few generations, even lifetimes.
Always remember to ask yourself: “How did the cameraman get to where the film is shot?”
In this case, it’s a serious problem. Barely thru, pop him out the conning tower to get set up, finish the surfacing? Possible, I guess.
No, rotational North Pole. I think the mag-pole was on land at the time, IAC.
Eric Flesch says:
March 18, 2012 at 3:29 pm
…
REPLY: I joined the data at the zero anomaly line, there’s no reference in Kashua’s version that says why the baselines should be offset from zero.
__________________
They are both anomalies.
Anomaly is “temperature difference from average” but the point is what is this average calculated from. For the IPCC graph the baseline is likely per-month average of 1974-1989 while for the UUIC graph it’s 1979-2008, you can’t expect these to be the same!
REPLY: “Likely” still doesn’t provide an absolute numerical value for the offset. The anomalies match at 1979 in my version, if there was a large baseline difference there would be a mismatch at that point. Your version just stuck it at an offset you guessed at. – Anthony
Other pictures of the USS Skate from August/September 1958 seem to show it with a whitish nose!
http://www.csp.navy.mil/asl/ScrapBook/Boats/Skate1958.jpg
http://warshipsresearch.blogspot.co.uk/2012/01/american-fast-attack-submarine-uss.html
So where did the white go?
Hi Anthony, you said: “I joined the data at the zero anomaly line”. However, the zero anomaly line for the 1971-1990 data (figure 7.20) is of course a different line than for the 1979-2008 data. The way to splice the two series is to equalize the data of the overlapping years 1979-1990. This was Kasuha’s method, which I said could be tweaked a bit but it looks like he got it broadly right.
I like that image from http://arctic-roos.org/observations/satellite-data/sea-ice/observation_images/ssmi1_ice_area.png, as it shows that every year since the record low of 2006-2007, both the melt (low) and the freeze (high), are getting closer to the average.
When was the last time the data hit the average?
Well, it looks that the average line was hit in early May of 2009, again in early April of 2010, and appears to be on track to hit average again.
That looks like a trend. Watch to see if the average is hit again.
Anthony, I don’t think anyone has noted that an Arctic Sea Ice Anomaly chart for 1973 through 2000 was included in the 2001 IPCC TAR report. It is figure 2.14 at http://www.grida.no/publications/other/ipcc_tar/. In stark contrast to figure 7.20(a) that you posted above from 1990, the early years (1973-1976) show a strong positive anomaly. It’s in section 2.2.5.2 at http://www.grida.no/publications/other/ipcc_tar/.
What’s up with that?
Kasuha says:
March 18, 2012 at 4:04 pm
…
REPLY: “Likely” still doesn’t provide an absolute numerical value for the offset. The anomalies match at 1979 in my version, if there was a large baseline difference there would be a mismatch at that point. Your version just stuck it at an offset you guessed at. – Anthony
________
Sorry but I can’t provide you absolute numerical value from a picture and I am not willing to spend my time digitizing the graph or obtaining original data, it’s half past midnight and I gotta go sleep.
I am not saying my estimate is perfectly correct. I am just saying your estimate is plain wrong and am proposing better fit.
Please ask Dr. Roy Spencer for assistence with it if you don’t trust me.
Certain people will laugh at you very hard if you leave it as is.
Mike—why isn’t this figure 5 chart prominently appearing in the IPCC reports? It shows a negative anomaly in 1960 lower then 2007?
http://journals.ametsoc.org/doi/pdf/10.1175/1520-0485%281979%29009%3C0580%3AAAOASI%3E2.0.CO%3B2
Anthony’s version of the graph is only about 0.05-0.1 million km2 difference between the older version (1971-1990) and the newer one for 1979. (1979-2008) It might be the same if numerical values were available for the data, but as it stands will not know. Therefore with so little difference the baseline between the two is the same or at least very little difference. Kasuha’s method is out of phase by about 0.4-0.5 million km2 for 1979 between old and new versions.’
LazyTeenager says:
March 18, 2012 at 3:19 pm
Now it seems NOAA is taking Arctic soot seriously
———-
“And the message is:
Human activity, aka anthropogenic soot produced thousands of kilometers away, can have significant effects on arctic ice extent. Even though it is soot built up over just one year perhaps.
Looks like you guys were wrong when you claimed that human activity can have no effect on the climate.
It also looks like you were wrong when you claimed over and over again that tiny quantities of some substance can have no effect on the climate
No surprises for me there.”
============================
Wow, the glee you’re feeling is palpable.
Yet, the source of said “soot” has not been determined.
Has the soot come from forest fires, evil human influences, weathering of rocks exposed since the last ice age ?, and what is the flush rate of the Arctic icecap ? , that sooty ice is constantly being driven out to its watery demise, when it meets warmer water.
Conning tower seems to be a popular nane but in the RN it is the fin and the very top is known as the bridge and a submarine is a boat, not a ship. Yes strengthened fins are fitted to boats going under the ice to help them surface but another major tool is air to fracture the ice from below.
I’ve always said that the current drop in Arctic Ice Extent might have roots in soot from the industrialization of Asia causing an albedo change which really took off in the 1990′s, would show up in the summer melt season when solar irradiance is at a peak in the Arctic.
I think the reverse is true. What happened in China is that, as it industrialized, coal burning in open hearths and domestic stoves was replaced by coal burning in power stations to produce electricity.
Coal burning in power stations is far more efficient than smoky inefficent open hearths and consequently far less particulate carbon gets into the air from each ton of coal burnt. Although China burns far more coal than it did 40 years ago.
The ‘culprit’ is far more likely to be sulphate emissions which (without scrubbers) aren’t greatly affected by how the coal is burnt and are much more widely distributed in the atmosphere.
World and China sulphate emissions peaked in the early 1990s, which would have led to decreased clouds and increased solar insolation in the Arctic, resulting in increased summer ice melt.
Then there is the de-industrialization of the Soviet Union after 1991.
All in all, a complex subject, where global indices are useless, because particulate and aerosol emissions are a local and regional phenomena. This is true even in China where there are large differences between cold northern China and warm southern China; the industralized coast and little changed rural interior.
Time to put this one to rest judging from what has been found regarding dates the sub picture was taken at the N. pole …
And – one can search for simple ‘terms’ in the book “Surface at the Pole: the extraordinary voyages of the USS Skate” such as ‘surfacing’ and ‘1958’ and a context paragraph will appear:
http://books.google.com/books/about/Surface_at_the_Pole.html?id=rCQGAAAAMAAJ
Since the pub/author are not in partnership with Google, no usual (even limited) ‘preview’ is available.
.
LazyTeenager says:
March 18, 2012 at 3:19 pm
Now it seems NOAA is taking Arctic soot seriously
———-
And the message is:
Human activity, aka anthropogenic soot produced thousands of kilometers away, can have significant effects on arctic ice extent. Even though it is soot built up over just one year perhaps.
Looks like you guys were wrong when you claimed that human activity can have no effect on the climate.
It also looks like you were wrong when you claimed over and over again that tiny quantities of some substance can have no effect on the climate
No surprises for me there.
===============================
And the source of the soot, is it natural forest/bush fires or filtered smoke stacks and catalytic converterted exhausts?
Re Skate and the North Pole – there sure are a lot of dates floating around for this issue. My two cents:
According to my copy of the “U.S. Navy (A complete History)”:
August 11, 1959 – “As part of an exploratory voyage to the Arctic region of the globe, the nuclear-powered submarine Skate becomes the first submarine to surface at the North Pole when her sail tower breaks through the ice.”
Page 571
Naval Historical Foundation 1306 Dahlgren Avenue, S.E. Washington Navy Yard, D.C. 20374-5055
Tel: (202) 678-4333
Fax: (202) 889-3565
nhfwny@navyhistory.org http://www.navyhistory.org
Beaux Arts Editions
Published by Universe Publishing
A Division of Rizzoli International Publications, Inc.
300 Park Avenue South
New York, NY 10010
http://www.rizzoliusa.com
© 2003 Naval Historical Foundation
Please scratch the previous post and make the year 1958 – thanks
Re Skate and North Pole
According to my copy of the “U.S. Navy (A complete History)”:
August 11, 1958 – “As part of an exploratory voyage to the Arctic region of the globe, the nuclear-powered submarine Skate becomes the first submarine to surface at the North Pole when her sail tower breaks through the ice.”
Page 571
Naval Historical Foundation 1306 Dahlgren Avenue, S.E. Washington Navy Yard, D.C. 20374-5055
Tel: (202) 678-4333
Fax: (202) 889-3565
nhfwny@navyhistory.org http://www.navyhistory.org
Beaux Arts Editions
Published by Universe Publishing
A Division of Rizzoli International Publications, Inc.
300 Park Avenue South
New York, NY 10010
http://www.rizzoliusa.com
© 2003 Naval Historical Foundation
Well – I’m glad that Life article help establish some facts. I took it to mean that there was light icing present – and clear surface points were visible from beneath the ice. The article shows a picture of the sub in clear water hole, and states that the sub surface 10 times during this March arctic voyage.
See the hullnumber.com article for USS SKATE (SSN-578)
http://www.hullnumber.com/SSN-578
NSIDC has a merged ESMR/SMMR/SSM/I data set here: ftp://sidads.colorado.edu/pub/DATASETS/nsidc0192_seaice_trends_climo/esmr-smmr-ssmi-merged/
These are daily and monthly extents that span 1972-2002 (data source is NASA GSFC, using
the NASA Team sea ice concentration algorithm and filling in with ice chart data when there was no satellite overlap). While not current, it would allow anyone to do their own sea ice anomaly plot to see how the earlier years compared to the last couple decades. Comparisons with NSIDC’s sea ice index for the month of September for example show good agreement between the two data sets, so if one wanted to, they could extend it to 2012 (Note I only looked at September, other months may differ).
REPLY: Thanks Dr. Stroeve for providing that update! – Anthony
Video of USS Skate surfacing at the North Pole April 6 1959
http://www.criticalpast.com/video/65675071748_USS-Skate_personnel-on-controls_officers-confer_weather-information
Anyone interested in sea ice should watch the Frozen Planet series “The Ends of the Earth”. The photography is amazing. Sadly I could only watch the first of 2 hours because my favorite show is on at 9:00pm. You know, the one where the CAGW alarmists finally lose the battle and gain their rightful place in the history of humanity. That’s right, “The walking dead”.
Anyone own this?
http://www.amazon.com/Skate-SSN-578-Nuclear-Submarine-Arctic/dp/B005FDP1ZQ
What does it say on the film?
The Royal Canadian Airforce has been doing overflights, reconnaissance of the arctic for decades. Logs of these flights might be an excellent source of ice information if they can be accessed somehow. Being military I am sure the logs would not be made available willy nilly, but if there is ice information maybe it can be collected by military types cleared to read the logs. Information given to unbiased researchers of course.
From people who should know about their own subs, the US Navy Arctic Submarine Laboratory, comes a photo gallery “Submarines Under Ice”, with many fully and partially surfaced subs:
http://www.csp.navy.mil/asl/Submarines.htm
See “USS SKATE (SSN 578) (1958)”:
http://www.csp.navy.mil/asl/ScrapBook/Boats/Skate1958.jpg
Note the amount of open water. Note also the large band of light color on the bow, presumably white.
Compare to the 1959 color picture:
http://www.csp.navy.mil/asl/ScrapBook/Boats/Skate1959.jpg
The white band appears largely worn off. The remaining band pattern is comparable to that in the disputed black and white photo.
Without knowing how obsessive the US Navy would be about keeping that band painted, which would clearly be difficult either at the Arctic or with the sub in water, offhand I think this is good evidence the disputed photo is from 1959, not 1958.
Skate at the North Pole. What’s the big deal? Every philatelist has one of these, right?http://www.navsource.org/archives/08/0857809.jpg
Your initial NSIDC graph says they use 15% coverage for sea ice extent. I assume the Cryosphere Today anomaly graph is also 15% extent. The text under the FAR graph says they used 10% coverage for extent.
I would suggest in combining the two graphs an apples to oranges splice has been made. If the FAR graph had been 15% sea ice the amplitude of that portion would be be even lower than presented.
Late grow season bumps in extent are a snare and a delusion. Look at 2010 compared to 2009. Late season extent bumps are thin and peripheral and will melt away in May and June at an accelerated pace.
Bob B says:
March 18, 2012 at 4:40 pm
Mike—why isn’t this figure 5 chart prominently appearing in the IPCC reports? It shows a negative anomaly in 1960 lower then 2007?
http://journals.ametsoc.org/doi/pdf/10.1175/1520-0485%281979%29009%3C0580%3AAAOASI%3E2.0.CO%3B2
Bob, I am no expert but I think you uncovered a very significant study. I hope WUWT readers take a look at it. We are led to believe by IPCC scientists that there is no reliable sea extent data until satellite data became available in 1978. Then I find that the IPCC itself says satellite data has been available since 1972 (see my previous post above.) The Walsh study you linked to says satellite data was available since 1966. In addition to the satellite data, the Walsh study includes a Table 1 that lists some other very impressive ice data sources. I think the claim that there are no reliable sea ice extent data before 1978 is a lie. The Walsh study found plenty of reliable sources and the huge negative anomaly in 1960 (actually 1958-1962) jumped out at them. by the way, isn’t that around the time the USS Skate and another submarine surfaced at the North Pole? Interesting…
I hope others more knowledgeable than me follow up on this.
Mike, perhaps I can help. The most consistent, inter-calibrated data set spans October 1978 onwards. This record uses multi-channel passive microwave sensors to measure the ice concentration using the same algorithm, from which the extent is derived. ESMR was an earlier, one-channel passive microwave satellite sensor that started in 1972, but ended before the multi-channel SMMR instrument was launched. So there is no continuity in the passive microwave satellite data record prior to October 1978. There are several data sets that attempt to go back further in time, combining the multi-channel passive microwave data record, with single channel records, as well as with visible, near infrared and thermal imagery from earlier satellites, and also ship observations and aircraft observations. Combining ALL those sources together leads to the Had1SST data set and/or the Chapman and Walsh data set. The record starts in 1870, but many of the years are based on climatology. The “best” record is from 1953 onwards, since there are more observations (either from aircraft, ship or earlier satellites) to make a more or less consistent data record. If one were to do an anomaly plot from that data record (either the Had1SST or the Chapman/Walsh data record), you would find positive anomalies in annual ice extent dominate in the 1950s to the 1970s (using a 1953-2003 baseline for anomalies), and negative anomalies throughout the 1990s and the 2000s.
Color photo (?) from the July 1959 National Geographic which covers the Skate’s winter trip to the Arctic to scattering Sir Hubert Wilkins’ ashes:
http://www.vintagehikingdepot.com/tag/national-geographic/
.
Mike, I forgot to mention that the sea ice record from 1953 onwards was used in the IPCC AR4.
Arctic sea ice
Antarctic sea ice
Any questions?☺
Julienne Stroeve says:
March 18, 2012 at 7:02 pm
Mike, I forgot to mention that the sea ice record from 1953 onwards was used in the IPCC AR4.
Thank you for your informative posts. Can you point me to the 1953+ sea ice data in AR4? I want to see how closely it resembles the Walsh & Johnson (1978) chart. Does the IPCC’s version show the dramatic decline from 1958-1962? Is that decline considered “real” or has Walsh & Johnson been debunked?
(Did not see this mentioned so …) a of collection reference materials submarine-centric on the subject:
“Research Guide To Submarine Arctic Operations
A list of materials available at the Submarine Force Library & Archives”
http://navsource.org/archives/08/pdf/08046001.pdf
Also references public periodicals (period pieces), materials available at time of the events.
.
Hi Mike, I believe the IPCC AR4 used the Had1SST data set (but unfortunately with the “discontinuity” that existed in the original data set when they switched from NSIDC to NCEP for the ice concentrations post 1995). The Walsh and Jonson reference you pointed to was for sea ice anomalies from 1953 to 1977. Using their “baseline” for the anomalies, they would have seen lower ice conditions in the 1950s (peak was in 1969) than in the 1970s. But extending the record through present shows the last two decades have considerably less ice than the 1950s/1960s (more than a million sq-km less in terms of the annual ice extent and more than 2 million sq-km in terms of September ice extent for the last decade).
Just a quick question that has me perplexed. In all the photos,movies,newsreels,etc of the Skate at the North Pole,regardless of date,WHERE are the footprints of the photog(s) getting from the sub to where the shots were taken? I have landed at the North Pole,and there is always loose snow on the ice.just wondering.
nc says:
March 18, 2012 at 5:57 pm. nc. As a vet of the Canadian Air Force,I’ll see what the Archives Section has to say. I do know that a lot of the WWI/WWII logs/records have been donated,and are available for scrutiny.Maybe some from WWII forward to the Cold War are around.
An interesting narrative on the Skate’s mission in the arctic, from:
“An Examination of a Subsurface Impact on a Floating Ice Sheet
Survivability, Structures, and Materials Directorate, Technical Report”
http://www.dtic.mil/cgi-bin/GetTRDoc?AD=ADA338293
Excerpting starting on Pg 12:
The USS Nautilus (SSN-571) was outfitted with special sonar and navigation equipment to
operate in the Arctic; however, the sail and superstructure were constructed of aluminum and not designed for upward impact. …
Next, the USS Skate (SSN-578) was given a mission to “develop techniques for surfacing in pack ice areas.. .if nuclear submarines are to be useful in the Arctic they must have access to the surface” [Calvert, 1959].
While this mission was initially accomplished in the summertime, August 1958, and only through open-water polynya, the need to prove that a submarine could surface in the Arctic during any season drove the Skate back the following March.
The ice has usually reached its maximum by March, after continued low temperatures in January and February. Even though open water leads may still form when the ice canopy breaks apart under the stress of wind, the exposed surface will freeze six inches thick the first 24 hours with an average winter temperature of about -30°F. However, it was noted that whales had been observed to break ice six or eight inches thick with their backs. With that example, the Skate’s “sail” (or conning tower), the protective and streamlining structure surrounding the periscopes and radio masts, was strengthened, and the latest upward-looking fathometers were installed to measure the distance to the underside of the ice and to estimate its thickness [Rockwell, 1992].
In lieu of the vertical-ascent procedure used in summer to surface in the open-water polynya, procedures were devised for locating an acceptably thin lead in the ice canopy, positioning the submarine, and vertically ascending at a controlled rate [Lyon, 1984].
With an externally mounted underwater camera, the first surfacing was observed as allowing “the nearly 3,000-ton mass of the Skate to bump against the ice. We rebound gently away….bring her up again, this time a little faster.” [Calvert, 1959].
During this winter deployment, the Skate attempted several more surfacing maneuvers and even experienced a few failures. As a result of this mission, “the art of routine surfacing through sea ice was devised … by intuitive engineering, rudimentary knowledge of ice mechanics, and trial” [Lyon, 1992]. A routine surfacing has been described as a stationary, vertical ascent at a specified rate of rise in feet per minute that was calculated to exert a vertical impact force on the sail – assuming the boat did not break through the ice – within the submarine’s design strength. However, the conclusions of recent literature implies that the “art” was developed more on trial than a rational basis, especially considering the stated need to “conduct momentum-exchange experiments and impact measurements” [Lyon, 1992].
– – – – – – – – – – – – – – – – – –
Am I the only one interested in the unusual persisting indentation of open sea North (and North East) of Svalbard? What is up with that?….
The photo with the Skate in clear water shows it without the modifications to the tower that were made to enable it to penetrate ice as shown in the other photo.
Julienne Stroeve says:
March 18, 2012 at 8:08 pm
[…] The Walsh and Jonson reference you pointed to was for sea ice anomalies from 1953 to 1977. Using their “baseline” for the anomalies, they would have seen lower ice conditions in the 1950s (peak was in 1969) than in the 1970s. But extending the record through present shows the last two decades have considerably less ice than the 1950s/1960s (more than a million sq-km less in terms of the annual ice extent and more than 2 million sq-km in terms of September ice extent for the last decade).
OK, I think I get it. I’m trying to make conclusions about sea ice extent based on a comparison of anomalies between series that use different baselines. So let me avoid that trap and ask about actual areas of sea ice extent. According to the NSIDC, September 2007 had the lowest sea ice extent in history at 4.28 million square kilometers. You are arguing that during the dramatic negative anomaly of 1960, the sea ice extent that September was still more than 2 million sq-km greater than that of September 2007, right? Has anyone created a monthly chart for 1953-2011 that either shows anomalies based on a common baseline for that period or, alternatively, shows sea ice extent in sq-km? In other words, can we get the whole picture for the period we know we have good data?
P.S. I just learned that you are an accomplished Research Scientist at NSIDC. Thank you for taking the time to share your knowledge with us. I hope you will continue to contribute.
P,S. I meant to close parenthesis after the first paragraph.
On the revision of the NAVSOURCE citation for the USS Skate image, the date of the photo was amended at the request of Graham P Davis of Bracknell.
“The original fault appears to lie with this site http://www.navsource.org/archives/08/08578.htm – I’ve asked them to correct the misleading description of the photo.” NewsGroup uk.sci.weather
Discussion 53 “Years Of Anthropogenic Global Warming” Oct 18, 2011
Davis’s authority was his reading of the book Surface at the Pole by Commander James Calvert.
I doubt that the photograph was taken on the date of the famous North Pole surfacing given the pack ice conditions at the time. There is an edited 15 minute 16mm colour film recording taken by crew members that shows the conditions over parts of the time the vessel was on the surface at the pole in 1959, including activities to melt the ice on and about the submarine and showing part of the Wilkins service. Classified ops apparently prevented the release of other photography.
@Bob B
Figure 5 is scaled in hundred thousand squarekilometers (10 exp 5), not million square kilometers, so the dip is not bigger than 2007.
Max says:
March 18, 2012 at 8:35 pm
Am I the only one interested in the unusual persisting indentation of open sea North (and North East) of Svalbard? What is up with that?….
Possibly the warm sea surface temp anomalies in the North Atlantic
http://ocean.dmi.dk/arctic/satellite/index.uk.php
The photo of Skate sticking through the ice cannot be from 17 Mar 59 because it’s sunny there.
“Sea-ice is defined to be present when its concentration exceeds 10% (Ropelewski, 1983). Since about 1976 the areal extent of sea-ice in the Northern Hemisphere has varied about a constant climatological level but in 1972-1975 sea-ice extent was significantly less.”
did anybody catch that? 10%+is considered sea ice… I thought it was 15%? how much would that change the data? seems to me, at 10% the data will show larger mass. Maybe I am making a big deal out of nothing.
Quick Google and found a couple of references to USS Skate being there fore March 17th 1959, even found a philatelic item of note-
http://www.boloji.com/index.cfm?md=Content&sd=Articles&ArticleID=109
http://www.south-pole.com/aspp05.htm
Skimmed the thread and am surprised nobody has asked:
Where on earth is the ICESAT data?
It was released with great fanfare last year and is allegedly the answer we are all looking for on sea ice questions.
So why is it not answering those questions?
According to the paper linked to above, satellite ice data has been available and included in studies since the early 1970’s.
Where is that data?
I smell something fishy, and it’s not the contents of Baldrick’s apple crumble.
Doug Proctor says
The impact of different scales or ability to estimate extent, however, AGAIN works in the alarmists favour. The range of change is much greater when both growth and loss are underestimated. If you were to scale up the pre-1979 data so that the 1977-1979 time looked like the 1979-1981 range style,
————-
Doug since you seem to be investigating this with some enthusiasm, may I suggest that you take into account how changes in the satellite resolution will affect estimates of ice extent.
Just a guess, but if ice extent is estimated by counting pixels, a naive method would give a resolution dependent result. Fractal nature of dispersed floating ice and all that.
The Wikipedia article on the USS Skate was revised yesterday by “DLH” :
http://en.wikipedia.org/w/index.php?title=USS_Skate_%28SSN-578%29&diff=482595885&oldid=480138714
Adding this reference from an Ohio State University Libraries Exhibition for the March 17, 1959 surfacing date, with photos:
http://library.osu.edu/projects/under-the-north-pole/afterwards.html
Okay I managed to have a bit of sleep and am able to once again communicate in english which is not my native language.
Well, you may notice one small detail. The IPCC and the UUIC graphs overlap by about 10 years, starting with 1979 (start of UUIC) and ending with 1989 (end of IPCC). Despite the poor quality of the IPCC graph which likely was printed out and scanned with significal loss of detail, it is possible to make out not only the running mean of these 10 years but actually a lot of details of the monthly anomaly shape. And just by comparing this shape with appropriate shape on the UUIC graph (after resizing both graphs to common units in both dimensions) you may notice they are in fact very similar, with one detail – as long as you put zero to zero, the IPCC anomaly shape lies way below the UUIC over all the 10 years. Taking into account that both are anomaly graphs and that UUIC baseline is 1979-2008, half of which was not available for the IPCC graph, it is clear that they use different baselines. Adding a different baseline to one of them to produce a fit of the overlapping part is the easiest way to reasonably put the two together, based on assumption that annual cycle did not change much (which didn’t or they wouldn’t fit at all).
Exactly that could be seen on the two images I created and posted. It’s said image is worth a thousand words but mine unfortunately failed to act as such so I had to produce all the words anyway.
I must say one thing. One of the most common “warmist” arguments is that “skeptics” produce pseudo-science to prove their points. I hate that argument, but it’s hard to fight it if things like this keep appearing.
http://blackswhitewash.com/ says:
“According to the paper linked to above, satellite ice data has been available and included in studies since the early 1970′s. – Where is that data?”
The Walsh and Chapman compilation time series surveys of Arctic ice extent (1870 to 2008) are public data and available at the webpages of the Department of Atmospheric Sciences at the University of Illinois.
The seasonal and annual summary is tabled at http://arctic.atmos.uiuc.edu/SEAICE/timeseries.1870-2008
Manfred, you’re right—my bad–thanks!
Kasuha–you ust be joking right? So Mann uses 2 bristle cone trees and hides the decline after 1960’s and this piece of crap is displayed prominently on an IPCC cover and you are saying sceptics use pseudo-science to prove their points?
The Milwaukee Sentinel – Mar 28, 1959 reports the second arctic voyage of the Skate
http://news.google.com/newspapers?id=v21QAAAAIBAJ&sjid=hhAEAAAAIBAJ&pg=1876,3611833&dq=north-pole&hl=en
The Glasgow Herald – Mar 30, 1959 Reports the scattering of Huberts ashes at the North pole (he died in November 1958).
http://news.google.com/newspapers?id=qXhAAAAAIBAJ&sjid=rJsMAAAAIBAJ&pg=2411,3314305&hl=en
Now I know what it felt like living in the old USSR…. where folks where just airbrushed out of photographs and all history was up for a rewrite….
Note, too, that the statement ON the card says the cruise was during the WINTER…
Anthony, someone needs to make a stink about whoever at the official Navy site changed that caption. They are capriciously changing Recorded History and it is a flat out LIE.
IF that picture had been taken in mid summer, the lighting would have been much brighter, the camera stopped down more, the depth of field deeper and, unless the sky was cloudy, the lighting more direct and harsh.
The photo itself says winter by its features. The written records of the crew say winter. The postage stamp says March and the postcard says winter cruise. To suddenly change that to August is just wrong. Terribly terribly wrong.
(On the bright side, it makes it all the more obvious that the temperature records from NOAA / NCDC and HADCrut simply can not be trusted. GIVEN that we have folks blatantly pressuring the Navy to re-write history, the idea that they are not changing the records under the direct control of “Climate Zealots” becomes untenable….)
The ESMR and SMMR are not the satellites being discussed in IPCC AR1 on sea ice. This shouldn’t be a surprise, given that the curve starts before ESMR’s Dec 1972 launch, and has no break between ESMR (end December 1976) and SMMR (start 28 October 1978).
A full discussion is at my blog.
>> Because it became clear that the data from the different instruments can’t be merged; the ESMR stuff is incompatible with the SSMR. http://nsidc.org/data/nsidc-0077.html perhaps.
> Who says the ESMR and SSMR data are incompatible? Your link to the NSIDC web site certainly doesn’t say that. I can’t find anything in IPCC AR4 that says that. Indeed, section 4.4.2.1 of AR4 WGI says “The most composite record of sea ice extent is provided by passive microwave data from satellites that are available since the early 1970s.”
s/composite/complete.
> Why start with 1978 data when…
Try reading on to the next page, 4.4.2.2: “Most analyses of variability and trend in ice extent using the satellite record have focussed on the period after 1978 when the satellite sensors have been relatively constant.”
However, in this particular case, my mention of ESMR is probably a red herring, since the IPCC ’90 figure doesn’t use ESMR. http://moregrumbinescience.blogspot.co.uk/2012/03/tempest-in-ice-pot.html provides the background that is missing here. Motto: if you have a puzzle, ask someone who knows rather than generating conspiracy theories.
Warmists will simply say that area and extent are meaningless and it’s ice thickness that really matters.
mike abbott says:
March 18, 2012 at 9:30 pm
Mike, if you email me at NSIDC, I’m happy to send you either the Had1SST data that I have, and/or also the Chapman and Walsh data. I have actually adjusted the Had1SST data down to match with the merged ESMR/SMMR/SSMI data set (so the extents are lower than in the original data set from 1953-1972), and even doing that, the September ice extent remains above 7 million sq-km (before the adjustments, it’s 8 million sq-km). The Chapman and Walsh data set also has the extents above 8 million sq-km in the 1950s, dropping to 4.10 in 2007.
As Anthony mentioned at the start of this blog, NSIDC has acquired a bunch of film from the 1960s that we’re processing so that we can provide more data as input into these older time-series.
A final note, once melt begins, the passive microwave data underestimates the true ice area (which is one reason why NSIDC only reports the extent in the sea ice news and analysis site, as it’s a more reliable metric). I only compared extents thus far.
From: http://www.usscod.org/fact.html
“The USS SKATE (SSN 578) was the first vessel ever to surface at the North Pole, when on March 17, 1959 she surfaced there to conduct memorial services for the renowned Arctic explorer Sir Hubert Wilkins”
http://archives.nbclearn.com/portal/site/k-12/flatview?cuecard=41751
has newsreels…
The image at the top of the newsreel page is not the same as the one in question here, and is dated 1958, so I suspect they used earlier footage of the sub in snow with this particular story while the event was underway. The key thing for me is the statement of the mission being to surface during the winter.
Clearly the sub was there in winter, and surfaced.
http://americanhistory.si.edu/subs/work/exploring/exploration/
The Smithsonian has a slightly different picture (less water around the boat, the ice looks ‘fresher’ on the boat and three people on the deck. It looks like they put one person on the ice then backed off for the other picture above here.) To me, it looks a bit more contrast enhanced and you have more of a view of the stuff on top of the deck (like the photographer is on slightly higher ‘ground’.) Also, from the bow, the water in the background looks about the same.
captioned:
If you can’t trust the Smithsonian, who can you trust 😉
The ice chunk on the bow looks very similar to me. I think it’s the same chunk, just the picture here was taken a bit later with crew on top deck and the boat backed off a bit from the first position (thus the different perspective and the different look to the foreground.) Same ‘foggy’ look to the stern of the boat. The picture here does look like the perspective is from a crouch position to emphasize the foreground water.
From: http://www.fact-index.com/u/us/uss_skate__ssn_578_.html
So in early August 1958 she headed to the arctic, ending in Norway on 23 August. But no mention of a north pole surfacing. Saying only ‘reached it’. (but ambiguous). We again have confirmation of a surfacing AT the pole on 17 March 1959.
http://www.tutorgig.info/ed/Submarine
dedicated to preserving submarine history says:
Again emphasizing the originality of that 17 March 1959 at the north pole.
The New York Times looks to have been influenced. This is the obit for Capt. Calvert from 2009 (though who knows when the last ‘edit’ was done… Wayback?):
http://www.nytimes.com/2009/06/16/us/16calvert.html
Note, though, it says “near” not “at”. The article has a picture of the sub locked in ice that it claims is 1959 “at” the pole. So one of these sources has something wrong.
Though, at a minimum, the ‘near’ the north pole is still a winter shot almost at the North Pole… (but I think the original view is correct and by 2009 the Times was not being very careful).
http://www.examiner.com/military-news-in-charlotte/submarine-veteran-remembers-first-polar-surface-3
has an interview with a crewman who was there, but has a small picture of a more ice bound boat labeled as “near” the north pole (so I think they chose one with more snow):
So it looks to me like it’s very clear that DID surface AT the pole on 17 March 1959. There was no problem surfacing at a dozen or more places around the Arctic near the pole. There were pictures taken on more than one or two of these events. Close attention has to be paid to the details of ‘at’ vs ‘near’ the pole. At least some places were open areas and some were more iced over. Unless you have a provenance, knowing which picture was AT vs NEAR will be hard to prove (though the balance, IMHO, leans to the one here and the Smithsonian one being “AT” and the one surrounded by snow being “near”, based on repeated captions and the similarity of the Smithsonian and this one). Older labels / references are more likely to be accurate. (Things to not become more certain with the passage of time…)
http://www.pelletierson.com/NuclearSubmarines.html
has yet another variation on the same photo. 3 men on deck, up against the ice in the foreground. Same chunk of ice on the bow (though maybe even ‘fresher’ looking – or just a larger picture 😉 Clear water behind the bow.
So I think that the ones showing the boat from the same basic point of view, with the same background, same ice on the topside, and various numbers of people were just taken at different times during the North Pole surfacing, and during one point they backed the boat off from the ice flow into the open water behind it for the picture here.
That there are even more folks on deck also implies to me that it was later in the series, after the ‘tension’ of the first guy ashore was past and they’d pretty much figured No Bad Thing was happening, so more folks could get some air…
http://www.factbites.com/topics/Skate-class-submarine
Again has August as ‘under the ice’ and 17 March as AT the pole:
So the pattern I’m seeing is that if the picture says AT the pole, it was 17 March 1959.
http://www.highbeam.com/doc/1G1-201893873.html
continues that theme per August 1958
http://www.globalsecurity.org/military/systems/ship/ssn-578.htm
Has a rather interesting story, again confirming the “not at, but near” for August:
So on the August trip, we have a circling of the pole, but not a surfacing. Were I crossing UNDER a north pole with open water, and circling around it looking for a hole, if there were one in existence, I’d have surfaced. That the later trip (with stiffened gear) lets her surface AT the pole, seems pretty clear,
My conclusion: If the picture is AT the pole, it’s not August.
blackwhitewash.com says: Skimmed the thread and am surprised nobody has asked:
Where on earth is the ICESAT data?
It was released with great fanfare last year and is allegedly the answer we are all looking for on sea ice questions.
So why is it not answering those questions?
ICESat is no longer in operation (and wasn’t last year either). I think you have it confused with CryoSat. Folks processing that data did release some preliminary thickness estimates last year to the media, but they are still processing and validating the results.
If you are interested in how the ICESat data compared to earlier thickness estimates from submarines you can take a look at the figure here from the Kwok and Rothrock 2009 study: http://nsidc.org/cryosphere/sotc/sea_ice.html
E.M.Smith
March 19, 2012 at 8:11 am
###
As I pointed out earlier, the photo of the Skate, in clear water was taken before the “sail” modifications that were made to allow it to bust through ice as shown in the photos known to have been taken during March.
Oh good. So when I assert it is stupid to merge data from different instruments (thermometers) and splice segments from different eras and locations via ‘homogenizing” I’ll just cite you as the authority… Thanks!
(Or can ‘data from different instruments’ only be merged when it suits the warmers agenda…)
Smokey says:
March 18, 2012 at 7:07 pm
Arctic sea ice
Antarctic sea ice
Any questions?☺
Merge those two charts and what do you get ?
I estimate it’s close to a Level Flat Line.
And in spite of the CAGW climate misinformation following us,
my soul is peaceful and satisfied…
@DesertYote:
I’m not seeing any difference in the sail. There is a reflection of the one “open water” that make it look slightly squarish, but I believe that is an artifact of the light line off the round surface. Compative hights, etc. all look the same to me.
Perhaps you could describe what you are seeing?
To me, the the ‘3 man’ photo and the ‘open water’ photo are strikingly similar with only the boat moving back a bit between them (moving the open water from behind to infront and a minor change of viewer height. Similar ice deposits on deck, similar background water to snow in distance at bow, just way similar. All other shots are ‘way different’.
Add in the nose white that is present in 1958 and gone in 1959 and it’s even stronger.
Figure 3 of the Walsh paper reveals a mean for 5 % sea ice extent from approximately 7 million sq km to 14 million sq km. Today 15 % is the number used therefore Walsh et al would seem to be overestimating the extent. Julienne wrote that she reduced the Walsh minimum from 8 million sq km to six million. It looks to me that it should be reduced to at least six million. Then the 1962 low indicates an anomalous reduction of about 400,000 sq km putting a possible 15 % calculation at 5,600,000 sq km or less. This compares with the 2007 15% sea ice extent low of about 500,000. The question is what is the proper area adjustment for converting from 5% sea ice concentration to 15%.
Why use UAV’s to measure soot? Why not use all the publicity-camping-trips to take ice cores and measure soot content directly?
Richar1225, to be clear, the numbers I quoted are based on the Had1SST data set, but using a 15% thresh hold for the ice extent calculations. Same with the Chapman and Walsh data set. These data sets are provided on a 1 degree lat/lon grid, and they are based on blending earlier satellites such as ESMR (for the microwave), as well as visible and thermal satellite imagery even earlier than 1972 (e.g. TIROS), ship and aircraft observations and any other observations of the ice edge) available. The data record from both Had1SST and Chapman and Walsh starts in 1870, the accuracy of which is questionable prior to about 1953, and afterwards, I have noticed some inconsistency problems that the Had1SST folks are working on correcting.
The Nautilus and Skate are featured in British Pathe News reels of the time.
The Nautilus “first to cross beneath the pole” is the subject of this from 1958: http://www.britishpathe.com/video/the-nautilus-crosses-the-top-of-the-world-aka-naut/ (8.25 minutes).
The review of 1959 mentions the Skate surfacing at the pole. The commentary says it is the Nautilus, but you can see “..ATE” on the sub in one shot.
http://www.britishpathe.com/video/review-of-the-year-1959/ (7:40) The Arctic shots appear from 3:44 to 3:59 and show, among other things, her having broken through ice about 6-8 inches thick, and steaming along the surface through such ice.
Good graph of 1953-present ice from NSIDS: http://nsidc.org/cryosphere/sotc/sea_ice.html which confirms that Anthony’s splice of the mid-1970’s “decline” was a bit too low on the chart.
Rabe says, March 19, 2012 at 12:07 am:
” The photo of Skate sticking through the ice cannot be from 17 Mar 59
because it’s sunny there.”
According to Navsource, the photo of the sub surfacing through ice was
taken “above the Arctic circle” in 1959, presumably during the March cruise.
They say so now, and they said so back when they were saying the
surfacing in essentially clear water was at the North Pole, March 17, 1959.
But not necessarily at the pole
Here is a photo of the funeral at the North Pole, March 17 1959:
http://www.vintagehikingdepot.com/tag/uss-skate/
Also,
http://library.osu.edu/projects/under-the-north-pole/images/wilkins35_5_4.jpg
at http://library.osu.edu/projects/under-the-north-pole/afterwards.html
It looks quite icy to me there at that time.
Here is a photo claimed to be the March 17 1959 polar surfacing:
http://library.osu.edu/projects/under-the-north-pole/images/wilkins35_5_1.jpg
It is not either of the two photos that have been drawing a lot of comments.
It does show plenty of ice.
If the picture of the USS Skate in the picture with open water was during March, wouldn’t the below zero conditions be producing at least some sea smoke across the top of the water?
“NSIDC has a merged ESMR/SMMR/SSM/I data set here: ftp://sidads.colorado.edu/pub/DATASETS/nsidc0192_seaice_trends_climo/esmr-smmr-ssmi-merged/
These are daily and monthly extents that span 1972-2002 (data source is NASA GSFC, using
the NASA Team sea ice concentration algorithm and filling in with ice chart data when there was no satellite overlap). While not current, it would allow anyone to do their own sea ice anomaly plot to see how the earlier years compared to the last couple decades. Comparisons with NSIDC’s sea ice index for the month of September for example show good agreement between the two data sets, so if one wanted to, they could extend it to 2012 (Note I only looked at September, other months may differ).”
In september, there is a mean difference of 130.000 sq. km betweenn merged ESMR/SMMR/SSM/I and Sea Ice Index.
In march, the difference is larger: 1.110.000 sq km.
Adjusting this differences, the result could look like this, eith uncertainties in the merging: http://images.meteociel.fr/im/1717/image001_ntz0.png
What is so complicated about this whole Skate picture?
The Skate is famous for surfacing at the North Pole, so someone inadvertently assumed that picture must have been from that event and said so on the Internets. Then someone who really badly needs to refute the existence of AGW comes by, copies the whole thing and goes: “Hahaa, there you go, warmistas! There was open water at the Pole in 1957! No AGW! Hahaa!”
Of course, this half truth travels around the world a couple of times and gets so much attention that folks find out that this picture wasn’t made at the Pole in 1959 (not that it matters, it was a piss poor argument to begin with), and they change the caption.
As can be expected, this changing now becomes the focus, accompanied by a casual “I’m interested in nailing down the date on the one in question”.
First the Goddard conspiracy theory du jour, and then this, together in one post. I don’t know whether to laugh or cry. As always, top notch science, Anthony.
@ Günther Kirschbaum on March 19, 2012 at 12:36 pm:
Thank you Mr. Cherrytree, for the official reply from the drive-by Warmist Wapid Wesponse team. It was indeed very vapid.
===
From E.M.Smith on March 19, 2012 at 9:47 am:
At the Navsource photo gallery, the white bow band is very noticeable in this photo as well, captioned “Skate (SSN-578) moored to the ice at floating ice station Alpha.” By the GlobalSecurity info you linked to (I had seen it before btw), that was in 1958.
So white bow band in 1958, wiped off by 1959 as shown in several photos, it doesn’t reappear on the Skate in photos from later years. Thus the b&w photo in the original post is from 1959.
Gunther’s been pwned.☺
The sketch on the envelope clearly shows a penguin near the North pole, giving a polar bear the flipper. Obviously this poor species has been now exterminated from its northern range. Yet another Species Crime to lay at the feet of dastardly Hoomons, irrefutably documented!
Or not.
😉
Cui bono asks:
“On historical sea ice extents: Is it not possible to take just one year from the first half of the 20th Century (preferably one in which journalists were warning of a Hansenesque submerging of New York) and collate all the shipping observations to try to get a good snapshot of that year? This would surely cost a small fraction of the funds consumed weekly by the Computer Models, and would just take a few slaves – oops, grad students – to research. As you point out, the absence of real data used prior to 1979 is a travesty. Especially when we are told about the ‘unprecedented decline’ of sea ice, and we can’t go back more than 30-odd years.”
This has already been done for every month of the 20th century by Walsh and Chapman 2001:
ftp://128.208.240.87/incoming/PolarFridays/2-walsh_2001.pdf
Updated graph:
http://arctic.atmos.uiuc.edu/cryosphere/IMAGES/seasonal.extent.1900-2010.png
It has also been done back to 1870 by Kinnard et al 2008, as reported in Polyak et al 2010:
http://www.cgd.ucar.edu/staff/mholland/papers/Polyak_2010_historyofseaiceArctic.pdf
Graph:
http://tamino.files.wordpress.com/2010/10/polyakfig2.jpg?w=500&h=340
Indeed Kinnard et al, 2011 has extended the summer sea ice record back 1,450 years by the use of proxies:
http://www.nature.com/nature/journal/v479/n7374/full/nature10581.html
Graph:
http://www.skepticalscience.com/graphics/Kinnard_2011_sea_ice_med.jpg
Now I wonder why Anthony doesn’t use any of those graphs to show us the cyclical nature of reductions in summer sea ice extent in the Arctic?
E.M.Smith
March 19, 2012 at 9:47 am
@DesertYote:
###
I did some hunting around and found a photo of the Skate in Portland England shortly after its shakedown. This was before any arctic operations. The tower looks the same as in the March 17 photo. So what I am probably seeing is the effects of slightly different lighting conditions on a subtlety complex shape. I had an eye exam with pupil dilation so looking at too many photos is not possible, also why it took so long to respond.
Tom Curtis,
Thanks for the additional papers estimating the pre satellite history of arctic sea ice. Although Walsh’s paper was published in 2001 He appeared to be skeptical of the anthropomorphic component of the sea ice decline but rather pointed to the domination of positive NAO. The arrested decline of sea ice the last few years appears to correlate with the resurgence of negative winter NAO. If this trend continues we may expect to see ice volume rebuild. The earlier reconstructed ice history is based on proxy’s that must differentiate between minimum summer anomalies and maximum summer anomalies which have not changed as much. I will read these papers carefully but I remain skeptical of all past reconstructions. It appears to be clear however that the little ice age likely represented a high for sea ice development during the Holocene and from which we are luckily receiving a reprieve.
From Tom Curtis on March 19, 2012 at 7:39 pm:
That graph? The data is available here:
http://arctic.atmos.uiuc.edu/SEAICE/
Concerning the 1901-onward data, read the documentation text file:
http://arctic.atmos.uiuc.edu/SEAICE/arctic.historical.seaice.doc.txt
Thus that is clearly not what Cui bono was asking for. Plus, there are clear warnings about the Walsh and Chapman data, namely that it may not be real measured data but from assorted types of infilling, and be careful with the pre-1953 data.
And what do we see in either Figure 4 in the paper or in the updated graph? At the warned-about place, a step change between 1952 and 1953. While winter shows a small increase, spring, summer, and fall show a strong drop, which shows up in annual. This indicates something may be off, and this is where the warning is, thus it is appropriate to treat this graph and the early “data” with suspicion, not to be used for serious work. (BTW this graph is incompatible with other graphs due to defining the seasons differently, as with defining winter as Jan-Feb-Mar, instead of the common meteorological seasons with winter being Dec-Jan-Feb in the Northern Hemisphere.)
Wow, you’ve done something amazing, you found something that’s even less than being not what Cui bono asked for. This massive compilation piece, bringing together proxies and other things, does yield up as source for “recent” Arctic sea ice extent info, 1870 to 2003, in the Figure 2 caption, as Kinnard et al 2008. Which one can find in the reference, and Google found the paper:
ftp://128.208.240.87/incoming/PolarFridays/9.1-Kinnard-2007GL032507.pdf
Which leads me to conclude you either didn’t check your sources or are engaging in deliberate obfuscation, as that paper clearly says, section 2, Data and Methods:
There it is, back to Walsh and Chapman, with caveats on the data laid out, including:
Reliable ice concentrations are only available from historical sources after 1953, and from satellite imagery since 1972. Prior to 1953, only the ice edge position is reliable.
A paywalled article? If you wanted to bring in proxies you could’ve just stopped at the previous paper link you gave.
Oh well, Google found it:
http://gizmo.geotop.uqam.ca/devernalA/Kinnard_et_al_nature_2011.pdf
And on the second page we find:
And what is reference 3? Walsh & Chapman 2001. What was reference 16?
Polyakov, I. et al. Long-term ice variability in Arctic marginal seas. J. Clim. 16, 2078–2085 (2003).
A. What you presented keeps going back to the same source, Walsh and Chapman, who have caveats on their work, a strong one for pre-1953. On the last one, that questionable source was used for proxy calibration. Calibration to a self-invalidated “standard”? That wouldn’t work from a laboratory to a manufacturing shop floor.
Why would Anthony want to definitively use work derived from such a self-cautioned source, especially the sources you gave which present themselves with an authority the originating source doesn’t even claim?
B. If you actually read Anthony’s post, you might have noticed he wanted pre-1979 satellite data. Got any?
C. To my reading, Anthony noted the cyclic nature in about the same way that Dr. Roy Spencer includes the third-order polynomial with the monthly UAH global temperature anomaly update, “for entertainment purposes”, mentioning how it looks cyclical without outright stating it as cyclical.
But now that you mentioned it, reference 16, the source of the Russian data used for calibration in the last paper you linked to, was found by Google. Here’s the Abstract:
Cyclical patterns, lack of statistically-significant long term trends. Got it?
Well, I see everyone’s glossed over the purloined letter: Sir Hubert Wilkins’ ashes. Hello? Anthropogenic soot? The science is settled. You’re welcome.
Working on some slogans… Cremation’s a crime! Give a hoot, don’t make soot! Don’t be an ash, send me cash!
Please, do your part and report soot deniers — but if you’re wrong, don’t come swimming to me!
What’s that? The ice is on the rise? I thought I heard a noise. Didn’t I tell you about the 17-year data analysis rule that starts right…now?
I’m sure my Nobel Prize is already in the mail.
Thanks for posting on the state of sea ice in the Arctic and the Antarctic! Please keep us updated through the NH melting season, especially in September.
Oh dear! I seem to have upset kadaka by using non-AGW skeptic pre-approved data sources. Lest anyone should look at the data and start to think, he quickly brings out the climate skeptic three step, which goes:
1) Does the data show me want I want to see?
2) If no, is the data perfect in every way?
3) If no, ignore data in its entirety as being irrelevant and flawed.
kadaka gives an example of state of the art three stepping.
For those who believe you should pay attention to the data available, and not just the data you want to be available, I note the following:
1) Walsh and Chapman construct a sea ice concentration record based available data, which prior to 1978 is based on reports from shipping and aircraft. Where such data is not available (and only where that data is not available) they assume that Arctic sea ice in the first half of the twentieth century behaved in the same way as it did in the last third of the twentieth century to extrapolate from known observations.
2) This is what Cui Bono asked for, despite kadaka’s protestations to the contrary. That is, it is a record of sea ice extent from shipping observations where-ever those observations are available. As noted previously, climatology is only used where such observations are not available, so unless Cui Bono wanted the impossible requirement that every grid cell have a ship board observation of ice extent for every month of the year so that no extrapolation is required, Cui Bono has got what he asked for. It should also be noted that it is possible to extract all extrapolated data from the data set quite easily to compare regional ice limits. Because the coverage is not complete, however, doing the precludes plotting a sea ice extent.
3) With regard to the reliability of the sea ice extent, Chapman and Walsh say in supporting documentation:
“It appears that the SMMR and SSM/I data contains significant differences
poleward of the ice edge for most months. Ice concentrations are
generally lower in the central Arctic for the these data than for
other data sources. Ice extents appear to be consistent across datasets,
ice areas derived from pre-1978 data may be significantly higher than
those calculated from the satellite period. The figure contained in
icearea.ps provided with this data illustrates the rather abrupt jump in
total northern hemisphere ice area around October 1978. The figure
contained in icextnt.ps, ice extents calculated assuming 100% coverage
everywhere ice was observed, illustrates that the extent data is more
consistant between data sources.”
Kinnard et al 2008 write:
“Reliable ice concentrations are only available from historical sources
after 1953, and from satellite imagery since 1972. Prior to
1953, only the ice edge position is reliable.”
So contrary to the impression kadaka tries to make, data on the limit of the ice extent is fairly reliable, particularly in the summer months when there was most shipping in the Arctic. There is a distinct exception to this point during the years of WW2, when restricted shipping resulted in very few observations of the Arctic sea ice limit.
4) Walsh and Chapman 2001 do not include data prior to 1901. Therefore the data in Kinnard et al 2008 from 1870 to 1900 is new data not included in Walsh and Chapman. Therefore kadaka’s claim that Kinnard et al 2008 contains no knew data is simply false.
5) kadaka’s objection to Kinnard 2011 appears to be only that it is a proxy study that does not come up with the right (from his point of view) result. It is certainly not that it was calibrated against the “unreliable” Chapman and Walsh data because the Chapman and Walsh data is not universally unreliable. Without determining the data sources for the calibration periods explicitly, which kadaka has not done, he is not able to make that determination. Specifically, he is not entitled to assume the August data in particular contains as much “climatalogical data” as the annual average, and hence that it is as uncertain as the annual average without explicitly looking at the sources of the August data cell by cell.
Tom, thanks for following up with all those links to extended time-series of ice concentrations. The Had1SST data set also relies on the earlier work by Chapman and Walsh. And the Figure that Anthony showed in this posting, was based on these earlier efforts of trying to blend the satellite observations from various sources together with ship, aircraft and other observations of the ice edge that were available prior to the launch of continuous data record from multi-channel passive microwave sensors. With these earlier data records, the ice concentrations would not be as reliable as the total ice extent, which is why most folks only show the extent.
One comment from the modeling results from the CMIP5 archive, the models do show trends of sea ice loss during the 1920s/1940s consistent with the warming trend during that time-period. I don’t see this in the sea ice records that date that far back (i.e. Chapman and Walsh), but that’s in large part because the ice cover has observational gaps and has been filled in with climatology. These trends rival some of what we saw in the 1990s, but not what we’ve seen the last decade. I know these are model results so some here may disregard them all together.
Kelly, 1979: An Arctic sea ice data ser 1901-1956, Glaciological Data 5, p. 101-106:
http://nsidc.org/pubs/documents/gd/GD-5_web.pdf
Hunt and Naske, 1977: A BASELINE STUDY OF HISTORIC ICE CONDITIONS IN THE
BEAUFORT SEA, CHUKCHI SEA, AND BERING STRAIT
http://www.arlis.org/docs/vol1/OCSEAP2/PhysicalScience/8516713/FP%20v01.pdf#page=122
Arctic Data: http://www.aari.ru/resources/m0001/sea_ice/CD1/VISUAL_ATLAS/Introduction/geo_distribution_of_sea_ice/arctic_data.htm
I think the pre-1953 data is more limited in Chukchi, Beaufort and Canadian Islands than in the Atlantic Sector (covered by DMI, norwegian maps, ACSYS)
kadaka (KD Knoebel) says:
March 20, 2012 at 12:38 am
Long-Term Ice Variability in Arctic Marginal Seas;
Polyakov et al. J Climate 2003, 2078-2085
Examination of records of fast ice thickness (1936–2000) and ice extent (1900–2000) in the Kara, Laptev, East Siberian, and Chukchi Seas provide evidence that long-term ice thickness and extent trends are small and generally not statistically significant, while trends for shorter records are not indicative of the long-term tendencies due to large-amplitude low-frequency variability. The ice variability in these seas is dominated by a multidecadal, low-frequency oscillation (LFO) and (to a lesser degree) by higher-frequency decadal fluctuations. The LFO signal decays eastward from the Kara Sea where it is strongest. In the Chukchi Sea ice variability is dominated by decadal fluctuations, and there is no evidence of the LFO. This spatial pattern is consistent with the air temperature–North Atlantic Oscillation (NAO) index correlation pattern, with maximum correlation in the near-Atlantic region, which decays toward the North Pacific. Sensitivity analysis shows that dynamical forcing (wind or surface currents) dominates ice-extent variations in the Laptev, East Siberian, and Chukchi Seas. Variability of Kara Sea ice extent is governed primarily by thermodynamic factors.
Like the sprinkling of salt on the back of a slug,
so is the confronting of climate apparatchiks with evidence of climatic oscillation and cycles
The reaction is predictable and entertaining!
From Tom Curtis on March 20, 2012 at 5:48 am:
In reality, I approached this like a circuit designer should approach a manufacturer’s warning, “Although this component is rated to xxx level, usage above yyy will yield possible distortion and instability thus should be done with caution.” Therefore only use it above yyy if you have to, nothing better is available, and accept your product may have distortion and instability when that level is exceeded and give appropriate warnings to the end user. You have provided products using that component as if they were suitable above yyy without giving said warnings. Bad vendor.
What cui bono said was:
You said:
Walsh and Chapman 2001 says in the abstract:
So right there you are already falsified as Walsh and Chapman did not collate all the shipping observations for every month of the 20th century.
Walsh and Chapman 2001 properly notes their database as an outgrowth of the pre-satellite data compilation of Walsh and Johnson 1979. They note the sources used for the pre-early 1950’s data:
cui bono asks for fresh ground sirloin, you offer packaged ground beef with pink slime added as what he asked for. Bad butcher.
Whoa, back up there. You quoted from the Walsh and Chapman supplementary documentation: “Ice extents appear to be consistent across datasets, ice areas derived from pre-1978 data may be significantly higher than those calculated from the satellite period.” Now that I brought it to your attention, you also note, as I had done, Kinnard 2008 says: “Prior to 1953, only the ice edge position is reliable.”
As I’ve seen on satellite-based extent maps before, there can be significant areas of open water or minimal concentration contained within the outer boundaries of the Arctic sea ice. Kinnard 2008 tells me the outer boundary position is reliable before 1953. Which means that significant areas of open water or minimal concentration were most likely missed pre-1953, inside the outer boundaries where shipping wasn’t observing them. Thus with the pre-1953 data one can calculate higher amounts of sea ice than what was actually there. Walsh and Chapman 2001 extends further, mentioning ice areas derived from pre-1978 data.
Thus taking the statement that the ice edge position is reliable and extrapolating from that “data on the limit of the ice extent is fairly reliable” is unsupported unless you strictly constrain yourself to the upper limit. A frequent bone of contention is if there was less Arctic sea ice circa pre-1979, you’re actually addressing if there could have been more by establishing an upper limit.
I feel an urgent need to “pull an Eschenbach” and demand you QUOTE MY WORDS, you malodorous squirt of codfish excrement. Thankfully though I shall restrain myself.
I didn’t make that claim. Kinnard 2008 said, as I quoted:
“We use the historical grids of Northern Hemisphere (NH) sea ice cover from the University of Illinois for the period 1870–2003 [Walsh and Chapman, 2001; hereafter termed WC dataset].” So Kinnard 2008 itself gives the provenance. Walsh and Chapman 2001 identifies the source: “We also note that the Norwegian dataset extends well back into the pre-1900 period, permitting even longer temporal excursions for the eastern North Atlantic.”
I already gave you the link to the University of Illinois Sea Ice Dataset:
http://arctic.atmos.uiuc.edu/SEAICE/
This is the work of Walsh and Chapman, coming off the earlier Walsh and Johnson work, Chapman is contact person, and from 1870 onward is available. I don’t know where you pulled out the idea that I claimed Kinnard 2008 didn’t have new data, I do know I’d only handle that idea with rubber gloves. What I was pointing out was the caveats of Walsh and Chapman still apply to Kinnard 2008, which is shown as Kinnard uses Walsh and Chapman work form 1870 onward with comes with the W&C caveats.
And your statement “Therefore the data in Kinnard et al 2008 from 1870 to 1900 is new data not included in Walsh and Chapman” is false in that Kinnard says they are using the WC dataset, Walsh and Chapman 2001 details their available data as including pre-1900, and have provided that data from 1870 onward.
[Insert Eschenbach moment with extra bolding and more all-caps]
My objection comes from my real-world experience with calibrating measuring instruments from standards. Kinnard 2011 is calibrated from a dataset with stated uncertainties, and from a less-complete dataset. It cannot duck those uncertainties. What I am damn well entitled to assume is calibration from a flawed standard can lead to a flawed product, which is not even an assumption but based on real-world demonstrated proof.
As to the figments of your fevered imagination that you have ascribed as mine and real, [activate “blood angrified mightily” Willis Eschenbach mode].
I am wise enough to understand the saying, “Do not argue with a fool lest onlookers cannot tell the difference.”
Kadaka has certainly said enough to give a pretext to those who want to ignore available but inconvenient evidence to do so.
I have said enough so that people who want their opinions to be guided by the evidence know the evidence is available and where to find it.
Kadaka only raises one substantive issue where he says, “I’ve seen on satellite-based extent maps before, there can be significant areas of open water or minimal concentration contained within the outer boundaries of the Arctic sea ice.” Sea ice extent is defined as the area in which sea ice represents 10% (or 15% depending on the study) or more of the surface area. It is very clear that prior to 1978 (if you look at the detailed data) Walsh and Chapman provide, they do not have that information inside the ice edge. It is also clear from the 1978 onwards that areas within the ice pack with sea ice concentrations as low as 60% are not uncommon. What you do not find is large areas of open water or with sea ice concentration below 20%. For that reason, the sea ice extent data from Walsh and Chapman are reasonably reliable,while the sea ice area data from the same source are not.
I have, of course, exclusively discussed sea ice extent. Kadaka, in turn, seems unable to distinguish between the two. If he disagrees, he need only provide an example of less than 20% sea ice concentration in the Arctic sea ice wholly enclosed by areas of greater than 20% sea ice concentration from within the satellite era. He will, of course, find a few such areas which do not have naval access to the Atlantic of Pacific Ocean when the ice has melted away from parts of the Russian coastline, or withing the straits of the Canadian Archipelago, but such instances where observed and occur throughout the Walsh and Chapman record, and hence are not germane.
I will confidently predict that he will not find even one such instance where the area of low sea ice concentration enclosed represents even 10% of the total sea ice extent. He will certainly not find sufficient to suggest this is a major source of error in Walsh and Chapman’s record.
Rabe,
The Sun’s upper limb was likely above the horizon on March 17, 1959, given the high refraction expected from Arctic winter temperatures.
From Tom Curtis on March 20, 2012 at 11:30 pm:
Therefore you should not argue with yourself in public.
Which you have shown yourself remarkably able to do even without the purported pretext.
And of the evidence you have provided, I have shown how the paths keep leading back to Walsh and Chapman, which has serious caveats that restrict that data and work derived from it from claiming the authoritativeness you insist on ascribing to it.
Actually I raised several, but go on anyway.
Gee, let me refer to the definitions of extent and area on the IARC-JAXA Sea Ice Page (I miss those updates):
With 10% concentration, a cube of solid ice a meter to a side yields the same extent as a square meter of slush of at least 10% ice concentration. For area a square meter of 10% slush is recorded as 1/10 of a square meter. In both cases the cube is still a larger amount of ice than that in the slush. Neither metric properly represents the amount, the volume, of ice, but area comes closest.
Dang, here I though I was clear enough that an idiot could follow. Guess I was wrong. As I said: “Thus with the pre-1953 data one can calculate higher amounts of sea ice than what was actually there.” “A frequent bone of contention is if there was less Arctic sea ice circa pre-1979, you’re actually addressing if there could have been more by establishing an upper limit.” I was talking about amounts of sea ice, the volume, with area being the closest metric.
Actually I do disagree with your assertion I don’t know the difference between area and extent, and all I really had to do was show that I know. I’ve been on this site over two years, the difference has come up and been discussed many times in the past.
In any case, my focus was the pre-1953 data, and I’ve established it has problems, Walsh and Chapman have noted it has problems, therefore that derived from that data has problems. You’ve even admitted there are problems: “For that reason, the sea ice extent data from Walsh and Chapman are reasonably reliable,while the sea ice area data from the same source are not.” Thus it is hard to know if the amount of Arctic sea ice was more or less pre-1953.
Caveats on the W&C dataset are further detailed by Chapman, see the “Expert User Guidance” section:
http://www.cgd.ucar.edu/cas/guide/Data/walsh.html
Got that? North of the boundary, 100% was assumed. So amount of ice would be overestimated. To compare with modern satellite data, as best one can, treat the modern as if extent was area (100% ice). In other words, overstate the modern amounts of ice to compare with the old data. So Walsh and Chapman is not a definitive source for determining if there was more or less sea ice in the past, likewise that derived from it.
I admit I have neither the skills, time, nor the connection speed for such a search, and the tricky area calculations have been a source of notable contention on this site before. Do you have any idea how long it takes to download a single Cryosphere Today map on dial-up?
But the University of Bremen, following the AMSR-E loss, now has SSMIS-derived maps:
http://www.iup.uni-bremen.de:8084/ssmis/index.html
The small Sep 2011 to date animation allowed me to home in on two interesting times, and there are detailed-enough small png files of individual dates in the archives. From Oct 25 to 30, 2011, there’s a significant area between about 120° and 135°E that gets encircled. When going by shipping reports and observations from the shore, such would have been missed.
Then there’s the start of the animation, Sep 1, 2011. Look at the outer boundary, the bits of open water and large areas of low concentration contained within that boundary. For the old W&C data, all that contained area would be considered 100% ice. It only takes a look to know that’d be more than a 10% overstatement right there. Sep 5 map, same thing, actually could be worse.
And I’ve found those by briefly looking at less than a single year of satellite-era maps.
I suppose if you don’t mind working with the worst available metric, where a million square kilometers of 20% slush is the same as a million square kilometers of multi-year sea ice several meters thick, then you likely won’t see much difference. But for those of us who prefer more realistic measurements of reality, who would prefer to know the actual amounts of sea ice or at least as close to them as possible, Walsh and Chapman will continue to be problematic.
The Archive site now credits one “Graham P. Davis” for the photo id. I don’t know who Graham P. Davis is, but a quick search showed that he appears in a few blog comments volunteering the information, without references, that the photo is in fact not at the North Pole and the date is summer of 1958. This particular comment of last week follows a post on especially bad weather in the UK http://www.weather-banter.co.uk/uk-sci-weather-uk-weather/161453-daily-express-again.html and seems to suggests a particular edge to his point of view.
“I’m not sure that I can go along with you on there *always* seeming to
be a slack airflow over the Pole though it seems to be true for this
coming week. Here’s a special example – only one, I admit – where the
airflow wasn’t particularly slack. It’s also the occasion that AGW
-contrarians cite as proof that there was open water at the Pole in
March 1959.”
So evidently this individual was able to get the Navsource site to make the change. Readers can judge whether this constitutes “revisionism.”