by Bob Tisdale
HAPPY 30TH BIRTHDAY REYNOLDS OPTIMUM INTERPOLATION (OI) SEA SURFACE TEMPERATURE DATA
The Reynolds OI.v2 Sea Surface Temperature data now covers a time period from November 1981 to November 2011. Will NOAA now be changing the climatology for this dataset?
MONTHLY SST ANOMALY MAP
The following is a Global map of Reynolds OI.v2 Sea Surface Temperature (SST) anomalies for November 2011 downloaded from the NOMADS website. The contour levels are set at 0.5 deg C, and white is set at zero.

November 2011 Sea Surface Temperature (SST) Anomalies Map
(Global SST Anomaly = +0.088 deg C)
MONTHLY OVERVIEW
Monthly NINO3.4 Sea Surface Temperature anomalies well within the range of a moderate La Niña event. The Monthly NINO3.4 SST Anomaly dropped slightly (about 0.05 deg C) to -0.925 deg C.
Sea Surface Temperature anomalies for both hemispheres dropped again in November, with a greater decline in the Northern Hemisphere, similar to last month. The Global Sea Surface Temperature anomalies are presently at +0.088 deg C.

(1) Global Sea Surface Temperature Anomalies
Monthly Change = -0.023 deg C
####################################

(2) NINO3.4 Sea Surface Temperature Anomalies
(5S-5N, 170W-120W)
Monthly Change = -0.047 deg C
####################################
THE EAST PACIFIC VERSUS THE REST OF THE WORLD
The East Pacific and the Rest-Of-The-World (Atlantic-Indian-West Pacific) datasets were first discussed in the post Sea Surface Temperature Anomalies – East Pacific Versus The Rest Of The World.Both datasets have been adjusted for the impacts of volcanic aerosols. The global oceans were divided into these two subsets to illustrate two facts. First, the linear trend of the volcano-adjusted East Pacific (90S-90N, 180-80W) Sea Surface Temperature anomalies since the start of the Reynolds OI.v2 dataset is basically flat. The East Pacific linear trend varies with each monthly update. But it won’t vary significantly between El Niño and La Niña events.

(3) Volcano-Adjusted East Pacific Sea Surface Temperature (SST) Anomalies
(90S-90N, 180-80W)
####################################
And second, the volcano-adjusted Sea Surface Temperature anomalies for the Rest of the World (90S-90N, 80W-180) rise in very clear steps, in response to the significant 1986/87/88 and 1997/98 El Niño/La Niña events. It also appears as though the Sea Surface Temperature anomalies of this dataset are making another upward shift in response to the most recent ENSO event. For those who are interested in the actual trends of the Sea Surface Temperature anomalies between the 1986/87/88 and 1997/98 El Niño events and between the 1997/98 and 2009/10 El Niño events refer to Figure 4 in Does The Sea Surface Temperature Record Support The Hypothesis Of Anthropogenic Global Warming? I further described (at an introductory level) the ENSO-related processes that cause these upward steps in the post ENSO Indices Do Not Represent The Process Of ENSO Or Its Impact On Global Temperature.
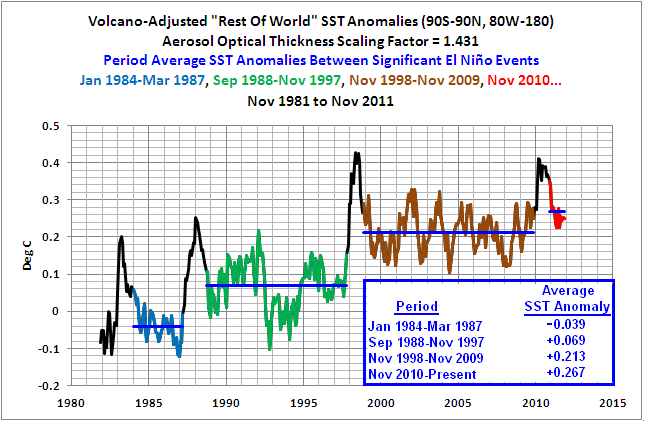
(4) Volcano-Adjusted Sea Surface Temperature Anomalies For The Rest of the World
(90S-90N, 80W-180)
####################################
The periods used for the average Rest-Of-The-World Sea Surface Temperature anomalies between the significant El Niño events of 1982/83, 1986/87/88, 1997/98, and 2009/10 are determined as follows. Using the NOAA Oceanic Nino Index(ONI) for the official months of those El Niño events, I shifted (lagged) those El Niño periods by six months to accommodate the lag between NINO3.4 SST anomalies and the response of the Rest-Of-The-World Sea Surface Temperature anomalies, then deleted the Rest-Of-The-World data that corresponds to those significant El Niño events. I then averaged the Rest-Of-The-World SST anomalies between those El Niño-related gaps.
The “Nov 2010 to Present” average varies with each update. As noted in the post Sea Surface Temperature Anomalies – East Pacific Versus The Rest Of The World, it will be interesting to see where that Sea Surface Temperature anomaly average settles out, if it does, before the next significant El Niño drives them higher.
Of course, something could shift. Will the upward ratcheting continue when the Atlantic Multidecadal Oscillation (AMO) decides to turn around and start its decline? The upward steps would not continue in the North Atlantic, but would the AMO impact the upward steps in other portions of the globe? For more information about the Atlantic Multidecadal Oscillation, refer to the post An Introduction To ENSO, AMO, and PDO — Part 2.
The Sea Surface Temperature anomalies of the East Pacific Ocean, or approximately 33% of the surface area of the global oceans, have decreased slightly since 1982 based on the linear trend. And between upward shifts, the Sea Surface Temperature anomalies for the rest of the world (67% of the global ocean surface area) remain relatively flat. Anthropogenic forcings are said to be responsible for most of the rise in global surface temperatures over this period, but the Sea Surface Temperature anomaly graphs of those two areas prompt a two-part question: Since 1982, what anthropogenic global warming processes would overlook the Sea Surface Temperatures of 33% of the global oceans and have an impact on the other 67% but only during the months of the significant El Niño events of 1986/87/88, 1997/98 and 2009/10?
EAST INDIAN-WEST PACIFIC
I’ve eliminated the presentation and discussion of the East Indian-West Pacific data. It seemed redundant with the Rest-Of-The World data discussed above, and would have detracted from it.
NOTE ABOUT THE DATA
The MONTHLY graphs illustrate raw monthly OI.v2 SEA SURFACE TEMPERATURE anomaly data from December 1981 to November 2011, as it is presented by the NOAA NOMADS website linked at the end of the post.
MONTHLY INDIVIDUAL OCEAN AND HEMISPHERIC SEA SURFACE TEMPERATURE UPDATES
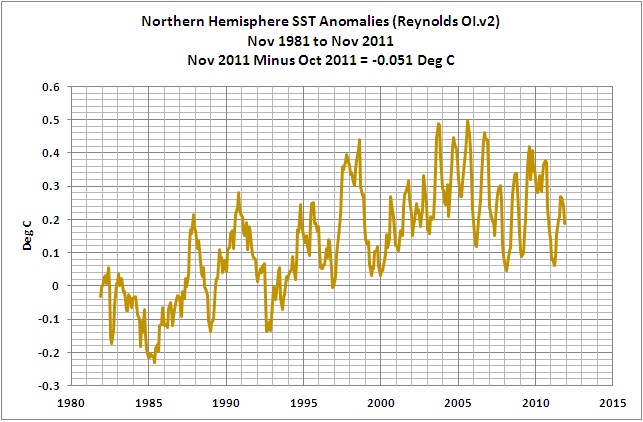
(5) Northern Hemisphere Sea Surface Temperature (SST) Anomalies
Monthly Change = -0.051 deg C
####################################

(6) Southern Hemisphere Sea Surface Temperature (SST) Anomalies
Monthly Change = -0.002 deg C
####################################

(7) North Atlantic Sea Surface Temperature (SST) Anomalies
(0 to 70N, 80W to 0)
Monthly Change = -0.154 deg C
####################################

(8) South Atlantic Sea Surface Temperature (SST) Anomalies
(0 to 60S, 70W to 20E)
Monthly Change = -0.094 deg C
Note: I discussed the (now apparently temporary) upward shift in the South Atlantic Sea Surface Temperature anomalies in the post The 2009/10 Warming Of The South Atlantic. It NOW appears as though the South Atlantic MAYreturn to the level it was at before that surge, and where it had been since the late 1980s. We’ll have to see where it settles.
####################################

(9) North Pacific Sea Surface Temperature (SST) Anomalies
(0 to 65N, 100E to 90W)
Monthly Change = +0.081 Deg C
####################################

(10) South Pacific Sea Surface Temperature (SST) Anomalies
(0 to 60S, 120E to 70W)
Monthly Change = -0.035 deg C
####################################

(11) Indian Ocean Sea Surface Temperature (SST) Anomalies
(60S to 30N, 20E to 120E)
Monthly Change = +0.128 deg C
####################################

(12) Arctic Ocean Sea Surface Temperature (SST) Anomalies
(65N to 90N)
Monthly Change = -0.323 deg C
####################################

(13) Southern Ocean Sea Surface Temperature (SST) Anomalies
(90S-60S)
Monthly Change = -0.057 deg C
####################################
WEEKLY SEA SURFACE TEMPERATURE ANOMALIES
The weekly NINO3.4 Sea Surface Temperature (SST) Anomalies are still cycling near the threshold of a moderate La Niña event. The NINO3.4 Sea Surface Temperature anomaly based on the week centered on November 30, 2011 is -1.130 deg C.

(14) Weekly NINO3.4 Sea Surface Temperature (SST) Anomalies
####################################
The weekly global Sea Surface Temperature anomalies dropped considerably over the past few weeks and are at +0.019 deg C.

(15) Weekly Global Sea Surface Temperature (SST) Anomalies
####################################
ABOUT: Bob Tisdale – Climate Observations
SOURCE
The Reynolds Optimally Interpolated Sea Surface Temperature Data (OISST) are available through the NOAA National Operational Model Archive & Distribution System (NOMADS).
http://nomad3.ncep.noaa.gov/cgi-bin/pdisp_sst.sh
Pretty much going downhill. Remember that the Northern hemisphere SST gives the shape to the “global” record. Both North Pacific and North Atlantic have peaked in 2005/2006 and are now on the 30-year cooling trend just as happened before. Antarctic is cold. Southern Pacific in a free fall. Southern Atlantic down again. The only exception is Indian ocean. So either increased back-radiation is not there, or is completely overridden by something else.
Your data is insufficiently alarming,
so don’t publish it until CRU adjusts it
to reflect the horrible realities of global warming.
how is the Argo data shaping up in comparison?
Off topic. I saw the following on ICECAP.US;
http://www.tech-know.eu/uploads/JCao_N2O2GreenGases_Blog.pdf
Unfortunately, I’m not smart enough to know if it makes sense or not. If it does make sense, it would be quite interesting. Can someone please look and comment? Thanks. Jesse
Great work Bob! The following says it all really!!
Anthropogenic forcings are said to be responsible for most of the rise in global surface temperatures over this period, but the Sea Surface Temperature anomaly graphs of those two areas prompt a two-part question: Since 1982, what anthropogenic global warming processes would overlook the Sea Surface Temperatures of 33% of the global oceans and have an impact on the other 67% but only during the months of the significant El Niño events of 1986/87/88, 1997/98 and 2009/10?
OT: You have been smeared as “charlatan” over at [Un-]Real Climate by Daniel Bailey. I would wear it as a badge-of-pride that you are being vilified at [Un-]Real Climate.
http://www.realclimate.org/index.php/archives/2011/12/unforced-variations-dec-2011/comment-page-3/#comment-221288
Message No. 101
Daniel Bailey says:
4 Dec 2011 at 7:13 PM
@ s.radun
Those such as he [Vukcevic] rely on the power of the eyecrometer to beguile the innocent. Facts, cites to supportive literature, a slavish adherence to the physics of this world and an open description of the methodology used are inconvenient to that end; as such their lack is the hallmark of the specie[s]. Examples abound on the webs, from G. White to Tisdale to Gaddes to Cotton.
diogenes says: “how is the Argo data shaping up in comparison?”
I posted the 3rd quarter NODC OHC data update a couple of days ago:
http://bobtisdale.wordpress.com/2011/12/02/july-to-september-2011-nodc-ocean-heat-content-anomalies-0-700meters-update-and-comments/
Regards
Ninderthana: Thanks for the link.
The Global Sea Surface Temperature Anomalies Fig 1 pretty much accords with the satellite troposphere data set, ie., iy shows an essentially flat trend before 1997/8 and an essentially flat trend after 1999 but with a step change around 1997/8. This similarity/comfirmation suggests that the satellite data set is sound and to be preferred to GISS and Hadcru etc
Bob
Thanks again for another excellent post and all the obvious work you do to provide these posts. I see from your About page that you find yourself in need of funds to continue your work. I have seen numerous reports that major corporations involved in the production of petroleum products are literally falling all over themselves to throw money at people such as yourself and since almost every major media source says that the people making these reports are utterly reliable and beyond reproach, a couple of quick emails to these corporations should have bags of cash flying in over your transom. Although it shouldn’t be necessary I’ll add a LOL. Good Luck and please know that your efforts are very much appreciated.
Further to my post at 9:38 am, perhaps I should have attached a link to the plots referred to. See, for example:
http://www.woodfortrees.org/plot/uah/from:1980/to:2011/plot/rss/from:1980/to:2011/plot/none
A lot of useful data here. One minor point. The Arctic ocean has a huge spike in temperatures in 2007 and a record low for summer sea ice. The huge spike can only be from changes in currents, and not from a general temperature increase. This is confirmed by the massively increased temperature volatility.
North Atlantic SST if BEST is to believe plays important role in the global temperature trends. For an alternative view of causes and consequences:
http://hal.archives-ouvertes.fr/docs/00/64/12/35/PDF/NorthAtlanticOscillations-I.pdf
just ignore bundles of correlation numbers and concentrate on more interesting and important bits.
I wonder if the contemporaneous “divergence problem” tree ring data agrees with the SST and satellite data and it is the GISS and Hadcru (which have significant overlap but differ in their “homogenizing”) that are the outliers???
Why the large adjustment in NODC OHC?
In referrence to the November 2011 Sea Surface Temperature (SST) Anomalies Map, why are the temperature anomalies linear and for the most part perpendicular to the conveyor belts such as the Gulf Stream? That’s what appears to be anomalous.
Global SSTs were +0.019C (versus the 1971 to 2000 average) last week.
Wake me up when that number gets to +1.0C.
DR says: “Why the large adjustment in NODC OHC?”
I assume you’re talking about the adjustment to the values for last quarter. I have not found any mention of it at the NODC website.
Manicbeancounter says: “The Arctic ocean has a huge spike in temperatures in 2007 and a record low for summer sea ice. The huge spike can only be from changes in currents, and not from a general temperature increase…”
For the Arctic Sea Surface Temperature readings, in the areas where there had been permanent sea ice during the base years of 1971 to 2000, the ice was provided a sea surface temperature that’s the freezing temperature of sea water. That’s entered into the climatology. Then when there are the freakish years like 2007 with a lot of seasonal sea ice melt, the measured sea surface temperature is being compared to the freezing temperature of sea water for the anomalies.
And yes, there were many things that impacted the 2007 seasonal sea ice melt in the Arctic. If memory serves me well, one of them was a reversal of the Beaufort gyre.
Bill Illis says: “Wake me up when that number gets to +1.0C.”
We’ll have to call you Rip Van Illis at that time..
I’m interested in what that left over warm pool is doing. As time goes by and we have one La Nina after another with mild El Nino’s sprinkled here and there, my hunch is the size of that warm pool in the Northern Pacific is going to get cooler and cooler. Eventually, the whole pond gets quite cool. So. What has that warm pool been doin over time? Maybe what we should be talking about in addition to what happens around the tropics, is what happens where ice forms. Lots of ice. Lots and lots of ice.
The Arctic ocean has a huge spike in temperatures in 2007 and a record low for summer sea ice. The huge spike can only be from changes in currents, and not from a general temperature increase. This is confirmed by the massively increased temperature volatility.
The temperature spike is probably a measurement artifact.
Undetected sea ice is causing some unrealistically warm SST values to appear in these products (satellite measured SSTs). The problem is most apparent near ice edges, especially as the ice edge advances or retreats.
http://www.ssmi.com/sst/microwave_oi_sst_data_description.html
Jesse;
That paper makes a very (IMO) plausible point: non-radiative gases have no way to cool themselves; only radiative ones do. Hence the entirety of heat flow amongst them is from non-rad to rad, which lose their energy radiatively to space. Hence the more there are, the more the atmosphere is cooled.
It must be right, as it disagrees 180° with AGW-GHG theory.
ocean = dog
climate = tail
global ocean (SST) cooling = global climate cooling