Guest post by Joseph D’Aleo, CCM, AMS Fellow, WeatherBell Co-Chief Meteorologist
June temperature and precipitation rankings are in.

Enlarged. Warmest in Texas, Second warmest in Oklahoma.

Enlarged Driest in New Mexico. Fourth driest in Oklahoma. Fifth driest in Texas. Wettest in California.
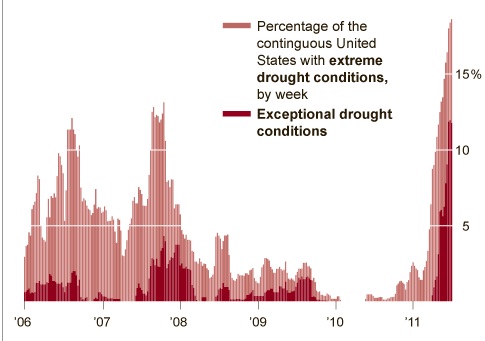
Texas and Oklahoma has felt the brunt of the 14 state drought that has plagued the south this past winter and into the summer. Almost 20% of the United states is said to have been affected by drought.

The traditional Palmer Drought Severity Index through Saturday looks like this.

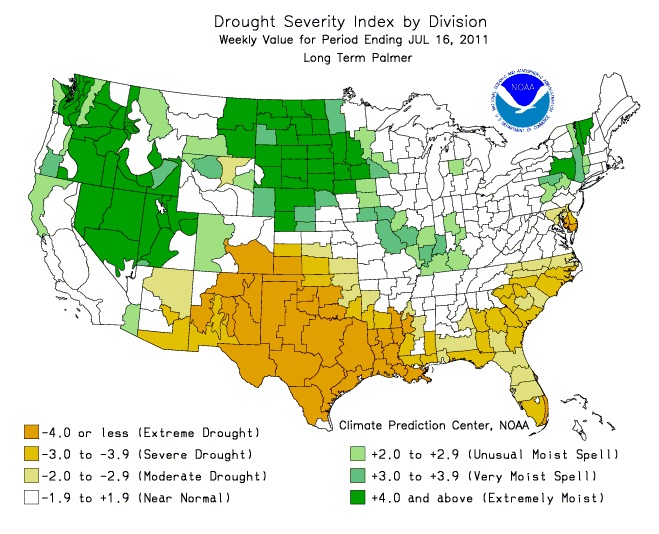
Slow improvement has occurred further east along the Gulf Coast and in the desert southwest as seen in this shorter term drought blend. More rains have fallen since the 9th in Louisiana.

The precipitation anomalies in the last 14 days from Louisiana east have been in many areas well above normal, making a dent in the drought. Reportedly up to 13 ionches fell in parts of Lourisiana in the latest heavy rains. Little help has come to most of Texas.

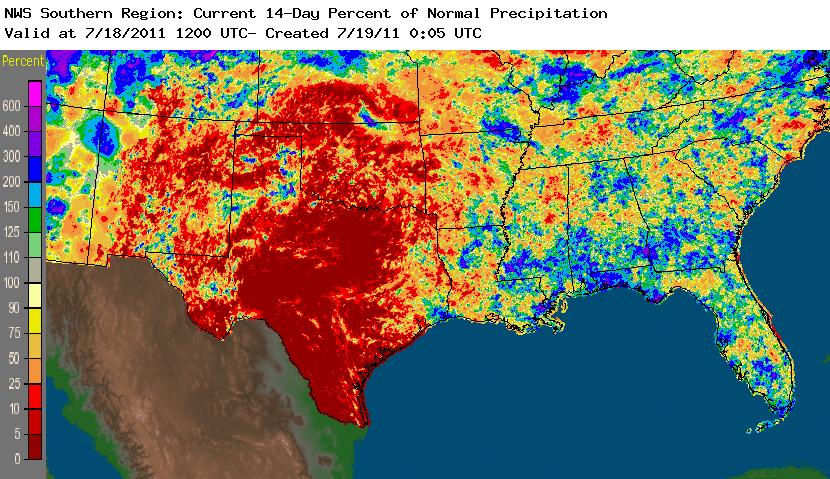
In an earlier post we showed how since south central drought relates to the strength of La Nina in the prior winter and this winter ranked the second strongest on record, a severe Texas drought is not surprising.
Here was the Southern Oscillation Index (SOI) since 1876. The only strong La Nina from this atmosphere ENSO emasure was in 1918.

Here was the Palmer Drought Severity Index in July 1918.

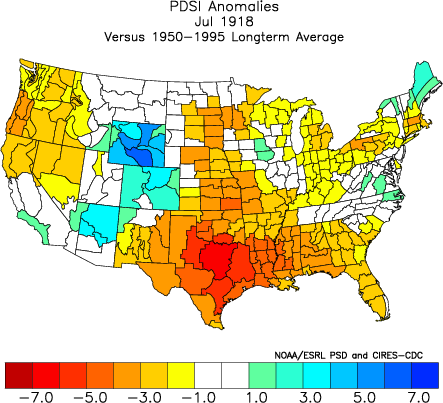
The Multivariate Enso Index or MEI bottomed out in 1956, the only period sincce 1950 with a stronger La Nina. Here was the Palmer Drought Severity Index in July 1956

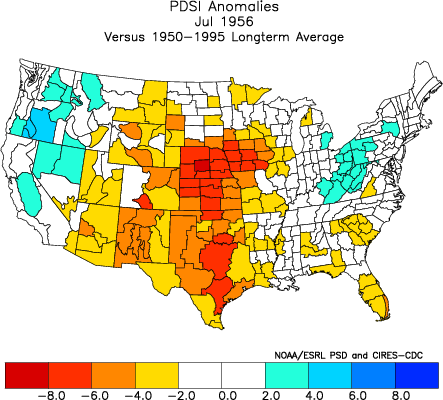
Compared to the near 20% of the country in serious drought, the 1950s when up to 60% was affected and especially the 1930s when 80% of the United States felt the effect of drought and heat.

The 1930s drought peaked in 1934. the drought was centered further north in 1934.

Though the heat wave has spread into the wet areas further north this week creating a literal sauna, the rains and cooling will return there n the next 8 days but the drought will persist in parts of the southern plains. The next 8 day total rainfall shows this. The heat ridge ring of fire is very evident actually shrinking a bit as some showers coming to the southern parts of Texas.

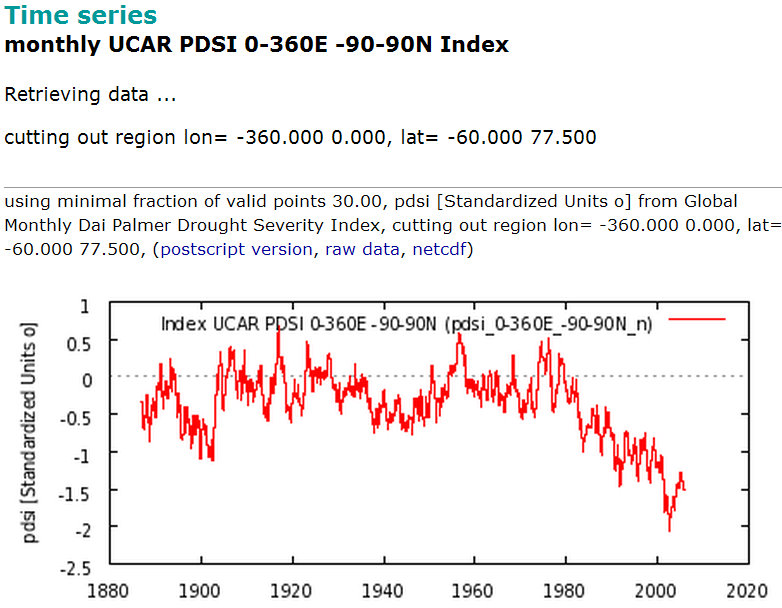
A plot of the worldwide data for the Palmer Drought Severity Index shows that there has been an unprecedented decrease in world drought severity over the past 30 years, possibly due to the plant enhancing increase of CO2.

Enlarged H/t Hockey Stick for this graphic.
Co Chief Meteorologist Joe Bastardi and I post everyday on weather and climaate issues on WeatherBell.com. For the hobbyiests, our premium blog has daily posts like this and daily Weatherbell blog and FOX Business videos and access to model and other data. We both focus on the short, medium and long range weather and climate and our insight may help your business and personal planning. In our commercial section we have daily special reports for energy, agriculture, hedge funds and retail markets with outlooks for 20 days, months, and seasons. Please help us build that business. If you enjoyed Joe Bastardi’s posts and videos and Intellicast’s Dr. Dewpoint, this blog is for you.
Yikes! Anthropogenic Global Warming has been plaguing humanity since 1918!!
It’s worse than we thought!!!
As my wife said, a total novice in science, “There seems to be a lot of humidity in this ‘heat wave’ ”
Yup. This is farmers weather.
Regarding the last graph in this post, a commenter pointed out on my site that The Palmer Drought Severity Index uses an inverse scale in which more negative numbers reflect MORE drought. The post was updated with this correction and I apologize for the misinterpretation. Therefore, the time series shows global drought has instead increased over the past 30 years.
Global precipitation has also decreased over the past 30 years, but this is at odds with the IPCC refrain that global warming causes increased water vapor/precipitation:
http://hockeyschtick.blogspot.com/2011/07/global-precipitation-fails-to-obey.html
Mr. Schtick;
Not surprising, since the IPCC focusses on irrelevant variables almost exclusively.
Joseph;
Take a stand. Don’t fudge by spelling “hobbyists” with both an “i” and and “e”. 😉 :p
[snip – off topic – this thread is about drought not Arctic Ice, please repost in Tips and Notes ~mod]
Global precipitation has also decreased over the past 30 years, but this is at odds with the IPCC refrain that global warming causes increased water vapor/precipitation:
Global Warming has been propped up by the shutdown of rural stations and bad sensor locations/design. Rain guage readings most likely are suffering the same malaise of scarcity. Around here, there are examples of guages that are reported broken for long periods of time. Something to scrutinize. Bet you won’t like what you find.
pat says:
July 23, 2011 at 10:53 pm
As my wife said, a total novice in science, “There seems to be a lot of humidity in this ‘heat wave’ ”
Yup. This is farmers weather.
Sounds like you have a good old English heatwave. Hot and sweaty.
We in OZ suffered a long drought that has now end in ample rain fall and bellow normal temps.
It is your turn, we will take it back when it is our turn. Weather is always a topic in every day conversation, as in bloody hot ain’t it or jeez it’s cold. Wish this rain would stop, tanks are getting low b@gger we need some rain soon. Weather!!
I’m replacing my St Augustine with prickly pear.
Mike in Houston
When I read such posts as this I have the distinct advantage by being an intellectual dimwit of no scientific background whatsoever. However, as a retired Master Mariner who has 60 years of experiencing many of the weather phenomena as reported and analysed, from this site and other sources, my main inference is that there is no such thing as “global” and the constant attempts of climatologists to use the concept of “global” is the elephant in the room which reduces the entire debate to a farce. The above post, for example is precise, centred, meaningful, and interesting but has no relevance to arctic ice loss, (By wind action through the greenland sea mainly it would appear), or to the Russian heatwave, (a deflection of the jet stream allowing a blocking high to remain stationary possibly), or to Australian flooding, (poor use of flood prevention dams and an unusually warm sea area off the coast I am told). So my point is that there is local, coastal, continental, arctic, antarctic, oceanic, tropical, temperate, maritime, desert, etc weather and climate but there is no “global”. The idea of taking a temperature from the Mojave desert in July and averaging it with the coldest temperature from the continental ice sheet at the south pole in July is farcical. This may explain why Weathermen seem to talk sense, Atmospheric physicists seem to talk sense as they talk about the physical properties of the atmosphere not the inferred/invented properties, geologists seem to talk sense about the Earths rebound in the current interglacial, and climate scientists spout complete BS a lot of the time as they try and unify that which has no unity. Einstein managed to draw together many strands to mathematically deduce the theory of relativity, which has yet to be disproved, but he never managed to develop a unified theory. It is my humble opinion that there is no “unified theory” of climate and that we would better spend our time and money building dams to mitigate flooding and drought; sea defenses to mitigate storm surges and Tsumami; reliable nuclear, clean coal and gas power plants to mitigate energy poverty throughout the world and give the climate scientists a wheelbarrow and a pickaxe each and send them off to do something useful like clearing the leaves out of drains in the Autumn and removing chewing gum from the pavements. Once they have been surgically removed from their computer keyboards and experienced a bit of fresh air they may realise that we have roughly the same weather now as we had 60 years ago and will have in 60 years time, with many interesting and some exciting variables on the way.
Excellent post Disko Troop.
IMH(and uneducated)O the null hypothesis still has not been disproven.
Climate does change over time, and it’s chaotic, period.
Today’s “weather” should be expected.
It might be a little colder or warmer than last year.
It might be a little wetter or drier than last year.
Now, has someone proven that wrong.
Anthony — Joe’s post is very interesting, but his final graph is evidently upside down. This needs correcting inline!
Out here in the Badlands of New Mexico, we’ve had a drought that is going on about 800 years now. All that changes is how bad the drought is, not whether there is one. And now we’ve had a fire that burnt up about 250 square miles of trees. That is probably going to change our weather patterns some, and probably not for the better.
A few “enlarge” links don’t appear to be working. Please recheck them. Another very good review, helping to put current weather into perspective. I look forward to seeing these reviews.
As already noted, the interpretation of the Palmer graph using UCAR data is incorrect. However, to be perfectly honest, I don’t think that the UCAR graph makes any sense regardless of whether it shows an increase or decrease in global drought. One of the most recent studies found little global trend in the last fifty years, and little local trends either:
Sheffield, J., K. M. Andreadis, E. F. Wood, D. P. Lettenmaier, 2009: Global and Continental Drought in the Second Half of the Twentieth Century: Severity–Area–Duration Analysis and Temporal Variability of Large-Scale Events. J. Climate, 22, 1962–1981.
doi: 10.1175/2008JCLI2722.1
The UCAR graph appears to be the work of Kevin Trenberth. I’m not surprised that he comes to such divergent conclusions from most other investigators, but I wouldn’t put any stock in it.
Regarding the idea of global precipitation changes in the last thirty years, one must distinguish between increased precipitation over all land and ocean areas when combined, and over just the land. Only the former is universally predicted by current climate models, the latter models disagree wildly on, some increasing precipitation in places where others increase it wildly. Presently we have an extensive gauge network over most land areas, but over the oceans we are essentially reliant on satellites. TRMM gives decent coverage over the tropics, this still leads much of the high latitudes inadequately monitored. Only with complete coverage can one close the water budget and determine truly whether precipitation has globally increased/decreased with warming.
If the graph is right, then perhaps the language should be changed. Common word usage suggests that a positive “drought severity index” means a more severe level of drought.
Has the Pacific hurricane “Dora” sent any moisture up towards Texas?
Interesting posting and informed comments, as usual. I have to say that I was impressed by the comment of Disko Troop, who summed up the question quite succinctly. He isn’t yet aware, but I’ll either be quoting or paraphrasing him in the future.
IanM
“Co Chief Meteorologist Joe Bastardi and I post everyday on weather and climaate issues on WeatherBell.com. ”
So, is that the climaate on Eaarth you cover? 😉
Turn that last figure the right way up and it looks like a hockey stick to me 🙂
Or, as my friend Smokey might say:
“A plot of the worldwide data for the Palmer Drought Severity Index shows that there has been an unprecedented
decreaseincrease in world drought severity over the past 30 years, possibly due to the plant enhancing increase of CO2.”There, fixed that for ya 🙂
The current events are far worse than every before.
HCD
Horrific Climate Dismemberment
I farm in Texas.
1998 and 2005/2006 were far worse than this year.
We are getting rain this year whereas in 98 and 05/06 we got no rain during the growing season. And it was significantly warmer.
Old timers tell me the 50s were dry but ponds did not go dry like they did in 2006.
Just wanted to add that in parts of East and North Texas where annual rain fall is 40+ inches you can find desert adapted plants and grasses that usually are found in areas with 15 inches of rainfall or less. These plants are ecological oddities and could only be present if in the recent past things were far drier than now and the plants moved in.
Joe – great post ! I greatly appreciate it. But my radar is up on the global (inverted) Palmer drought severity index. It looks a little too “convenient” to me if you know what I mean…?
Call me a skeptic – its ok.
Interestingly, in all the analog years, drought extends all the way up Dakotas, if not all the way to the Canadian Border (and probably beyond in some cases, especially the Dust Bowl drought) But Current Drought is restricted to South of Nebraska.
You know, NOAA has drought reconstruction maps, too, allowing for the possibility of identifying even more previous cases throughout the centuries. Working through them, so far 1780 looks similar, 1786, 1789, 1801, 1805, 1806, 1831, 1855, 1859, 1860, 1862, 1886, also 1909 all have Texas centered droughts, along with several other years with droughts widespread throughout the US. 1925 is also pretty bad in Texas, 1967, 1978…all these are years of either reconstructed or observed dry conditions centered on Texas. The reconstructions may or may not be very good at capturing the reality of the extant and precise pattern of droughts, but these were probably all dry in Texas. Most long before AGW could play a role, including the worst ones.
Check it out:
http://www.ncdc.noaa.gov/paleo/drought/animation/pdsi_animation.html
Caleb @ 9:48 am Jul 24
No, none of Dora’s moisture made it into TX.
All this arm-waving about what is simply regional weather reminded me of this Irish classic:
as a young freshman at UT in 1968 dr. sabah{?} taught us that the earth’s climate continually changed due to many and various influences and yes sometimes it even got warmer, without the help of mankind. chv legman