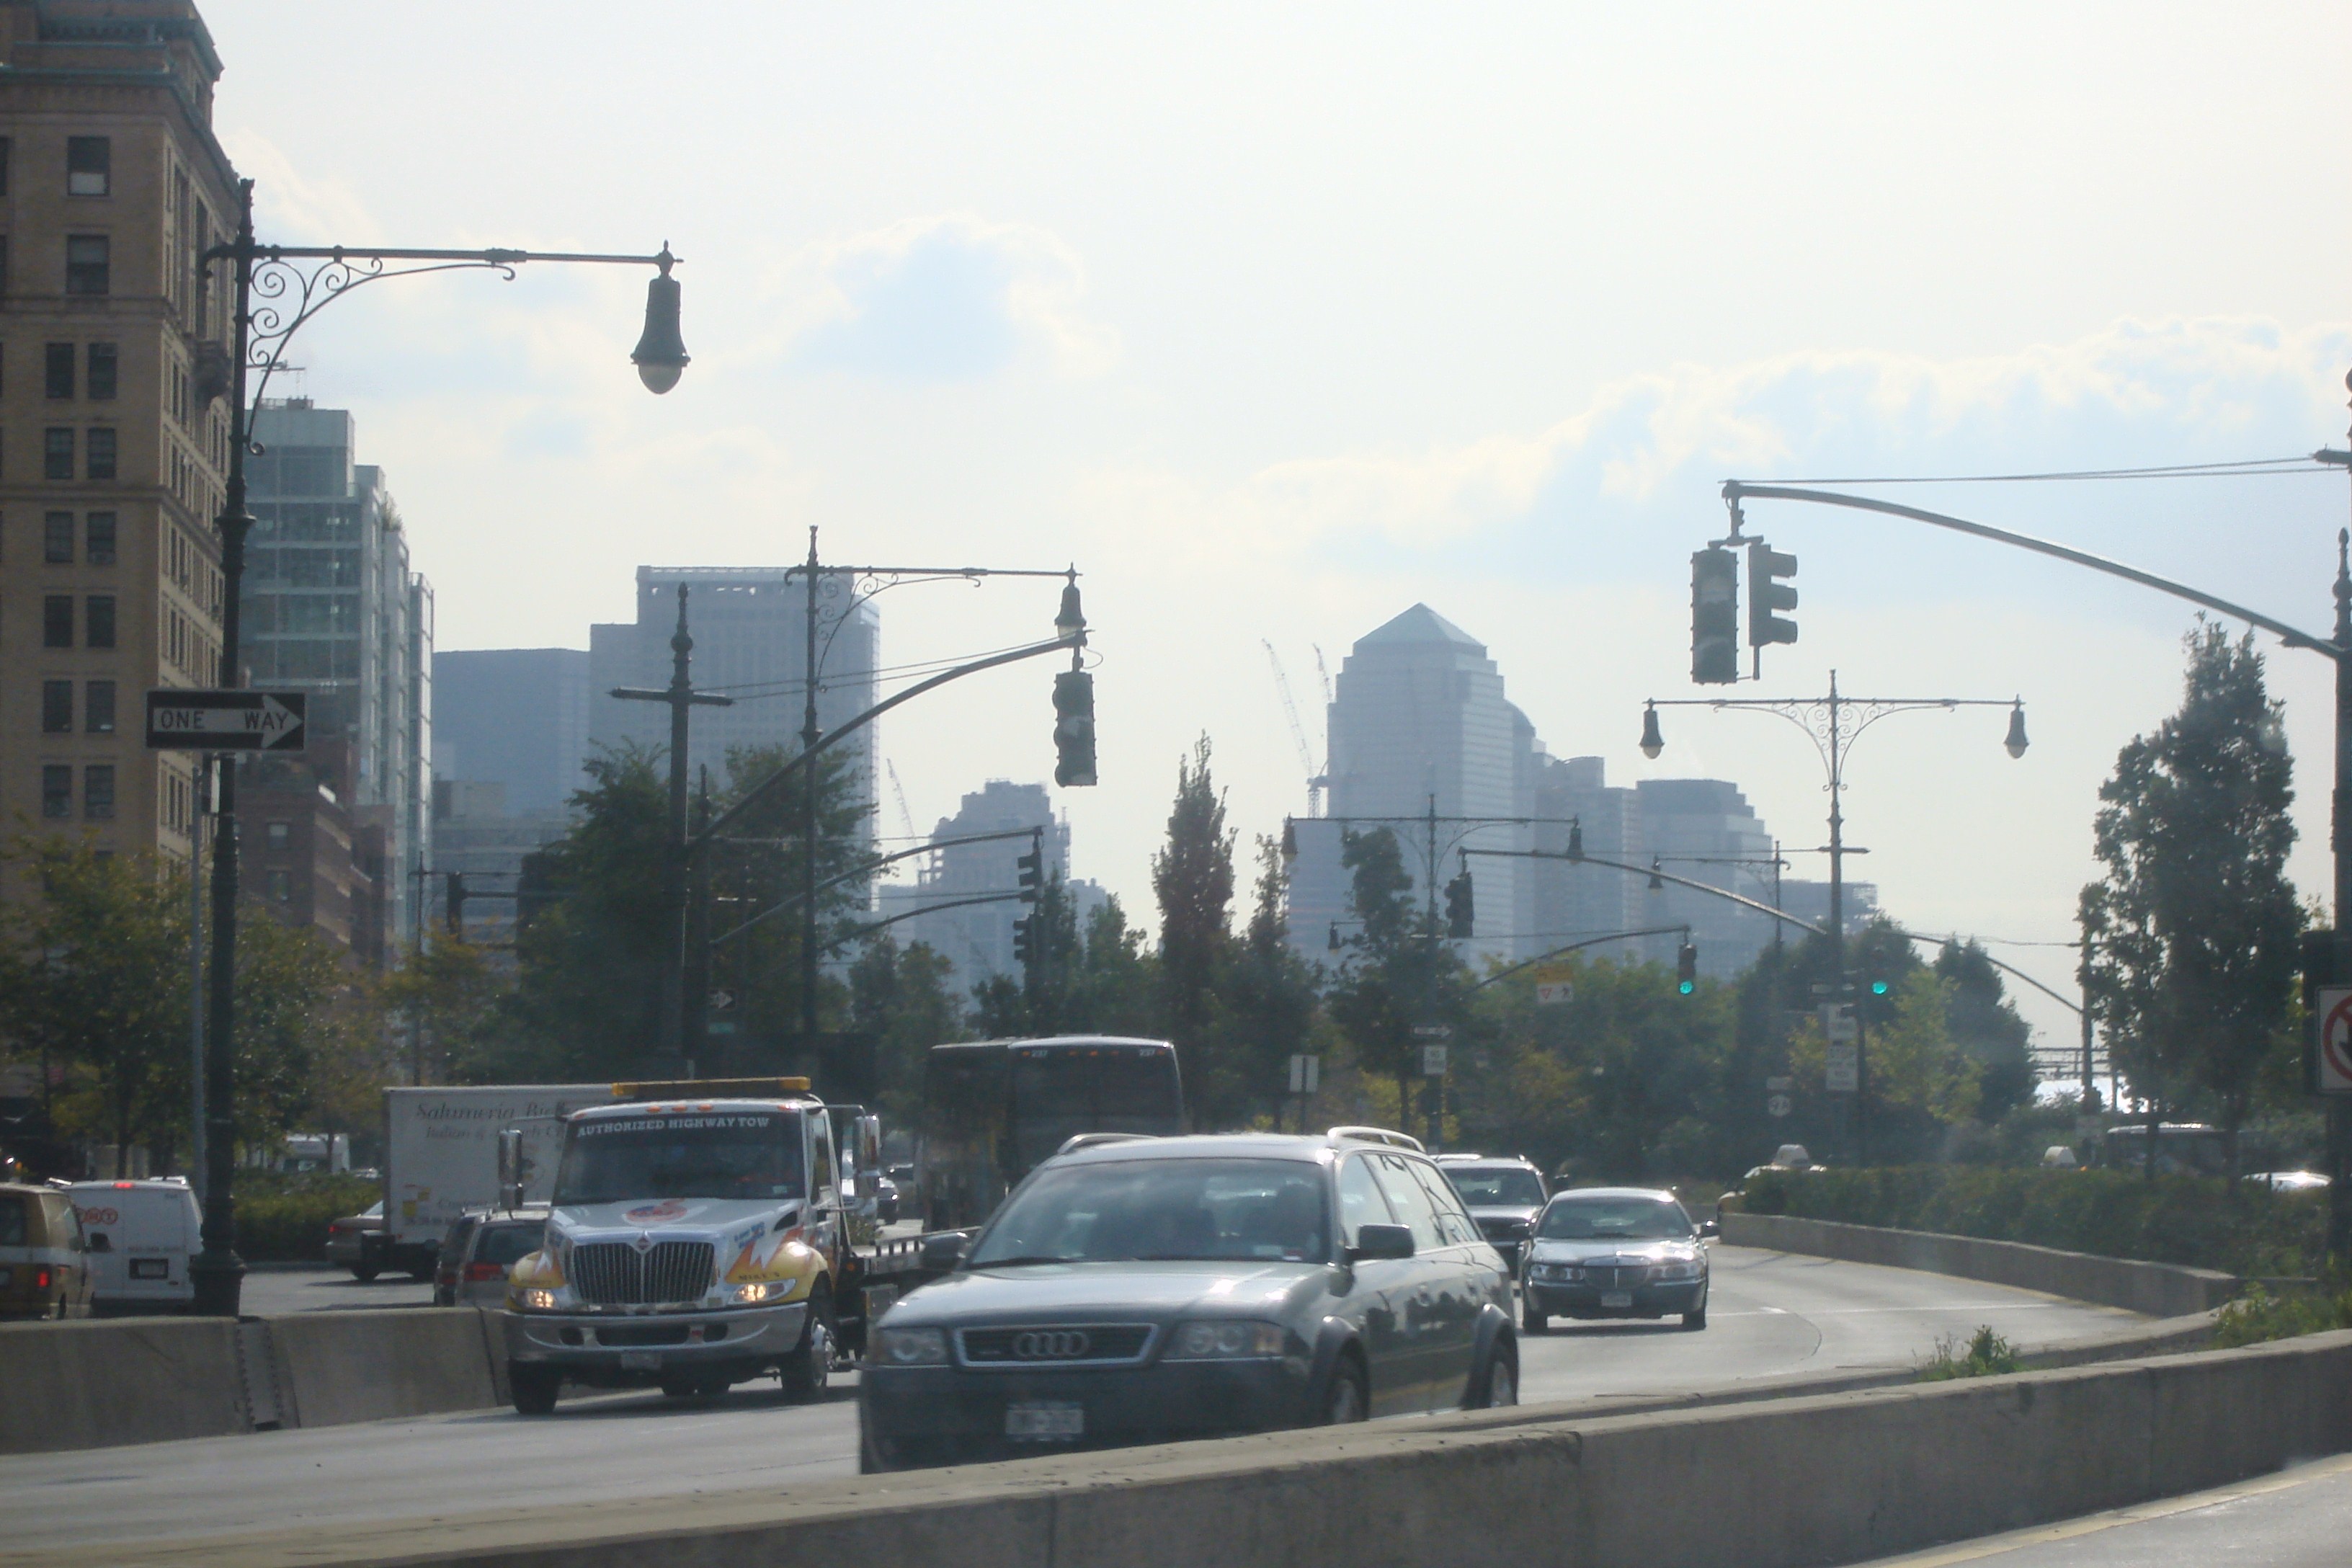
One of the more common visual tactics used by AGW proponents to scare people into thinking that AGW induced sea level rise is a big threat is to show altered photographs and GIS models of a city near the ocean (take your pick, New York, London, San Francisco etc.). These futuristic images demonstrate what the city might look like once global warming kicks in and kicks our butt, apparently without anyone noticing the advance of the sea. Take for example, lower Manhattan, one of the more common targets. The top image is a future shock rendition from the History Channel “Armageddon Week” and the bottom image is a photo of present day reality from Wikimedia.


Scary huh? And it’s not just photos, now that most anyone with a PC can run Google Earth, there’s a veritable cottage industry of people who make sea level inundation KML files using the 3D buildings feature for major cities. It works very well to get people’s attention. But how much of a looming threat is it when compared to the reality of measured sea level rise? Let’s find out.

Will Manhattan really look like that in the future? You can even interactively freak yourself out here, at Climate Atlas, and see what it looks like in NYC when the entire Greenland Ice Sheet melts:

Gosh.
Well, I can see how people must be terrified. Just look at this plot of sea level rise at the Battery Park tide gauge from NOAA:

Yeah, it’s headed up, wayyyy up. 2.77 millimeters per year. So, to get the levels in the photo and 3D GE model shown above, we’d need to do some simple calcs.
The Google Earth 3D model is easy. It specifies a 3-5 meter sea level rise, so we’ll call it 4 meters.
For calculation purposes, we’ll assume sea level rise to be linear, and round up the Battery Park tide gauge rate to 3.0 mm per year, which puts it closer to the 3.1 mm per year measured by satellite and published at Colorado State University’s Global Sea Level Page.
4 meters = 4000 millimeters
4000 millimeters /3.0 millimeters per year = 1333 years

Now, how about the doctored image from the History Channel? There’s no reference given on the height of sea level rise on the web page, but fortunately, we have built-in yardsticks in the image. The story height of buildings in the photo can easily be estimated from the before and after photos shown at the top of this post.
I’ve selected the white building on the northeast side of Battery Park, along South St. I counted 18 stories of that building as being underwater using the hi-res image here , and I’ll estimate from other objects in the photo (like the water to pier to street height) that it is an additional 2 stories from street level there to the present day sea level (PDSL).
So what is the height of a story? The Council on Tall Buildings and Urban Habitat gives a handy guide on story height for office buildings like that one. They say that an office building like that one has a story height of 3.9 meters , so we’ll use that.
History Channel photo submersion = 20 stories
Story height = 3.9 meters
Sea Level Rise in the photo 20 x 3.9 meters = 78 meters
78 meters = 78,000 millimeters
78,000 millimeters / 3 millimeters per year = 26,000 years

26,000 years to get that? Would those buildings still be standing then? And even more important, wouldn’t we be in a new ice age by then? If we did enter another ice age, sea level would be lower, as demonstrated in this graph below. Note the level 24,000 years ago.

This demonstrates the folly of assuming that climate change, and hence sea level rise, is linear. As we all know, it isn’t, yet that doesn’t stop many AGW proponents from using present day measurements to project linearly into the future and then generate scary scenarios and visuals from it.
Even on the short-term, such predictions fail miserably. Take for example Dr. James Hansen of NASA GISS. Read his prediction 20 years ago about sea level rise in New York City, which I previously covered on WUWT in A little known 20 year old climate change prediction by Dr. James Hansen – that failed badly.
He said that [in 20 years]:
“The West Side Highway [which runs along the Hudson River] will be under water.
Problem is, here it is 20 years later, and people still drive that highway today without the use of Jet-Skis.
What got me started on this post was a comment left on WUWT by “Rascal”
Submitted on 2010/11/26 at 7:46 pmCopy the following address in to your browser, and observe the expansion of lower Manhattan since 1660.
http://www.racontours.com/archive/coastline_anim.php
Note that the West Side Highway (West Street) over half of the World Trade Center site, and the South Street Seaport were “under water” in 1660!
He’s right. And one thing many AGW proponents don’t consider (in addition to the non-linearity of climate) is the adaptability of humans. For readers here, I’ve taken that Flash animation at Racontours.com and made it into an animated GIF below:

They write about this historical account of lower Manhattan:
Based on our study of historical maps of Manhattan, Racontours has been able to create this simulation of the expansion of the island’s coastline. This topic is covered in both our South St. Seaport and Lower Manhattan tours, and most people are amazed at the transformation that’s taken place. Pearl St, named for the seashells that washed up there, once ran along the river. (Click here for a view of Captain Kidd’s house at the corner of Pearl & Wall Streets)
The first land reclamation was undertaken by Peter Stuyvesant upon taking over as the colony’s governor in 1646. Hoping to facilitate waste disposal and transportation, he organized the excavation of the canal along what is now Broad St. Back then, this was still called New Amsterdam, and the Dutch were great believers in canals.
By the American Revolution, the city’s population had grown to 30,000, and land had become scarce and cramped in the city center. That’s when the city began to sell ‘water lots’, wherein entrepreneurs would seek to use landfill to create additional lots for use.
The most recent landfilled area led to the creation of Battery Park City, built in the 70’s on the earth excavated from the World Trade Center’s foundation.
Based on the 2.77 millimeters per year (call it 3 mm) of current sea level rise as shown by that Battery Tide gauge, in the 344 years (1660-2004) the sea level would have risen by:
344 years x 3 millimeters/year = 1032 millimeters or 1.032 meters.
Clearly, New Yorkers have been able to stay well ahead of that 1 meter rise since the city was founded.
The next time your friends get freaked out about sea level rise, or “high water”, show them this.
Someone should debate this Hansen wizard. He’s tearing down his own argument!
Hey Mr Watts; Sir
One thing we badly need is resource showing all the predictions made regarding the effects of climate change.
Searchable by year of prediction; year prediction is supposed to occur and the predictor; and whether the prediction was met (within experimental constraints..) or not (three outcomes :- Proved; Falsified; Indeterminate)
Can you appeal to your readership to collate this somewhere ? It’s one of those things that engineers; technicians & scientists love. And of course if CAGW predicted in 1999 that Manhattan would be under 2 metres of water then it is patently obvious that prediction is a busted flush.
It would be interesting would it not ?
Actually, the next time someone is telling me about a lot they purchased built on drained swamp/landfill/jetty and it’s sand spit/dike/river bottom, I will show them this.
What would the exaggerations of climate science be without “Photoshop?”
But you don’t understand, Anthony.
See, it’s all that evil, human-produced CO2, which will accelerate the hydrological cycle and make it smash into Manhattan and fulfil the prophecies of the AGW prophets and saints and Nobel Peace Prize winners. Also, it will acidify the oceans causing them to eat away the land and cause the seas to swell or whatever.
Am I correct in thinking Google are devout believers in the religion of warmism ?
And Al Gore is a major shareholder in Google ?
Seems to fit together somehow. Apart from Al Gore’s house at Fisherman’s Wharf.
Don’t quite get that bit.
The Colorado sea level interactive page does not show even those 3mm/y:
http://sealevel.colorado.edu/wizard.php?dlon=284&dlat=36&map=t&fit=n&smooth=n&days=60
Atlantic Ocean as a whole, well, it is pure travesty that we can not account for missing sea level rise..
http://climexp.knmi.nl/data/l3a.png
If you live in California, your tax dollars are funding studies like this one by the Pacific Institute:
http://www.pacinst.org/reports/sea_level_rise/index.htm
where the California coast is shown with a 1.4 meter sea level rise along with scary projections of biblical proportions. (Where is Noah now that we need him?)
One amusing truth that the authors of the study conveniently ignored is that in Northern California at Crescent City, the sea level is actually falling because the land mass is rising faster due to uplift than the sea is rising.
Matt says:
November 28, 2010 at 10:56 am
“Am I correct in thinking Google are devout believers in the religion of warmism ?”
I think Larry and Sergej have a massive guilt complex because of their private jet travels to Davos and because Google is the biggest energy hog after the NSA. Maybe before the NSA.
People like to pick on New York as a sea level gauge. They never pick on Boston. There’s much more land in Boston than there was in colonial days. The Fewway is called that because it used to be a fens, a middle english term for a marshland. It started out as a tidal flat, and turned into a freshwater lagoon, with more land than water. The Back Bay used to be a bay(!) but was filled in with merial brought in by train between 1857 and 1882.
Boston even has a dam on the Charles River, but I think that was mainly to keep salt water out, instead of making a reservoir.
One of the best reasons to not use Boston as a sea level indicator is in Anthony’s comments – in 26,000 years the next ice age is going to scrape the area clean and rebuild Cape Cod and the Islands with Boston architecture.
Perhaps sea level hand wringers, at least on this side of the Atlantic, should only look 150 years forward.
REPLY: Oh, I picked on Boston before –
The rubbish is coming! One if by land, two if by sea
http://wattsupwiththat.com/2009/05/16/the-rubbish-is-coming-one-if-by-land-two-if-by-sea/
– Anthony
I don’t know about anyone else, but Ah’m-a-gedden tired of Armageddon.
Will you guys please knock off this sea-level-rise-panic knocking? I am hoping to buy a waterfront property to retire in and I need sea-level-rise-panic to drive the market prices down so that I can snap up a bargain from the gullible.
I think “Armageddon Week” is a very descriptive name for AGW predictions, and it should be used more often.
Murray, good one. However, on a serious note, let me direct you to some pictures of potential lots (see above) like the one you want. To buy from the gullible this marginal fake land, is to be only slightly less gullible than the motivated seller.
There is a volcano called Cumbre Vieja on the island of La Palma in the Canaries. The last time it erupted, in 1949, it left a 200km3 block of rock hanging precariously over the Atlantic Ocean.
Sometime in the future – it could happen tomorrow, it may not happen for thousands of years – a further eruption will send that rock toppling into the sea, causing a tsunami powerful enough to wipe out the entire Eastern Seaboard of the USA.
How scary are tiny, incremental rises in sea level, compared to that particular scenario?
Sea level is dynamic, in some areas the water level will “appear” to have risen, while in others it will again “appear” to have receded. Many, many factors are constantly at play, including erosion, silting, land depression and uplifting. Some areas of land will be under erosive loss due to currents while other areas will receive the eroded deposit. The measurement is relative. I keep asking myself, who has decided what the exact level is supposed to be, like co2? As it was last year, last millennia, 1000 yrs ago, a million????
Roman London can be 6-8 metres (20ft) below the modern city.
http://www.museumoflondon.org.uk/NR/rdonlyres/93B35BBC-4F9A-4AA5-AE3D-4F07F3C20E81/0/trailmapcream.pdf
http://www.museumoflondon.org.uk/English/Collections/OnlineResources/Londinium/Today/vizrom/
Many of the rivers that flow into the Thames in London are now underground.
http://en.wikipedia.org/wiki/Subterranean_rivers_of_London
It’s only a recent habit to remove old construction before building over the top.
Bangladesh has been gaining land mass over the past 30 years. See graph. While new islands appear and vanish all the time. [pdf paper]
As for coral Atolls in the Pacific ocean:
It’s all scare and no substance in the face of flattening sea level rise since the last Meltwater Pulse.
This is an excellent post for the New Yorkers on this site. I wish that the Rancourt animation had more information with street names and such. Maybe someone knows a Google Maps mashup?
I’d like to know the 1660 boundaries as correspond today. It seems like at Wall Street level the Eastern Boundary was present-day Pearl St. and the Western Boundary is something like present-day Greenwhich st. + West Broadway.
peter_dtm says:
November 28, 2010 at 10:32 am
Here is a starting point.
http://www.numberwatch.co.uk/warmlist.htm
A picture paints a thousand words and, like all the best lies, this one contains elements of the truth.
You’re fighting a losing battle here until you can come up with a more compelling image.
You’d think that the geo-engineers might be looking at that Cumbre Vieja slab for potential action. The problem, as I understand it, is that this mass will fall into the ocean all at once; what I don’t understand is why they aren’t working on ways to bring down parts of this unstable mass in a more controlled manner. Seems to make more sense to me than the hyperventalating over MM Climate Change – which we can’t do anything about even if it were a problem.
Oh my. It really is worse than we thought. If Manhattan has got wider, that means the Hudson has got narrower and the water is running into the sea faster!! /sarc.
They recently found ship remains in the World Trade Center site. The site is about three blocks from the water.
On the other side of the Wall Street area, the water line used to run at today’s Water Street, two blocks from the East River.
I started to boycott ‘Google’ When I looked at ‘Google Earth’, the North Pole pole was all water, an obvious exposure that they are part of the AGW cabal. I don’t know if there is ice there now(on ‘Google Earth’). I’ m boycotting.
Hansen has transcended well beyond science and has entered into the early stages of being a raving lunatic. Unfortunately he is pulling along with him hysterics of every creed.
New York City and its surrounding boroughs are responsible for generating 12,000 tons of garbage each day. If incinerated the resulting ash would be 600 tons of non-water soluble ash. Each years this potentially produces 200,000 tons of landfill. As ash a bulk density of about 1 ton per cubic meter and a maximal density of 1.2-1.5 max. This gives us 200,000 cubic meters of landfill, per year.
The land area of Manhattan is 59.5 km^2 or 59,500,000 m^2, so each year we can raise it by 3.36 mm per year; just using something we dump in the sea.
1333 years gives us a height of 4.5 meters, spread evenly.
Murray;
Fear not. The panickees from whom you will be buying at bargoon prices are no more likely to read WUWT than they are to count starspots on Betelgeuse.
Several areas are having land subside at a rate faster than the predicted sea level rise.
Just ask Louisiana.
Doc;
your solution has a problem, which is that you will be spreading that much schmutz over everything each year, culminating in burying the city in ash instead of water. Why not fuse it into a seawall, and just hold the water back?
😉
Anything is possible says:
November 28, 2010 at 11:46 am
There is a volcano called Cumbre Vieja on the island of La Palma in the Canaries. The last time it erupted, in 1949, it left a 200km3 block of rock hanging precariously over the Atlantic Ocean.
Sometime in the future – it could happen tomorrow, it may not happen for thousands of years – a further eruption will send that rock toppling into the sea, causing a tsunami powerful enough to wipe out the entire Eastern Seaboard of the USA.
How scary are tiny, incremental rises in sea level, compared to that particular scenario?
***************************************************************************
Considering the Cumbre Vieja mega-tsunami has been debunked several times in the ten years since the disaster insurance sponsored study that proposed it was published, I would put it on equal footing CAGW.
I’m digging on the idea of “water lots”. The Right Solvent State of Florida holds fee simple, absolute sledloads of “water lots”, I see revenue.
Anything is possible says:
November 28, 2010 at 11:46 am
There is a volcano called Cumbre Vieja on the island of La Palma in the Canaries. The last time it erupted, in 1949, it left a 200km3 block of rock hanging precariously over the Atlantic Ocean.
Sometime in the future – it could happen tomorrow, it may not happen for thousands of years – a further eruption will send that rock toppling into the sea, causing a tsunami powerful enough to wipe out the entire Eastern Seaboard of the USA.
How scary are tiny, incremental rises in sea level, compared to that particular scenario?
***************************************************************************
Considering the Cumbre Vieja mega-tsunami hypothesis has been debunked several times in the ten years since the disaster insurance sponsored study that proposed it was published, I would put it on roughly the same footing as CAGW. I wonder if Catlin was involved there as well?
http://www.iberianature.com/material/megatsunami.html
Guess who owns the History Channel? Why, it’s GE, the multinational that’s going to make billions in profit from measures to stop AGW.
Soon, Comcast will be taking over as they’ve sold controlling interest to them, but that shouldn’t let GE off the hook for their media pandering- and one wonders how much control GE can still exert with what’s left of their stock holdings.
I think the question of if an ice age is coming really depends on whether or not we have already postponed the inception of ice. Ruddiman’s early-anthropogenic theory so to speak…
So essentially if them new yorker keep up their ludicrous additions to Manhattan not only will you guys displace the Atlantic body of water in the northern hemisphere (and talk about catastrophic anthropogenic climate change) but Manhattan will cover the whole of Atlantic in 26 000 years! OMFG, you guys’re trying to invade Europe under the guise of global warming! 0_O
In my limited experience, our younger generation seem to have no conception of the science of mensuration. This is undoubtedly due to poor education, but to where have those teachers of our children disappeared?
I am fortunate as an engineer (of working machinery) to be ‘multi-lingual’, ie, I know the difference between bar and psi, degrees F and C etc, but children these days seem to spend most of their existence without knowledge of either examples, only to find themselves completely in the hands of such people as Al Gore, who probably knows as much (or little) science as a 9-year old.
Our teachers have disappeared into a fog of propaganda, leaving them in a mist of indecision once they become qualified to face the unruly class of children.
It is time to change all this kow-towing to the so-called powers-that-be and return to the days when information was passed down within a family by stories and tales, and that the wretched interweb, tv and cell-phones be banned from use by juveniles. They, of all people do not require too much information. We, as adults find it hard enough to assimilate.
“One thing we badly need is resource showing all the predictions made regarding the effects of climate change.”
Can I second the post by Peter_dtm for a Prediction Database with outcomes or current progress to predicted outcome. With links back to the original prediction and the predictor, this would be a powerful incentive to environmentalists and climate scientists not to scatter predictions like confetti in the knowledge that they will never be called to account. Perhaps the Guinness Book of Records could have a category for the worst ( and also the best) environmental and climate predictions. It could be as prestigious as the Ignobel prizes are.
The Romans landed in AD43 and built this harbour. It is now two miles inland.
Some sea-level rise there, then!
http://www.culture24.org.uk/history+%26+heritage/time/roman/art61315
The hyperbolic wailing about dramatic sea level rise has, to me, always been the most irritating of all the phony predicted catastrophes of the CAGW crowd. Despite all the money and effort invested we still have only a vague notion of what the real levels of the worlds oceans are. I say levels deliberately, because to assume that there is a singular MSL that applies across the planet is the fundamental implicit fallacy that makes the whole exercise a folly. The geoid is key component used in determining the present sea level data, especially the satellite altimetry version. In simplest terms it is an idealized abstract of the ocean surface with all variables other than variations in the Earth’s gravitational strength removed and all land masses assumed to be 100% permeable to the waters. Here is a depiction of the geoid model used calculate the the sat data
http://en.wikipedia.org/wiki/File:Geoid_height_red_blue.png
You’ll note that the variation of surface height is on the order of 200 METERS. This is not the latest or only geoid model in use and the others I’ve seen generally have even larger variations. Then you must add lunar ocean tides, which are well, but not entirely precisely known, lunar tides in the Earth’s mantle, which are small but not negligible at the millimeter and sub-millimeter scale where the trends are quoted, wind driven surges, wave heights of 0-10 meters, temperature driven volume changes, variations driven by persistent high or low atmospheric pressure zones and numerous other factors. In the end, if the tolerances stack just right, you are looking at real elevation differences of 300 meters or more.
This would indicate that, other than within small regional zones, data from tide gauges are not comparable to gauges elsewhere on the planet. And even if the sats were miraculously able to create an accurate average anomaly for the ocean surfaces they attempt to measure, it would still tell us little that is meaningful about what is occurring at any individual points on the planet’s various coastlines.
I wonder if these people have ever been to Holland or Venice or any otehr country where subsistence of land and or rising water levels have been mitigated over time by the industrious and resourceful populous. The CAGW crowd seem to think everyone is just going to stand around and watch the water rise to their ankles. I don’t think the word mitigation is in their lexicon.
K says: GE owns History channel…
And K, GE is buying a bunch of GM’s “greenie” cars just to stay on the “good” side of the present administration. Govt. contracts…hmmm?
If I move to NY and I have to deal with rising sea levels, my plan is to quit buying pants with 32 inch inseams and start buying pants with 31 inch inseams.
Ta-da! Catastrophe averted!
Here are some coastal tidal gauge plots from the southern & eastern US coastlines. I choose these, as they seem to be away from the tectonic plate boundaries and other geodetic movements ( i.e. volcanoes). This was to reduce the “uplift” correction. Wonder how they computed “uplift” in the 1940’s, based on the instrumentation available. In addition these stations have data over relatively “long” time spans.
Two items seemed interesting, the gulf coast level station data seems to flatten over about the past decade. The second was that looking at the the increases prior to ~1950 are almost comparable to the past 60 years. Was AGW that severe back then, or is this a continuation of a natural cycle?
Have not had time to really analyze the raw data yet, so these are just first impressions.
http://www.imagenerd.com/uploads/n_amer_s_e_composite_4-har7A.jpg
The graphs came from:
http://www.psmsl.org/data/obtaining/
Dave Wendt, you might wonder over to the RC thread
“Sea level rise: The New York Times got the story”
where a interesting discussion on just how accurate GPS “uplifting” measurements are. While they are in the mm range to measure mm/yr rate, a significant amount of data was taken prior to these more accurate readings.
Stephen Brown says:
November 28, 2010 at 2:51 pm
‘The Romans landed in AD43 and built this harbour. It is now two miles inland.
Some sea-level rise there, then!
http://www.culture24.org.uk/history+%26+heritage/time/roman/art61315‘
Not sure about this necessarily having any direct relationship to sea level issues – my understanding is that Richborough was on the Wantsum Channel which originally separated Richborough from the Isle of Thanet (and provided a protected route around the North Foreland) . This channel silted up over the centuries and Thanet became joined to the mainland.
Having googled – Wiki thus:
http://en.wikipedia.org/wiki/Wantsum_Channel
‘From prehistory until the Middle Ages, the Wantsum Channel was joined by the River Stour, which entered it at Stourmouth close to its midpoint; it was a two-mile-wide (3.2 km) strait. The southern end of the channel met the sea at Richborough (Roman name, Rutupiae), downstream of Sandwich, while the northern end met the Thames Estuary at Reculver (Roman name, Regulbium). That the Romans chose both sites for forts indicates the significance of the route, which their shipping commonly used to travel between London and the continent; and which Vikings used to raid Canterbury in 839 CE.
Deposition of shingle at Stonar, at the southern end of the Channel, gradually caused it to silt up..’
and
http://www.wingham.org/Kent/History/HistoryIntro.htm
Here is Heidi Cullen’s take on Manhattan from her book “The Weather of the Future”…
Manhattan Underwater
Consider
Vancouver Underwater and
Also consider
Boston Underwater
To Anything is possible:
Click here to read what purports to be a debunking of your hypothetical rock rock:
<a href="http://www.lapalma-tsunami.com/"
NOthing is as it seems, it seems…
Click here for more on you La Palma Rock rock:
<a href="http://www.lapalma-tsunami.com/
Holy cow, that piture must show a 100 foot rise in a sort time span (modern buildings dont seem to last that long, I have driven across a road bridge build in the twelth century and the river is about what it was then., I dont suppose many modern structures will be standing in 800 years.
I thought everyone knows that alarmists have shifted from dramatic sea level rise to “extreme” weather events? Those are much easier targets, since they happen all the time. It’s like watching tribal elders blame heatwaves, coldsnaps, floods, drought and storms on angry gods. Pathetic.
Anthony, you have created a great post – again!
Much the same story line can be made for the Puget Sound Lowland (Seattle and Tacoma are the large cities that have built partially on fill).
However, the very serious threat is not the slow rise or fall of sea level. There exists the real possibility of a massive shift of the coastal area and a seismic event not experienced here for hundreds of years. The evidence for earthquakes along this plate margin of Magnitude 9+ is known.
See here about PANGA (Pacific Northwest Geodetic Array):
http://www.geodesy.cwu.edu/
The link on the upper left “Cascadia Earthquake Rupture Model” is part of the story. [Sunday evening 11/28/2010: the server seems a bit flaky – I’ll check with CWU on Monday]
Here is a Seattle Times story (one year ago):
http://seattletimes.nwsource.com/html/localnews/2010284740_megaquake17m.html
Moral: Many serious problems worldwide are not getting the attention they deserve, while CAGW sucks money, political leadership, and action into a void.
Ken Roberts says:
November 28, 2010 at 5:15 pm
“NOthing is as it seems, it seems…”
_____________________________________________________________
Word.
Dave N says on November 28, 2010 at 6:05 pm
More cargo-cult science.
Anthony, and who owns the History channel?
No wonder sea level is rising, we keep throwing our garbage into it and then building on it!
78 metres in that photoshopped image, you say?
A quick calculation, which I did a year back, taking the area of Antarctica, the maximum thickness of the ice, assuming it all melted and distributing it all over the oceans of the world gives 70 metres. And that’s a big overestimate because on every point it overestimates the resulting sea level rise. (I have seen reports of more careful estimates giving 60 metres.)
In other words, there isn’t enough water on Earth to produce the photoshopped result, let alone take 26,000 years. Antarctica will be a baked desert before that happens. The History Channel is pretending to report truth but is making up fantasies.
timheyes says:
November 28, 2010 at 12:29 pm
Oh my. It really is worse than we thought. If Manhattan has got wider, that means the Hudson has got narrower and the water is running into the sea faster!! /sarc.
According to a program on the History or Discovery channel (I don’t remember which) that is exactly the problem that some engineers are worried about, since the increased flow rate will cause the bed of the river to wash out to sea, uncovering the trans-Hudson tunnels.
“For calculation purposes, we’ll assume sea level rise to be linear, …”
It is not. You even admit this later, accusing nameless others of assuming this, but than repeatedly use it yourself. The post is utter nonsense. The issue is how fast glaciers will melt with rising temperatures. Ice flow dynamics are poorly understood, so there is a great deal uncertainly. Playing craps with our future is an option, just not a very smart one.
Your alleged quote from Hansen is apocryphal. But, you know that.
The fact that the we have built out, extending our shorelines, makes possible sea level rise potentially more destructive. And while adaptation will be necessary it is not likely to be possible everywhere. Places such as Bangladesh and the Mekong Delta are very venerable. And how do we convince the plankton to adapt?
If you are so sure we can adapt to anything, why are you so sure we cannot reduce GHG emissions? Mitigation and adaptation are both valid. Why fight with one hand tied behind our backs?
REPLY: Oh puhleeze. Alleged quote? It’s in salon.com and a book:
http://dir.salon.com/books/int/2001/10/23/weather/index.html
Your comment is utter nonsense. You simply can’t handle another point of view. – Anthony
Ken Roberts,
Your first link is not working, but the second one is. Thanks – glad to have learned the truth about La Palma Rock and the insurance industry’s perfidy.
I used to watch the History Channel’s (or Discovery Channel’s) armageddon or mega-disaster programs, more for comedy than anything else. It’s kind of like a tease – they talk about potential natural disasters (e.g. the Yellowstone caldera), but interwoven very carefully amidst the apocalyptic talk, and always downplayed with some subtlety, is some smidgen of truth about the possibilities of it on the geologic time scale, which are in fact very slim. They sure don’t let facts get in the way of a good story.
Living in an area now that used to be under a great inland sea some millions of years ago, I remain amused.
[snip – we don’t need vulgarity in your comments to push your point of view repeatedly. – take a time out ~mod]
@Anything is possible
“…There is a volcano called Cumbre Vieja…”
And there is also the Tuscaloosa seamount. It is a piece of one of the Hawaiian islands that fell off quite a while back. Those islands are quite prone to having parts of them fall off. Thankfully the power dissipation of something like that spreads out the energy quite fast as you get further from the source. Sure, it will really really [censored] for anybody on the island, but a few thousand miles out you will be lucky if you notice it.
The Sumatran quake caused a lot more damage due to the nature of the event. Effectively, several hundred square miles of ocean were lifted a few feet. All at once. It was… several orders of magnitude larger than a chunk of island falling off. Of course, the bigger the chunk, the bigger the splash.
That seamount… the Tuscaloosa, is 17 wide, 30 km long and 1.8 km high from the seafloor to the top. Dunno how much is buried in the muck. I imagine that it made a sizable splash. BTW, it made it about 50 km out from the island… relatively intact.
More here:
http://walrus.wr.usgs.gov/reports/reprints/Moore_JGR94.pdf
Why do I mention that? Well, I’ve seen that documentary where the guy is putzing around in the fissure of where the headland scarp is going to form. Impressive… until you look at The Great Crack. It’s a feature on the big island of Hawaii. At 60 feet wide… it’s a bit larger that the one on Cumbre Vieja. This one is about 8-miles long. It’s also close to and probably associated with the Hilina Slump.
Eventually… dunno when, it’s gonna let go. In 1975 it suddenly dropped about 11 feet and cause a magnitude 7.2 quake. Per Wikipedia (cuz I’m lazy) it has a 10 cm/yr movement from 1090 to 1993.
No… the Cumbre Vieja doesn’t keep me up at night. But your point is valid. There is much more to worry about than a 2.77 mm/yr sea level rise.
Errata: “10 cm/yr movement from 1990 to 1993.”
Mike says:
November 28, 2010 at 8:30 pm
Well that clearly didn’t work as expected.
Mike says:
November 28, 2010 at 8:30 pm
” Places such as Bangladesh and the Mekong Delta are very venerable. ”
So, apparently, is the Pope.
[???]
November 28, 2010 at 11:42 pm
[snip – we don’t need vulgarity in your comments to push your point of view repeatedly. – take a time out ~mod]
DO TELL: How is evidence of what happened both 1000 and 2000 years ago, considered ‘vulgarity?’
You’ll be talking about that, won’t you?
In the meantime, there’s this to REMIND you:
HOW IS THIS VULGARITY?!?!?!?!
http://www.archaeoleg.org.uk/pdf/roman/KEY%20SITES%20SE%20WALES%20ROMAN.pdf
HOW IS THIS VULGARITY?!?!?!?!
http://www.yorkshirepost.co.uk/news/Discovery-of-log-boat-shows.5537797.jp
HOW IS THIS VULGARITY?!?!?!?!
http://www.maldonsx.freeserve.co.uk/Maeldune/first_maldonians.htm
HOW IS THIS VULGARITY?!?!?!?!
http://www.severnestuary.net/sep/pdfs/severnarchaeodesignguidefinal06.pdf
HOW IS THIS VULGARITY?!?!?!?!
http://www.rcahmw.gov.uk/HI/ENG/Heritage+of+Wales/Places/Sea+and+Coast/
TALK ABOUT THAT, WON’T YOU?
REPLY: OK, you had your warning about language (in your post that was snipped, it was the language you used and not the content), and you continue to insist that we immediately follow your discussion path. Even if your info supports what this article is about (I don’t know that it does or doesn’t, it seems nonsensical), the way you are going about it and bombing threads repeatedly with these links and demands that we pay attention to them is unacceptable.
So, let me make this easy for you and for our moderators: You are BANNED from WUWT. – Anthony
“The West Side Highway [which runs along the Hudson River] will be under water in 20 years” —with the sea level rising at about 3mm per year and the land still rising at up to 1cm (10mm per year) as post glacial rebound … see:
http://en.wikipedia.org/wiki/Post-glacial_rebound … it’s going to take a bit longer than 20 years for the highway to turn amphibious. Add to that, the reclamations and I don’t think New Yorkers, nor anyone else on the North Eastern seaboard from Hudson Bay south, has anything to worry about at all.
It was precisely this sort of alarmist rubbish that made me look into this AGW stuff further. I started to come across articles which, if you had just had the most basic ability with a calculator, were complete nonsense. Little did I know then that they were just the tip of the iceberg (sorry!).
“Playing craps with our future is an option, just not a very smart one. ”
Once again, a warmist demonstrates that people in their religion never passed sixth grade. Reading comprehension is something you should have learned if you had. I have watched your posts here for about a month now. You have never read anything said by anyone here and chime in with rhetoric which is emotional, non-scientific, and snarky.
Fear and emotional appeals are what religions have been using for centuries to guilt and/or force people into doing things that they do not believe in. Everytime you repeat that, you make the smarter people distance themselves from you even more. So if we made a graph of believers of agw and intelligence, we would find it to be an upside down hockey stick. . . . . Ironic, I know…but you must admit the battle was lost a little over a year ago when the truth came out.
Larry in Texas:
I live on a peninsula that was probably completely underwater much more recently than Texas. All is well here and I seem to be doing fine at 42ft elevation. I also remain amused. The house that I lived in as a kid on the barrier island is on a canal and the sea level is the same distance below the cap on the seawall as it was 40 years ago.
Larry in Florida
“You can even interactively freak yourself out[…]”
Quote of the decade!
@899, (why you picked part of the nomenclature for the AS-899 high band antenna for a countermeasures receiver as a name is beyond me)
But when you YELL…. I, and many others, instantly ignore you. So enjoy your emotional tirade. This is the only response you will get from me… and it was solely because of the name you chose, not what you have to say.
Well I’ve looked at a number of these high rise water pictures and they all have one thing in common. All of the sea level rise takes place inside a bathtub; they just show the water going up the vertical walls.
How about showing all of the new beach front property that will be created; which will slow the rise rate down.
In fact my analysis suggests that the actual rise is consistent with it being a logarithmic function of the total ice melt rate; so all these disaster predictions; excuse me; projections; are highly exaggerated. There’s a fairly good chance that the sea level will stop rising; certainly by the time all the land is covered; or if not then shortly thereafter.
We have plenty of time to build boats, since my analysis shows that the time to inundation grows exponentially with the ice melt amount; so even though the sea level rise will evntually stop; we will never get to total inundation anyway; so that means we don’t need to build so many boats.
Mike says –
” And how do we convince the plankton to adapt? ”
Speak politely, just like Prince Charles does to his flora.
My wife has an aunt that will turn 100 next month. She still has all her marbles and has a very good memory. She can remember going to the train station to see off her dad as a soldier to France in WW. She still has the little Canadian flag she waved on that day.
I asked her what else she could remember from her early years, specifically mentioning New York City. Not a word came up about the water level in the harbor.
From the early years the only things that mattered was WW1, the depression and WW2. I figured I might as well ask someone who was around in those early years to see what mattered.
The ENSO and sea data page show that the apparent step down in sea level rate of rise which occurred around 2006, is continuing, as Juraj V also noted.
Also, the persistent warm pool in the west Pacific is finally shrinking.
I can’t help but feel that so much of AGW has come down to some sick version of Pascal’s wager (religious philosophy). Pascal basically said that belief in God was a good idea logically because when the options were broken down into equal probabilities, only one choice allowed access to heaven and had no equivalent positive on the lack of belief side (Either there is a God, you believe and go to heaven or disbelieve and go to hell. Or there is no God and your belief gained you or lossed you nothing.) Problem being with Pascal’s wager is the same as with AGW today.
The greenies scream at you about Mitigation, because their calculations don’t take into account the same things that Pascal didn’t.
1) Is the belief you speak about even the right one? Pascal’s wager states that belief in God is the best bet, but how do you choose the RIGHT religion? His answer was based in his own biased worldview where Christianity was inherently right, but if the correct answer was the Mayan beliefs, then we’re all screwed today.
Similarly, the idea of mitigation only works if you pick the RIGHT future scenario of doom and gloom and mitigate appropriately. Presuppose that AGW is wrong, and in 20 years glaciation will already be advancing into inhabited areas of Russia and Canada, all your attempts to decrease carbon to offset warming was wasted and you’re now going to go desperately in the other direction to stave off as much damage as possible.
2) The wager ignores the damages done inherently by accepting that belief over disbelief/uncertainty. Assuming Christianity is wrong, you haven’t *only* made the wrong choice by believing, but you’ve spent numerous hours devoted to that cause. While with religion, many of the actions made in the name of your belief will be (hopefully) altruistic, what about the people who shoot abortion doctors over their belief in God? Did these people’s actions, assuming a world without God, make the world a better place for people? Were their actions, in the name of their religion, inherently good? Misdeeds performed, time/money wasted, and active suppression of REAL ideas in the name of the dogmatic laws of the belief structure can serve to stifle appropriate debate in the name of beliefs. Without AGW, maybe we’d have a better idea of what was really going on on this planet, climate-wise, and maybe the environmental movement would be involved stopping something people actually would care about appropriately.
Just like with religion, the unintentional attempting to resurrect Pascal’s wager as a AGW-belief cry (do it because not doing it isn’t logical since if I’m right we’re all screwed and if you’re right, nothing will happen and you didn’t waste anything) is wasting manpower, money, and credibility of the enviros. Mitigation for the sake of uncertainty, coupled with the economic suicide it brings is enough reason to send the AGW crowd back to the drawing board until they can actually produce some DECENT research.
Also, in relation to the Cumbre Vieja “mega-tsunami” concept. Believing in that is utter idiocy. First off, these rock formations, as a general rule, do not abruptly fall off, they generally slide in slowly. But assuming a catastrophic falling in like that, the simple physics of the situation doesn’t lend over to the propogation of tsunamis around the Atlantic basin. It’s a simple matter of not enough energy, due to not enough displacement. Tsunamis are usually not caused by large splashes made by big rocks falling into the ocean, but by suboceanic plate tectonics. While landslides can cause tsunamis, the waves don’t propogate as far or as dangerously, and there has never been an incidence of it.
Quite frankly, I can’t say that I really have the geological knowledge to determine the amount of potential energy that would be stored in that chunk of rock, but I have a feeling that given the kind of earthquakes that spawned the local Indonesian tsunamis, versus their overall ability to drown out shorelines thousands of miles away (effectively none, outside of the local areas, there was almost no tsunami damages), I’m guessing that the effect will very rapidly be dissipated, causing only minor disturbances to the US East Coast, and maybe only slightly catastrophic flooding along the African and European coasts.
peter_dtm says @ November 28, 2010 at 10:32 am: “One thing we badly need is resource showing all the predictions made regarding the effects of climate change.”
Although I cannot find some of the better lists that I have seen, here are three references that might interest you:
http://oneutah.org/2010/01/02/2010-predicted-to-be-a-banner-year-for-global-warming/
http://www.c3headlines.com/predictionsforecasts/
http://blogs.news.com.au/heraldsun/andrewbolt/index.php/heraldsun/comments/column_the_10_worst_warming_predictions/
Re: Quote from Hansen.
“REPLY: Oh puhleeze. Alleged quote? It’s in salon.com and a book:
http://dir.salon.com/books/int/2001/10/23/weather/index.html”
It is in a book! It is on line! Well then it must be true!! Please remember your Freshman English classes and relearn how to assess the reliability of sources. The quote was not from a recorded interview. The quote was something Suzy Hansen (no relation) remembered from a conversation that occurred a decade before. (She claims to have checked with him, but it is not clear which remarks she verified.) I have no idea if Jim Hansen said this and neither do you. I suggest you check with him before reproducing it again. Is there anything in Jim Hansen’s publications similar to these claims? And, yes I would level the same criticism at Salon.com.
@ Murray Grainger says: November 29, 2010 at 12:24 am: “Well that clearly didn’t work as expected.”
That’s OK. We all make mistakes. 😉
Clear and sharp. Rien à demander de plus. A+
“The next time your friends get freaked out about sea level rise, or “high water”, show them this.” Don!