By Joseph D’Aleo, CCM
The North Atlantic undergoes a multidecadal oscillation appropriately called the Atlantic Multidecadal Oscillation or AMO. It is officially the mean sea surface temperature anomaly from the equator to 70 degrees North. It went above the longer term mean in 1995. The AMO has a long term cycle of about 60-70 years.

Enlarged here
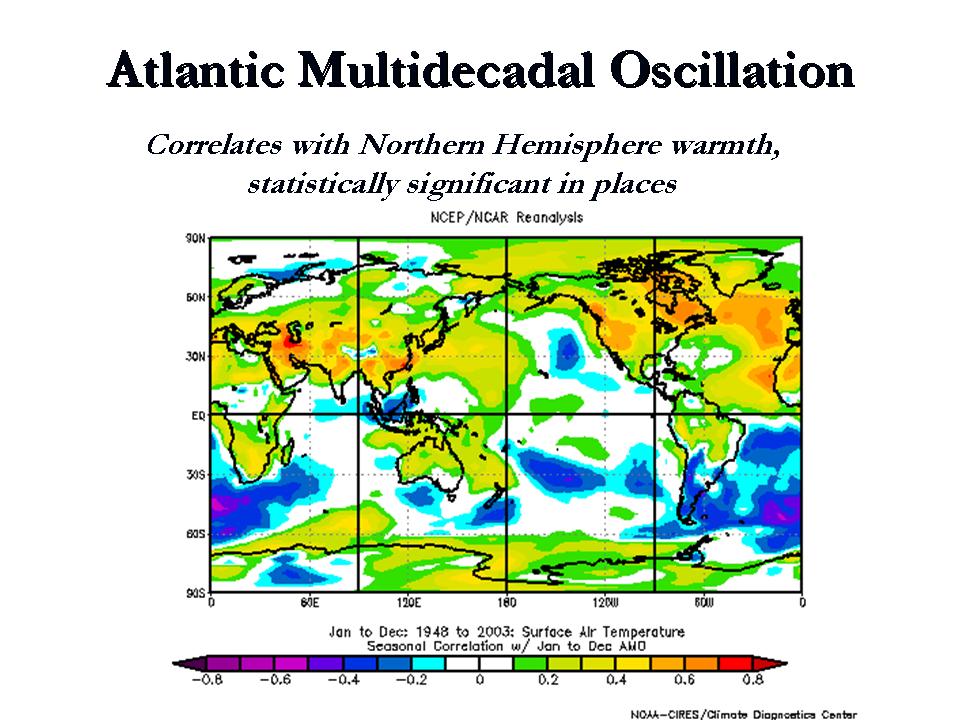
When the AMO is positive (warm) the Northern Hemisphere is warmer than normal on an annual basis across the continents. When it is cold, it is colder. The positive state is associated with a warmer arctic and Greenland and more summer hurricanes in the Atlantic Basin.

Correlation of annual temperatures with the AMO. Yellows to reds are positive and blues negative correlations with the AMO state. Enlarged here.
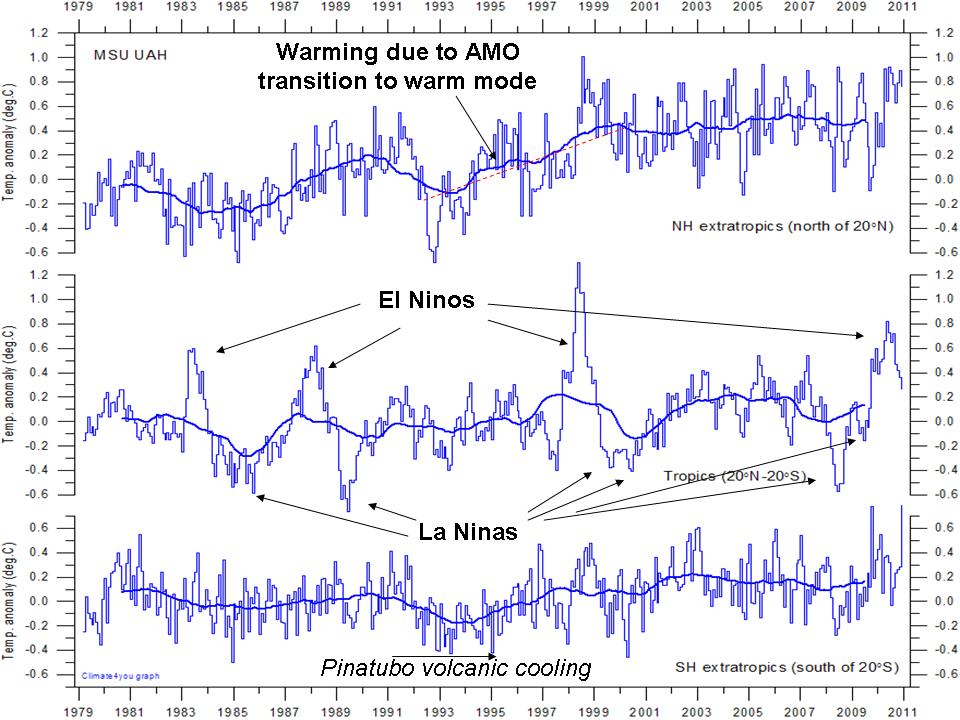
This can be also seen in the satellite derived temperatures for the Northern Hemisphere (north of 20N). There is little continuous trend since 1979. Most of the warming is in the 1995 transition from AMO negative to positive. Note the temperatures in the tropics reflect the ENSO state but has no perceived trend. There is also no trend in the Southern Hemisphere. The only significant departure was with the volcanic cooling also seen in the Northern Hemisphere after Pinatubo in 1991-1994.

UAH Satellite temperatures by latitude zone – Northern Hemisphere poleward of 20N, tropics, 20N to 20S, Southern Hemisphere poleward of 20S. Enlarged here.
The AMO tracks to the solar irradiance with a lag of about 8-9 years. This suggests the current warm AMO state will end by around 2015. Northern Hemispheric temperature will take a leg down. With the cooling of the Pacific now and more La Ninas, look for net cooling especially in the tropics until then.
See more here.
When the AMO and PDO are both negative I expect the politicians will begin the question their “experts”. I eagerly await the “expert’s” responses.
Old news. 🙂
http://fnieuwenhuis.xanga.com/674919203/amo-pdo-and-the-gmst/
I have taken to the idea that man will be able to lift himself out of an ice age, should this come to pass…
It is interesting, that AMO is some kind of residual of ENSO; at least Bob Tisdale says so. He simply cumulated annual ENSO index values and got almost exact copy of HadCRUT, it means AMO is somehow incorporated in the ENSO.
I am glad that AMO is getting much interest today, nothing against Pacific/PDO but Arctic and Europe is obviously driven by Atlantic.
Looks like the Northern Atlantic peaked in 2005.
http://climexp.knmi.nl/data/inodc_heat700_280-360E_0-70N_na.png
Not convinced.
AMO follows the Arctic temperatures, as it can be seen clearly here:
http://www.vukcevic.talktalk.net/NFC1.htm
Joe D’Aleo wrote: “The AMO tracks to the solar irradiance with a lag of about 8-9 years. ”
I does? You’ve provided no documentation of this.
I think we have to remember that step-changing admission by Prof Bob Watson, the UK Government’s Chief Scientific Advisor, on UK Channel 4 News back on 2nd February 2010. I blogged about it at the time here: http://sunriseconsulting.blogspot.com/2010/02/illuminating-interview-on-uk-channel-4.html
In summary, he clearly stated that “The only way we can explain that temperature increase is due [sic] to human activity”.
I pointed out at the time that the whole basis for blaming humanity for GW is that scientists couldn’t find any other causes. If they did find other causes which filled the gap between explained and unexplained GW then AGW was dead. Which of course could explain why research looking for other explanations is so poorly funded….
So this article is yet another blow for the AGW premise because it continues to chip away at the gap. It’s great to read such a well-argued explanation of the effect of AMO on NH climate — which I think is where even pro-AGW alarmists have to admit the only warming is apparent — and even provides predictions based on the theory that are relatively short-term and can be verified.
I look forward to seeing the predictions compared against reality over the next few years.
Doesn’t surprise me. A few years ago, when I first started looking into
global warmingclimate changeglobal climate disruption, I did an analysis of the available temperature record for State College, PA (over 100 years of daily data). After deducting an annual variation (sine wave), a shorter-period variation (another sine wave) and a calculated UHI effect (using US census data for population), the best fit to the rest of the data was a square wave pretty much coinciding with the AMO. Subtracting that left essentially trendless noise.I should note that I didn’t know at the time where to find the specific sea surface temperature anomalies for the AMO; I was going off of a timetable which noted the transitions from positive to negative and vice-versa. It would be interesting to re-run the analysis with the actual anomalies instead of a simple square wave.
This is another step towards my old contention that what really matters for tropospheric air temperatures is the net global rate of energy release by all the ocean surfaces combined at any given time.
http://climaterealists.com/index.php?id=1302&linkbox=true&position=6
from May 2008
It’s possible that others said it first but as yet I haven’t found it.
There is this though:
http://esciencenews.com/articles/2009/08/14/changes.net.flow.ocean.heat.correlate.with.past.climate.anomalies
Joe D’Aleo wrote, “This can be also seen in the satellite derived temperatures for the Northern Hemisphere (north of 20N). There is little continuous trend since 1979. Most of the warming is in the 1995 transition from AMO negative to positive.”
After the dip due to the eruption of Mount Pinatubo, it looks like you are attempting to attribute the rebound in TLT to the AMO.
Actually, the flattening of the extratropical Northern Hemisphere TLT anomalies that is very obvious in your graph occurred after the 1997/98 El Nino. Discussed in this post:
http://bobtisdale.blogspot.com/2009/06/rss-msu-tlt-time-latitude-plots.html
There are two upward steps in the extratropical Northern Hemisphere TLT anomalies and they occurred in response to the 1986/87/88 and 1997/98 El Nino events. The step in 1998 is very easy to see in the Hovmoller provided by RSS that I used in that post.
Vuk etc. says:
November 2, 2010 at 12:44 pm
You are right…but nobody wants to hear or see or whatever. It doesn’t matter for believers that temperature follows the cycles of LOD, which is the same as saying it follows also magnetic fields, and all fields from reality. Science, since the fantasies of the 20th century, has chosen black holes, entangled strings, and other parallel universes, which were best described by Prof.K.Abdusamatov words: “Hollywood Science”, useful for making truculent movie stories . No one can change those “truths”, and not only believers believe in them but practical people who have realized that such a believing pays dividends in cash.
Pete Ward:
If they did find other causes which filled the gap between explained and unexplained GW then AGW was dead
Which is, of course, why they don’t look 🙂
The decline is coming back… the perfect storm!
@vuk, you got it backwards. Arctic temperatures follow the AMO, or more precisely, North Atlantic SST.
Bob, I think the AMO/solar link is discussed here:
http://wattsupwiththat.com/2010/08/18/solar-terrestrial-coincidence/
http://wattsupwiththat.com/2010/09/04/the-north-pacific-solar-cycle-change/
Once again: Temperatures extrapolated to the year 2100
ftp://ftp.fao.org/docrep/fao/005/y2787e/
Document Archive: y2787e08.pdf pp.50
by Professor Leonid B. Klyashtorin, of the Federal Institute for Fisheries and Oceanography, Moscow, Russian Federation (e-mail: Klyashtorin@mtu-net.ru)
which, what a coincidence, shows a low at the year 2020, the same as Vuk’s extrapolation of Sun’s polar fields:
http://www.vukcevic.talktalk.net/PF.gif
However, the “post normal scientists” will say “ex-cathedra”: “It’s just numerology”
Who will stop the lemmings from jumping into the abyss?…None, then, as the oriental sage said: “Just sit at your front door and you’ll see….” (Confucius)
Nothing to do but…Buy more popcorn!
[REPLY – When it rains lemmings, make lemmingade. ~ Evan]
Great stuff as always from Joe.
The really interesting question is why the 60-70 year envelope cycle? – and is this in fact the same as the PDO cycle of around 60 years? I suspect they are BOTH primarily a result of (with some different phase ETC factors) the Solar-Lunar-Amplification-Magnetic (SLAM) process we announced in New York March 2009, although there might not be enough data to confirm this. For more on this see – especially the VIDEO (world climate forecast issued June 2009) – linked in 4th comment on the ClimateRealist ongoing thread “World Cooling has….” http://bit.ly/bpZDlp
Thanks Piers
Enneagram says: November 2, 2010 at 1:11 pm
——————————–
All in good time.
Rome wasn’t built in a day but was burnt in a night or two.
Can you here a lyre floating over the Tiber, or a gentle strain from the Sack of Ilium refrain ?
Bob Tisdale says:
November 2, 2010 at 1:07 pm
Joe D’Aleo wrote: “The AMO tracks to the solar irradiance with a lag of about 8-9 years.”
It does? You’ve provided no documentation of this…
After the dip due to the eruption of Mount Pinatubo
It was? You’ve provided no documentation of this. 😉
As a matter of fact, there was a downturn in TSI around the time of Pinatubo. You’ll remember the discussion here maybe:
http://tallbloke.wordpress.com/2010/08/05/volcanos-dont-cause-global-cooling/
Incidentally Harald Ynestad found a correlation between lunat cycles and N.Atlantic temperature:
http://tallbloke.wordpress.com/2009/11/30/the-moon-is-linked-to-long-term-atlantic-changes/
Juraj V. says: November 2, 2010 at 1:19 pm
@vuk, you got it backwards. Arctic temperatures follow the AMO, or more precisely, North Atlantic SST.
Plot the data!
I did.
http://www.vukcevic.talktalk.net/AGA.gif
It would indeed be interesting to take the output of a GCM run for, say, the A2 scenario and determine how much of the increase in temperature in the model could be accounted for by various mode of variation, such as El Nino, AMO, NAO, PDO and the rest of the alphabet soup. I have little doubt that even at the end of the 21st century, most of the temperature change could be ascribed to such modes, leaving little residual to be explained by CO2.
But what drives these modes of variation? What is the prime mover?
tallbloke says:
November 2, 2010 at 1:57 pm
Definitely as farmers from thousand of years knew, the Moon modulates Sun’s influence on climate, its eccentricity goes from 0,03 to 0,08 . But…lemmings were said to jump…because their SUV’ S were changing climate and now it’s too late: all departed to the precipice… 🙂
Bob Tisdale says:
November 2, 2010 at 12:45 pm
Joe D’Aleo wrote: “The AMO tracks to the solar irradiance with a lag of about 8-9 years.”
I does? You’ve provided no documentation of this.
Indeed he has not.
tallbloke says:
November 2, 2010 at 1:57 pm
Incidentally Harald Ynestad found a correlation between lunat cycles and N.Atlantic temperature
So, in cyclomania-land there is a handy lag of 8-9 years between the sun and the moon.
richard telford says:
November 2, 2010 at 2:03 pm
What is the prime mover?
So you want to know the “lapis philosophorum”; alchemist said that it was everywhere…
Or the freemason’s “verbum dismissum”, or the Greek’s “metron”, or Pythagoras “Tetraktis” or the Salomon’ s clavicle or what the two Imams so jealously guarded ?
🙂
richard telford says: November 2, 2010 at 2:03 pm
But what drives these modes of variation? What is the prime mover?
I am putting my idea in a short story for young children. By time they are adults it may be taken seriously!
AMO (as reflected in CETs):
http://www.vukcevic.talktalk.net/CET-NAP.htm
PDO :
http://www.vukcevic.talktalk.net/PDOc.htm
@vuk, AMO is just detrended SST for North Atlantic. Its relatively warm water enters the Arctic basin. Arctic is as “warm” (or cold) as warm is the water entering it. Something also comes from Pacific via Bering strait, so PDO plays its lesser role as well.
Your graph does not prove that Arctic temperature drives Atlantic SST.
That magnetism relation is very striking, but I think those magnetism changes are just a side effect of the real driver, which is, hm, I do not know 🙂
The AMO was high in 1950. It’s high now. Is the global temperature the same now? No, it’s almost 1 degree C higher now. The AMO can’t be responsible for that 1 C.
All the cyclical climate swings (on the timescale of Roman Warm Period / Dark Ages / Mediaeval Warm Period / Little Ice Age / Current Warm Period) we know about are
induced by changes in the level of solar activity but are capable of being
modulated by ocean behaviour.
The increased level of solar activity brings more solar protons into the
mesosphere which cools due to ozone destruction and the ozone holes grow.
The energy flux from the stratosphere increases so it too cools, the
tropopause must rise because the temperature differential between surface
and stratosphere has increased and that draws the jets poleward.
Most seem to agree that the jets move poleward when the sun is more
active (even Michael Mann in a past paper) so no disagreement there. It is only my description as to how the effect is achieved that is novel and that has been forced on me by simple observation. It also fits the recent Haigh data so if that is confirmed in
the future my work will become very significant because I first predicted just such an atmospheric response in an article published last November.
So the cloud bands move poleward, decreasing total cloud quantities and decreasing albedo thus allowing more energy into the oceans which encourages a warming bias towards strengthening El Ninos and weakening La Ninas.
The opposite occurs when the sun is quieter.
Throughout all this there continues to be shorter term solar variability
from flares, sunspots and individual solar cycles which continue in the
normal way.
And since solar protons are charged particles drawn in at the poles along the Earth’s magnetic field lines this description encompasses the varying size of the ozone holes and any climate links to variable magnetic field strengths.
Unfortunately it will also upset many in both the warming proponent and sceptical camps.
Joe- there are a few things I have to take issue with. First and foremost is the designation of “oscillation” for temperature changes that have not been observed for a full cycle and whose dynamics are unknown. This goes for the AMO, the PDO and a host of other candidates nominated to “oscillation” status. The only real oscillation whose dynamics are known is the ENSO and I had to do it myself despite thousands of readings that nobody understood and constantly misrepresented. The second thing is the fantasy of Pinatubo cooling that appears on many temperature curves including yours. What is attributed to that volcano is the La Nina cooling of 1992 and is not volcanic influence. It’s aerosol cloud shot up into the stratosphere and caused some warming initially which turned to cooling two years later. That was at a height of 16 to 22 kilometers and it never reached the troposphere where Roy Spencer has it ensconced. Neither Pinatubo, nor El Chichon, nor Gunung Agung, nor even Krakatao did any tropospheric cooling whatsoever despite what you read about them. What happens is that ENSO – El Ninos alternating with La Ninas – has been active all these years and when a volcano erupts just when a La Nina begins they assign that La Nina cooling to the volcano. That happened with Pinatubo and Gunung Agung. But El Chichon was out of luck – it picked a time when an El Nino was beginning. And Krakatao got in a little bit on the tail end of a La Nina and was assigned 0.2 degrees cooling by the so-called “volcano experts” who don’t know what they are talking about. I have some very interesting figures about this in my new edition that you ought to get when it comes out later this month. As to the satellite curves you show, it is absolutely true that there was no warming in the eighties and nineties before 1998 when that super El Nino arrived. That period was nothing but ENSO oscillations and was comprised five El Nino peaks with La Nina valleys in between. But 1995 has no particular significance beyond being an El Nino year. There really is warming but it begins with the super El Nino of 1998, raises global temperature by a third of degree in four years, and then stops. That’s in 2002 and from that point there has been no warming. It is a flat temperature plateau that lasts for six years which I have called the twenty-first century high. It came to an end with the La Nina cooling of 2008 which signified the return of the oscillating climate we had in the sixties and seventies. As I expected it was followed by the El Nino of 2010 which has now peaked and the next La Nina is already on the way. These are the ENSO oscillations that are present in all temperature curves if some idiot did not wipe them out with a running mean. They have been with us ever since the Isthmus of Panama rose from the sea and are expected to continue for the foreseeable future. They were temporarily interrupted by the super El Nino which is not part of ENSO, and by its aftermath. The warming involved is oceanic in origin and was caused by the huge amount of warm water from the Indo-Pacific Warm Pool that the super El Nino brought over. That was twelve years ago and I am not sure why we haven’t seen it start to go down. This particular warming is the only real warming within the last thirty years. One third of a degree is half of what is assigned to the entire twentieth century and is apparently enough to make the first decade of this century the warmest on record.
richard telford says:
November 2, 2010 at 2:03 pm
But what drives these modes of variation? What is the prime mover?
The Sun and the Moon shift the Earth’s ocean tides more than any other bodies in the solar system.
richard telford says:
November 2, 2010 at 2:03 pm
“What is the prime mover?”
Nothing more than the flap of a butterflies wings perhaps.
richard telford says:
November 2, 2010 at 2:03 pm
I’m afraid that until they stop concentrating on CO2, we’ll not know.
I very much doubt that the current crop of funded investigators are even capable of looking in the right area. 🙁
DaveE.
Hi Rog, nice to see you back at your old favourite haunt.
richard telford says:
November 2, 2010 at 2:03 pm
“It would indeed be interesting to take the output of a GCM run for, say, the A2 scenario and determine how much of the increase in temperature in the model could be accounted for by various mode of variation, such as El Nino, AMO, NAO, PDO and the rest of the alphabet soup. I have little doubt that even at the end of the 21st century, most of the temperature change could be ascribed to such modes, leaving little residual to be explained by CO2.
But what drives these modes of variation? What is the prime mover?“
The ‘alphabet soup’ of quasi-cyclic climate ‘drivers’ is the result of changes to the amount and type of energy from the sun which hits our outer atmosphere. It is not delivered in a continuous even stream, but in spiky bursts often over very short time periods. This results in the turbulence and the deterministic chaos we observe. When peaks or troughs in these overlapping quasi-cycles coincide, it can push weather regime/climate into a different strange attractor (from warm mode to cool mode and vice versa).
This is the elephant in the room that climate science doesn’t want to – or cannot – deal with.
I hope you are all remembering that the AMO is based on DE_TRENDED temperatures, ie North Atlantic temperatures with the warming trend removed. To therefore claim that it is responsible for the warming is a logical impossibility.
Juraj V. says:
November 2, 2010 at 2:29 pm
Your graph does not prove that Arctic temperature drives Atlantic SST.
I did not say that either, I said AMO follows the Arctic temperatures.
There are also the Arctic currents that cool the Atlantic (chicken and egg?). Pacific inflow is about 10% of the Atlantic’s i.e. minor effect.
There is a good reason to think North Atlantic is driven by NAP
http://www.vukcevic.talktalk.net/CET-NAP.htm
and presumably the AMO (which is a recent invention) and I am not particularly impressed by it.
As far as GMF is concerned see the note at the bottom of web page
http://www.vukcevic.talktalk.net/NFC1.htm
Relation between Arctic temperatures, GMF, NAP and SSN is an interesting one
http://www.vukcevic.talktalk.net/AGSN.htm
currently there is no viable and to the science acceptable rationalization for any combination among four of the above.
Leif Svalgaard says: November 2, 2010 at 2:16 pm
—————————–
Hi Doc, nice to see you back too.
I promise not to interfere with your Q & A sessions on SC24.
Prof. Dr. Judith Curry promised to look at this mystery:
http://www.vukcevic.talktalk.net/CET&10Be.htm
(J.C. ” I’m not all that familiar with this issue but it looks important ” )
direct copy of 10Be data from A 600-year annual 10Be record from the NGRIP ice core, Greenland by Berggren et al. from GEOPHYSICAL RESEARCH LETTERS, VOL. 36; published 2 June 2009.
Will keep you posted.
Jeff T says:
November 2, 2010 at 2:31 pm
The AMO was high in 1950. It’s high now. Is the global temperature the same now? No, it’s almost 1 degree C higher now.
Hhhmmmmmm. do we have any evidence that the global temperature is different?
With all the evidence that there is very grave doubt that there is such a thing as a global temperature and the sources of temperature data is “compromised” (To put it mildly!) I would have very grave doubts about your statement
@jimmi, even detrended, the sinusoidal wave remains as well as warming periods 1910-1940 and 1975-2005. If you have two days with equally cold nights and warm noons, there is warming in the morning, even the overall linear trend is flat.
AMO
http://climexp.knmi.nl/data/iamo_ersst_tsa.png
North Atlantic SST
http://climexp.knmi.nl/data/ihadsst2_280-360E_0-70N_na.png
Juraj V. says:
November 2, 2010 at 12:38 pm
“It is interesting, that AMO is some kind of residual of ENSO; at least Bob Tisdale says so. He simply cumulated annual ENSO index values and got almost exact copy of HadCRUT, it means AMO is somehow incorporated in the ENSO.”
As far as I am concerned, Juraj, AMO is just wishful thinking by a climatologist seeking order in chaos. And ENSO has nothing whatsoever to do with AMO. Bob Tisdale’s observation, however, hits the mark. HadCRUT3 does indeed show all the El Nino peaks back to 1880. They are present in all accurate temperature curves that have not been massaged or running-averaged. If Bob was using Nino 3.4 he probably would have picked up the El Nino history that HadCRUT3 embodies. That is because Nino 3.4 is ensconced at the center of the Pacific equatorial countercurrent, the gateway that carries El Nino waves across the ocean.
Leif Svalgaard says:
November 2, 2010 at 2:21 pm
So, in cyclomania-land
*Yawn*
You wouldn’t recognise two mutually amplifying resonances if they joined forces and kicked you up the jacksie simultaneously, so I won’t waste my time.
@JeffT: “The AMO was high in 1950. It’s high now. Is the global temperature the same now? No, it’s almost 1 degree C higher now. The AMO can’t be responsible for that 1 C.”
If we believe global HadCRUT, the difference between 1940s and now is 0.4 C, not 1C. This is including UHI and whatever. If we believe that THIS difference is the underlying warming trend, it is 0.6 C per century, mere 5 to 12 times less than IPCC “best estimate”. But the underlying warming trend can be hardly caused by CO2 which has risen exponentially after WWII, since the steepness of 1910-1940 and 1975-2005 warming is the same.
Problem with IPCC “best estimate” of course is, that it extrapolates the UHI-inflated 1975-2005 warming trend somewhere to 2100, which is like predicting Saturday temperature by extrapolating daily warming between 6AM-2PM.
North Atlantic itself has warmed by mere 0.3 deg C between its warm peaks 1940/2005. SST is something like UHI-free record. Anyway, the cooling period is due.
@Juraj V
Yes a sinusoidal curve remains, but the article claims it explains GLOBAL warming, and the AMO is a local oscillation (in space as well as time i.e when one part gets warmer, another gets cooler) It could, potentially, explain (or more exactly, reproduce, since without a driving mechanism it explains nothing) oscillations in temperature in one area, but cannot logically explain a global effect.
Joseph D’Aleo:
The portrayal of the AMO as purely natural well documented phenomena is not supported by the literature. The phenomena was not identified until 1994 and was not named until 2000. The “cycle” you noted of 60 to 70 years appears to be based on the recent 154 years of data and shows considerable variation in other data sets from 60 years to 110 years (some even suggest the possibility of even shorter swings).
Your presentation of the AMO as if it was a purely natural phenomenon (see previous post at: http://wattsupwiththat.com/2010/11/01/arctic-temperatures-and-ice-%E2%80%93-why-it-is-natural-variability/ ) whose reversal can be tightly predicted is not supported by the literature.
http://www.wcrp-climate.org/decadal/references/WCC3_Decadal_WhitePaper.pdf
Several sites have the following, (I was not able to track down its original source):
“There is no demonstrated predictability for when the AMO will switch, in any deterministic sense. Computer models, such as those that predict El Niño, are far from being able to do this. Enfield and colleagues have calculated the probability that a change in the AMO will occur within a given future time frame, assuming that historical variability persists.”
The lack of predictability was noted in an analysis of a prior presentation you did for this blog.
http://wmbriggs.com/blog/?p=2952
The IPCC at http://www.ipcc.ch/publications_and_data/ar4/wg1/en/ch3s3-6-6.html describe it as:
“Over the instrumental period (since the 1850s), North Atlantic SSTs show a 65 to 75 year variation (0.4°C range), with a warm phase during 1930 to 1960 and cool phases during 1905 to 1925 and 1970 to 1990 (Schlesinger and Ramankutty, 1994), and this feature has been termed the AMO (Kerr, 2000), as shown in Figure 3.33. Evidence (e.g., Enfield et al., 2001; Knight et al., 2005) of a warm phase in the AMO from 1870 to 1900 is revealed as an artefact of the de-trending used (Trenberth and Shea, 2006). The cycle appears to have returned to a warm phase beginning in the mid-1990s, and tropical Atlantic SSTs were at record high levels in 2005. Instrumental observations capture only two full cycles of the AMO, so the robustness of the signal has been addressed using proxies. Similar oscillations in a 60- to 110-year band are seen in North Atlantic palaeoclimatic reconstructions through the last four centuries (Delworth and Mann, 2000; Gray et al., 2004). Both observations and model simulations implicate changes in the strength of the THC as the primary source of the multi-decadal variability, and suggest a possible oscillatory component to its behaviour (Delworth and Mann, 2000; Latif, 2001; Sutton and Hodson, 2003; Knight et al., 2005). Trenberth and Shea (2006) proposed a revised AMO index, subtracting the global mean SST from the North Atlantic SST. The revised index is about 0.35°C lower than the original after 2000, highlighting the fact that most of the recent warming is global in scale.
The AMO has been linked to multi-year precipitation anomalies over North America, and appears to modulate ENSO teleconnections (Enfield et al., 2001; McCabe et al., 2004; Shabbar and Skinner, 2004). Multi-decadal variability in the North Atlantic also plays a role in Atlantic hurricane formation (Goldenberg et al., 2001; see also Section 3.8.3.2). The revised AMO index (Trenberth and Shea, 2006) indicates that North Atlantic SSTs have recently been about 0.3°C warmer than during 1970 to 1990, emphasizing the role of the AMO in suppressing tropical storm activity during that period. The AMO is likely to be a driver of multi-decadal variations in Sahel droughts, precipitation in the Caribbean, summer climate of both North America and Europe, sea ice concentration in the Greenland Sea and sea level pressure over the southern USA, the North Atlantic and southern Europe (e.g., Venegas and Mysak, 2000; Goldenberg et al., 2001; Sutton and Hodson, 2005; Trenberth and Shea, 2006). Walter and Graf (2002) identified a non-stationary relationship between the NAO and the AMO. During the negative phase of the AMO, the North Atlantic SST is strongly correlated with the NAO index. In contrast, the NAO index is only weakly correlated with the North Atlantic SST during the AMO positive phase. Chelliah and Bell (2004) defined a tropical multi-decadal pattern related to the AMO, the PDO and winter NAO with coherent variations in tropical convection and surface temperatures in the West African monsoon region, the central tropical Pacific, the Amazon Basin and the tropical Indian Ocean. ”
Your article failed to note that the AMO is so interconnected with human induced warming that the data supporting the “natural” element has to be altered to remove the influence of greenhouse global warming and there are concerns that this removal still contains an element of global warming.
“The AMO signal is usually defined from the patterns of SST variability in the North Atlantic once a linear trend has been removed. This detrending is intended to remove the influence of greenhouse gas-induced global warming from the analysis, leaving a purely natural variation. However, if the global warming signal is significantly non-linear in time (i.e. not just a smooth increase), variations in the forced signal will leak into the AMO definition (Mann and Emanuel, EOS, 2006). Consequently, correlations with the AMO index may alias affects of global warming.”
http://www.worldlingo.com/ma/enwiki/en/Atlantic_Multidecadal_Oscillation
Another source readily admits the uncertainty over the AMO:
“The Atlantic multidecadal oscillation (AMO) is a hypothesised mode of natural variability occurring in the North Atlantic Ocean and which has its principle expression in the sea surface temperature (SST) field. While there is some support for this mode in models and in historical observations, controversy exists with regard to its amplitude, and in particular, the attribution of sea surface temperatures in the tropical Atlantic in areas important for hurricane development. In addition, many scientists believe that global warming is changing this pattern.”
Romm, Joseph J., Hell and High Water: Global Warming — the Solution and the Politics, pp. 44, 47 (2006) William Morrow & Co. ISBN 0-06117-212-X citing MIT’s and Kerry Emanuel’s research as showing that the AMO has now been supplanted by global warming as the “dominant force” in the Atlantic climate.
There also appears to be confusion over what phase we are currently in as a previous post from 2009 on this blog indicated that we had entered a cold phase that would last for 20 years.
“The last interval change was 1994 or about 15 years ago and according to Enfeld et.al (2005), the probability that AMO will switch to cool in 15 years is about 80%. Based on this analysis , there is a high probability that the current cooling phase of AMO which started in 2009 is real and likely sustainable for the next 20 years at least.”
http://wattsupwiththat.com/2009/07/14/the-atlantic-multidecadal-oscillation-not-quite-cool-yet/
A 2010 study suggests a 50 to 90 year period.
Enfield, David B.; Cid-Serrano, Luis (2010), “Secular and multidecadal warmings in the North Atlantic and their relationships with major hurricane activity”, International Journal of Climatology 30 (2): 174–184, doi:10.1002/joc.1881
Abstract:
“Analysis of recent literature finds weaknesses in arguments to the effect that the Atlantic multidecadal oscillation (AMO)—roughly 50–90 year fluctuations in North Atlantic sea surface temperatures—is externally forced by anthropogenic aerosols and greenhouse gases rather than an internal climate mode, plus indications from other sources that the contrary may be true. We are led to the conclusion that the AMO is probably comprised of both natural and anthropogenic forcing in ways that preclude a physically based separation of the two, using the limited historical data sets. A straightforward quadratic fitting of trend to temperature data accounts for some of the 20th century nonlinearity in secular warming and separates the secular and multidecadal components of variability without inherent assumptions about the nature of the multidecadal fluctuations. Doing this shows that the 20th century secular ocean warming in the North Atlantic is about equal to the peak-to-peak amplitude of the multidecadal fluctuations. However, over the last quarter-century (1975–2000) the most recent multidecadal warming has been almost three times the secular sea surface temperature (SST) increase over the main development region (MDR) for major Atlantic hurricanes. In the last quarter-century the multidecadal increase in late summer Atlantic warm pool (AWP) size (area of SSTs in excess of 28 °C) has been 36%, and the secular increase, 14%. Projections to the year 2025 show that the cumulative change in summer warm pool size since 1975 will depend critically on whether a subsequent cooling in the multidecadal cycle occurs, comparable to the warming between 1975 and 2000 AD. This places a high premium on understanding to what extent the AMO is a man-made or a natural phenomenon.”
The authors of this study indicate that “the AMO is probably comprised of both natural and anthroprogenic forcing in ways that preclude a physically based separation of the two” yet the article you have posted above would lead the reader to believe that their is no connection between AMO and “anthroprogenic forcing”, only a connection between the AMO and global temperature.
While some of the information in your article is supported by the literature, the lack of forthrightness in regards to the basic nature of the AMO and the impact of anthropogenic warming on the AMO is a serious deficiency. It is not clear if the data you are presenting is the full AMO which includes the global warming signal, or if you applied detrending to eliminate the global warming signal in measuring the AMO. In any event, the presentation failed to inform the reader of the links between the AMO and anthropogenic forcing. .
Hi Arno, the multidecadal variation in the North Atlantic is real.
http://climexp.knmi.nl/data/ihadsst2_280-360E_0-70N_na.png
AMO is +- this curve laid down.
Whether AMO is an aftereffect caused by ENSO via induced atmospheric changes, or driven by some planetary tidal effects I do not know. But the simplest way to change SST is to change the cloud cover, since ocean gets warmed by absorption of SW radiation. Satellite cloud observations do show significant variation:
http://www.climate4you.com/images/CloudCoverTotalObservationsSince1983.gif
Juraj V. says:
November 2, 2010 at 2:29 pm
That magnetism relation is very striking, but I think those magnetism changes are just a side effect of the real driver…
That´s because there are “two imams guarding the qubt” at sin =45° and at Cos=135°
How would one go about warming the Atlantic? Are some posters here really saying that humans are warming it up? How? If you say increased greenhouse gas and specifically mention CO2, you’ve got some physics to explain related to long wave radiation’s inability to warm a large, deep body of water to any degree measurable below the mm surface and that is outside of the normal natural variation.
@Will Crump, since the warming trend between 1910-1940 and 1975-2005 is essentially the same, there seems not be much space left for alleged “anthropogenic footprint”, even you are trying hard. Looking at NA SST record, the difference between 1910 and 1975 minimums and 1940 and 2005 maximum is the same – some 0.3 C. First, the underlying warming trend is by order less than IPCC “best estimate”, second it does not seem to be strengthening to the end of the record, it is linear. Twist the facts which ever way, after removing PDO or AMO, there is nothing left for alleged anthropogenic effect. IPCC wrongly attributes all post-1975 warming to CO2. The whole AGW pseudoscience runs on 30-year natural trend, exactly of the same size and magnitude as occurred in 1900-1940 period.
David A. Evans says:
November 2, 2010 at 2:44 pm
I would like you to visit the link at “Enneagram”, a kind you will like it.
Arno Arrak says: “And ENSO has nothing whatsoever to do with AMO.”
All SST datasets are impacted by ENSO, including the AMO, which is simply North Atlantic SST anomaly data that’s been detrended.
Give me some time and I’ll eventually show the the AMO is actually the North Atlantic integrating the effects of ENSO. I gave a hint toward it with this animation of the monthly (lag) correlations with ENSO in the Atlantic:
http://i52.tinypic.com/2gtai6d.jpg
From this post:
http://bobtisdale.blogspot.com/2010/10/on-differences-between-surface-and-tlt.html
“Transitions positive”??????
Does that mean “becomes postive”?
If so, a few English lessons might help to make things clearer.
I note from the graph that the world did not end in 1953 or 1998. . . .
Fred N. says: “Bob, I think the AMO/solar link is discussed here”
Thanks for the links, but Joe D’Aleo states “solar irradiance” implying Total Solar Irradiance or TSI, which is not discussed in the two posts your linked. Solar cycle length and TSI are two separate discussions.
Will Crump says: “Your article failed to note that the AMO is so interconnected with human induced warming that the data supporting the ‘natural’ element has to be altered to remove the influence of greenhouse global warming and there are concerns that this removal still contains an element of global warming.”
There is no evidence that Sea Surface Temperatures are impacted in any way by Anthropogenc Greenhouse Gases. None whatsoever. The rise in global SST anomalies over the 20th century can be explained as the oceans integrating the lingering effects of ENSO. Are you aware that about 25% of the global oceans (the East Indian and West Pacific Oceans, from 80E to 180 longitude) warm in response to El Nino AND La Nina events? Your packaged AGW replies don’t stand up here at WUWT.
Regards
“When the AMO is positive (warm) the Northern Hemisphere is warmer than normal on an annual basis across the continents. When it is cold, it is colder.”
So what went wrong in 1975/6 then ?
http://icecap.us/images/uploads/AMOSANNUAL.jpg
Did two people just ask how CO2 could affect ocean temps? Now I’m not really qualified to discuss climate science but if co2 is a GHG, and it warms the atmosphere ( fact, right?), wouldn’t that heat transfer into the oceans? Also I’m confused on why this article discusses An apparent “global warming”.. I thought we had already decided the earth was cooling??
It all depends if one accepts that the AMO has a cycle (any cycle at all that is) [which should be quite clear for anyone with eyes and anyone without graphic dyslexia] …
… or whether one thinks the AMO just reflects the global temperature and is not a natural cycle then.
But the second explanation results in the conclusion that global temperatures have some kind of cycle (AMO influenced or not).
In other words, it does not matter. The AMO either contributes to a global temperature cycle or it is caused by a global temperature cycle.
This issue should be therefore DONE in my opinion.
Secondly, how does the ENSO impact the AMO (there are various physical explanations for how it could do so especially when considers how the actual atmosphere circulates around the planet).
Here is a chart which shows there is a lag of approximately 8 months in the AMO reacting to the Nino 3.4. Not a really, really clear correlation but certainly there.
http://img215.imageshack.us/img215/8791/weeklyensoamooct27.png
So how does the combination of the ENSO and the AMO impact global sea surface temperatures. Very strong correlation on the way up, but global SSTs look a little sticky on the way down.
http://img249.imageshack.us/img249/4264/weeklyensoamoglobalssts.png
If one wants to see how the ENSO and AMO influence the UAH global temperatures since 1979 or the Hadcrut3 global temperatures since 1871 (along with my forecast out a few months), here one is. Should be clear enough for anyone with eyes and without graphic dyslexia.
http://img138.imageshack.us/img138/6597/uahmodeloct10.png
http://img828.imageshack.us/img828/1048/hadcrut3modelsept10.png
Will Crump says:
November 2, 2010 at 4:14 pm
In any event, the presentation failed to inform the reader of the links between the AMO and anthropogenic forcing.
==================================
Uh huh.
And “in any event”, YOUR presentation…failed to scientifically prove any significant link between the AMO and anthropogenic forcing.
Chris
Norfolk, Va, USA
Pamela Gray says: November 2, 2010 at 4:25 pm
How would one go about warming the Atlantic? Are some posters here really saying that humans are warming it up? How? If you say increased greenhouse gas and specifically mention CO2, you’ve got some physics to explain related to long wave radiation’s inability to warm a large, deep body of water to any degree measurable below the mm surface and that is outside of the normal natural variation.
Of course, the ocean is huge and the heat capacity is large, but how could increased radiant energy into the oceans do anything but warm up the water at least a little bit? (OK, there are some possible negative feedback mechanisms like warmer –> more humidity –> more clouds –> more reflected energy, but the 1st order effect is to warm the waters.)
As to the “mm penetration depth”, that is a red herring. Indeed, LWIR from ~300 K objects will penetrate 0.1 mm or less (see http://www.physics.umd.edu/grt/taj/104a/watopt.gif). Still, increased LWIR from CO2 can have a net warming effect on several meters of water, and I can explain the physics.
The simple fact is that there is more LWIR LEAVING that top 0.1 mm than ENTERING — the warm water radiates more LWIR up than the cool atmosphere radiates down. So the top mm will on average be COOLED by LWIR. An increase in GHG’s and a subsequent increase in the temperature of the atmosphere will reduce the cooling of the top 0.1 mm by radiating more LWIR downward.
Meanwhile, SWIR from the sun heats a layer on the order of 10 cm deep. Visible light from the sun heats a layer on the order of 10 m deep.
* Top layer cools less when more LWIR is radiated down by the atmosphere.
* Deeper layers get heated as much by SWIR and visible light radiated down by the sun.
Sounds like a recipe for increased warming of several meters of ocean.
Of course, there are other affects like evaporation and convection, but that is more than I have time (or expertise) to address at the moment. I’d be happy to hear criticisms of the radiative part of my arguments.
” Still, increased LWIR from CO2 can have a net warming effect on several meters of water, and I can explain the physics.”
Please do. If I’ve been under a misapprehension then I’d like to know. However you need to take evaporation and convection into account too because evaporation is a net cooling process so somehow the LWIR from CO2 needs to overcome that obstacle yet you admit that you have not considered it:
“Of course, there are other affects like evaporation and convection, but that is more than I have time (or expertise) to address at the moment.”
HenryP we have the ability to do pretty much anything we want to the climate – by lifting enormous mirrors into space – and we can reach any resources we need. The question is do we have the will?
The Manhattan Scientists gave us the ability. http://en.wikipedia.org/wiki/Project_Orion_(nuclear_propulsion)
Re Pamela Gray says:
November 2, 2010 at 4:25 pm
How would one go about warming the Atlantic? Are some posters here really saying that humans are warming it up? How? If you say increased greenhouse gas and specifically mention CO2, you’ve got some physics to explain related to long wave radiation’s inability to warm a large, deep body of water to any degree measurable below the mm surface and that is outside of the normal natural variation.
Pamela, do you or anyone know of actual studies (experiments) done on this and have the results to reflect the difference in ocean heating capacity between LW and SW radiation? It appears obvious to me that an increase in sunshine over the tropics would do far more to heat the oceans then any GHG, as well as increasing the residence time of each unit of energy in the planets budget, but I have not seen any numbers to quantify either the ocean warming capability or residence times of various spectrem of radiant energy.
Jurajv:
Bob Tisdale:
savethesharks:
Relationship of AMO and greenhouse gas is not a matter of my opinion, it is what the studies report.
“Analysis of recent literature finds weaknesses in arguments to the effect that the Atlantic multidecadal oscillation (AMO)—roughly 50–90 year fluctuations in North Atlantic sea surface temperatures—is externally forced by anthropogenic aerosols and greenhouse gases rather than an internal climate mode, plus indications from other sources that the contrary may be true. We are led to the conclusion that the AMO is probably comprised of both natural and anthropogenic forcing in ways that preclude a physically based separation of the two, using the limited historical data sets.”
Enfield, David B.; Cid-Serrano, Luis (2010), “Secular and multidecadal warmings in the North Atlantic and their relationships with major hurricane activity”, International Journal of Climatology 30 (2): 174–184, doi:10.1002/joc.1881
I would have thought you would have focused on the language above, which takes the position that there are weaknesses in studies which attribute all of the AMO effect to anthropogenic forces and studies which attempt to attribute all of the AMO effect to forces other than anthropogenic forces.
This 2010 study concluded that the AMO consisted of both natural forces and anthropogenic forces and did not assign a value to which factor was of higher importance as it stated: “This places a high premium on understanding to what extent the AMO is a man-made or a natural phenomenon.”
I do not think this is the standard AGW view as the AGW crowd would want to attribute all of the AMO to human causes.
I welcome references to studies that take different positions and look forward to future studies that take up the challenge from this study of determining the relative contribution of the various forces affecting the AMO.
My primary issue is with Joseph D’Aleo’s article not presenting the existence of differences of opinion about the AMO.
Have you ever wondered..?.., see:
1)The induction coil (Nasa):
http://www.nasa.gov/centers/goddard/images/content/154188main_plasma_bands_lgweb.jpg
2) Plus the magnetic core: Fe3O4 (magnetite ore)
3)Induction heating.
Now, do you understand?:
http://www.vukcevic.talktalk.net/AT-GMF.gif
Entiende? 🙂
The aerosol theory is similar to Einstein’ s cosmological constant; to bent theory to agree with observations.
Had the aerosols did the 1950-1990 cooling, industrial areas like Ruhr area would be much colder than other areas. They were not.
Aerosols (except the volcanic ones, shot up high) have short lifetime (until the next rain). But distant Arctic cooled much more than industrial Europe; it does not add.
There are no measurements of aerosols from that times. SATO index shows nothing, except volcanic events. The aerosol theory is a fig leaf, covering the deficiences of GCM, governed by only CO2.
Had the aerosol theory been correct, we should still live under thick cloud of black smoke, which decreases the clean air temperature by whole two degrees. Just extrapolate the 1900-1940 warming trend until today. Pure nonsense.
http://climexp.knmi.nl/data/ihadsst2_280-360E_0-70N_na.png
I have read this very interesting paper from Dan Pangburn, P. E. (Licensed Mechanical Engineer)
http://www.climaterealists.com/attachments/database/corroborationofnaturalclimatechange.pdf
One of the most inteligent approach I ever read on the subject. If there is a path to follow this one could be it.
>> Still, increased LWIR from CO2 can have a net warming effect
>>on several meters of water, and I can explain the physics.”
>Please do.
I thought I had. 🙂
> … you need to take evaporation and convection into account too …
I know from conservation of energy that if the NET energy flow into a system exceeds the net energy flow out, then the system will warm. And vice versa.
If “the system” = “the oceans as a whole”, then we could consider many ways to transfer energy in and out:
* visible light (energy in to the oceans)
* SWIR (mostly in)
* LWIR (some in, more out)
* Evaporation (energy out)
* contact with air (depends on relative temperature of air and water)
* geothermal heat (a small amount in from ocean floors)
* convection (which simply moves energy around within the ocean, so it doesn’t really change the overall energy).
Even if I don’t know the specific contributions of each mechanism (heck, even if I have not listed some specific energy transfer mechanisms), I still know that the net flow of energy is all that matters. The net result of all the mechanisms tells me what happens If I increase any energy flow in — including LWIR — the then systems has to respond. If it was stable, then it will warm. If it was warming, it will warm more. If it was cooling, it will cool less. All of these could be considered a “warming effect”.
Tim Folkerts says:
November 3, 2010 at 9:37 am
The missing links, the fields we have chosen to ignore, by fear of being considered not so intelligent, by denying the simple laws of the universe. Unless we free ourselves of that self indulging fantastic epistemological load we won’t be able to see things analogically: The simple laws of the cosmos has been transmitted generation after generation however our self conceit has impeded us of approaching to them:
http://www.scribd.com/doc/40514613/Unified-Field-Explained-8
Tim, my query is limited exclusively to longwave IR because it is only longwave IR that increases as a result of more CO2 in the air.
The only effect on a water surface that longwave IR can have is to increase evaporation because it never gets in deeper than the region involved in evaporation.
Evaporation being a net cooling process how can you show that ANY of the energy from that extra IR is left in the body of the water ?
has anyone ever seen an experiment that compared the warming capacity of LWIR verses SWUV?
Bob Tisdale:
I have visited your web site and appreciate the information and analysis that you provide.
I am not certain I follow what you mean by this:
“There is no evidence that Sea Surface Temperatures are impacted in any way by Anthropogenc Greenhouse Gases.”
I am not suggesting that CO2 in the water causes any warming, only that the anthroprogenic effects on the atmosphere cause it to warm and this in turn can cause the ocean to be warmer than it would be without the atmosphere warming.
If there is no warming effect, why are the numbers adjusted for “detrending”:
“The AMO signal is usually defined from the patterns of SST variability in the North Atlantic once a linear trend has been removed. This detrending is intended to remove the influence of greenhouse gas-induced global warming from the analysis, leaving a purely natural variation.”
Your website phrases this differently:
“The Atlantic Multidecadal Oscillation (AMO) is an expression of the natural quasi-periodic cycle in North Atlantic SST anomalies. The AMO is created by detrending the North Atlantic SST anomalies; that is, the monthly values of the linear trend line are subtracted from the monthly SST anomaly data. ”
http://bobtisdale.blogspot.com/2009/03/recent-drop-in-amo.html
http://bobtisdale.blogspot.com/2009/04/atlantic-multidecadal-oscillation.html
Is the description of detrending in the quote I originally left in error? If yes, please bash this description and lets get the right information out.
Saw your comment concerning a previous post concerning information provided by Joe D’Aleo and Don Easterbrook at: http://wattsupwiththat.com/2010/11/02/the-atlantic-ocean-via-the-amo-drives-the-apparent-%E2%80%9Cglobal-warming%E2%80%9D/
What is your analysis of the statement “The Atlantic Ocean via the AMO drives the apparent “Global Warming” ” and the information provided by Joseph D’Aleo above?
>Stephen Wilde says: November 3, 2010 at 11:16 am
>Tim, my query is limited exclusively to longwave IR because it is only
>longwave IR that increases as a result of more CO2 in the air.
OK – I agree with that.
>The only effect on a water surface that longwave IR can have
>is to increase evaporation because it never gets in deeper than
>the region involved in evaporation.
Why do you a priori rule out conduction of heat to the atmosphere or to lower layers of water? Some “back of the envelope” calculations suggest that thermal conductivity could whisk the increased energy (we are only talking about a few W/m^2) to lower layers almost as fast as the extra LWIR arrives. Yes, some increase in evaporation will occur, but it seems much of the energy will get absorbed into the water.
My background in in physics — we need a good chemical engineer to tell us about heat from thru water. My intuition is that the bulk will get heated; your intuition is that only the surface will get heated. Intuition doesn’t count for a lot unless it is an area someone specializes in.
“Why do you a priori rule out conduction of heat to the atmosphere or to lower layers of water?”
Evaporation being a net cooling process it follows that it removes more energy (in latent form) than the amount of energy (in sensible form) required to provoke it.
“Yes, some increase in evaporation will occur, but it seems much of the energy will get absorbed into the water.”
Why ? The extra energy in IR form doesn’t get past the evaporating layer so all it does is increase the rate of evaporation for a net cooling effect before it can be conducted downward.
There is physical evidence for that in the presence of ‘skin’ of cooler water above the ocean bulk which is about 0.3C cooler than the ocean bulk below.
That skin is created because the effects of evaporation and upward radiation remove energy from the water faster than it comes up from below.
Thus logically if one increases evaporation or upward radiation that skin layer must either get colder or deeper or more likely both as the two processes try to draw energy out of the water even faster.
That fact being potentially fatal to AGW theory (because you can’t warm the air without warming the oceans first) there has been a cockeyed attempt to debunk it by means of a so called ocean skin effect (promulgated at Realclimate) due to increased CO2 but I don’t accept that speculation for a moment and it has never been adequately demonstrated
And so I post this again: david says:
November 3, 2010 at 11:47 am
has anyone ever seen an experiment that compared the warming capacity of LWIR verses SWUV?
I know an experiment cannot exactly reflect real world conditions, but it appears logical that it can put the physics on paper to a real world experiment and somewhat isolate the various spectrum and their different warming affect on H2o.
I am also very intrested in the residence time of various TSI in all spectrum once it reaches the ocean, as this must be critical in determing net warming of the ocean over time verses short term atmosphere changes. Atmosphere warming can still mean global cooling is taking place.
Any help is appreciated.
Tim, Pamela, Stephen, Bueler, anyone
Thanks (-:
AMO correlates to global temperature shifts fairly well over the long term (back to 1860), but is by no means perfect. For instance, 1910 – 1920 was the coolest part of the AMO phase, but global temperatures were rising. For a more recent example (better data), AMO took a precipitous drop from 1960 to 1975, but the globe warmed.
If one posits lags and weather effects, you could make a better fit, but what you can’t do is turn an oscillation into a trend. Over the long-term (from 1860), AMO has oscillated around a mean, while global temperatures have gone up by ~1C. As with ENSO and PDO, oscillating patterns may correlate to temperature shifts, but none of them account for the long-term warming. The nomenclature common to all these patterns (oscillating) should give a clue. They don’t cause global warming so much as move the heat around in-system.
Joe, if you have convincing proof that this is the case you should publish your work in a peer reviewed paper. Hold your paper to the same standard that you would hold any Mann or Schmidt or Hansen. Until you can do that you are publishing an opinion piece.
Tim Folkerts says:
November 3, 2010 at 1:15 pm
Just try preparing your breakfast with a hairdryer 🙂
@Stephen
Let me reduce this to the core issue (as I see it). Imagine two sections of ocean – each one square meter and located near each other. Thus they are essentially identical.
Are you arguing that if I shine an extra 10 W of LWIR on one of those square meters, that section will be COOLER than the unchanged one? Cooler at ANY level in the water? If so, by what mechanism?
@Enneagram
I’m fine using a frying pan or microwave to cook my breakfast. By what does that have to do with anything I said?
Will Crump says: “I am not suggesting that CO2 in the water causes any warming, only that the anthroprogenic effects on the atmosphere cause it to warm and this in turn can cause the ocean to be warmer than it would be without the atmosphere warming.”
I also was not suggesting that the CO2 in the water causes any warming. Let me rephrase my statement. There is no evidence that downward longwave radiation from anthropogenic greenhouse gases has any impact on sea surface temperatures, or on ocean heat content.
You continued, “If there is no warming effect, why are the numbers adjusted for ‘detrending’…
The reason the North Atlantic SST anomalies are detrended for the AMO is to better show the frequency and magnitude of the variations in The North Atlantic SST anomalies.
You asked, “What is your analysis of the statement ‘The Atlantic Ocean via the AMO drives the apparent “Global Warming’ and the information provided by Joseph D’Aleo above?”
I disagree. I’ve left two comments on this thread about the post:
http://wattsupwiththat.com/2010/11/02/the-atlantic-ocean-via-the-amo-drives-the-apparent-%e2%80%9cglobal-warming%e2%80%9d/#comment-521702
http://wattsupwiththat.com/2010/11/02/the-atlantic-ocean-via-the-amo-drives-the-apparent-%e2%80%9cglobal-warming%e2%80%9d/#comment-521715
“Tim Folkerts says:
November 3, 2010 at 4:47 pm
@Stephen
Let me reduce this to the core issue (as I see it). Imagine two sections of ocean – each one square meter and located near each other. Thus they are essentially identical.
Are you arguing that if I shine an extra 10 W of LWIR on one of those square meters, that section will be COOLER than the unchanged one? Cooler at ANY level in the water? If so, by what mechanism?”
I’m arguing that logically that should be so unless there is another way of getting the energy from downward IR deeper into the water.
I went into it in extensive detail here:
http://climaterealists.com/index.php?id=4245
“Greenhouse Gases Can Cause Cooling !”
“”””” Tim Folkerts says:
November 3, 2010 at 1:15 pm
>Stephen Wilde says: November 3, 2010 at 11:16 am
>Tim, my query is limited exclusively to longwave IR because it is only
>longwave IR that increases as a result of more CO2 in the air.
………………………..
My background in in physics — we need a good chemical engineer to tell us about heat from thru water. My intuition is that the bulk will get heated; your intuition is that only the surface will get heated. Intuition doesn’t count for a lot unless it is an area someone specializes in. “””””
Tim, standard absorption coefficients for LWIR in H2O are well documented, and suggest that something like 99% of downward LWIR that reaches the ocean surface gets absorbed in about 50 microns pathlength, so you have a heated source that is 50 microns thick, on top of a heat sink, that already has a natural Temperature gradient from surface to deeper waters, and a totally huge thermal mass compared ot that thin surface layer (I refuse to call it a skin).
You can do the math, and figure out just how much that LWIR caused heat source could change the surface Temeprature gradient, and calculate the rate of heat conduction from the surface. To the extent that the surface Temperature increases at all, the high energy tail of the MB distribution of molecular energies would increase and those more energetic molecules could leave in evaporation; leaving the mean energy lowered and so the Temperature; and you’d have to factor in the Latent heat lost to the atmosphere at the same time.
I’ve never done the calculation but I imgine it would be done sometime in “Heat 101” in a freshman Physics course; if not in High School. Since I did HL&S, E&M from my first day in High school, I have no recollection of exactly when we would have done it; or when they teach it in school these days. I have a son doing an “engineering degree” at SF State U, and so far, I am confident that he can spell “heat”; but after that I think his eyes just glaze over.
But SF State does have a World Class School of Racism; well I think they officially call it “Ethnic Studies.”
I have no idea what all the elements of Stephen’s New Theory of Climate are; so I can’t comment further on that.
I would think that Trenberth in his earth energy budget would have done all of those calculations so they should be in his papers somewhere.
George E. Smith says:
George, thank you for post. What can you tell me about the residence time of various solar spectrem as it enters the ocean besides LWIR.
Also would not any LWIR that mmanages not to quickly revert back to the atmosphere be very near the surface and have a short residence time, although it does not sound like this small residue of heat would have any real net effect?
Thanks
Does a warm atmosphere immediately above water result in that water warming up?
Obviously yes.
The molecules immediately above the water’s surface are colliding with other molecules at a rate of 8 billion per second. In other words, words cannot even describe how much energy is being transferred around at speeds we cannot even imagine.
Let’s look at what really happens with water temperatures.
The Ocean surface temperatures lag behind the solar radiation cycle by about 40 days to 90 days. The peak of solar radiation is around June 21st but shallow surface lake waters peak around the end of July, deeper lake surface waters peak around mid-August and Ocean waters peak around September 10th (there is some differential depending on the latitude as well).
Atmospheric temperatures peak about 35 days after the solar radiation peak so there
are certainly lags in the climate system and even longer ones for water.
How do these lags happen? Does that help answer any questions with respect to how water absorbs energy?
I still come back to basic conservation of energy considerations applied to the top 0.01 mm = 100 microns of water in the ocean.
In the “control” square meter, the energy flow into that layer must be very nearly balanced — if it wasn’t then even a small positive imbalance would quickly lead to a rise in temperature. That would cause the layer to evaporate more and to radiate more and conduct more to the air and conduct more to the water below.
In the “test” square meter, I intentionally add extra energy — more LWIR coming down from GHG’s. This will raise the temperature of the surface. Much of this energy will result in more evaporation. Much of it will result in more LWIR emitted back upward. But at least SOME of the energy will go to the air and some to the water below.
Tim did George E Smith ‘s comment help you as it was a direct response to your comment / question :
Tim, standard absorption coefficients for LWIR in H2O are well documented, and suggest that something like 99% of downward LWIR that reaches the ocean surface gets absorbed in about 50 microns pathlength, so you have a heated source that is 50 microns thick, on top of a heat sink, that already has a natural Temperature gradient from surface to deeper waters, and a totally huge thermal mass compared ot that thin surface layer…Temperature increases at all, the high energy tail of the MB distribution of molecular energies would increase and those more energetic molecules could leave in evaporation; leaving the mean energy lowered and so the Temperature; and you’d have to factor in the Latent heat lost to the atmosphere at the same time.
Bill Illis, thank you and it helps. but does not quantify how much of the LWIR is responible for the warmth verses the SWR and refers to the warming of bodies of water, not the cooling. Any more information is recieved with gratitude.
“But at least SOME of the energy will go to the air and some to the water below.”
Not necessarily because evaporation is a NET COOLING process. That means more energy is removed from the local environment in latent form than is required in sensible form to provoke it. If one proposes that any energy is added to the environment then one must show that to be the case and not just assume it.
“Does a warm atmosphere immediately above water result in that water warming up?
Obviously yes. ”
Actually it is yes AND no.
The heat in the warm atmosphere is in the form of sensible heat which shows up on sensors. That gets absorbed by the top few microns of the water surface. That then brings forward the timing of evaporation for all the molecules that accept such extra sensible heat. Then when evaporation takes place more energy is taken from the local environment in latent form (which does not show up on sensors) than was required in the form of sensible heat to bring forward the evapoporative event and that sequence of events results in a net cooling effect as far as any available sensors are concerned.
The energy is conserved but is changed from sensible to latent form then whisked away by convection and wind.
Thus nothing left over for downward conduction. There should in fact be an acceleration of cooling. The more wind and convection the faster the process and the greater the net cooling of the water surface.
There is much discussion of ocean heat and sea temperatures, surface or otherwise, which apparently assumes that the only factors at play are surface solar heating and evaporation.
However there is another factor – downwelling of very cold water at the far north Atlantic and Southern Ocean east of Australia, drives the thermohaline deep global circulation by pumping cold water to the ocean bottom. There is scope for variations in solar, cloud, Arctic / Antarctic temperatures and other climatic variations to influence this downwelling and thus ultimately the oceans thermal budget.
This downwelling – and its converse, deep water upwelling, are a system that can provide variation over decadal and century timescales in ocean heat and temperatures. By contrast, effects of insolation and cloud etc. affect the sea surface in real time.
Agreed, phlogiston which is why another part of my hypothesis involves the subduction and re emergence of extra energy into and out of the thermohaline circulation during periods of a more active or less active sun.
In fact that is the best explanation I currently have for a relatively monotonic CO2 change despite all the other variations in climate that seem to have little or no effect on short timescales.
Steve is it not logical that in addition to any slight speed up of the hydrologic cycle through phase change evaporative process, the fact is that when CO2 or water vapor increases in the atmosphere, the spectrem of TSI which reaches the ocean surface changes to an increased quantity of IR, and a decreased quantity of SW? Does it not then follows that the residence time of energy entering the ocean is reduced greatly compared to periods of more SW radiation and less IR during periods of decreased CO2 and or water vapor? Is not the residence time of all spectrems of TSI in earths budget far greater in the oceans, thus any change in TSI wavelength the ocean effect over time will overwhelm what happens in the atmosphere?
phlogiston says:
November 4, 2010 at 1:40 am
“… By contrast, effects of insolation and cloud etc. affect the sea surface in real time.”
Please see my questions above and respond if you wish. Would not any relative increase in LWIR and decrease in SW have, over time, a cooling effect on these large downwelling and upwelling currents?
Another example of the seasonal cycle.
In the centre of North America, the climate is coldest around January 25th. Effectively, the climate contains an average 240 Watts/m2 of energy in it (which results in a mean temperature of -18C).
Starting the next day, the climate begins to accumulate about 1.0 Watt/m2/day and is slowly warming up. By July 25th, the climate has reached an average 410 Watts/m2 (+19C).
Starting the next day, the climate begins to cycle down again and loses about the same 1.0 Watt/m2/day.
This seasonal change represents a huge change in the energy levels existing in the climate system (+/- 170 W/m2).
Water is not going to swing so much but it is also going to exhibit these huge swings in the level of energy contained in it. Its seasonal cycle will lag behind the atmosphere and even further off-cycle from the solar radiation cycle (almost one-quarter).
So, water is accumulating huge amounts of energy for six months and then dissipating huge amounts of energy for six months. For 70 days after the solar radiation peak, water is absorbing something like 0.5 watts/m2/day from somewhere.
It is obviously absorbing both short-wave solar radiation and long-wave thermal radiation (either directly or through collision with atmospheric molecules). And the numbers are really big.
David:
Humidity and optical depth do not seem to change much. Only cloud quantities and albedo seem to change and small albedo changes have a large effect on the Wm2 coming into the system.
Shortwave tends to penetrate clouds more as the energy of the photons increases and LWIR does not get into the oceans at all because it doesn’t get past the region involved in evaporation so I don’t think your proposal constitutes a significant factor as compared to the natural cloudiness and albedo changes.
What matters is the total amount of solar shortwave getting past the evaporative layer and that varies according to the level of solar activity due to changes both in the spectrum of solar output and the movement of the clouds latitudinally.
If increasing the downward LWIR radiant energy creates a net cooling of the oceans through increased evaporation, then the reverse must also be true — decreasing downward LWIR would warm the oceans.
Suppose I could temporarily reduce GHG’s so that the downward LWIR decreased by 80 W/m^2 (approximately a 25% reduction in energy). For this to warm the oceans, I would have to reduce the evaporation energy loss by more than 80 W/m^2. But 80 W/m^2 happens to be (approximately) the total energy carried away by evaporation, so I would have to stop (approximately) all evaporation. To stop all evaporation, I would pretty much have to freeze the surface. So following your logic, I have come to the conclusion that decreased LWIR will warm the surface of the ocean all the way down to freezing!
*************************************
Increasing the LWIR will increase the evaporation and increase the cooling – we agree on that. I simply disagree that the increased cooling due to increased evaporation will be greater than the change in LWIR energy that drives the change in evaporation. if the water actually cooled, then the evaporation would decrease and the water would rewarm.
Or put another way, I believe that adding extra LWIR energy to the surface at some rate Q leads to a (slightly smaller) increased evaporative cooling of (Q – Δ), for a net increase of Δ in total power to the surface. This small net increase in power will slowly warm the surface — which will then warm the water below, warm the air above, and/or increase the LWIR up from the surface until that extra Δ of energy can be balanced but other outflows of energy).
Tim,
Why should the evaporative process leave any ‘unused’ energy in the local environment after the net cooling effect has taken place.
Do you deny that evaporation is a net cooling effect ?
Bizarre outcomes such as a huge input of IR freezing the ocean surface do not happen because the evaporative process takes the energy it needs from the most readily available source which means both air and water combined but nonethelss evaporation gives a net cooling in the local environment and the more evaporation the more cooling.
Stephen Wilde says:
November 4, 2010 at 8:10 am
Tim,
Why should the evaporative process leave any ‘unused’ energy in the local environment after the net cooling effect has taken place.
Do you deny that evaporation is a net cooling effect ?
It’s an illogical statement. Additional LWIR hitting the surface of the ocean which is already in equilibrium will raise the temperature of the surface to a new value at which all the following are balanced with the increased flux: additional conduction and convection to the air above the surface and to the water below, latent heat loss accompanying evaporation (exp(∆T)) and LWIR radiation from the surface (∆T^4). The temperature of the surface must increase.
Stephen Wilde says:
November 4, 2010 at 5:55 am
” Shortwave tends to penetrate clouds more as the energy of the photons increases and LWIR does not get into the oceans at all because it doesn’t get past the region involved in evaporation so I don’t think your proposal constitutes a significant factor as compared to the natural cloudiness and albedo changes.”
?? That to some degree is my proposal; from George E Smith, “then the actual ground level (air Mass once) spectrum; that shows the amounts of that energy taken out by primarily O2, O3, and H2O, in the case of H2O which absorbs in the visible and near IR perhaps 20% of the total solar energy is capture by water VAPOR (clear sky) clouds are an additionqal loss over and above that…So your (referring to a comment Tim made) characterization of the H2O vapor “blockage” as being “tiny”; is simply not an accurate depiction; it is one of the largest solar spectrum modifications caused by the atmosphere. Solar spectrum energy mostly goes deep into the oceans which reflect only2-3% of sunlight; and the part of the earth which is mostly oceans is in the tropics where most of the solar energy arrives…True; that absorption by the the H2O in the atmosphere does warm the atmosphere; in fact it is one of the major warming influences; and that results in long wave Ir radiation in an isotropic pattern so only half of that radiative LWIR energy comes down to the surface. The other half goes upwards to space; so there is a net energy loss to the surface of about 1/2 of the amount that H2O vapor absorbs from the solar input. Reducing the total amount of solar energy that reaches the earth surface ALWAYS results in it getting cooler”
So, trying to reword my statement I am postulating that as some of the incoming TSI is converted to LWIR by increased CO2, and 1/2 of that continues downward resulting in evarporative cooling, not entering the ocean, and as this additional evaporation results in increasing water vapor and possibly clouds there is then less SWR at the surface, as some of the incoming TSI was converted to LWIR and therefore the amount of SWR entering the oceans is decreased, which works in harmony with the LWIR in that both cool the ocean, one at the surface, one to depths of up to 300m, the reduced SWR results in less energy into the oceans where the residence time is far longer then the LWIR , so the one works to cool the surface, and at the same time there is less photons entering the ocean where the residence time is far longer.
Once more to be clear and then I will give up until my ability to communicate is increased. More water vapor and CO2 must increase the residence time of TSI in the atmosphere, this must result in a spectral change of less SWR entering the ocean below the surface and increased LWIR at the surface. The reduced SWR results in a small but, cumultive over time, cooling of the ocean below the surface, the increased LWIR does not warm the ocean at all do to the evaporative cooling at the surface, thus the conversion of incoming TSI to less SWR and more LWIR increases the time each photon of energy spends in the atmosphere, but dereases the number of SWR photons entering the ocean where the residence time in the earths heat budget is far longer.
Thank you for your time, if this does not make sense tell me why so I can evaluate it.
>the more evaporation the more cooling.
Let me expand on this, because this get to the crux of the matter (as I see it).
1) The more net energy into the surface layer of the ocean, the higher the temperature of the surface layer.
2) The higher the temperature of the surface layer, the more evaporation.
3) The more evaporation, the more
coolingenergy that leaves the surface layer.Line 1 is a simple statement of conservation and I really don’t see any way to argue against that. Line 3 is your statement is a refinement of your statement, so I don’t expect you will argue with it too much. If evaporation removes more energy that is being added in other ways, then the surface layer will cool. If other energy inputs are larger than evaporation, then evaporation can slow the warming that would otherwise occur if there were no evaporation.
Perhaps you can find a flaw with line 2 …
Now consider my “control” square meter of ocean. Suppose for simplicity assume it is mid-afternoon and the temperature of the surface is steady at 15 C (so net energy flow into the layer is zero) . Evaporation rates are steady and depend on this temperature (and on other factors like humidity and wind). Lets suppose this number is 80 W/m^2. That means that other factors must be adding a net 80 W/m^2 to the surface layer.
My “test” square meter is identical — 80 W/m^ of evaporative cooling and 80 W/m^2 of other heating. Then I increase the energy into the top layer of the water – say 1 W/m^2. Following the steps 1-3 above, the increasing temperature will increase the evaporation. The temperature will continue rising until at some surface temperature higher than we started, the evaporation will have increased enough to counteract the extra energy – evaporation would provide 81 W/m^2 of energy transfer out. This “prevents any further warming” from the extra energy but (step 2) the water must be warmer than it started. So the extra evaporation is providing a cooling effect against further increases but it does not cool the water below the point it started.
ANY source of energy into that top layer – LWIR, contact with warm air, a heater under the surface — will lead to steps 1-3 above. Evaporation can limit the warming from extra LWIR, but it won’t actually reduce the temperature below where it started.
P.S. I actually over-simplified a bit – the warming of the surface layer will not only increase the evaporative cooling, it will also increase LWIR cooling and conductive cooling. I should really have said “The temperature will continue rising slowly until at some surface temperature higher than we started, the evaporation and LWIR and conduction and convection will have increased enough to counteract the extra energy.” This will limit the rise in temperature even more — but it is still definitely a rise.
Sorry for the long post Steve, are you simply saying that there is very little, or no change in the amount of SWR hitting the ocean surface regardless of water vapor or CO2 changes, but what I am saying would be true with increased cloud cover and albedo changes?
Tim Folkerts says:
November 4, 2010 at 12:28 pm
P.S. I actually over-simplified a bit – the warming of the surface layer will not only increase the evaporative cooling, it will also increase LWIR cooling and conductive cooling. I should really have said “The temperature will continue rising slowly until at some surface temperature higher than we started, the evaporation and LWIR and conduction and convection will have increased enough to counteract the extra energy.” This will limit the rise in temperature even more — but it is still definitely a rise.
I was about to pitch in until I saw the PS! Exactly right, you have to do a total energy balance on the surface layer taking into account all modes of energy transfer (as I posted a few posts up). If the layer doesn’t get warmer there will be no additional evaporation.
Phil,
I only saw your post after I had entered mine — it seems we are both on the same track.
Hopefully those on the side of the counter-arguments are starting to see our simple main point. Their argument seems to have some variation of Maxwell’s Demon whereby LWIR energy ONLY goes into molecules that will evaporate. In fact, the demon would have to be perverse enough that when LWIR comes in, that energy AND MORE is given to evaporating water molecules!
Evaporation has a net cooling effect.
The latent energy taken out of the local environment to achieve the change of state from liquid to vapour exceeds the sensible energy required to achieve the change of state.
It is quite true that the affected molecules briefly get warmer but all that achieves is an acceleration of the timing of the change of state and as soon as the change of state occurs that sensible energy (and more) disappears into latent energy.
How then can there be any energy left to achieve warming of anything ?
The LWIR must only be absorbed by molecules that will evaporate because it never gets past the evaporative layer and so does not encounter any molecules that do not eventually evaporate. Every molecule impacted by those LWIR photons has the timing of its evaporation brought forward.
Can you show that ANY molecules acquiring extra LWIR fail to evaporate ?
I am open to evidence on the issue but my logic is not faulty.
David, I see the point but am not convinced as regards the scale of the effect as compared to the effect of shifting all the globe’s climate bands and therefore cloud bands bodily poleward or equatorward.
Such latitudinal shifting has a significant effect on albedo and albedo changes have a large effect on WM2 entering the oceans from solar shortwave.
Two things happen when the clouds are shifted latitudinally:
i) If the cloud bands shift equatorward then the increasing circumference of the globe stretches out all the air mass boundaries over longer distances with increased opportunity for air mass mixing and generation of more clouds.
ii) As clouds move equatorward they protect the surfaces below from more intense insolation so more reflection occurs.
Thus do latitudinal shifts affect albedo significantly and the Earthshine project confirms that global albedo and cloud quantities both started to rise in the late 90s when I aver that the jets began to shift more equatorward.
If you can put your proposed effect into that context I can consider it further. Is your effect significant in the face of those other forcing effects ?
Thanks Stephen,
I definetly do not have the numbers to quantify the effect I am considering. My thought is rather simple in that all clouds have an albedo effect. The pro AGW thought is that some clouds warm, some cool, some are neutral, depending I suppose on the relative changes in LWIR and SW which reach the surface.
My thought is that not all photons are equall due to their relative residence time in earth’s system, both ocean and amotsphere. So a cloud that blocks 5 W/m’2 of SWR through albedo, but has a 15 W/m’2 warming effect through the GHG effect will warm the atmosphere, but do to the far longer residence time of SWR photons entering the ocean the reduction of those 5 W/m’2 reduced SWR will have a stronger long term effect which is cumlitive depending on the duration of the change in cloud cover and certainly as you say their laditude, which as they shift poleward obviously effects an evergreater % of the TSI.
I definetly do not have the numbers to quantify the effect I am considering, primarily because I do not know the residence time of SWR photons entering the ocean vs the residence time of LWIR in the atmosphere.
Tim, may I ask why you are certain the extra energy is not used in simply speeding the hydrolic cycle? Is it possible for this to be tested by an actual experiment?
David, the additional LWIR photons do not hang around for long at all as you say. They are soon absorbed by water when it changes to latent heat in water vapour and are whisked away upward by convection and wind.
The additional SW stays in the ocean possibly throughout the length of the thermohaline circulation (up to 1500 years) so on balance I’d say that anything that restricts SW uptake by the oceans is going to have a far bigger long term effect than anything that alters IR quantities.
The biggest effect on SW entering the oceans appears to be albedo changes. Changes in CO2 or GHGs generally only affect IR and so are largely irrelevant as far as I can tell. The sea surfaces will not allow the air temperaure to diverge from those SSTs . As soon as the air temperaure does try to diverge all that happens is a change in the speed of the hydrological cycle for little or no change in surface air temperature because the excess energy in the air just gets converted to latent heat and is whisked away faster by convection and wind.
I’ve not found any convincing mechanism whereby significant amounts of extra IR in the air could ever get into the oceans. If it doesn’t get into the oceans it cannot affect the Earth’s equilibrium temperature because the oceans are in absolute control.
david says:
November 4, 2010 at 5:22 am
phlogiston says:
November 4, 2010 at 1:40 am
“… By contrast, effects of insolation and cloud etc. affect the sea surface in real time.”
Please see my questions above and respond if you wish. Would not any relative increase in LWIR and decrease in SW have, over time, a cooling effect on these large downwelling and upwelling currents?
Indeed yes. I regret I haven’t had time to study the whole thread and your earlier comments. But the changes you describe in LWIR and SW, under the influence of atmospheric / solar parameters, can indeed exert an effect on downwelling. Since downwelling is the impetus behind the THC with a cycle timescale of centuries, this scenario provides a mechanism by which climatic variations can leave an oceanic-THC “legacy” which can re-surface later as ocean driven climate variation on a decadal-century timescale.
Also as I have mentioned before in conversation with Stephen Wilde, it is not (in my view) a question of the temperature of water that is downwelled. Water downwells to the ocean floor due to low temperature and high salinity from ice formation in places like the Norwegian sea (although there may be limited scope for temperature variation). But volume of downwelling and variations thereof is likely the key factor. But the mechanism by which this might manifest itself in the long term is unknown – it might represent periodic forcing of a non-equilibrium quasi-chaotic system that could result in emergent periodicities generated by the system.
Stephen Wilde says:
November 4, 2010 at 11:40 pm
I am open to evidence on the issue but my logic is not faulty.
It certainly is, but it’s clear that it’s a waste of time explaining the science to you.
Stephen Wilde says:
November 4, 2010 at 4:22 am
Agreed, phlogiston which is why another part of my hypothesis involves the subduction and re emergence of extra energy into and out of the thermohaline circulation during periods of a more active or less active sun.
In fact that is the best explanation I currently have for a relatively monotonic CO2 change despite all the other variations in climate that seem to have little or no effect on short timescales.
It should be possible to observe bubbles of CO2 escaping from cold deep ocean water when it moves to the surface and warms – I wonder if anyone has looked for these?
Steven,
Three last points …
1) “The LWIR must only be absorbed by molecules that will evaporate because it never gets past the evaporative layer …”
The LWIR penetrates tens of micrometers. Water molecules are tenths of nanometers –> LWIR penetrates ten of thousands of molecules deep. That means that the water molecules that absorb the LWIR will run into MANY other molecules before then might evaporate. The extra energy will be redistributed by collisions with other molecules, so the extra energy is distributed pretty much evenly to all the water in the top layer pretty quickly. This provides a distributed energy to the top layer, not some specialized energy to select molecules.
2) in the end, you are saying “by adding more energy to the water, the water is getting cooler”. This is a pretty extraordinary claim that on the face of it seem to contradict conservation of energy
3) This website is all about skepticism. As far as I can tell, you are about the only one really pushing this idea. From the perspective of a neutral skeptic, I tend to doubt that you are right and generations of climate scientists, physicist, chemists, and chemical engineers are wrong. Can you convince me that you have a new, correct perspective on a branch of science that dates back over a century?
I can’t resist one more set of thought experiments. You have three identical, perfectly insulated tanks of water at 20C. Part of the water in each tank (1 mole = 18 g) evaporates, which would remove approximately 44,000 J of energy (http://en.wikipedia.org/wiki/Enthalpy_of_vaporization).
Tank 1: Nothing else is done. The water left in the tank will be cooler than 20 C. I would use Q = mc(deltaT) to calculate the temperature drop of the remaining water, where Q = 44,000 J, m is the mass of the remaining water, and c is the heat capacity of water. Do you agree?
Tank 2: I add an electric heater to the water which adds 44,000 J of energy to the water as the 1 mole evaporates. The final temperature will be 20 C because the net energy is zero. Do you agree?
Tank 3: I add a heat lamp shining LWIR into the water which adds 44,000 J of energy to the water as the 1 mole evaporates. The temperature will remain at 20 C because the net energy is zero. Do you agree?
P.S. Please don’t come back with “evaporation is a net cooling effect” unless you are ready to explain what you mean in terms of energy, enthalpy, and temperature in any of the examples I have given.
david says: November 5, 2010 at 4:42 am
Tim, may I ask why you are certain the extra energy is not used in simply speeding the hydrolic cycle? Is it possible for this to be tested by an actual experiment?
Actually, I suspect much of the extra energy would indeed go into speeding up the evaporation from the ocean. But how do you increase evaporation? You warm the surface (or change the humidity and/or wind).
The one thing I am sure of is that a given square meter of ocean will be WARMER (not colder) if extra energy in any form (including LWIR) is added to the water compared to a similar square meter without that extra energy input.
Tim, I’ll have a go at your further questions but then we must give it a rest 🙂
i) All those tens of thousands of molecules are within the layer involved in evaporation. Each molecule acquiring energy from incoming IR does warm but in doing so moves closer to the moment of evaporation. Every such molecule does indeed redistribute energy by the means you say before it evaporates but then every one of those other molecules moves closer to the moment of evaporation. Eventually ALL those molecules DO evaporate and furthermore they do so earlier than they otherwise would have done and every time one does evaporate it converts more energy into latent form than the amount of sensible energy required to provoke the evaporation. Thus your description does not overcome the problem. There is no IR left to propogate downwards.
ii) No. I am saying that there is a net cooling process in the local environment. The evaporation takes the energy from where it is most readily available. When the water gets down to the temperature of the air above any shortfall is just as likely to come from the air or from some of the IR not yet absorbed by water molecules. The entire local environment cools, not just the water surface. I already explained that that is why a huge amount of IR cannot result in a bizarre outcome such as freezing the water surface.
iii) My account used to be well known when I was educated. The knowledge has been lost or ignored over the past 50 years in climatology. I am saying nothing new. The characteristics of evaporation and the other phase changes of water are indeed remarkable and surprising. It has always been thus. It is not I who is out of line.
If you apply the above properly you can sort out the consequences for your own thought experiment.
LWIR does not warm a body of water significantly if at all.
“The one thing I am sure of is that a given square meter of ocean will be WARMER (not colder) if extra energy in any form (including LWIR) is added to the water compared to a similar square meter without that extra energy input.”
Only the molecules in the evaporative layer become any warmer and that is only temporary for each molecule because the timing of the moment of evaporation is brought forward for a subsequent net excess of cooling in the local environment for the reason I explained. Nothing propogates downward but there may be an increase in energy pulled upward towards that warmed layer. Otherwise we could not observe that 0.3C cooler layer above the ocean bulk. The presence of that thin cooled layer is the proof.
I think we may have to agree to disagree.
We both agree that evaporation is a cooling process. The principle of “swamp coolers” is well known and well used in many hot, dry climates; sweating does cool us down.
We seem to agree that adding more LWIR will accelerate the evaporation and hence increase the rate that energy is removed.
* I conclude the elevated evaporation (and elevated upward LWIR and elevated conduction to air and water) reduces the warming, but that there is still a net warming from the net increase in energy.
* You conclude … that the evaporative cooling takes away ALL the extra LWIR energy AND then some extra energy on top of that to make the water even cooler than it would be with less energy input? So that the water on the surface has gotten cooler AND evaporates more?
There doesn’t seem to be much point in further discussion — we seem set in our respective views. For my own edification, I may have to run this whole idea past some learned friends and see what they think (but I suspect I know their response).
http://www.physlink.com/education/askexperts/ae93.cfm
“The energy required to completely separate the molecules, moving from liquid to gas, is much greater that if you were just to reduce their separation, solid to liquid. Hence the reason why the latent heat of vaporization is greater that the latent heat of fusion.”
and:
http://daphne.palomar.edu/jthorngren/latent.htm
“Evaporation is the change of state from liquid to vapor. In the process of evaporation, the molecule absorbs energy. This energy is latent heat. Latent means hidden, so latent heat is “hidden” in the water molecule–we can’t feel it, but it is there. Wherever that individual molecule of water vapor goes, it takes that latent heat with it. ”
The science of the phase changes of water is long settled but climatology chooses to ignore it.
“The science of the phase changes of water is long settled but climatology chooses to ignore it.”
Or, just maybe, you choose to ignore that the combined knowledge of 1000’s of scientist might be greater than your knowledge.
For instance, the iconic energy balance diagram (seen many places on the web like here http://stephenschneider.stanford.edu/Graphics/EarthsEnergyBalance.png) includes evaporation. A 10 minute “back of the envelope” exercise by me confirmed that 78 W/m^2 is a reasonable number. (You can do it yourself – google the # of cm of water that evaporate from the oceans, the surface area of the ocean, and the enthalpy of vaporization for water. ) Clearly evaporation was included there, and I doubt that climate scientists have forgotten either the science of evaporation or the importance of evaporation since Kiehl and Trenberth published this graphic in 1997.
P.S. I don’t disagree with anything you cited November 6, 2010 at 1:40 am. I just don’t think either of those points supports your conclusion that heating water with extra LWIR makes the water cooler rather than warmer.
” Clearly evaporation was included there,”
Of course it is but there is no provision for variability over time.
“I just don’t think either of those points supports your conclusion that heating water with extra LWIR makes the water cooler rather than warmer.”
It doesn’t make the water cooler than the air above because energy is taken from where it is most readily available. However it does try to extract energy from the water faster and in doing so it will increase the depth or intensity of that 0.3C cooler layer on the ocean surface.