
Guest post by Dr. Walt Meier
Now that the summer is over, I thought people might be interested in a bit of retrospective of the sea ice melt season in 2010 and in the longer-term context. NSIDC provided a brief recap and the SEARCH Sea Ice Outlook will soon have their own recap. However, I can explain in a bit more detail and directly address some issues that arose here over the summer.
First, I thank Anthony for this opportunity and him and Steve for their frequent posts this summer, and for the handy sea ice reference page. It is nice to see climate and sea ice issues brought to an audience that might otherwise not hear about them. I hope the information will bring further clarity to some sea ice and polar climate processes. Some of the issues below, I at least touched on earlier this summer in posts here and here. As usual, I’m speaking for myself and not as a representative of the National Snow and Ice Data Center (NSDIC) or the University of Colorado.
Recap of summer predictions
I will start with a discussion of the prognostications from earlier this spring. In the June SEARCH Sea Ice Outlook there was fairly broad range of estimates, from 4.2 to 5.7 million square kilometers. If I remember correctly, Steve and Anthony’s estimates were 5.5 and 5.1 million square kilometers respectively. NSIDC’s initial estimate in June was 5.5 million square kilometers.
The first thing to point out is that none of the estimates approached the 1979-2000 monthly September average of 7.0 million square kilometers. Even the highest estimates were nearly 20% lower. This is a recognition that conditions have clearly changed since the 1980s and 1990s. It is no longer plausible to prognosticate anything near average levels. (For those who are curious, the 1979-2010 average, which of course includes the recent very low years, is 6.58 million square kilometers. Only one outlook (5.7 by Tivy) was within 1 million square kilometers of that value.)
NSIDC’s June estimate was too high compared to what actually happened. This is not at all surprising to me. We used a method that relies on past survival rates of ice of different ages. However, conditions have changed with the Arctic sea ice – the ice overall is thinner and less consolidated. Predictions based on past behavior are less likely to be valid. In other words, the odds of have changed. Steve’s prediction was based on a similar premise – the apparent similarity between winter 2006 and 2010 ice thickness patterns in the PIPS model.
Over the summer there was discussion ascribing the lower than predicted minimum extent primarily to ice motion. Ice motion indeed plays a role in the seasonal evolution of the ice cover as well as the interannual variation in the multiyear ice cover. However, to ascribe all or even the majority of sea ice changes to ice motion is simply wrong. As I discussed in my post earlier this summer, even in an extreme year like 2007, only a third of the extreme loss was due to anomalous ice motion. Over longer time scales, it has been shown that the Arctic Oscillation influences how much multiyear ice (MYI – ice that has survived at least one summer melt season) stays in the Arctic vs. how much leaves the Arctic over the winter, which in turn affects how much ice remains at the end of summer. For example, over the past winter, we had an extreme negative AO, which kept a lot of MYI in the central Arctic.
This summer was not particularly extreme in terms of ice motion. There were times during the summer where the ice pack was pushed together in some places, while at other times the motion was not a factor or even pushed the ice edge outward.
The importance of bottom and lateral melt
One factor that wasn’t discussed much is melt at the bottom and sides of the ice. This melt depends on the ocean temperatures. During summer when ice melts and open water is exposed, the ocean warms. The ocean accumulates heat which can then melt the ice, both along the edges (lateral melt) of the ice and on the bottom of the ice as currents move the warmer water under the ice and/or the ice is pushed over warmer water by winds. Most of the late season ice melt is due to lateral and bottom melt because the surface has cooled with the setting sun. This explains why even when the DMI air temperatures commonly discussed in the WUWT Sea Ice News, go below freezing around mid-August, there is still another month left in the melt season and extent continues to decline at least a few hundred thousand more square kilometers after mid-August. This year ocean temperatures were not as extreme as the past few summers, but there was still a considerable amount of ocean heat available to melt sea ice.
The bottom line is that while winds can make a difference at times, the overriding factor in seasonal and long-term Arctic sea ice decline is that warmer temperatures lead to less ice.
Why forecasts were too high
The biggest change in the ice over the past several years is that the ice is thinner overall than it used to be and there is less of the thicker, older ice. Another thing is that the old ice that remains is less consolidated – scattered floes of old ice with thinner, younger ice in between instead of tightly packed together. These factors affect the seasonal evolution of the summer sea ice in two ways. First, when the thicker, older ice is in broken up floes, it is more easily “attacked” on all sides by the ocean heat and can potentially be melted completely. Second, the less consolidated ice is more easily pushed around by the ice and more susceptible to winds pushing the ice together – in other words, the effect of the wind is amplified.
I think this is a major reason why a lot of the forecasts were too high. The tongue of mostly MYI in the Beaufort Sea completely melted out. In 2006, there was enough thick and consolidated ice to be vanguard against further ice loss, but by 2010 it was thinner and less consolidated and melted completely (Figure 1). This can be seen clearly in the ice age animation for the past year (Figure 2). The nice thing about these fields is that they show the effect of both motion and melt. If the extent decline were primarily motion, we would simply see the MYI in the Beaufort and Chukchi Seas get pushed together. Instead however, we see the older ice disappear over the summer, i.e., it melts (Figure 2).

Figure 1. Arctic sea ice age during March (left) and September (right) for 2006 (top) and 2010 (bottom). The color key denotes the age of ice (a value of “1” means first-year ice or ice that is 0-1 year old, etc.). Thanks to C. Fowler, Univ. of Colorado, for providing images.

Figure 2. Animation of sea ice age from September 2009 through September 2010. The color key denotes the age of ice (a value of “1” means first-year ice or ice that is 0-1 year old, etc.). The number in the lower right corner denotes the week of the year (1-52). Thanks to C. Fowler, Univ. of Colorado, for providing animation.
After the past couple of summers, there has been a build-up of young MYI – ice between 1 and 3 years old. It had been thought that this MYI would “buffer” the summer ice loss and keep extents from dropping too low. However, watch the animation (Figure 2) closely and see that the 3rd year ice (ice that is 2-3 years old, in green), dispersed and melted or exited out of the Arctic through the winter-spring of 2009-2010. So there was very little replenishment of the older ice. A lot of the 2nd year ice remained at the end of this summer, which has now aged into 3rd year ice. So maybe there’s hope for next year, but what we’re seeing is that the MYI just is not surviving like it used to. There is now almost no ice older than 4 years old remaining in the Arctic. This is a stark and fundamental change in the character of the Arctic sea ice.
PIPS vs. PIOMAS revisited
There was a lot of discussion earlier this year on the PIPS model sea ice fields vs. the PIOMAS model fields (e.g., here). At the beginning of the melt season, PIPS showed quite a bit of thick (3-4 m) ice throughout much of the Arctic Ocean, which wouldn’t be expected to melt completely. This portended less loss of ice during the summer. However, the PIPS fields did not agree well with the ice age fields, which showed less thick ice and a more dispersed multiyear ice cover. As it turned out, I think the PIPS were indeed to too thick, resulting in a forecast that was too high.
On the other hand, the PIOMAS total volume anomaly estimates were quite low going into the summer, indicating thinner ice and suggesting a low extent was likely. As I said previously, the volume seemed to me to be too low. Indeed, the PIOMAS forecast was lower than the actual minimum, though in the end it didn’t do a half-bad job in its prediction (4.7 predicted vs. 4.9 actual, in millions of sq km). To be sure, some of this could be attributed to luck, because there is always the wildcard of what the weather will do over the summer. Regardless, it is clear from the ice age, other ice thickness observations, and the overall state of the ice cover that volume is at or near record lows compared to at least the past 30 years. So while PIOMAS may be biased too low on ice volume, it captures the overall thinning trend and seems to better represent the actual state of the ice cover than PIPS.
Pre-satellite records of sea ice
Whenever I talk about “long-term” trends, I always see comments about how NSIDC’s data are only a 32 year record and hardly constitute “long-term” in the big picture of climate. This is a fair point. However unfortunate though it may be, that is all the data we have, at least in terms of a consistent and complete record. We have some data from earlier decades, but these are incomplete. For example, there was post earlier this week (October 16) about a recent book on longer-term sea ice changes in the 20th century. I read through this book earlier this year, so I’m familiar with it. As the title (“Climate Change in the Eurasian Arctic Shelf Seas”) states, the book analyzes data only the Russian shelf regions of the Arctic – it doesn’t include the central Arctic or U.S./Canadian Arctic, where a significant portion of the decline has occurred over the past decades. Their conclusions are drawn from data through only 2003, so with the recent low years since then, the observed patterns of variability may no longer hold. (There is a final section in the book on 2003-2008 sea ice conditions, but these data are discussed independently and are not incorporated to update their analyses earlier in the book.)
The book only superficially examines ice thickness changes (again only in the Russian shelf regions) and does not examine the recent thickness data from ICESat or the ice age fields. Finally, as it states in conclusion #2: “These cyclic oscillations of sea ice extent were superimposed on the background consisting of a negative long-term linear trend that characterizes gradual decrease of sea ice extent during the 20th century and the beginning of the 21st century.” In other words, even in the Russian data, there is a decline. The authors suggest this decline could be indicative of a longer cycle, but admit that such a conclusion can only be “conjectured”.
So while the book provides useful data (Russian information is often difficult to obtain), their conclusions about reasons for the changes in overall Arctic sea ice and the state of sea ice in the coming decades are more limited than the book seems to suggest. Andy Mahoney (a former colleague of mine at NSIDC) and others also analyzed the Russian data in a paper published in 2008 (Mahoney et al., 2008 – a brief summary is here).
Paleo records of sea ice
Even 100 years is still a fairly short period of time in terms of the history of the earth. However, in terms of climate change, such a period of time is enough discern the influence of large-scale forcing such as anthropogenic greenhouse gases. Nonetheless, it is useful to have longer-term data to understand climate history, particularly in terms of how sensitive various aspects of the climate system, such as sea ice, are to changes in climate forcings. We can obtain some information about earlier sea ice from proxy records, but it gets even more difficult to draw conclusions about conditions Arctic-wide.
For example, there was a post on September 23 about a 2006 paper discussing a proxy record indicating more extensive sea ice now than most of the past 9000 years. However, the paper is about a single record from a single location. It is very difficult to generalize from one isolated observation. As I mentioned in a previous post, the most recent and comprehensive analysis of all available proxy sea ice records, published earlier this year (Polyak et al., 2010 – note that Polyak is a co-author on the 2006 paper), indicates that current total Arctic-wide sea ice extents are likely lower than any time in the last several thousand years and are “not explainable by known natural variabilities”. The data are still sparse, but this is the best information we have at the moment.
The Northwest Passage, Northern Sea Route, and Circumnavigation of the Arctic
Navigation in the Arctic during the summer always gets a lot of interest. People point out that recent sailing expeditions through the Northwest Passage and Northern Sea Route (along the Siberian coast) are not unique in history. This is true. Amundsen navigated through the NWP in 1903, the Canadian vessel St. Roche went through the NWP a couple times in the 1940s. In 1969, the ice-strengthened freighter, USS Manhattan went through with Canadian icebreaker support. There were a few others before 2000. Many required icebreaker support or needed more than one summer to complete the journey (Amundsen needed nearly three summers). The Northeast Passage has been used by the Russians as an icebreaker-supported shipping route for many years and several ships have made the voyage.
However, this doesn’t mean conditions in the past were anything like today. They were not. While conditions will vary from year-to-year and I think it will be some time before either passage (especially the NWP) will be a reliable route, both passages have been far more open in recent years than in the past. What used to be a risky proposition, carefully navigating through narrow openings between ice floes, has in recent years become a mostly open water cruise with occasional ice (though still dangerous because even relatively small scattered floes of ice can damage a vessel). This year two vessels circumnavigated the pole through the two passages within one summer. In addition, several other vessels went through at least one of the passages this year. This is really quite remarkable and something I doubt anyone in the 20th century ever thought would be possible in 2010.
(Some complained when these expeditions were called “circumnavigating the Arctic” or “circumnavigating the Arctic Ocean” because they went south of Greenland. To technically circumnavigate the Arctic Ocean, one would need to follow the coast along the north coast of Greenland. This is true, but it in no way diminishes the feats nor does it contradict the reality that the Arctic is very different place than it was just twenty or thirty years ago.)
Antarctic sea ice
During the past Arctic summer, the Antarctic winter sea ice was showing some interesting behavior. As the Arctic ice declined, Antarctic ice went to much higher than normal levels. This caused a bit of a stir. It seemed like the Antarctic was headed to a record-shattering maximum. Alas, this did not happen. The extent went back to down to normal. Now it is again above normal. Such variability is characteristic of the Antarctic, especially in winter. The entire circumference of the Antarctic continent is surrounded by sea ice. Most of the ice is less than 1 meter thick, and much of it is less than 0.5 meters, particularly near the ice edge. This means shifts in currents and winds can quite quickly shift the ice edge in or out. So fairly dramatic ups and downs in Antarctic sea ice extent are not uncommon.
Nonethless, over the satellite record there is a small upward trend in overall Antarctic sea ice extent. The magnitude of the trend is much smaller than the Arctic (1-4% per decade vs. 3-11% per decade, depending on the month). And when you look at the spatial trends, where the decline is occurring, you see an interesting difference. In the Arctic, there is decline in almost all regions throughout the entire year (the Bering Sea during winter being the lone exception). In the Antarctic, all months are characterized by variation in the trends – in one region there is an increasing trend in extent and in another region there is a decrease (Figure 3). This is a clue that a main driver is changing circulation patterns, and indeed the changes in Antarctic sea ice have been linked to changes in circulation from the Southern Annular Mode (SAM – kind of an Arctic Oscillation [AO] for the southern hemisphere), for example in Turner et al. (2010) (key points can be read here). Circulation changes affect the Arctic sea ice too of course, particularly the AO, but the impact is even greater in the Antarctic because the ice is so thin and the ice boundary is completely open throughout the year (as opposed to the Arctic where for much of the year most of the ice edge borders the coast).

Figure 3. Trends in Arctic (top) and Antarctic (bottom) sea ice for (from left to right): September, December, March, and June. Red shades mean an increasing trend of sea ice; blue shades mean a decreasing trend. Images from the NSIDC Sea Ice Index. Other months show similar patterns and can be viewed using the Sea Ice Index browse tool.
But why has the SAM changed? Some scientists have suggested that a possible mechanism is the ozone hole. The ozone hole changes circulation high in the atmosphere, which then changes circulation at the surface. It is a plausible theory, supported by some evidence (discussed for example in Turner et al., 2010), but still tentative. Recently, there was paper (Sigmond and Fyfe, 2010) that showed results of a modeling study where the ozone hole did not increase sea ice in their model as had been expected (discussed here). It is rare these days that a single paper provides a final answer, so while the results are intriguing, it could be that the model is not capturing all the physical processes (e.g., the details of the interaction between snow and sea ice discussed below); or it could be that the model results are correct and a new explanation is needed.
Another study that was mentioned this past summer, discussed here, was the paper by Liu and Curry (2010) on the seeming contradiction that warmer temperatures over the Antarctic Ocean can lead to more sea ice (at least for a while). This seems counterintuitive, especially in light of my comment about the Arctic sea ice and temperatures above.
The key is that the Antarctic and the Arctic sea ice regions are very different places. In the Arctic, we have a relatively shallow, semi-enclosed body of water. There is a lot of freshwater from rivers input into the surface of the ocean. This less saline water floats on the surface, while heavier and warmer water sits below – in other words the ocean is stratified. That heavier water has a lot of heat in it, but it is difficult for the heat to reach the ice. The waters in the Antarctic are not well-stratified and there is a lot of potential heat from the ocean that can melt ice.
Another difference is that because the Arctic Ocean is almost completely surrounded by land, there is not as much moisture available and snow fall is relatively low. In contrast, Antarctica is surrounded on all sides by an ocean. While the middle of the Antarctic continent is a desert (because moisture cannot reach the high altitudes inland), the coastal and sea ice regions actually receive a lot of snow.
The snow has two effects. First, when it falls into the open ocean, it serves to freshen (and hence stratify) the surface layers. Then the more stable ocean surface makes sea ice formation easier by keeping more ocean heat below the surface. Second, when it falls onto sea ice it accumulates on top and “weighs down” the sea ice. With Antarctic sea ice being on average much thinner than the Arctic, it is not uncommon for the weight of the snow to push the top surface of the ice below the water line. When this occurs, the snow gets flooded by the ocean waters, which then freeze and form what is called “snow ice”. Effectively, the snow is converted to ice and thickens the ice cover.
When the atmosphere is warmer, it can hold more moisture, which in the Southern Ocean will fall as snow. This increase in snowfall then leads to more sea ice growth. This potential effect has been long known to scientists, and Liu and Curry’s paper is evidence that supports this idea (with the same caveats above that this is just one paper). Thus, warmer temperatures can lead to more sea ice. At least up to a point. If, as expected, temperatures continue to warm over the Southern Ocean, eventually the direct effect of the warmer temperatures will overtake the indirect effect on sea ice via snow fall, and Antarctic sea ice will begin to decline.
Conclusion
Though I don’t have time to read nearly all of the posts here and even fewer of the comments, I am often impressed by the interest and passion expressed therein. I’m sure I haven’t answered all questions about sea ice here, but I hope I’ve addressed many things that people have been curious about, particularly issues that have come up over this past summer.
References
Liu, J., and J.A. Curry, 2010. Accelerated warming of the Southern Ocean its impacts on the hydrological cycle and sea ice, Proc. Nat’l Academies of Science, 107(34), 14987-14992, doi:10.1073/pnas.1003336107.
Mahoney, A.R., R.G. Barry, V. Smolyanitsky, and F. Fetterer, 2008. Observed sea ice extent in the Russian Arctic, 1933-2006, J. Geophysical Research, 113(C11005), doi:10.1029/2008JC004830.
Polyak, L., and 17 others, 2010. History of sea ice in the Arctic, Quaternary Science Rev., 29, 1757-1778, doi:10.1016/j.quascirev.2010.02.010.
Sigmond, M., and J. C. Fyfe (2010), Has the ozone hole contributed to increased Antarctic sea ice extent?, Geophys. Res. Lett., 37, L18502, doi:10.1029/2010GL044301.
Turner, J., R.A. Bindschadler, P. Convey, G. Di Prisco, E. Fahrbach, J. Gutt, D.A. Hodgson, P.A. Mayewski, and C.P. Summerhayes, 2010. Antarctic Climate Change and the Environment, Scientific Committee on Scientific Research (SCAR), ISBN 978-0-948277-22-1. http://www.scar.org/publications/occasionals/acce.html
Thank you Dr. Meier for the excellent information.
Dr. Meier,
That was fascinating reading. Thank you.
You really should read the comments on this thread , seeing that the southern oceans have not really wormed for much of the period of increased sea ice.
http://wattsupwiththat.com/2010/08/17/dr-curry-warms-the-southern-ocean/
please excuse the typo, warmed, not wormed.
Thank you for your review.
One comment about the Curry 2010, it was critisized for not using up-to-date data, i.e. stopping at 1999 in an already sparsely measure area. SST measurements in southern oceans since 1999 have shown a negative trend with no impact on the Antarctic Sea Ice positive trend.
There is no doubt that Watts Up With That is the premier climate blog in the world.
See B.T. analysis:
http://bobtisdale.blogspot.com/2010/08/on-liu-and-curry-2010-accelerated.html
Why do we continue to use 1979-2000 for averages comparator? Isn’t it 2010 now? How are we looking compared to a 1989-2010 moving average?
How are we looking compared with the running average 979-1000 when Erik, Thorvald and Thorstein and their families were living in Greenland and discovering N America further south? Wasn’t the running average ZERO in September then?
So compared to the Sept average of zero, today we have an infinite increase in sea ice in the Arctic ocean now. Infinite! Think about that. Brrrr!
Certainly this is easily supported by the NSIDC data, in fact I’d dare say it strikes me as obvious to anyone. You can just look at the plots and see the represented thicker ice break up each year and move around, get surrounded by thinner ice, rinse, repeat.
However when I look at the University of Illinois images, I see a different picture. I see ice thickening at minimum extent over the past few years (at least since 07), not thinning. Is there a reason for this discrepancy that you are aware of? Are the data collection methods to blame here? I’d really like to understand the differences and in understanding the differences gain an understanding of how best to apply each method. Please feel free to claim ignorance as I also claim ignorance on this. Thanks!
Good summary. Clearly illustrates how some simple science can be so badly distorted and abused by those with an overt political agenda.
My take away point is that you don’t have a clue if what is happening now is abnormal. As you admit, the record is very short and you don’t know if 1979 was a record high year, if it was a long term average year or what. And of course when you go to measure any vector, knowing the absolute position of your start point is crucial.
What has happened, because “your” reports are provided without this context is that all the hysterical greenie loving, carbon hating, fear mongering environmentalists have jumped on this ice extent reduction as “proof” of global warming when it is in fact, as you admit, proof of nothing.
While your science in isolation is wonderful, your lack of ability to provide suitable context has allowed your work to be overtly politicized and used by the environmentalists to distort the truth.
I think you have an obligation to provide the context of the short record, that you have no idea if this is good, bad, normal, abnormal . . . .
As an aside, I spent a couple of years in the early 70’s in the Arctic & High Arctic and had a job that allowed me to fly around from Alaska to Greenland and everywhere in between, back & forth, back & forth . . . and there was a hell of a lot of open water under our wings in summer time. Just anecdotal, but contextual nonetheless.
Nice job Walt, one thing that I noticed this summer was that PIPS tended to predict thick ice near the coastlines (N Svalbard, Euro/asian coast) when concentration was high when clearly if you looked at other sources that wasn’t the case (MODIS etc). It seemed to me that that led a problem with its mean thickness predictions. I notice in the recent seaice drift data that MYI is continuing to flow out of the Fram and also into the Beaufort sea:
http://i302.photobucket.com/albums/nn107/Sprintstar400/20101012-20101018.jpg
Any comments about the prolonged opening of the Nares strait this year?
Very interesting article. The main question is whether this variability that we are witnessing is natural.
As Professor Easterbrook points out (http://myweb.wwu.edu/dbunny/research/global/glopubs.htm) in his paper, temperatures in the 1930s in the Arctic and Greenland were warmer and rates of warming were higher, and during the MWP even higher still. So probably this variation is natural. Professor Easterbrook also points out the influence of solar variation on the arctic, so with a solar minimum well underway we should expect the recovery in the ice, that we have been witnessing in recent years, to continue.
“Even 100 years is still a fairly short period of time in terms of the history of the earth. However, in terms of climate change, such a period of time is enough discern the influence of large-scale forcing such as anthropogenic greenhouse gases.”
Pegged my BS meter. A) I don’t believe that for a second, and B) The further back you go from the 100 year history mark, the worse the clear data record becomes and the more prominent pseudoproxy data becomes, And pseudoproxy data becomes more pseudo than proxy as you retreat in time.
Interesting stuff. The whole process of refreezing and melting in the Arctic seems to be an even more chaotic process than I had previously imagined.
I would be curious to know if Dr. Meier has any opinions about the likelihood of an ice free summer up there in the near future. Are we witnessing a “death spiral” or are there so many variables that it is impossible to make anything other than a reasonably educated guess?
Unless I managed to miss it, I could not see any reference to soot particles and ice melt. Has this line of inquiry been discarded?
Hello Walt
Thank you for your update. Since NSIDC does not offer a Global Monthly Sea Ice Extent Anomalies Chart, like they do for the Northern Hemisphere;
http://nsidc.org/data/seaice_index/images/n_plot_hires.png
and Southern Hemisphere;
http://nsidc.org/data/seaice_index/images/s_plot_hires.png
I figured that I’d take a shot at it. I used NSIDC’s corresponding data;
ftp://sidads.colorado.edu/DATASETS/NOAA/G02135/Sep/N_09_area.txt
ftp://sidads.colorado.edu/DATASETS/NOAA/G02135/Sep/S_09_area.txt
and first recreated the NSIDC Northern and Southern Sea Ice Extent Anomalies Sept 2010 charts:
http://i54.tinypic.com/30uby9d.jpg
http://i53.tinypic.com/nbxfs6.jpg
to check the data and methodology. I then merged the two data sets and created a chart for Global Sea Ice Extent Anomalies Sept 2010:
http://oi55.tinypic.com/2lmq4qw.jpg
Based on my calculations, the slopes of the trendlines are as follows:
Northern Sea Ice Extent Anomalies Sept 2010: Slope = -11.3% per decade
Southern Sea Ice Extent Anomalies Sept 2010: Slope = 0.8% per decade
Global Sea Ice Extent Anomalies Sept 2010: Slope = -2.6% per decade
If you could check my math/methodology, it would be most appreciated. Also, I really think that NSIDC should add a Global Sea Ice Extent Anomaly chart to the right side of this page;
http://nsidc.org/data/seaice_index/
as it is useful information and offers a comparative perspective to the Global Sea Ice Area chart Cryoshpere Today offers:
http://arctic.atmos.uiuc.edu/cryosphere/IMAGES/global.daily.ice.area.withtrend.jpg
Thank you, Walt, for an interesting and informative post. I was disappointed to see no mention of Chryostat 2. Surely by this time next year we should have better data on comparative ice thickness on a year over year basis. Will this make us less reliant on things like PIPS and PIOMAS.
Central Antarctica does not evidence a warming trend. And if the world is significantly warmer, the seas would be the first indicator. Yet they seem to be temperature stable.
Thank you Dr. Meier for the informative post. Contributions such as yours are what make WUWT by far the best web site for climate information. I sincerely hope you don’t get the “Juan Williams” treatment for posting on the Dark Side.
Would it be a bad thing if Arctic sea ice disappeared every summer?
the overriding factor in seasonal and long-term Arctic sea ice decline is that warmer temperatures lead to less ice.
warmer water temperatures, you mean?
co2 warmed air is not melting the ice…and i don’t suppose co2 warmed air can be warming the ocean.
so i imagine some other mechanism besides co2 must be at work 😉
and i still fail to see anyone provide any evidence that none of this is natural.
It has all clearly happened before: just glancing at the gisp2 graph stuck on my wall i can see that in greenland it was 1.5C warmer 1 kya, 3C warmer 3.5 and 7 kya. And lets see, 130 kya…holy catastrophic global warming batman, is that 8C warmer than today?
This post by Dr. Meier is going into my reference archive for future study and sharing with others who don’t understand polar ice behavior. We thank Dr. Meier for this very educational article.
also meant to say thanks for the post Dr Meier!
Nice article. My only comment is re the ozone hole. I have seen papers where they indicate that eliminating the ozone hole would lead to more global warming; so you saying the ozone hole is still expanding, hence the the ability to sustain more ice in the Antartic? I thought that with the limit data we have on the ozone hole, there hasn’t been a significant changes in 40 some years of records.
What impact do Ice Breakers have on ice melt. I know it’s small in comparison to total area but as more and more research vessels enter the artic there must be an effect.
Thank you, Dr. Meier, for the usual calm, professional way in which you present a wealth of good information.
Any word on Cryosat-2 science data? I keep wondering when we’re going to get some science from them!
I wish Dr. Meyer would comment on reports that that there has been less artic ice over the past 6-7000 years than there is now. Certainly, this would preclude the discernment of anthropogenic forcings.
” Predictions based on past behavior are less likely to be valid.”
That oughta blow Tamino’s
” The best prediction is from past behaivor” theory.
Very interesting read. Thanks Dr. Meier.
No “out on a limb” predictions of the future, though. Very smart of you (:-
From the article: “What used to be a risky proposition, carefully navigating through narrow openings between ice floes, has in recent years become a mostly open water cruise with occasional ice…”
I stipulate the recent ease of passage has more to do with ships having satellite navigation displays that show real-time ice location and ship location. It was a LOT more difficult when the captain had no idea where the ice did and did not exist.
Dr. Meier I was surprised by your comment that the ice is quite different now comapred with 30 years ago. Well, yes it would be because 30 years ago it was at the bottom of a cold/expansion cycle. No one was sailing through the NWP 30 years ago, were they?
But 30 years previous to that, they were. My point is that if one wants the coverage to be balanced, one has to pick comparable points in the series. The Roche went through the NWP at the end of a dramatic warming period when well-informed people thought all the Arctic ice would soon be melted. It seems to me that we have had a repeat of that cycle.
I agree there is a long term melting trend. But it is very easy for sniping to hit a target if comparisons are made between low and high peaks of a cycle. Many otherwise reasonable posts are tackled here on this very basis and called alarmist because of obvious cherry-picking.
Compared with the vikings circumnavigating Greenland 1000 years ago, there does not seem much to be alarmed about. In fact I find your facts and your tone is not to be alarmist at all. Thank you for that.
Lowest summer extent in thousands of years. A Danish paper on the the wave action evidence on the north coast of Greenland (no link but within the past year) shows long continuous smooth curved ridges that would have required substantial waves requiring a good stretch of open water to develop. Paper showed the difference between the wave-made ridges and the irregular ridges gouged by ploughing ice. I don’t believe these ridges of unconsolidated sand would survive thousands of years of winds and meltwater erosion. However, if they did, it still means that we had a lower ice extent then than now.
Thanks for an interesting post.
I look forward to the release of the most recent Argo buoy data (with and without adjustments) which will show the warming ocean temp. trend which is melting ice and making the Arctic a very different place from 30 years ago.
Any comment on Arctic death spiral and other wild claims?
Thanks Dr Meier; a whole lot of information to digest, and try to understand.
Now some specific questions for you. Back in mid 2004, I made a statement to the effect that “when the floating sea ice melts; the heat required (80 cal/gm of latent heat) mostly comes out of the ocean,” which is in keeping with your observation regarding edge and bottom melting. I then went on to say that as a result, the sea ice melt resulted in the cooling of an enormous amount of previously warmer sea water, and the mean sea level (in those polar regions) must go down rather than stay level. This sugestion was published in a letter to Physics Today for Jan -2005; and was roundly pooh-poohed; and I won’t mention any names.
Subsequently in mid 2006, a British Dutch team reported on ten years of satellite measurements of the Arctic ocean sea level; and reported a drop of 2 mm per year; which they were confident of; but could not explain (hadn’t read my letter).
So question #1 would be, is this result they reported of 2 mm/yr Arctic Ocean drop still valid or are you aware of later contradictory work. And of course my conjecture supported the idea of a continuing Arctic sea ice loss.
Question #2 is, the annual cycle of Sea ice melt and refreeze (in the Arctic) is accompanied by a large exchange of salts between the saline sea water, and the fresh water solid ice phase; because of the segregation coefficient across that phase interface; and I have argued that the expelled salts during the refreeze, raises the interface salinity and therefore lowers the refreeze Temperature; which slows the initial freezing, so that air Temperatures have to drop even lower before the refreeze gets going full bore. Now at the same time the solid ice expells CO2 into the water, and if the CO2 in the water is at the Henry’s law equilibrium level; then that CO2 expelled from the growing ice, must basically be released to the atmosphere, and I have conjectured that that is a significant component of the 18 ppm annual cycle amplitude of the atmospheric CO2 that is seen in the Arctic.
So are these conjectured phenomena known to NSIDC Scientists such as yourself; and in the case of the CO2 exchange; do you know what fraction of that 18 ppm might be due to the ice melt/refreeze cycle ?
Those two effects have intrigued me for some time; so I would appreciate your comments.
Do we have a click spot to download for saving your extensive paper here ?
Thanx; George
As a corollary on the sea level rise phenomenon, if one assumes a constant value for the coefficient of expansion of sea water over the appropriate temperature range, then one would conclude that the amount of sea level rise contraction, would be the saem, no matter how the heat involved was distributed in the water column. So if 100 metres of water dropped by 0.1 degrees, the level drop would be the same as if 10 metres dropepd 1.0 degrees C.
But I doubt that the Tc is really constant over that Temperature range, because of the salinity changes, and the way the water Tc changes with temperature and salinity near freezing. ordinary sea water of course has no maximum density above the freezing point like fresh water does.
An interesting and comprehensive review.
My own anlysis of the PIPS data shows that the minimum thickness of Arctic ice was in 2008, 1 year after the extent minimum, but has since been recovering, even this year.
http://www.climatedata.info/Discussions/Discussions/opinions.php?id=8582852482576247641
Thank you for an interesting and informative article.
One other aspect of snow on ice, is that if sea ice forms in quiet sea conditions it is transparent and allows IR radiation from the ocean to pass through it, thus allowing the ocean to lose heat. However, when it is covered with snow, the snow acts to reflect IR back into the ocean and so has an insulating effect which then allows upper ocean heat to increase and assist with ice melt.
Where developing ice is repeatedly smashed up by rough seas or strong winds then the effect is probably minimal but in Antarctica there are large areas of sea ice that form as a smooth sheet.
Perhaps Dr Meier could comment on the significance (or insignificance) of this effect.
[at operator:]
On polarview are some more nice graphics re. seaice:
http://polarview.met.no/
I suggest to add them to the SeaIce page
East Greenland:
http://polarview.met.no/regs/c_map7.jpg
Spitzbergen:
http://polarview.met.no/regs/c_map3.jpg
Overview: (East Greenland, Spitzbergen, Barents Sea, North Cape (Northern Norway):
http://polarview.met.no/regs/c_map6.jpg
North Sea & Baltic Sea:
http://polarview.met.no/regs/c_map2.jpg
Total Overview of all areas:
http://polarview.met.no/regs/c_map2.jpg
Regards
KlausB
I have a burning question for everyone, including Anthony and Dr. Meier.
If the arctic loses sea ice, does this mean the earth is warming or cooling?
Give it your best shot! (I’ll bet Bob Tisdale gets it right)
Thanks!
Fred Souder
… and here is an overview of more available:
http://www.polarview.org/services/services.htm
Dr. Meier,
I appreciated your post. Thank you.
In the section “The Northwest Passage, Northern Sea Route, and Circumnavigation of the Arctic” there was a point at which you lost me.
You lost me when you said, “However, this doesn’t mean conditions in the past were anything like today. They were not. While conditions will vary from year-to-year and I think it will be some time before either passage (especially the NWP) will be a reliable route, both passages have been far more open in recent years than in the past.”
I could not see the basis of your claim.
If any other WUWT commenters see the basis of Dr. Meier’s claim then please advise. It would be appreciated.
John
Wow. This was a really good article. Thanks for educating me. First class. I hope we will get more articles like this. Thank you for taking considerable time to put together such a well written article. This is a real treat compared to the dumbed down stuff presented by the media. Science Blogs Rule!
Bottom melt early in the season
For a few years I was with the Canadian Hydrographic Service in the arctic. We went out on the ice when there was enough light, late February or early March iirc. An important criterion for our camp site was that the ice be flat enough and thick enough to land a DC-3.
At the beginning of our season, the ice would be at least six feet thick. We would leave some time around May when the ice had thinned to three feet. The temperature would still be below freezing. (I remember one glorious sunny day when the temperature got up to minus fifteen degrees F.) You could not tell that the ice below you was melting. The only way to know how thick the ice was was to drill a hole.
So, the ice thickness decreased by half or more between February and May while the temperatures were well below zero. Clearly, the water was warm enough to melt the ice even though there had been no sun for months. I had always assumed that the water was ‘warm’ because of currents, not because of solar warming. Given that the daily mean temperature for Eureka is way below freezing (-3.5 F, -19.7 C), I would say that heat transport by ocean currents is the only reason the whole thing doesn’t freeze clear to the bottom. (OK maybe the last statement was a bit hyperbolic. Clearly solar radiation is the reason it gets above zero in the summer. )
Bottom line, water that hasn’t had any sun on it for months is still warm enough to melt the ice above it.
The good doctor makes it sound like any one with an attention span could navigate through the passages. I would ask him why there were so many people requiring RESCUE this year if the conditions were so favaorable?
Thanks Walt. A much better discussion where facts and potential explanations are provided rather than the usual hyperbole we are used to seeing about model results/forecasts.
Thanks for a well written and very informative article. It was a joy to read.
There are many here with far more insight than I, and many will have issues to raise; I hope these will be in the same spirit of reasoned debate.
Thank you for writing.
1. At what elevation angle must the sun be above the ice field for its heat energy to be absorbed, and not reflected?
2. We have heard for years that the sun heats “open water” different than” ice-covered water”, and thus, any open water in the Arctic feeds back and heats up the world much faster. Does not the recent short-term ice field recovery – with global temperatures staying the same from 2005-2006-2007-2008-2009-2010 while ice retreats (2006-2007) and advances (2005-2006, and 2007-2008-2009-2010) completely disprove this theory? Likewise, does not the (lack of) long term ice field extents data earlier than 1970 preclude any confidence in your assumption that the 1970 – 2010 decline has not been present, but unmeasured, many hundred times before?
3. The globe has been warming since the 1650’s, with a 60 year short climate cycle (with recent peaks in 1880-1890, 1930-1940, and 2000-2010) being superimposed on a longer 800 year climate cycle. What part of your theory (that CO2 introduced since 1950 is responsible for temperature increases between the low temperatures of 1970 and the El Nino high of 1998) is proved by the decline in ice field extent between 1970 and 2010?
Instead, your comments about ice extents and Arctic temperatures appear to only reinforce the natural 800 + 60 cyclic nature of the world’s temperature, and provide no evidence of any man-caused changes to that cycle.
J Felton says: October 21, 2010 at 10:29 am
” Predictions based on past behavior are less likely to be valid.”
That oughta blow Tamino’s
” The best prediction is from past behavior” theory.
Dr. Meier is saying that predictions based on past behavior are less likely to be valid than they were a few years ago because conditions are different than they were a few years ago. He is not saying predictions based on past behavior are less likely to be valid than flipping a coin or making a guess.
So now they update their models to include the new behaviors they observed relating thinner, younger ice to decreases in extent. Next year, they can use the past behavior of 2010 to make a better prediction for 2011.
That oughta completely agree with Tomino’s ” The best prediction is from past behavior” theory.
Please wake me when they stop finding Viking artifacts (like cattle pens and bones) on land exposed by retreating glaciers and/or when trade vessels start taking a shortcut in the summer through the Northwest Passage.
Ref – Fred Souder says:
October 21, 2010 at 11:01 am
“I have a burning question for everyone, including Anthony and Dr. Meier. If the arctic loses sea ice, does this mean the earth is warming or cooling? Give it your best shot! (I’ll bet Bob Tisdale gets it right) Thanks!”
___________________________
Fred:
Not sure if the earth is cooling or warming, but it would “seem” that the sea is changing somehow; maybe it’s windy and ice is blowing south of Greenland; maybe earthquakes at the North Pole are washing the stuff ashore (onto the earth/land); maybe the heat from hollywood camera lights –while making a movie of the Arctic Night– is melting it; maybe Chinese Subs are practicing polar launches (understand they have a lot of Boomers these days purchased from Russia); ohhhhh.. heck there’s just so many things it could be! Well, anyway, I don’t think ya can answer that question from the little bit ya gave us. Why would the land/earth cool or warm, ain’t we talking sea ice?
Excellent! Encore! Encore!!!
The Vikings circumnavigated Greenland?
Really,
That’s news to me.
When and who?
Peter Foster says:
October 21, 2010 at 10:57 am
“One other aspect of snow on ice, is that if sea ice forms in quiet sea conditions it is transparent and allows IR radiation from the ocean to pass through it, thus allowing the ocean to lose heat.”
I should think the most significant effect of clear ice is that it works like a real greenhouse and blocks cooling by convection, evaporation, mixing of air and water, and longwave radiation (I don’t believe ice is very transparent to longwave) while allowing the shortwave radiation from the sun to penetrate and warm the water below it.
However, when it is covered with snow, the snow acts to reflect IR back into the ocean and so has an insulating effect which then allows upper ocean heat to increase and assist with ice melt.
Where developing ice is repeatedly smashed up by rough seas or strong winds then the effect is probably minimal but in Antarctica there are large areas of sea ice that form as a smooth sheet.
Perhaps Dr Meier could comment on the significance (or insignificance) of this effect.
Dr Meier
Thanks for your informative posts. I wonder if you can tell me the tidal fluctuation in the arctic? In our part of the world (Southern UK) a very high spring tide would come in at around 5.2 metres. A low one around 3.1metres. On top of this are waves that can be up to around 2 metres although around 60cm is more common.
If the arctic conditions are anything like similar its a wonder to me that any sea ice at all survives a summer. Can you help with any figures?
Also as regards to the ozone hole , how do we know it hasn’t always been there growing and shrinking in a random fashion. We have only had the instruments to measure it since the late 1950’s. How do we know it wasn’t much bigger (or smaller) in previous centuries?
tonyb
Only the first paragraph outside quotes in my response to Foster above is mine. The remainder is from Foster’s comment and should have been snipped.
Many thanks Walt,
This is why I love to visit WUWT as often as I am able, your post was very interesting indeed and written in a way that is understandable to the laypersons among us. All we have ever wanted is good accurate unbiased information and you have just served up a goodly portion of it.
Thank you again for sharing your insights and I hope you post again when more information comes to light, you can see just why WUWT has become the worlds leading science blog and Mr Watts is a person that does immense service to science as a whole, one day I hope his efforts will be recognized.
Yours in gratitude
Cassie K.
bob says:
October 21, 2010 at 12:17 pm
The Danish archaeologists are finding remnants of Erik and Leif’s descendants farther and farther up the east and west coasts. When the ice melts further north (ROTFLOL), then we will find more artefacts, I’m sure. And more graves and settlements.
No, we don’t have a press release from 1000 AD to confirm the circumnavigation.
Kiwi Yachtsman, Graeme Kendall, completes world sailing firsts;
Arctic North West Passage solo, non stop & in a record 12 days.
http://www.astralexpress.com/
You can read all his logs here too.
My question is that if the paleo study that shows ice levels over thousands of years much lower in the past is climatologically dubious, then how can you draw any climatological conclusion from 30 years of studies?
Thank you for your time and for coming here.
I find this interesting (SNOW). “when it falls onto sea ice it accumulates on top and “weighs down” the sea ice. With Antarctic sea ice being on average much thinner than the Arctic, it is not uncommon for the weight of the snow to push the top surface of the ice below the water line. When this occurs, the snow gets flooded by the ocean waters, which then freeze and form what is called “snow ice”. Effectively, the snow is converted to ice and thickens the ice cover.
If it snows alot on to sea ice can this raise sea leeves[sic ~ac]?.
sorry levels.
Thank you, Dr Meier, for a very interesting and informative article. Thank you also for not treating us like idiots. That animation is one of the best I’ve seen, although I don’t remember the ice retreating to the extent that it shows.
This year was always going to be a crap-shoot what with the strong El Nino, but I fully expect the ice to continue its recovery next year, especially if the regrowth to date is anything to go by.
Lastly, have you any comment to make with regard to the growing divergence between NSIDC sea ice extent and Jaxa? There was some 500,000 sq. km of a difference this year, from virtual parity in 2006.
Hey Pascvaks,
The ice sheet at the north pole acts like a thermostat – a negative feedback control. When ice builds up, this causes the Earth to warm. When the ice melts, the Earth cools. It is amazing how many “climatologists” don’t understand thermodynamics.
Good post. Clear and informative.
Same biased stuff by Meier who never answers the key question: if arctic sea ice was so stable in the past, where is the 100y, 50y or even 25 y old sea ice gone? Dr. Meier also shows his limited knowledge of atmospheric circulation patterns when comparing snowfalls between hemispheres, and of course fails to explain the recurrent shape of the non melting arctic ice, hardly dicatated by CO2 concentrations.
Despite a soporific tone, this is simply a rehash of the Serreze hardline.
bubbagyro says
“The Danish archaeologists are finding remnants of Erik and Leif’s descendants farther and farther up the east and west coasts. When the ice melts further north (ROTFLOL), then we will find more artefacts, I’m sure. And more graves and settlements.”
Ah, the mythical voyages of the descendants of Erik and Leif.
You are aware, are you not, that the coastline of Greenland is quite free of glaciers and ice for a substantial extent. Close to but perhaps not quite half.
And are you familiar with the topography of Pearyland, if there was evidence that Vikings were ever there, well its not buried by ice. There is evidence of Inuit culture there.
So, I’m still waiting for evidence of the circumnavigation of Greenland.
Thank you Dr Meier.
so it appears everyone is in agreement that the Arctic Ocean is warming thus melting the ice.
I draw you attention to lead scientist Ralph von Frese of Ohio State University who in 2007 suggested that the earth’s crust under the NE corner of Greenland was thinning and the rising magma was causing the ice to melt where previously there had been no melting.
This was followed in 2008 where a research team led by the Woods Hole Oceanographic Institution (WHOI) uncovered evidence of explosive volcanic eruptions deep beneath the ice-covered surface of the Arctic Ocean. The volcanoes lie along the Gakkel Ridge, a remote and mostly unexplored section of the mid-ocean ridge system that runs through the Arctic Ocean.
Then just recently the volcano in Iceland finally blew ( I won’t attempt to spell it)
As the Arctic ocean is basically trapped within a circle of land could this increase in submarine volcanic activity be causing the Arctic ocean to warm?
The voyage of the Manhattan was very controversial. It was an attempt to traverse the Northwest passage to show that it an international waters and not Canadian territorial waters. The Manhattan was intended to make the trip without assistance to prove that t Northwest passage was open, Supposedly there were American oil company maps showing it as international waters. This was in the newspapers so the maps may be more of less imaginary.
In any event the Manhattan could not traverse the passage on tis own and had to use Canadian icebreakers to be freed from the ice that had beset it.
So we ahve two things of interest here>
a) there was thought in the 1960s that teh NWP ws opne. This thought was strong enough to lead to the conversion of an oil tankers.
b) the oil tanker’s attempt was not successful
So was eh NWP open in the 1960s or not? This does have a bearing on the current discussion. Not mentioned in the article is that the second St. Roche voyage in 1943 found the NWP passage to be free of ice. Previous attempts have found a passage free of ice as well. If that had been the case or even if the ice had been slightly less, the Manhattan would have succeeded and the current discussion would be quite different.
My take away – a good description of system changes seen over an arbitrary time period. The short description period is also the only period of record. Speculation followed.
Since Dr. Meier is a contributor to this NOAA report and that many affirmations here can be questionned this should interest WUWT readership:
http://beta.images.theglobeandmail.com/archive/00958/Read_the_Arctic_Rep_958042a.pdf
Thank you Dr. Meier,
I liked your comment “nor does it contradict the reality that the Arctic is very different place than it was just twenty or thirty years ago.” Indeed, the Arctic will again be different in another twenty or thirty years, but probably it willthen be just like it was forty or sixty years ago.
Humans on the surface of the Earth have as much relevance as lichen on rocks in the long term. The planet will be here, long after humans become extinct. It is the nature of the Universe. We cannot “save the planet”, nor does it need saving. Are we worth saving? Unlikely.
” And whether or not it is clear to you, no doubt the universe is unfolding as it should.”
Regards,
Perry
This just in:
Report: Arctic temperature rising at near record rates, sea ice melting faster
1:56 p.m. CDT, October 21, 2010
WASHINGTON (AP) — The temperature is rising again in the Arctic, with the sea ice extent dropping to one of the lowest levels on record, climate scientists reported Thursday.
http://www.chicagotribune.com/news/nationworld/sns-ap-us-sci-arctic-warming,0,7127804.story
Perry: “Are we worth saving? Unlikely.”
Speak for yourself!
Perry: “Indeed, the Arctic will again be different in another twenty or thirty years, but probably it will then be just like it was forty or sixty years ago.”
There is no credible evidence for this claim.
Look at this graph closely
http://ocean.dmi.dk/arctic/icecover.uk.php
Is 2010 ice showing less or more than 2009, 2008 and 2007 what are your conclusions?
Dr. Meier,
Thanks. For the clean and clear text.
For (almost) the same solution enthalpy. I can get different entropic solutions.
example,
http://www.ehow.co.uk/about_6301314_do-want-frost-freezer_.html
And yet one more thank you for a clear, interesting, informative post here. 🙂
Oh dear, did I rattle your cage Mike?
How can anyone have credible evidence for any claim to know the future? One can only guess. That’s the point. It’s a cycle. What goes around comes around. My prediction is as plausible as any other. No one lives forever. That’s indisputable, unless, of course, you know better. So, 40 0r 60 years ahead, the Arctic probably will be back as it was 20 or 30 years. Be glad if it is, the climate could have reversed into another glacial period and brass monkeys will be looking for artificers in metal. “‘ere mister, do you do welding?” BTW, I know they would require brazing, but it’s a joke about a blacksmith working in the depths of winter. Knock, knock!
Thanks Walt for an excellent post. However, I think your conclusions about the future of Arctic sea ice are wrong, and the next 30(ish) years will see the ice return to 1970 levels, or beyond. This is because we are now on the down curve of a 60y sinusoidal cycle and the low minimum NH ice levels we have seen over the last few years is, along with a quiet sun, a sign the cooling has begun.
Tim F says:
October 21, 2010 at 11:54 am
“That oughta completely agree with Tomino’s ” The best prediction is from past behavior” theory.”
Wrong. Past behaviour theory only works for linear systems where all the variables can be accounted for. Sea ice levels are the result of a non-linear process driven by deterministic chaos and linear trends and past history have no predictive value.
I still haven’t seen an answer to the question of what impact increased icebreaker activity might have had on ice conditions.
Now offhand someone might argue that icebreaker activity only covers a small portion of the Arctic Ice each season but I believe that is being far too simplistic. Often small cracks can compromise the integrity of much larger objects particularly if that object is under large amounts of stress and pressure and undergoing significant amounts of movement like the Arctic Ice is.
After doing a bit of background reserach on ice breakers I found the first nuclear icebreaker was launched in 1959 and the first to reach the North Pole did so in August 1977 at around the time we started keeping satellite records. Russia now has 8 state owned nuclear icebreakers in operation.
I fail to see how a fleet of ships designed specifically to break and crush large quatities of the Arctic Ice they travel through cant have an impact on the overall stability of the Arctic Ice. Surely an ice pack broken into a dozen peices is less sound than one which is not. Any time you put a weakness into something that was once solid, it cannot be a good thing.
Another fantastic contribution from the amazing Dr. Meier. Think Schmidt, Hansen, Mann, or Jones would do the same or allow an immediate subordinate to do so? Those guys would be a lot less borish and garner far less contempt if they’d engage, respect others regardless of pedigree and camp lines, and perhaps hang themselves out for a little scrutiny via dialogue.
Comparing journeys through arctic waters 100 years ago, 70 years ago, and 50 years ago (approximately) with today ignores several obvious points. Today we have GPS, satellite imagery, and little boxes called computers helping our ships along. The stated point that sailing in arctic waters used to be harder ignores the amount of information a modern ship and crew utilize, not to mention modern ship building.
Also, I am always fascinated by well educated people’s “faith” in computer modeling. It works really well were you can control all of the variables and variable-by-variable adjust the model to fit the experiemnts. It doesn’t work at all well when you simply tweak “things” until the results are similar to something you can’t control. A model that fails to find expected warming due to the “ozone hole” can simply be tweaked into submission.
Gradual warming due (mostly) to natural causes explains everything we see in the arctic today. Add in a little soot, and I don’t know there is much left to explain.
Just my opinion, no disresepect intended. Thank you for the article.
bubbagyro says: at 9:14 am
Why do we continue to use 1979-2000 for averages . . .
http://ams.confex.com/ams/pdfpapers/26747.pdf
Title = UNITED STATES CLIMATE NORMALS FOR THE 1971-2000 PERIOD:
PRODUCT DESCRIPTIONS AND APPLICATIONS
The mandate to describe the climate was combined with
guidelines established through international agreement. The
United Nation’s World Meteorological Organization (WMO)
requires the calculation of normals every 30 years, with the
latest covering the 1961-1990 period. However, many WMO
members, including the United States, update their normals at
the end of each decade.
Note: the text above indicates the 1961-1990 period so this is an older paper. I don’t have a newer reference.
And as the decade is not yet over the “normals” are not yet recalculated.
This rule was, I believe, first established in the 1930s –that :
means = “normal” and that they will be based on 30 years with the 30th year having an ending zero.
The idea seems to have been that when your local radio or newspaper reported the daily temperature and the “normal” it would be something the listener/reader could relate to through personal experience. It would change to fit personal experience faster than if the “normal” were anchored to the entire history for the station that might extend back before anyone was born that would currently be alive.
Wow, so many questions! Thanks for all the input. Obviously, I can’t possibly answer everything. I’ll try to briefly answer at least a few. Sorry to those I didn’t answer (it’s not because they’re not good questions):
Tonyb (10/21, 12:25 pm): “Also as regards to the ozone hole, how do we know it hasn’t always been there growing and shrinking in a random fashion. We have only had the instruments to measure it since the late 1950′s. How do we know it wasn’t much bigger (or smaller) in previous centuries?”
This is a great question in that it encompasses something that I think is often misunderstood. The reason we know the ozone hole is different this time is that we know the chemistry. Scientists did experiments that demonstrated how under conditions in the Antarctic stratosphere, CFCs break down ozone. And studies were done that showed how CFCs emitted by humans work their way up into the stratosphere.
Likewise, we know that the climate changes we’re seeing today are different because we know the chemistry/physics. We know that CO2 and other gasses have a greenhouse effect on the earth and we know humans are emitting a lot of GHGs. The observations are in a sense just confirmation of the process and an indication of the how much of an impact the GHGs have on various parts of the climate. Paleo records are useful because they provide a long-term context and help bracket the sensitivity of climate to changing forcing, but aren’t necessary to “prove” AGW. Some scientists have suggested negative feedbacks that will attenuate the GHG effect and/or have suggested that the GHG effect will be smaller than the evidence suggests to most climate scientists, but evidence presented in favor of these ideas has not (yet) been convincing. Of course GHG-climate connection is more complex than the CFC-ozone connection, so the uncertainties are higher, especially when you get into socioeconomic issues like impacts and adaptation.
A few others:
Jeremy (9:18): The Cryosphere Today fields are ice concentration, not thickness – it is still data just from the surface. When the concentration is low that can indicate thinner ice, but not necessarily. Also, concentration is affected by melt on top of the ice, so lower concentration values may simply mean more surface melt water, not necessarily lower concentration. This is one reason why NSIDC focuses on sea ice extent (ice vs. no-ice).
Jack Savage (9:37): We’re still on-track for an almost completely ice-free Arctic Ocean by 2050, if not earlier. And though I didn’t address the issue, yes, soot/black carbon, have and still are playing a role in the loss of sea ice, though the amount is still uncertain.
Jim Cripwell (9:44): I don’t know when Cryosat-2 data will become available. There is always time needed for calibration and validation of the data. I suspect we’ll start hearing something soon. It will be a great resource for much better information on sea ice thickness, but I caution people about getting too excited. There are lots of uncertainties in the satellite data, particularly since this a relatively young technology. And of course it doesn’t provide a long-term (multi-decades) data record, though it could be very useful in terms of accurate initial conditions for seasonal forecasts.
Wes (10:14): Icebreakers have a negligible effect on the sea ice. Even with more icebreakers, the area they impact is very small compared to the overall sea ice cover.
Dan in California (10:43): Satellite data certainly helps make things safer (though ship radars are more important because a lot of the ice is too small to be seen by satellites). But conditions are much different. I suggest reading some of the tales of Amundsen or the Franklin Expedition compared to today’s experiences.
Kuhnkat (11:26): The decline in ice cover actually makes things quite a bit more dangerous. Before there was too much ice for most to even consider sailing in the Arctic, but with less ice there is much more temptation. But even small floes of ice can damage or sink a ship and when there is very little ice, what is there is more easily missed.
Mark r (1:12pm): Technically yes I suppose – increased snow going onto the ice or into the ocean would raise sea level. But it would only be an imperceptible amount – the amount of snow compared to the volume of the ocean is very small.
TomRude (1:32 pm): There is probably some 100 year, 50 year, etc. sea ice in the Arctic. “Ice islands” and some ice shelves like Ward Hunt) are actually sea ice that have thickened through the years (though a lot of the thickening comes from snow fall). These form as fast ice – ice that is attached to the coast and doesn’t move. But it only forms in relatively small protected bays where the wind can’t blow it away from the coast. The rest of the ice cover either melts during summer or moves with the winds and currents and eventually moves out of the Arctic where it melts. This process can take up to 10 years, but you won’t find much ice older than that in the Arctic.
Basically, there is a balance between growth/melt/export. Every year some ice grows and some ice melts. Normally, a little more grows than melts, with the excess moved out of the Arctic. But now, the balance has changed – we’re (on average) losing more ice than gaining in year.
walt
Mike this is the NOAA report Dr. Meier is part of… and since it’s covered by MSM it’s easy to understand how skewed it is…
Emphasis mine.
It seems to me that “only a third” is not an insubstantial fraction of the whole.
Welcome to WUWT.
I would not dispute that the Arctic has less ice cover than in the recent past. The data speaks for itself.
But I am curious to know how much the recent navigation through the Arctic waters have benefited from GPS technology and satellite imagery of ice extent. Technologically, they must have benefited from the full spectrum.
The opening of Arctic waters for sea transport ought to be welcomed. It’d have tremendous benefits for the world economy by shortening the route between East Asia and US & Europe. In fact, I am surprised that shipping merchants have not yet taken up the opportunity, and navigation in these waters continues to remain at “proof of concept” level. With the help of recent technology, a single medium or heavy ice breaker could lead a huge convoy of merchant ships to their destinations.
Maslanik eta al., sea ice age, week 17, 2010 (http://www.arcus.org/search/seaiceoutlook/2010/june): http://img153.imageshack.us/img153/644/fig2new2x.png
Maslanik et al., sea ice age, week 17, 2010, as showed in the frame used in the animation above: http://img836.imageshack.us/img836/4473/172010anima.gif
Look the changes from green (MYI) to blue (FYI) in the area near the Pole, north Greenland and Svalbard… ????????????
There seems to be a spike in fall temps regularly. I clearly remember this last year and the warmistas using it as *proof* of something or other. It was a big freeze year last year, and I am going to bet on another this year.
Thank you for your insights Dr Meier.
One question that’s often puzzled me is whether the world’s navies are contributing data to sea ice thickness, especially in the Arctic where it’s been a more sensitive subject. Ice thickness has always been of interest, and for quite a while, they were the only people really collecting data. Has this been incorporated into the historical records for Arctic ice?
Walt Meier says:
October 21, 2010 at 4:00 pm
Commenting with equal scientific precision, yes, “humans are emitting a lot of GHGs,” but relative to GHGs from natural sources, the amount emitted by humans is minuscule and not sufficient to have a controlling effect on climate trends.
There is not a single observation, other than perhaps elevated temperatures measured in urban heat islands (which, by the way, cover a minuscule portion of the surface of the Earth) relating to global or arctic climate trends that permit anyone to discern whether a given aspect of the climatic is caused by humans or nature.
There is not even a single observation that proves “how much of an impact the GHGs have on various parts of the climate.” The applies to natural and anthropogenic portions of GHGs and to both combined.
Your assertions to the contrary are not supported by observations.
Sorry, “The applies” should read “That applies”.
Week 30, end of july 2010. Then (http://www.arcus.org/search/seaiceoutlook/2010/august#pan-arctic) and now (in the animation provided by Walt Meier):
http://img821.imageshack.us/img821/7995/animateanda.gif
The same week, and the ice a lot younger…
Astonishing…
If I could get a taxpayer grant; then I could go and get the answers to my questions myself; and probably have some fun doing it.
But absent any rebuttal I will just assume that I am right on the money.
Dr. Meier : There was also a prediction of 1.0. Mine (to my humilation).
Nonetheless, I congratulate you on not sneering at me … actually, I made so radical a prediction for a Reason – – I felt the stong pacific Warmth (El Nino) would melt ALL the ice except the really thick shelves, which had not detatched from land in 4100 years.
… Then they did. As that wondrous Animation shows.
Nonetheless your reliance on the Arctic being influenced by MANY factors proved a better Model.
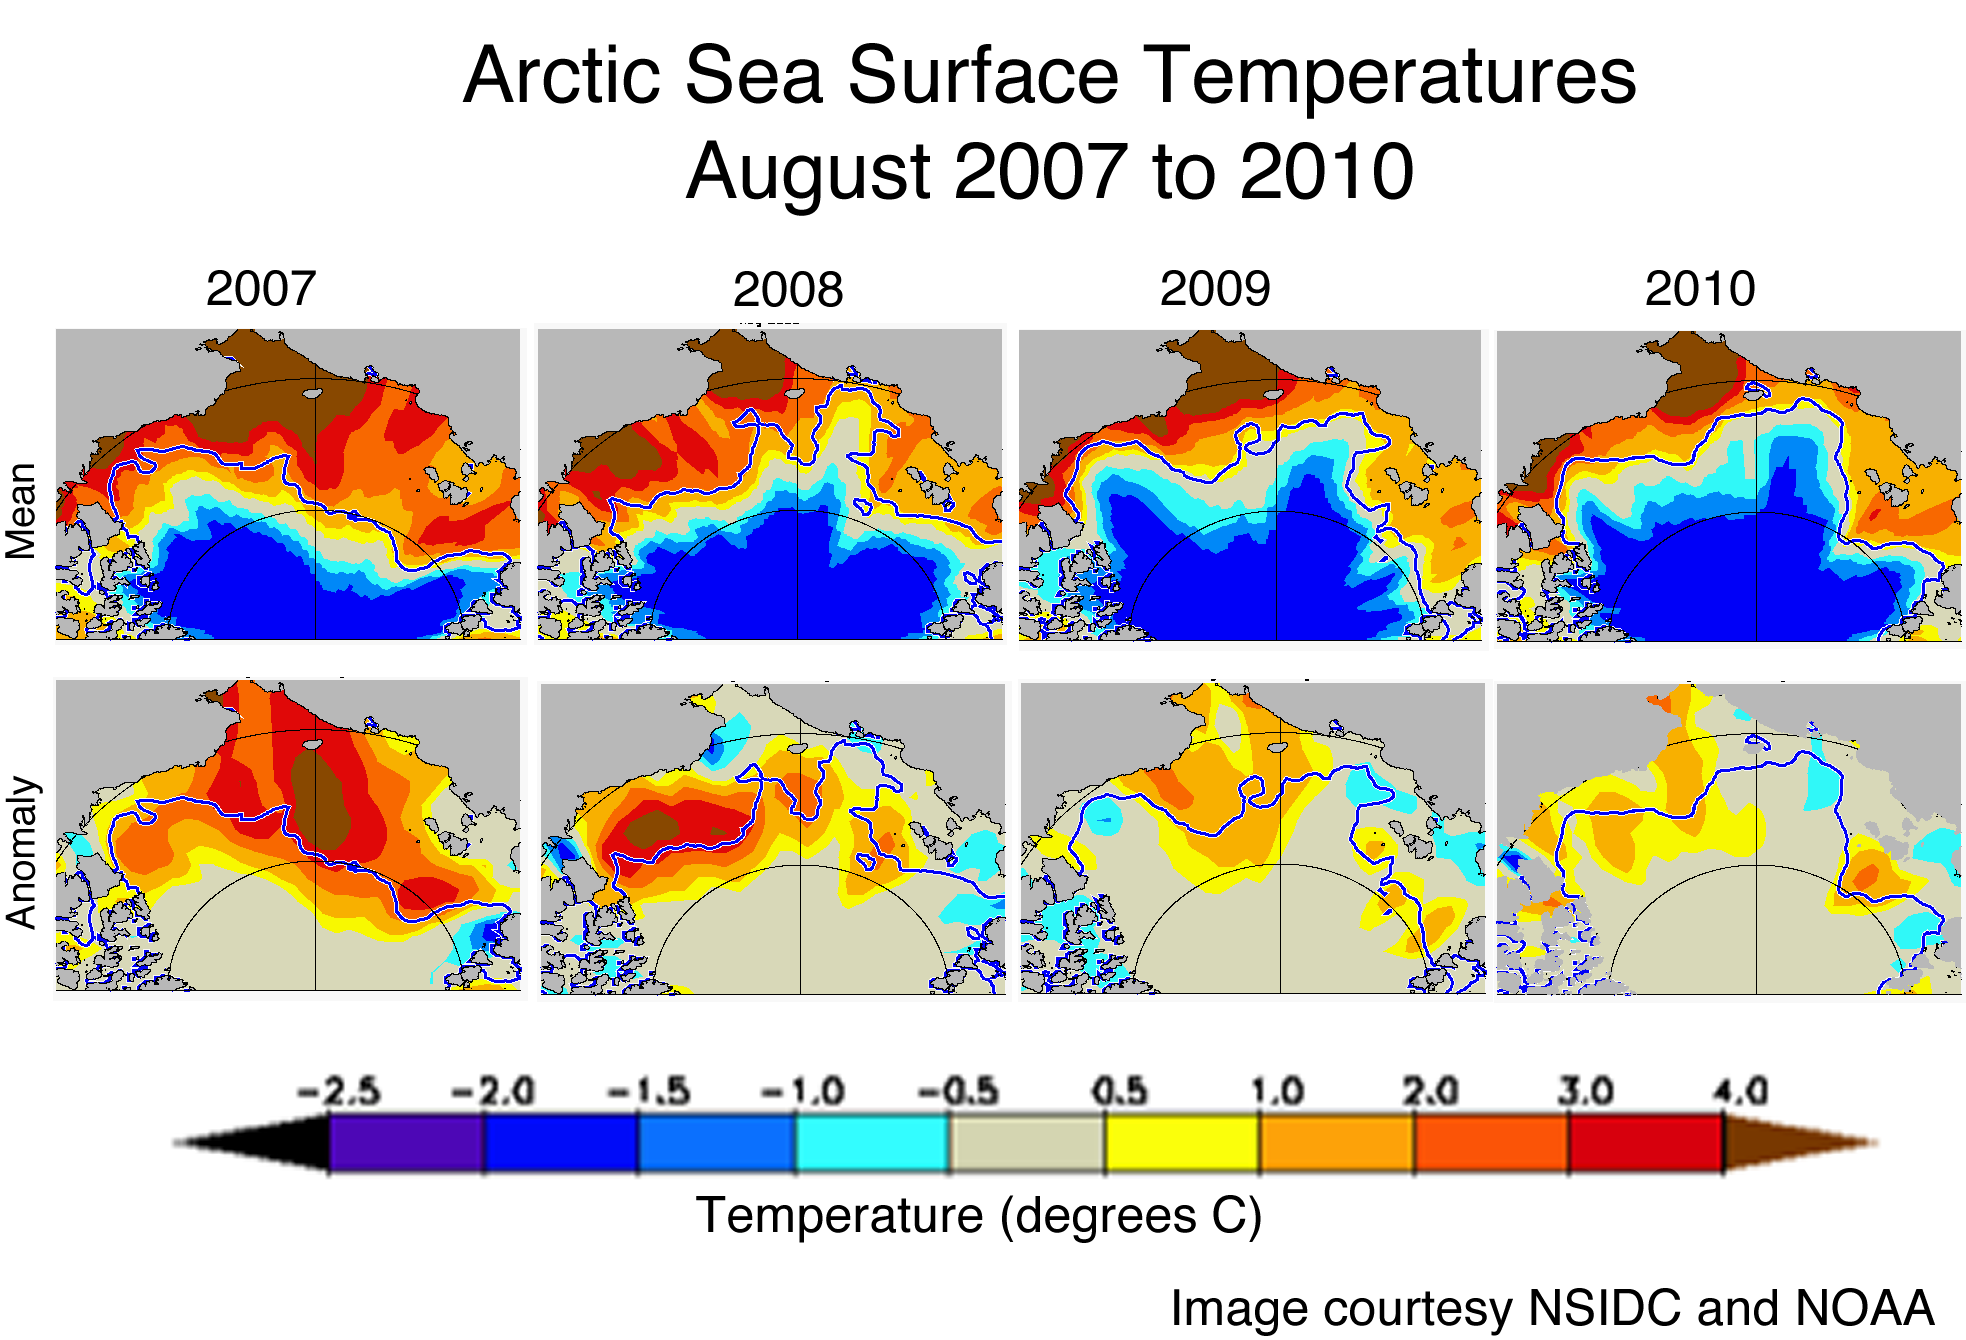
Nonetheless, I am curious about your Sea surface temperature — the Danish seemed MUCH higher relative to all other years save 2007. Albeit your map seems more in line with how the melt went in July & early August. Where do you get your Sea Surface Temperatures ? Is it a Publically available map ? .
Thanks.
But why has southern ocean sea ice been so stable? You say global warming will either make it go up or down, it is actually doing neither.
A nice presentation, Dr. Meier.
A few caveats about the similarites and dissimmilarities between the Arctic & Antartic.
The temperature 80N stayed lower longer than anything since 1958.
The Sea Ice Extent in the Antarctic reached Maximum earlier and has stayed up at that level longer, and has yet to come down.
These two conditions, plus the oncoming La Nina in major portions of the Pacific (spreading) has forced warmer waters up North.
This is temporary (warmer water forced North). TSI is flat, and is not moving upwards, and that has to factor into the ocean heat supply over time.
Somebody has to be right and somebody has to be wrong in this controversy, but I do appreciate you putting your best hand at the wheel. I look for a turnaround in the Global Sea Ice anomaly to be part & parcel of the recovery from 2007 plunge.
First Target: 22M km^2
Thanks Dr Meier,
I’m going to add to the long list of questions in the comments.
1) On the tongue of ice I wonder the relevance of this type of analysis. Saying the ice behaved differently to 2006 (n=2) is hardly enlightening. I had a look at the Sept ice extents using the Cryosphere Today comparison tool. You’re obviously not saying 2010 is unique with respect to this ‘tongue’ melting’ but you are suggesting it’s a standout feature, to what extent is that claim scientific without a greater historical perspective? Looking at the final extents going back a decade or two 2005 stands out where a similar tongue survived like 2006. Many of the other years where the Beaufort Sea melted to any great extent seem to show no evidence of this feature, mainly featureless straight final extent like 2010, 1999 is a good earlier example. I know this is crude, the intention was to highlight a point. It can seem that at times arctic ice researchers are prone to extrapolating too much. Do you think this is a problem? I will say though that the 30year downward trend in the satellite data is the most important feature of the data and something I’ve critisised WUWT for ignoring.
2)These comments are all probably overlapping in some way. The arctic sea ice is a constantly replenishing system. My understanding is ice is rarely much more than 6 years old. This must mean that eventually all MYI is lossed in some way. Surely the huge clearout in 2007 must still be weighing heavily on arctic sea ice conditions today and probably will for a few years to come. You may not wish to comment on other scientists work but I’ve seen some work and quotes in the news (Christian Haas stands out) who suggest that little has changed since 2007. I’m sure you know he goes out in planes and measures ice thickness. He’s certainly not in the sceptic camp and recognises the long term trend but he certainly seems to have a different take on post 2007 ice. I don’t just think this is a style issue, I think it’s in his data. Is it possible that the 2007 clearout is weighing more heavily on the model based analysis of sea ice than it is in reality?
3) My final question/comment is about variability. This was brought home to me when I skipped through past issues of ‘state of the climate’. In early versions the observations were primarily about variability in the system. Obviously the discussion in recent years is all about the trend. I think many sceptics are concerned about the horror stories that emerge. Barber’s “rotten ice”, “death spirals” might be examples of this. Barber’s observation that satellite data may mis-catorgorize different ice type was important but it seems to me what blew this up into news worthy stuff was his enthusiastic use of the “rotten ice” term and his willingness to repeat it to anybody who asked. Even the example of your melting tongue might fall into this catagory because I’ve seen this repeated on other blogs. Having relegated variability to a minor role in favour of the trend do you think there is now a tendancy to try to explain everything in terms of the long term trend and is this causing problems for the science or at least the reporting of the science?
George E. Smith says:
October 21, 2010 at 5:41 pm
If I could get a taxpayer grant; then I could go and get the answers to my questions myself; and probably have some fun doing it.
But absent any rebuttal I will just assume that I am right on the money.
xxxxxxxxxxxxxxxxxxxxxxxxxxxxxxxxxxxxxxxxxxxxxxxxxxxx
George: You usually are.
tonyb says: at 12:25 pm
Also as regards to the ozone hole , how do we know it hasn’t always been there growing and shrinking in a random fashion.
Despite Dr. Meier’s comments, I think you are almost right. The quibble is with your term random. There may be something as a cause, but what? Maybe hurricanes or something lifting seawater.
Last year a couple of WUWT posts focused on ozone. There is too much of a back story to believe pure science triumphed regarding CFCs. Among other things, patents were about to expire and new chemicals would renew the income stream.
http://onlinelibrary.wiley.com/doi/10.1002/(SICI)1099-0836(199711)6:5%3C276::AID-BSE123%3E3.0.CO;2-A/abstract
TITLE = There’s money in the air: the CFC ban and DuPont’s regulatory strategy
While the scientists said it would take years for all the CFCs to work up over the South Pole it is a wonder that the largest ozone hole ever observed occurred on 24 Sept 2006, just 4 years ago.
Maybe that is because there are compounds (halogens) naturally available to do the work blamed on CFCs.
http://www.nature.com/nature/journal/v453/n7199/full/nature07035.html
TITLE = Extensive halogen-mediated ozone destruction over the tropical Atlantic Ocean
~ ~ ~ ~ ~ ~
I haven’t made much of a foray into this topic but did note from previous WUWT posts that there are still some issues.
http://wattsupwiththat.com/2008/10/25/new-theory-predicts-the-largest-ozone-hole-over-antarctica-will-occur-this-month/
http://wattsupwiththat.com/2008/10/25/new-theory-predicts-the-largest-ozone-hole-over-antarctica-will-occur-this-month/
Small item:
You imply that Amundsen took three seasons to complete the NW passage because of ice conditions. In fact he spent two of those seasons at Gjoa Haven on King William Island studying the north magnetic pole which, at that time, was in that immediate vicinity.
Anecdote:
Sir John Franklin’s expedition to complete the NW Passage encountered severe ice conditions along the west coast of King William Island in 1846/7 with the well known loss of the entire expedition. About 1964 the small (class 2) Canadian ice breaker “Camsell” circumnavigated King William Island with ease. However, a few years later the “Camsell” was swept onto a shoal by heavy, drifting ice and, but or heroic efforts from a nearby freighter and extra pumps helicoptered in, would have joined Franklin’s ships on the bottom.
Welcome to the rough and tumble world of WUWT, Dr. Meier. We are a scrappy lot, used to giving as good as we got. Hurry back and next time you might want to bring some friends with you just to make it fair.
It’s amazing what silly jobs people (Walt.M) do for a living.
WUWT is changing lately, it blows warmer…
RE: Mike says:
October 21, 2010 at 2:16 pm
***This just in:
Report: Arctic temperature rising at near record rates, sea ice melting faster
1:56 p.m. CDT, October 21, 2010
WASHINGTON (AP) — The temperature is rising again in the Arctic, with the sea ice extent dropping to one of the lowest levels on record, climate scientists reported Thursday.***
Yawn. When they do not want to report what is actually happening they rehash stuff from months ago.
“”” John F. Hultquist says:
October 21, 2010 at 6:50 pm
tonyb says: at 12:25 pm
Also as regards to the ozone hole , how do we know it hasn’t always been there growing and shrinking in a random fashion. “””
It has long been known that the sun, as the most prominent natural light source in the sky, has a seasonal and randomly varying apparent color temperature. (check Standard Optics Handbooks).
These variations were also attributed to changes in the (apparent) solar spectrum particularly in the UV region. Ozone is known to take out a big whack in the UV to green/blue region of the solar spectrum; (see air mass zero and air mass one solar spectrum plots).
So I suggest that there is ample historic observational evidence, that ozone holes have always been with us; but weren’t recognised as such until somebody looked for an ozone hole and found one.
I don’t know when the words “Ozone Hole” first appeared in a scientific paper; but if I had to guess I would say sometime during the IGY of 1957/8 which was deliberately set up to coincide with the expected maximum of the current sunspot cycle; which as it turned out was the ne plus ultra of all sunspot peaks; either before or since; and since the Antarctic Continent gained a huge population of scientists during that research “woodstock”, I wouldn’t be surprised to find that one of them looked for an Ozone hole and found one. I’d pick a Frenchman if I was a betting person; but then I’m not.
Well just for kicks, I wikied ozone hole discovery, and found that some Brit invented them in 1985.
In which case I shall declare him to be a Johny come lately in the history of Ozone holes.
So now to make good, I shall research my Optics Handbooks, to find an earlier reference to the varying color Temperature of the Sun as a natural Light Source.
So what i can take away from this is that the arctic sea ice will continue to melt and we will soon be ice free in the arctic, which in turn will allow us to drill in these waters for more oil.
I guess in summary, ‘its better than we thought’!
Thanks for the great summary, really….hobo
The problem with this analysis is not with the analysis itself but with the data, or rather the lack of relevent data.
It is well known that the climate varies substantially over long time periods.
Very careful scietific analysis is not in itself adequate for the task.
Selecting a ridiculously short time frame as satelite data allows, shows a significant misunderstanding of reality.
There are good (and no doubt peer reviewed) historic records to use to compare the current situation.
It is clear that the artic has been open and closed many time during human occupation, as well as during the relatively shorter time when historic records have been kept.
Compare the past with the present.
Nothing much is happening today that is out of the ordinary.
Move along now, this joke is getting rather stale.
Climatologists should all hang up their spreadsheets and spend the next few years in silent contemplation.
Reading some history would not go amiss.
Tenuc says: October 21, 2010 at 2:51 pm
Wrong. Past behaviour theory only works for linear systems where all the variables can be accounted for. Sea ice levels are the result of a non-linear process driven by deterministic chaos and linear trends and past history have no predictive value.
You have a good point that the sort of precise predictions that physicists like to make (for example, on 2019 Jul 02 there will be a total eclipse across parts of South America) are not possible for weather and climate. Past behavior of the moon gives us very precise predictions of future behavior that climate scientists can only dream about.
That does not mean that there is not predictive power. For example, I just ran August sea ice data from NSIDC (1979-2010 — both extant and area) through Minitab, and it gives around a 0.6 autocorrelation for one year to the next again, for both extent and area). This result is much better than the standard 0.05 level for statistical significance. Without knowing a thing about the actual mechanisms, I can still conclude that there is a statistically significant correlation from one year to the next year.
Based on this, I am pretty confident that since this year was well below average, next year will also be well below average. To say that there is no predictive value in past data, you would have to think that any result from the data set would be equally likely next year, and that there is a 50-50 chance of being above average.
@Dr Meier
Thank you for the thoroughful exposition of the subject.
I have looked up the Russian book on the arctic ice. You say that the declining trend is “conjuctured”- it is in fact a true quotation of their book. However, they put it in a context – they hypothesise a 200 year climatic cycle to be responsible for this.
I would say it is prudent on their side to use these words – they do not have enough data to support it.
On other hand, do you have enough data to reject their hypothesis? And adopt a linear aproximation of observed data?
the_Butcher says: October 21, 2010 at 7:11 pm
“It’s amazing what silly jobs people (Walt.M) do for a living.
WUWT is changing lately, it blows warmer…”
WUWT is becoming more inclusive. We are not going to advance human knowledge by ignoring each other, yelling at each other, attempting to belittle each other, etc. Try challenging Walt’s facts, rather than questioning his quite admirable career path…
Walt Meier says:
October 21, 2010 at 4:00 pm
“……
Wes (10:14): Icebreakers have a negligible effect on the sea ice. Even with more icebreakers, the area they impact is very small compared to the overall sea ice cover.”
Can you please provide more detail to back up this statement. I can put a small crack on a windscreen covering a very tiny portion of the area of that windscreen but that crack can then go on to compromise the entire windscreen.
I simple tear in a hot air balloon whilst being only a small portion of the entire baloon can cause the entire ballon to fail.
A small tear in a muscle can lead to greater failure if the muscle is under stress.
You only need to look at the movement of the ice each year. To see it flow and crack to understand that if you run an icebreaker through an area that was not previously cracked then your going to weaken it.
Some of these icebreakers make extensive journeys through the ice. How much do these icebreakers affect the cohesion of the pack. Whilst the passages they create might be small in comparison to the overall volume of ice, how do you know for a certain that an area of ice that has been split in 2 by the passage of an icebreaker won’t be more susceptible to melt?
Have any studies been done? If not then your answer must be that you don’t know what role icebreakers are playing.
David W says: October 21, 2010 at 9:03 pm
“Whilst the passages they create might be small in comparison to the overall volume of ice, how do you know for a certain that an area of ice that has been split in 2 by the passage of an icebreaker won’t be more susceptible to melt?”
This is an interesting point, especially when large sea ice floes can be blow into warmer waters. For example if you look at the icebreaker Healy’s Cruise Track for 2007;
http://www.icefloe.net/docs/HLY-07track.pdf
it is not hard to imagine how a fleet of icebreakers might have a measurable impact on sea ice melt.
For those interested, the US Coast Guard’s Icebreaker Science Operations site can be found here:
http://www.icefloe.net/cruisetrack.html
I see 2 potential threats from icebreakers but the biggest would be in allowing huge chunks to break off that then flow into warmer waters. Chunks that were they still attached to the larger sheet would not have done so.
The other threat would be if you put a passage through an otherwise solid sheet you end up with 2 sheets separated that can bump and grind against each other causing further ice loss.
I would be very curious to see a set of before and after images from the passage on an icebreaker.
The worst part of it is though, its likely that the majority of the damage could be occuring on the edges of the ice sheet where the ice is at its most susceptible. And each season the ice on the edges gets into poorer conditions allowing ice breakers to penetrate further into areas they previous might not have gone.
…and meanwhile, the sea surface temperature continues to plunge:
http://discover.itsc.uah.edu/amsutemps/execute.csh?amsutemps+001
It’s now approx 0.4 degree cooler than last year.
kuhnkat said:
October 21, 2010 at 11:26 am
The good doctor makes it sound like any one with an attention span could navigate through the passages. I would ask him why there were so many people requiring RESCUE this year if the conditions were so favaorable?
__________________________
I think the biggest rescue was a boat that ran aground, rather than ice, indeed if there had been more ice it might not have run aground 😉
Excellent article by Walt, and followup about Cryosat 2. I was wondering how to stitch together the new data with the old but it seems it won’t be as yet. However if it helps with the seasonal forecast then that will be great, especially as the current conditional change up there is making estimates too high at the moment. Perhaps SEARCH will be more accurate in 2011.
I’ll be interested to see if rbatemans 22M km^2 plays out, is that extent at the end of December rbateman? I think you called it for Dec rather than March????
Andy
I think this talk of ice breakers is baloney to be honest. It’s sort of like a flea biting an elephant, an elephant the size of 3 Manhattan’s (to quote that newest of SI measurements). 🙂
Andy
David W says: October 21, 2010 at 10:10 pm
“And each season the ice on the edges gets into poorer conditions allowing ice breakers to penetrate further into areas they previous might not have gone.”
Here is a progression of the US Coast Guard Icebreaker Healy’s Cruise Tracks from
2006 – 2008;
2006: http://www.icefloe.net/images/HLY-06annot.pdf
2007: http://www.icefloe.net/docs/HLY-07track.pdf
2008: http://www.icefloe.net/docs/healy2008.pdf
and I believe that this is a compilation of Healy’s Cruise Tracks from 2000 – 2005:
http://www.icefloe.net/images/healy_tracks2.jpg
The Healy seems to be doing what it is intended to do, i.e. breaking up the ice. In addition to science and exploration, the Coast Guard is tasked with opening and maintaining sea lanes, rescuing stranded boats, etc.
For context here a good article in the Coast Guard Compass on Healy included a good full-size pic at the end:
http://coastguard.dodlive.mil/index.php/2009/06/coast-guard-and-the-arctic-part-2/
I found this quote interesting;
“Key sea and air lanes need to remain open as a matter of international legal right and not depend on the approval from nations along the routes, so that vessels like Healy can get where they need to go and get there quickly.”
and this one amusing;
“Coast Guard Cutter Healy is the largest of the heavy ice breakers in the Coast Guard. Her ice breaking capabilities are 4.5 ft @ 3 knots continuous and 8 ft of ice when backing and ramming. Backing and ramming is pretty much what it sounds like and I don’t mean how you parallel parked a car when you were a teenager.”
Don’t forget about Carbon Black (Soot, not CO2) is a relatively new phenomena and is getting worse.
AndyW says:
October 21, 2010 at 11:10 pm
“I think this talk of ice breakers is baloney to be honest. It’s sort of like a flea biting an elephant, an elephant the size of 3 Manhattan’s (to quote that newest of SI measurements). :)”
I fail to see the comparison.
Tell me opening a 100 foot wide channel (this is the width of the largest ice breaker) 100’s of miles long in ice which is being compacted, dispersed and put under all sorts of pressure, will have no impact and I’ll suggest I think that your full of it.
Lots of ice is lost each year as it flows out the circle into warmer waters. How much of this ice was separated from bigger sheets by the action of icebreakers. Answer that before providing inane response like the one you provided above.
Oh and the icebreaker Healey mentioned in an earlier post is 82 feet wide. Do you have any idea how many miles of ice it has ploughed through in its short history of Arctic operations?
Walt, could you explain this change?: http://img821.imageshack.us/img821/7995/animateanda.gif
(The first image was provided by Fowler and Maslanik for the august ARCUS sea ice outlook. The second image is that used in the animation you posted above)
Why Fowler and Maslanik have changed their own sea ice age data??
Ice breakers would probably increase iceformation because they create so called polynyas (open areas of water) in the ice. The arctic ice sheet is not a contiunous icesheet but rather very dynamic with open areas cracks, ice floes stacking on top of eachother, ice crumbeling and freezing together again and so on. If this was not so the iceformation would be much lower because as soon as the ice sheet is solid ice formation slows to a crawl because the icesheet isolates the water from the cold air, blocks radiation and evaporation from the surface. Polynyas increase ice formation by allowing water to be exposed the the arctic cold. In other words, if you crack the ice the arctic waters will loose more heat. So actually strong winds will increase ice formation as log as the wind doesent blow the ice out of the arctic or bring warm water in contact with the ice.
David W, Walt Meiers also said it was not a factor, though he didn’t use the word baloney. My comment wasn’t inane, it precisely pointed out the size of the effect it has on the Arctic with a fun analogy.
A 100 mile channel 100 foot wide is approximately 5 Km^2 in area. The minimum ice extent is approximately 1 million times as much. If you instead take it as amount of new edge produced, 200 miles, then I would guess the fraction compared to the whole of the amount of ice edge in the Arctic is even less, a billionth?
I’m sure people “want” things to be true rather than accepting when things are not.
Andy
Note: Inconsistencies in the data of multiyear ice
http://translate.google.es/translate?u=http%3A%2F%2Fdiablobanquisa.wordpress.com%2F2010%2F10%2F22%2Faviso-inconsistencias-en-los-datos-de-hielo-multianual%2F&sl=es&tl=en&hl=&ie=UTF-8
[quote]This is a great question in that it encompasses something that I think is often misunderstood. The reason we know the ozone hole is different this time is that we know the chemistry. Scientists did experiments that demonstrated how under conditions in the Antarctic stratosphere, CFCs break down ozone. And studies were done that showed how CFCs emitted by humans work their way up into the stratosphere.[/quote]
That doesn’t explain why Antarctic ozone hole is larger than the Arctic one, when most of the CFC were consumed and produced in the Northern hemisphere.
There is no ozone hole, it is just that the ozone layer is thinner at the poles, The reason? Sun radiation is responsible or making ozone, and since there is less radiation in the poles, then the ozone layer is thinner.
And it has been always thinner in the south hemisphere. Do you want me to probe it. Look at the aboriginals of the southern hemisphere, they have darker skin than the ones of the northern hemisphere, to fight against the extra UV radiation.
AndyW says:
October 22, 2010 at 3:00 am
David W, Walt Meiers also said it was not a factor, though he didn’t use the word baloney. My comment wasn’t inane, it precisely pointed out the size of the effect it has on the Arctic with a fun analogy.
A 100 mile channel 100 foot wide is approximately 5 Km^2 in area. The minimum ice extent is approximately 1 million times as much. If you instead take it as amount of new edge produced, 200 miles, then I would guess the fraction compared to the whole of the amount of ice edge in the Arctic is even less, a billionth?
I’m sure people “want” things to be true rather than accepting when things are not.
Andy
Walt Meier’s comments seem to indicate he hasnt even explored the possiblity but rather just glibly dismissed it without thinking about it. But I guess when you work for an organisation that is not prepared to look at anything beyond CO2 as a cause of Arctic Ice loss, his response isnt surprising.
Now lets look at your argument on ice edge. The circumference of the entire arctic circle is only about 17,000km. Even given a degree of break up during the melt season I think your argument of the a 100mile or 160km channel (and thats from one icebreaker) being only a billionth of the total ice edge is clearly ludicrous. Perhaps if the entire arctic was split into 1km blocks you might be close to being right but this clearly isnt the case.
It is very clear that icebreaker activity from not just one but many ships operating in the area is crisscrossing the ice edge with mazes of channels. This is allowing large chunks of ice to break off and be transported out the circle.
As far as Peter arguments go, they dont seem to make much sense either. Your argument is only valid if the ice stays in one spot. Unfortunately it doesnt, it moves around and flows into places like the Fram Strait where it then gets transported into warmer waters.
If you were right Peter, then arguments about rotten ice make little sense. We’d see a lot more Polynyas and by your logic the entire Arcitc should have refrozen this melt season with so many patches of open water.
I suspect your argument about polynyas is probably more relevant to ice inside of 80N. If you look at the path of most of the Healy’s trips they are predominantly around the edges. It is this icebreaker acttivity around the edges which has to be the most damaging to the ice pack.
David W says:
October 21, 2010 at 10:10 pm
I see 2 potential threats from icebreakers but the biggest would be in allowing huge chunks to break off that then flow into warmer waters. Chunks that were they still attached to the larger sheet would not have done so.
The other threat would be if you put a passage through an otherwise solid sheet you end up with 2 sheets separated that can bump and grind against each other causing further ice loss.
OK but look at the state of the ice, it’s not that pristine solid sheet. Look at today’s MODIS image, all that MYI north of the Alaskan coast, all that fracturing is caused by wind and current not ice breakers.
http://rapidfire.sci.gsfc.nasa.gov/realtime/single.php?T102942055
The same area in June before any icebreakers:
http://rapidfire.sci.gsfc.nasa.gov/realtime/single.php?T101622120
Urederra says:
October 22, 2010 at 5:39 am
[quote]This is a great question in that it encompasses something that I think is often misunderstood. The reason we know the ozone hole is different this time is that we know the chemistry. Scientists did experiments that demonstrated how under conditions in the Antarctic stratosphere, CFCs break down ozone. And studies were done that showed how CFCs emitted by humans work their way up into the stratosphere.[/quote]
That doesn’t explain why Antarctic ozone hole is larger than the Arctic one, when most of the CFC were consumed and produced in the Northern hemisphere.
Actually it does, via the reaction kinetics and the fact that the antarctic stratosphere is colder than the arctic which favors the breakdown of the O3. The CFCs are so longlived that they distribute through the atmosphere regardless of where they are released.
Did any of the NW passage expeditions use the deepwater northern route through Viscount Melville Sound and McClure Strait? If not, why not?
Lyle says:
October 21, 2010 at 7:02 pm
Small item:
You imply that Amundsen took three seasons to complete the NW passage because of ice conditions. In fact he spent two of those seasons at Gjoa Haven on King William Island studying the north magnetic pole which, at that time, was in that immediate vicinity.
And couldn’t have left by sea if he’d wanted to! When he left Gjoa Havn in 1905 (the ice opened permitting their departure in early August) he cleared the Archpelago by August 17th but was trapped in ice near Herschel island (early september) for the third winter before he could make the Bering strait (he wasn’t able to leave until August 1906). That’s why he trekked overland to send the telegram saying that he’d cleared the NW passage, if he’d been able to sail into Nome he would have done so. That route is clear today (oct22), it closed up in early september in 1905.
According to NSIDC website, “In summer, the passages created by icebreakers do increase local summertime melting because the ships cut through the ice and expose new areas of water to warm air. However, the melt caused by an icebreaker is small and localized. Channels created by icebreakers are quite narrow and few in number compared to natural gaps in the ice. In winter, any openings caused by icebreakers will quickly freeze over again. So, scientists do not think that icebreakers play a significant role in accelerating the decline in Arctic sea ice.”
http://nsidc.org/arcticseaicenews/faq.html#icebreakers
Here’s a report from Baltic Ice Management (BIM) on their 2008 – 2009 season;
http://portal.fma.fi/sivu/www/baltice/BIM_Joint_Annual_2008_2009.pdf
if you look at the chart on page 10 it seems that they had 23 icebreakers in use at the peak of their icebreaking season.
Here is clearly biased and poorly moderated video from ABC News, which offers some good live shots of the Healy in action:
http://abcnews.go.com/video/playerIndex?id=7454844
Just some disparate information from the interwebs, but based on my cursory search it does not appear that anyone has done a study to evaluate the impact that increasing icebreaking activity may have on sea ice area and extent.
Welcome Walter Meier,
Bipolar correlation of volcanism with millennial climate change — PNAS
http://www.pnas.org/content/101/17/6341.full#fn-group-1
Check it yourself…
http://www.volcano.si.edu/world/find_eruptions.cfm
This is what’s trying to happen. Like do you believe it couldn’t happen again because of man? Well man’s emissions couldn’t begin to compare. I find you and Thomas Fuller asinine. Sorry
Thank you Dr. Meier for your reply.
Ed Murphy says:
October 22, 2010 at 7:55 am
This is what’s trying to happen. Like do you believe it couldn’t happen again because of man? Well man’s emissions couldn’t begin to compare. I find you and Thomas Fuller asinine. Sorry
I’m sure the feelings mutual, and I for one agree with them.
“””” Phil. says:
October 22, 2010 at 6:08 am
Urederra says:
October 22, 2010 at 5:39 am
………………………………………….. And studies were done that showed how CFCs emitted by humans work their way up into the stratosphere.[/quote]
That doesn’t explain why Antarctic ozone hole is larger than the Arctic one, when most of the CFC were consumed and produced in the Northern hemisphere.
Actually it does, via the reaction kinetics and the fact that the antarctic stratosphere is colder than the arctic which favors the breakdown of the O3. The CFCs are so longlived that they distribute through the atmosphere regardless of where they are released. “”””
Phil, The absence of your insight has been noted.
George.
George E. Smith says:
October 22, 2010 at 9:47 am
Phil, The absence of your insight has been noted.
George.
Sorry George it’s a busy term teaching, you’ll doubtless be pleased you know that I’ve increased my productivity by ~33%. In deference to my chairman’s wishes I have allowed my class size to increase from 60 to 80!
David W said:
Walt Meier’s comments seem to indicate he hasnt even explored the possiblity but rather just glibly dismissed it without thinking about it.
______________________
Someone else has shown this not to be true, thanks just the facts.
As for your other comments, no scientific paper has proposed ice breakers to be a major factor, only you, who is not an expert. If you continue to cling to this wishful thinking then you will soon fall into the crank status as defined by wikipedia most elequantly. Go read it and have a ponder.
Andy
“”””” Phil. says:
October 22, 2010 at 12:08 pm
George E. Smith says:
October 22, 2010 at 9:47 am
Phil, The absence of your insight has been noted.
George.
Sorry George it’s a busy term teaching, you’ll doubtless be pleased you know that I’ve increased my productivity by ~33%. In deference to my chairman’s wishes I have allowed my class size to increase from 60 to 80! “””””
Doing it with one hand tied behind your back ??
I had 200 students in my Freshman Pre-med Optics and Atomic Physics class, so I had to take half of them and then recuperate for an hour, and then work over the other half. Couldn’t ad lib anything, because they would compare notes and go ape If I didn’t tell them all exactly the same thing.
That’s when I decided that Engineering was more up my alley.
George
Thanks so much for taking the time to give such an outstanding and thorough overview. I found your points about the PIPS 2.0/PIOMAS model differences especially interesting and enlightening. I’m sure you, like many of us, look forward to the CryoSat 2.0 data and and then even more so, to ICESat 2.0 in 2015.
AndyW says: October 22, 2010 at 1:05 pm
“As for your other comments, no scientific paper has proposed ice breakers to be a major factor, only you, who is not an expert. If you continue to cling to this wishful thinking then you will soon fall into the crank status as defined by wikipedia most elequantly. Go read it and have a ponder.”
Clinging? David W has made a few comments exploring an interesting hypothesis. This is how the process of scientific exploration works, and one doesn’t have to be an “expert” to participate. In terms of Wikipedia, it states that, “A “cranky” belief is so wildly at variance with commonly accepted belief as to be ludicrous.”:
http://en.wikipedia.org/wiki/Crank_%28person%29
Nothing that David W has said comes close to being “wildly at variance with commonly accepted belief “, as NSIDC stated, “In summer, the passages created by icebreakers do increase local summertime melting because the ships cut through the ice and expose new areas of water to warm air.” It appears to be a commonly accepted belief that icebreakers help melt summer sea ice, thus the real question is one of magnitude. In such circumstances the reasoned position is to withhold judgment until sufficient research can be conducted in order to serve as the basis for a well informed decision. Perhaps it is you who should ponder why you have passed judgment based upon such a limited amount of available data/research…
“Actually it does, via the reaction kinetics and the fact that the antarctic stratosphere is colder than the arctic which favors the breakdown of the O3.”
That doesn’t make any sense. Reactions go faster in warmer conditions than in colder conditions.
Specially radical reactions, where the limiting step is the transition state that generates the radical species. The energy needed to break down CFCs and form radical species comes from the sun (UV light). Less radiation (in the poles) means less radical formation, and therefore slower kinetics.
Radical species have high potential energy and once they have been formed they can react easily and the products have lower potential energy (exothermic reactions) , So, the limiting step that controls the reaction kinetics is the first, energy costing step, the radical formation, and not the second. And this step goes faster in high radiation conditions than in low radiation conditions.
http://pubs.rsc.org/en/Content/ArticleLanding/2007/CP/b705934e
(for an example of potential energies of organic radicals. Please note that the species with highest potential energy is the cyclohexane radical)
AndyW says:
October 22, 2010 at 1:05 pm
David W said:
Walt Meier’s comments seem to indicate he hasnt even explored the possiblity but rather just glibly dismissed it without thinking about it.
______________________
Someone else has shown this not to be true, thanks just the facts.
As for your other comments, no scientific paper has proposed ice breakers to be a major factor, only you, who is not an expert. If you continue to cling to this wishful thinking then you will soon fall into the crank status as defined by wikipedia most elequantly. Go read it and have a ponder.
Andy
Nice one Andy, when you cant properly discuss an idea, which you really havent tried at any stage, then resort to an ad hominem attack. The standard operating procedure of an AGW supporter.
Again, does NSIDC have any scientific evidence to back their assertion “… However, the melt caused by an icebreaker is small and localized. Channels created by icebreakers are quite narrow and few in number compared to natural gaps in the ice.”. Lets see some hard facts and data. I’m more than open to this.
It should be relatively easy for you, Walt or anyone at the NSIDC to present that evidence here and I’ll gladly reconsider my position. Otherwise you have more work to do. I suspect, as mentioned previously, Walt and/or the NSIDC have never seriously looked at this because their agenda is to prove AGW is destroying the icepack. They are simply not being paid to find other factors but rather being paid not to.
Phil, I spent a lot of time looking at the Modis images whilst this melt season wore on. Sure there are areas the ice is already broken up at the edges. There were also big areas where solid sheets remained intact. An icebreaker is not needed to break up areas that are already broken up. Do icebreakers operate where there are “natural gaps” in the ice or where the ice sheets are more solid?
Do you have close up before and after MODIS images of where icebreakers have been operating? That would be the simplest way of debunking what I’m proposing.
Seriously guys, if you want to eliminate the possiblity that icebreakers are causing increased ice loss, it shouldnt be hard to do if the idea is such a crackpot one. But simply saying well the NSIDC says so wont cut it I’m afraid.
Some nice Canadian graphs of ice.
http://www.socc.ca/cms/en/socc/seaIce/pastSeaIce.aspx
What a joy to sit under Walt Meiers teaching, if only for an hour! This one is worth a bookmark and a reread later.
I, for one, am intrigued by the hypothesis that icebreakers matter. The Arctic is a big place, especially compared to a ship, but a small difference at the margins can add up over time. While the ice exiting through the Fram strait is only part of the ice loss, a small increase in that loss could be significant over time. If broken up ice is more easily moved by the Beaufort Gyre, then the icebreakers could affect this.
It’s a stretch but I don’t think it can just be dismissed as silly. A quantitative analysis is merited.
On Lindsay’s web site, the PIOMAS July forecast for minimum extent was 3.7 million km^2, not 4.7 as Dr. Meier reported here.
http://psc.apl.washington.edu/lindsay/September_ice_extent.html
David W says:
October 22, 2010 at 4:24 pm
Phil, I spent a lot of time looking at the Modis images whilst this melt season wore on. Sure there are areas the ice is already broken up at the edges.
Good for you, look at the ones I posted and note the extensive regions on them broken up by natural processes. At the posted resolution a pixel represents 2km and even at maximum zoom a pixel is 250m.
There were also big areas where solid sheets remained intact. An icebreaker is not needed to break up areas that are already broken up. Do icebreakers operate where there are “natural gaps” in the ice or where the ice sheets are more solid?
Mostly round harbors and along supply routes such as through the NW passage in August and September where the ice is already fragmented. Ships such as the Healey spend summers on research such as the one this summer where a large part of the time was spent in ‘rotten ice’:
http://mgds.ldeo.columbia.edu/healy/reports/aloftcon/2010/20100628-0401.jpeg
Do you have close up before and after MODIS images of where icebreakers have been operating? That would be the simplest way of debunking what I’m proposing.
Not possible, at maximum resolution the Healey would be smaller than a single pixel!
The PIOMAS July forecast was 25% too low, and my PIPS based forecast was 11% too high.
Which one was closer, Walt?
http://psc.apl.washington.edu/lindsay/September_ice_extent.html
Thank you Dr. Meier for your reply.
More disparate information, i.e. here is a 2004 map of Arctic Summer Shipping Lanes;
http://newsroom.ucla.edu/portal/ucla/srp-view.aspx?id=111609
here is list of icebreakers from Wikipedia;
http://en.wikipedia.org/wiki/List_of_icebreakers
and this, the “Arctic Marine Shipping Assessment 2009 Report. Arctic Council, April 2009, second printing” offers a wealth of information;
http://www.pame.is/images/stories/PDF_Files/AMSA_2009_Report_2nd_print.pdf
including this on Page 4;
“There were approximately 6,000 individual vessels, many making multiple voyages, in the Arctic region during the AMSA survey year; half of these were operating on the Great Circle Route in the North Pacific that crosses the Aleutian Islands. Of the 6,000 vessels reported, approximately 1,600 were fishing vessels.”
Arctic maps including shipping lanes with estimates of 2004 Number of Trips and Fishing Vessel Days, Map 1.1 Page 10;
this on Page 5;
“Black carbon emissions from ships operating in the Arctic may have
regional impacts by accelerating ice melt.”
a chart of “Vessels Reported in the Circumpolar North Region, 2004” broken out by Vessel type and Country, in Table 5.1 on Page 71;
this on Page 79;
“A specific example of where cruise ship traffic is increasing at a rapid rate is off the coast of Greenland. As Table 5.3 shows, cruise ship visits and the number of passengers visiting Greenland has increased significantly between 2003 and 2008. For example, between 2006 and 2007, port calls into Greenland increased from 157 to 222 cruise ships. The number of port calls in 2006 combined for a total of 22,051 passengers, a number that represents nearly half of Greenland’s total 2006 population of 56,901.
In 2008, approximately 375 cruise ship port calls were scheduled for Greenland ports and harbors, more than double the number of port calls seen in 2006.”
this on Page 81;
In the AMSA 2004 database, 83 of this type of ship were reported; however, several Arctic states did not include government vessels in their submission so the total for this category is likely larger. In keeping with the scope of the Arctic Council, naval or military vessels were not included in the AMSA database.
this Page 84;
“During 2004-2008, there were 33 icebreaker transits to the North Pole for science and tourism. An increasing number of icebreakers and research vessels are conducting geological and geophysical research throughout the central Arctic Ocean related to establishing the limits of the extended continental shelf under UNCLOS.”
this on Page 84;
“Map 5.6 demonstrates the surge in vessel activity in the summer season, when all of the community re-supply takes place and most bulk commodities are shipped out and supplies brought in for commercial operations. Summer is also the season when all of the passenger and cruise vessels travel to the region.”
this on Page 137;
“The 2004 U.S. Commission on Ocean Policy reported that, while at sea, the average cruise-ship passenger generates about eight gallons of sewage per day and an average cruise ship can generate a total of 532,000 to 798,000 liters of sewage and 3.8 million liters of wastewater from sinks, showers and laundries each week, as well as large amounts of solid waste (garbage). The average cruise ship will also produce more than 95,000 liters of oily bilge water from engines and machinery a week. Sewage, solid waste and oily bilge water release are regulated through MARPOL. There are no restrictions on the release of treated wastewater.”
this on Page 140:
“Shipping’s contribution to regional and global impacts from emissions such as CO2, NOx and SO2 have been evaluated by scientists and shown to be significant enough to motivate policy action. However, environmental and climate effects of NOx and ozone, sulfur aerosols and clouds, and black carbon particles in the Arctic are only beginning to be understood. Black carbon has been proven to have significant climate forcing effects, in addition to its effects on snow and ice albedo, accelerating the retreat of Arctic sea ice.”
this on Pages 141 – 142;
“The AMSA has developed the world’s first activity-based estimate of Arctic marine shipping emissions using empirical data for shipping reported by Arctic Council member states. Emissions were calculated for each vessel-trip for which data was available for the base year 2004. The 515,000 trips analyzed represent about 14.2 million km of distance traveled (or 7.7 million nautical miles) by transport vessels; fishing vessels represent over 15,000 fishing vessel days at sea for 2004. Some results could be an underestimation of current emissions, given potential underreporting bias and anecdotal reports of recent growth in international shipping and trade through the Arctic.”
this on Page 142;
Black carbon is a component of particulate matter produced by marine vessels through the incomplete oxidation of diesel fuel. The release and deposition of BC in the Arctic region is of particular concern because of the effect it has on reducing the albedo (reflectivity) of sea ice and snow. When solar radiation is applied, reduced albedo increases the rate of ice and snow melt significantly, resulting in more open water, and thereby reducing the regional albedo further. In the Arctic region in 2004, approximately 1,180 metric tons of black carbon was released, representing a small proportion of the estimated 71,000 to 160,000 metric tons released around the globe annually. However, the region-specific effects of black carbon indicate that even small amounts could have a potentially disproportionate impact on ice melt and warming in the region. More research is needed to determine the level of impact this could have on ice melt acceleration in the Arctic and the potential benefits from limiting ships’ BC emissions when operating near to or in ice-covered regions. The potential impacts of black carbon should also be a point of consideration when weighing the costs and benefits of using in-situ burning of oil in spill response situations.”
and this on Page 160;
“Spring break-up to mark the start of summer navigation will vary and, as happens now in more southerly seas, shippers eager to start work will test the limits of their vessels in ice.”
fishnski says:
October 19, 2010 at 3:17 pm
….Meanwhile..The arctic has turned Less cold & from what I can tell will stay that way for a few. I was surprised to see the gain we had yesterday & I hope i’m surprised again tomorrow & the next but i’m thinking not. Any thoughts??
I posted this on sea ice news 27 with no response & since then the ice gain has slowed considerably.
We have a whole lot of speculative climotologists & Scientists here who come up with very interesting thoughts & facts but what I miss is a great Meteorologist who can explain what is happining real time & can give forecasts.
I gather as much info as I can on the internet & try to figure out how the northern hemi is coming along & made that last predict but I also thought the Beach at Barrow would have frozen over by now which it hasn’t so I would rather have a pro way in…
Dr. Meier info under heading Paleo Records of Sea Ice:
“….the most recent and comprehensive analysis of all available proxy sea ice records, published earlier this year (Polyak et al., 2010 – note that Polyak is a co-author on the 2006 paper), indicates that current total Arctic-wide sea ice extents are likely lower than any time in the last several thousand years and are “not explainable by known natural variabilities”. The data are still sparse, but this is the best information we have at the moment.”
I find the “several thousand years” hard to swallow: Greenland around 970 AD (Eric the Red with Viking settlements) – the MWP. The ice loss had to be much greater.
Also, I didn’t see any reference to the 30 year PDO, its prior shift around 1979 when first satellite data started, and the new shift which should cool the oceans/planet for 20-30 years.
My gratitude and congratulation to Dr. Meier. A very well written article. If such articles and openness were characteristic of those concerned about AGW, then the skeptic community likely would not have Anthony Watts or Steve McIntyre. This is a big step forward. Granted, the long-standing Al Gore quote on the NSIDC website and frequent discussions of death spirals in mainstream media have created a long journey back to credibility, but Meier’s article was a big step forward.
I would be interested in the reaction of both Mr. Gates and Steve Goddard to this statement of Dr. Meier’s: “This summer was not particularly extreme in terms of ice motion. There were times during the summer where the ice pack was pushed together in some places, while at other times the motion was not a factor or even pushed the ice edge outward.” Did this summer have 2007 characteristics? Or were winds and cloud cover quite typical?
Urederra says:
October 22, 2010 at 3:42 pm
“Actually it does, via the reaction kinetics and the fact that the antarctic stratosphere is colder than the arctic which favors the breakdown of the O3.”
That doesn’t make any sense. Reactions go faster in warmer conditions than in colder conditions.
That’s where a little knowledge is a dangerous thing, the reaction is catalyzed by the presence of polar stratospheric clouds.
Specially radical reactions, where the limiting step is the transition state that generates the radical species. The energy needed to break down CFCs and form radical species comes from the sun (UV light). Less radiation (in the poles) means less radical formation, and therefore slower kinetics./em>
This is not an accurate description of the mechanism.
Actually it is. Clearly you had a big problem with chemistry 101. You said:
“Actually it does, via the reaction kinetics and the fact that the antarctic stratosphere is colder than the arctic which favors the breakdown of the O3.”
In reality is just the opposite. higher temperatures leads to higher reaction rates. As you can read on wikipedia or in the first lesson of any general chemistry book:
http://en.wikipedia.org/wiki/Chemical_kinetics#Temperature
(quoted from there)
“Temperature usually has a major effect on the rate of a chemical reaction. Molecules at a higher temperature have more thermal energy. Although collision frequency is greater at higher temperatures, this alone contributes only a very small proportion to the increase in rate of reaction. Much more important is the fact that the proportion of reactant molecules with sufficient energy to react (energy greater than activation energy: E > Ea) is significantly higher and is explained in detail by the Maxwell–Boltzmann distribution of molecular energies.”
So, it is your explanation about colder temperatures in the Antarctica favouring O3 breakdown what doesn’t make any sense under chemical kinetics theory.
Urederra says:
October 25, 2010 at 6:06 am
Phil. says:
October 23, 2010 at 5:00 pm
“This is not an accurate description of the mechanism.”
Actually it is. Clearly you had a big problem with chemistry 101. You said:
“Actually it does, via the reaction kinetics and the fact that the antarctic stratosphere is colder than the arctic which favors the breakdown of the O3.”
In reality is just the opposite. higher temperatures leads to higher reaction rates. As you can read on wikipedia or in the first lesson of any general chemistry book:
As I said above, ‘a little knowledge is a dangerous thing’ and in order to understand this reaction mechanism you need to go a little beyond 101! The statement you made about the effect of the increase in temperature on reaction rate only applies to simple single step reactions, not multistep radical reaction systems. My Ph.D. thesis was on the subject of such reactions which have a negative temperature coefficient of rate. In the case of the O3 destruction mechanism a key catalytic step is the heterogeneous reaction on Polar stratospheric ice crystals which only exist at ~-80ºC. It is the reduction of temperature to that level which promotes the destruction mechanism and the rapid drop in O3 concentration.
I have a question for Dr. Meier, though I doubt that he’s still following this thread: The program that NSIDC uses to compute sea ice concentrations contains a function that has 89 “if” statements, 19 “else if” statements, and a “switch” block with 23 “case” statements. The 89 “if” statements alone would mean over 60 million possible processing paths (2^89) through the function. Since it is impossible to test such a function, it is clear that NSIDC cannot know whether their program is working correctly. Therefore, what confidence should we have in the sea ice concentrations that NSIDC reports?
I was way off. 89 “if” statements actually means about 6,500,000,000,000,000,000,000 permutations. There’s no way to verify a program like that.
stevengoddard
On Lindsay’s web site, the PIOMAS July forecast for minimum extent was 3.7 million km^2, not 4.7 as Dr. Meier reported here.
Could Walt Meier perhaps be referring to Zhang’s prediction?
The amount of data for the satellite period is orders of magnitude greater than for paleo records, and much more direct. Observations of sea ice cover in the satellite period is vastly more robust than paleo records from natural proxies. Also, paleo records indicate more Arctic ice cover over the last few thousand years than present. The 2006 paper Walt refers to looked at a tiny portion of the Arctic (part of the Cukchi Sea). He mentions the 2010 paper (also authored by Polyak), which estimates Arctic-wide sea ice cover has not been as low as today for thousands of years. That’s not definite, of course, just the best estimates we have.
Dr Walt Meier said
That’s a pretty polite way to say CO2 and other greenhouse gases are heating up the planet, and there is not much evidence on the contrary.
Didn’t anyone else pick that up? 🙂
Ray Aronson writes,
“I find the “several thousand years” hard to swallow: Greenland around 970 AD (Eric the Red with Viking settlements) – the MWP. The ice loss had to be much greater.”
No, I don’t think there’s evidence for that. Comparing the GISP2 temperature reconstruction (widely used to illustrate the MWP) with recent measurements suggests that central Greenland temperatures probably were cooler at the height of the MWP than they are today.
The Norse sites were not ice covered then, but they’re not ice covered today either; nor are those fjords choked with ice.
Gneiss stated……..”Comparing the GISP2 temperature reconstruction (widely used to illustrate the MWP) with recent measurements suggests that central Greenland temperatures probably were cooler at the height of the MWP than they are today.”
1. Don’t understand what the “recent measurements” are.
2. My search on GISP2 showed temperature changes recorded in the GISP2 ice core from the Greenland Ice Sheet to be significantly higher during MWP than temperature today. That is the reason for my item 1. (I may not have your ability to find the latest chart), and I also noticed you referenced central Greenland vs my Greenland Ice Sheet. Thanx
Desmong,
“Didn’t anyone else pick that up? :-)”
-Yes, it jumped right out at me!
Ray Aronson writes,
“1. Don’t understand what the “recent measurements” are.”
Papers by Shuman et al. and by Steffen give mean annual Summit temperatures around -29.4 C (87-99) or -29.1 C (95-99).
“2. My search on GISP2 showed temperature changes recorded in the GISP2 ice core from the Greenland Ice Sheet to be significantly higher during MWP than temperature today.”
No so. In Alley’s temperature reconstruction the warmest single year since 500 AD is -30.4 C.
The modern instrumental and older proxy records don’t make for perfect comparisons, but they’re what we have to work with.
A snowstorm of deceptively labeled graphs, that seem to show GISP2-based temperatures from the MWP higher than today, are floating ’round the Internet. Their trick, which fools many, consists of hiding the fact that the GISP2 temperature reconstruction doesn’t go anywhere near “today.” It ends in mid-19th century.