By Steve Goddard
Summer has come to a premature and frosty end at Santa’s workshop.
")
http://psc.apl.washington.edu/northpole/webphotos/noaa2.jpg
It has been the coldest summer on record north of 80N, and temperatures have dropped below freezing ahead of the average date.
")
The entire ice covered region is now below freezing.
")
http://www.esrl.noaa.gov/psd/map/images/fnl/sfctmp_01.fnl.gif
It also appears that the summer melt season will be the shortest on record. The maximum was reached very late in March, and it appears likely that we are headed for an early minimum.
")
Mark Serreze at NSIDC has stated :
As the climate warms, the summer melt season lengthens …”
He was also reported as saying :
Mark Serreze of the center forecast the ice decline this year (2010) would even break 2007’s record.
Another interesting fact is that we are almost certain to see a large increase in the amount of multi-year ice (MYI) next year. The reason being that almost all of the 1-2 year old ice (turquoise) in the NSIDC map below will become classified as MYI next spring.
")
We have seen a remarkably rapid recovery from the 2008 low volume.
PIOMAS continues to report record low volumes of ice, despite all evidence to the contrary. The image below shows in red how far off the mark their August 15 forecast was. Their modeling error will get much worse over the next two weeks – because they model much of the thick multi-year ice in the Beaufort Sea and Arctic Basin as only a few tens of centimetres thick.

With the cold temperatures, ice area loss has almost stopped.

http://arctic-roos.org/observations/satellite-data/sea-ice/observation_images/ssmi1_ice_area.png
However, ice extent continues to drop – because the Arctic Oscillation has turned negative and winds are compacting the ice towards the pole. This bodes well for continued growth of ice in 2011.
")
http://www.ijis.iarc.uaf.edu/seaice/extent/AMSRE_Sea_Ice_Extent.png
PIPS shows average ice thickness increasing, due to the compression of the ice.
")
There has not been a lot of ice loss during August. The modified NSIDC image below shows in red, areas that have lost ice since August 1. Note that the Greenland Sea appears to have lost ice. This is due to the fact that there has been very little transport out of the Arctic Basin through the Fram Strait, which again bodes well for ice gain in 2011.

The modified NSIDC image below shows ice gain since 2007.

NSIDC maps continue to show more gain (16%) than their graphs (10%.) I have not been able to get a satisfactory explanation from them about the cause of that discrepancy. DMI shows a 25% gain in 30% concentration ice over 2007.
My forecast (dashed line below) minimum of 5.5 million (JAXA) continues to look conservative. It all comes down to what the winds do over the next few weeks. If the winds keep compressing the ice, the minimum may go a little below 5.5. If the winds quiesce, the minimum may come in a little above 5.5 – which is looking like a pretty good number right now. Some people at NSIDC started out with a 5.5 forecast this year, but seem to have backed away from it since.

Academic theories about the Northwest Passage becoming a commercial shipping opportunity appear pretty clueless.
“The plans that you make can change completely,” he says. This uncertainty, delay, liability, increased insurance and other costs of using the Northwest Passage are likely to deter commercial shipping here. A ship with a reinforced hull could possibly make it intact through the passage. But if it got stuck, it would cost thousands of dollars for an icebreaker like the Amundsen to come to the rescue. So even if the Northwest Passage is less ice-choked than before, the route may not become a shipping short-cut in the near future, as some have predicted.
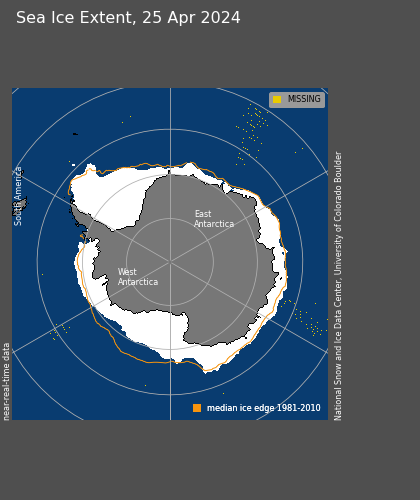
The South Pole will almost certainly set a record for most sea ice this season. It is almost there, and there are still several months of growth remaining.
")
http://www.iup.uni-bremen.de:8084/amsr/ice_ext_s.png

http://nsidc.org/data/seaice_index/images/daily_images/S_daily_extent.png
As seen below, the symmetry between the North and South Pole is impressive through the satellite record. They always seem to move opposite each other and produce an approximately constant amount of sea ice. It would be nice if the experts focused on solving this relationship rather than making up forced explanations like the “Ozone Hole” – which has just started forming for the year and will be gone before Christmas.

UIUC North/south anomalies overlaid on top of each other.
http://arctic.atmos.uiuc.edu/cryosphere/IMAGES/seaice.anomaly.arctic.png
http://arctic.atmos.uiuc.edu/cryosphere/IMAGES/seaice.anomaly.antarctic.png
(Note to posters and ice experts. Before you embarrass yourself making comments about how seasons are out phase at opposite poles, remember that this is normalised data and the period is in excess of 30 years.)
Conclusions:
The “long term trend” (30 years) in Arctic ice continues to be downwards, and would be even if the ice minimum was a record high this summer. But the three year trend shows strong growth of extent, thickness and age. Meanwhile, Antarctic ice is blowing away the record books. Yet the press continues to spread massive disinformation about the state of ice at both poles. Who could possibly be responsible for that?
Sponsored IT training links:
Get COG-112 materials along with 352-001 dumps to practice and pass 000-977 exam in timely and cost saving manners.
Morning Gates
Great article, please keep pushing on the disparities between different sea ice measurements. How can they differ so much? Also, the data that is most striking is the sea ice thickness in the Arctic in 2007, when supposedly we had little ice. As you have stated previously, the thickness makes up for the lack in extent, even in 2007.
Amazingly bad science by the national labs here, only eclipsed by Mann and possibly the idiots using proxies for sunspot number/solar output.
Something must have happened in the atmosphere or sea currents have been changed. Otherwise I find no explanations for it.
How will they spin the outcome to make it consistent with the orhodoxy if arctic ice extent and area are greater than in 2009? It will be easy to state the trend towards ice-free arctic continues if they are less. I can already picture all the reports and “studies” claiming that 2008 and 2009 were mere blips in a long-term trend!
Steve, the maps show even more Global Sea Ice extent then yesterday.
http://arctic.atmos.uiuc.edu/cryosphere/IMAGES/seaice.anomaly.arctic.png
Arctic: -1.294, up by almost .6 in a day.
Antarctic: 1.451, up by 1.5 in a day, approaching a record high, AGAIN
http://arctic.atmos.uiuc.edu/cryosphere/IMAGES/seaice.anomaly.antarctic.png
Global Sea Ice is Above Normal, to a modest proportion.
http://arctic.atmos.uiuc.edu/cryosphere/iphone/iphone.currentarea.global.html
-Snowlover123
Can you explain why pips shows latitude circles so clearly? I mean, I’ve heard it’s a model and not data. I might think that it shows thickness increasing because of date not fact. Also, there is only the arctic basin ice remaining and not many isolated melting areas. But the less ice border there is, the less thin ice there is, of course, which means average thickness increasing. But you say:
“PIPS shows average ice thickness increasing, due to the compression of the ice.”
Couldn’t you say a bit more about this? How are the pips thickness numbers construed? Further, wasn’t it deviced long ago by the same people who have now studied the phenomena 20 more years and are now at the NSIDC claiming thinning of the ice?
Browsing the Arctic temp here:
http://ocean.dmi.dk/arctic/meant80n.uk.php
This is unlike any other mid-August EXCEPT 2001. I wonder if there’s anything to be learned from looking at how the ice behaved in late August 2001.
However, this year, there is a second unusual effect — no ice is migrating through the Fram Strait right now. I don’t know how unusual this is but I’ve never seen a gap like that before.
http://nsidc.org/data/seaice_index/images/daily_images/N_daily_extent_hires.png
This could have big implications for next year.
5.5 million?
The Arctic would have to set a record low melt for the period August 14 to September 15. Slim chance, but can’t be excluded of course. I think we’ll get closer to 5 million.
Ahhh, but no need to worry, the folks funded by our tax dollars continue to push the AGW meme – why in the world would the videos available only show the period to 2006, and only in the Arctic? Hmmmm….why would that be….?
http://arctic.atmos.uiuc.edu/cryosphere/
Any thoughts on what this portend for the continental US this coming winter? I’m think early…
Where did you get the data for the last (red and green) graph? I am interested in shifting one of the data sets by 6 months to see how well they follow each other — just out of curiosity. — John M Reynolds
I don’t see any indication of significant melt occurring. It is compaction, not melt, we are seeing.
Hoskald-
I have asked this previously, it might make sense that a cold, early Arcitc would lead to a cold NA, but, noone has ever answered…
Mind experiment:
The map Frederick linked to shows that during the period when “average” was calculated, ice generally invaded Fram Strait and showed up as ice extent, even though it was likely on its way leaving for warmer waters. The Arctic Oscillation and weather systems likely set up a wind pattern that forced ice South in order to accomplish this. This tells me that during the period when “average” was calculated, it would be instructive to see how often the wind blew ice south compared to when the wind blew ice north.
So it stands to reason that if there is a multi-decadel pattern to this wind shift, and the wind begins to generally blow ice north year to year during the Summer, the Arctic will gain ice during the Winter. Lots and lots of ice. Now, during the winter when melting is not a concern, if Arctic cold air invades the lower latitudes, WE will gain ice. Lots and lots of ice. Rivers could begin to freeze from the bottom up and Lakes from the top down. This type of thing causes ice jams and frozen flooding, and is cold enough to freeze sewer systems. All of these things are indeed cause for regional-wide crisis management, and usually all winter long, not just during a “cold spell”.
One of the tenets of ice buildup (some call it recovery) says that lack of summer melt is the best indicator of an eventual return to abundant Arctic ice. I don’t know why they call it a “recovery” because under the above circumstances, the Earth’s flora and fauna struggle to recover from ice buildup, and some do not.
Steve,
Great post.
This year’s arctic sea-ice has been a continuation of arctic ice growth since 2007. Looking into the future (5-10-30 years) could 2007 be a local arctic sea-ice minimum with following years showing ever more arctic sea-ice? Antarctic sea-ice is high in comparison to the records for the last 30 years. I realize it is highly speculative to say this, but what if we are at a turning point in global temperatures?
The melt ponds are have frozen solid in front of the NOAA pole cam and if they have frozen then its certain that all the other melt ponds are also frozen or freezing.
So much for the positive feedback theory as dictated by our esteemed colleague R Gates in which melt ponds would absorb the suns energy and melt the surrounding ice. So the melting is not coming from below which was always the fall back position and its not coming from above so expect lots more fire’N’floods and no sea ice news.
I would have thought that the early freezing of the ice would make compaction less certain though a close inspection of a polar ice image would sort that out.
There will of course be an MSM blackout of the events in the Arctic unless it can be claimed that the ice is experiencing a death spiral. The evidence is showing an end to the melt season and it will be very interesting to see how the MSM and NOAA spin it.
But, but, but … I thought we’d reached a ‘tipping point’ in 2007?
Joking aside, very interesting ice update, and I must confess that the ice updates on this site are my favorite ongoing reports. Keep up the great work.
Casper says:
August 15, 2010 at 6:59 am
Something must have happened in the atmosphere or sea currents have been changed. Otherwise I find no explanations for it.
One guess – the AMO is starting its sinusoidal downturn from the top. Barents sea temps match the sinusoidal AMO quite closely. This could reduce Atlantic drift warm water input to the Arctic.
See:
http://wattsupwiththat.com/2009/10/08/new-paper-barents-sea-temperature-correlated-to-the-amo-as-much-as-4%C2%B0c/
BTW in a thread this spring when arctic air temps were high, many pro-AGW posters were arguing that air temps determine thickness. It makes sense that air temps influence thickness. Air temps right now would indicate thickening of the ice.
Anthony,
Sorry for addressing my post to Steven! I should wake up before hitting enter!
Here is another break up of Sea-Ice:
http://ocean.dmi.dk/arctic/images/MODIS/Joekelbugt/20100809AQUA.jpg
650 KM2 according to DMI
If they really want a commercially viable Northwest passage, why not build some nice efficient, reliable thermal powerstations up there with some big heating pipes to melt the ice?
They could even tap into all the methane they reckon is under the ice.
Ridiculously expensive, of course. But more affordable than going to a ‘low carbon economy’ NOW. And the plants would LOVE some extra CO2!
I’m assuming the overlaid anomalies are area? You would think that some researcher somewhere would be all over this. As I understand it, the argument has always been that the arctic and antarctic would behave differently because you have water surrounded by landmasses in the north and a landmass surrounded by water in the south. I could see the antarctic responding to AGW at a slower rate than arctic just due to thermal mass of the ocean but for the poles to respond in different directions would seem to imply another mechanism at work.
With the temps below freezing in the arctic, if the winds continue to compact the ice (if they’re not blowing things out of the basin or too strong) then we should see an increased divergence between the area and extent. So we might see the area increase while the extent is still decreasing.
The next question is how far south is the freeze line extending and what’s the rate of change.
Steve,
What are the correlation numbers between the monthly Arctic and Antarctic anomalies? Before you make claims about “symmetry” between the two, you really need to at least do a basic correlation calculation.
In NSIDC’s monthly extent data, it is about -0.16 – essentially uncorrelated.
Walt Meier
NSIDC
Also, the article that says Mark Serreze forecast this year would break 2007’s record is not a direct quote and is incorrect. Mark is not a forecaster, so he didn’t forecast anything. Second, I’ve never heard him say that we would break the record; he may have said “we could break the record”, which was a possibility.
walt
Here is what the “experts” are prognosticating:
http://www.arcus.org/search/seaiceoutlook/2010/july
For Details click on “Pan-Arctic”.
The Wegener Institute (who know about Eisdeckendicken thanks to Polar 5): 5.56
Hadley Center: 5.5
Meier at al (NSIDC): 4.74
I stick to my prognosis from last year: 5 (because it has never grown 3 years in a row)
PIOMAS continues to report record low volumes of ice, despite all evidence to the contrary.
…………………………………………………………………………………………………………………….
PIOMAS shows the McClure Straits open. McClure Straits location here:
http://img801.imageshack.us/img801/7357/arctic.gif
This PIOMAS computer animation that runs from March to September 2010 shows the McClure Straits opening in July, completely open all of August, and begins to close, but not completely, in September. This computer animation was made using the PIOMAS hypothesis.
http://psc.apl.washington.edu/zhang/IDAO/z.gif
Data from August 13, 2010 shows the McClure Straits are not open
http://img580.imageshack.us/img580/8068/arctic8132010.png
The PIOMAS hypothesis is wrong.
I feel sorry for the penguins. They really have to walk a lot this year.
Letter to the prime minister of Britain:
.
Mr David Cameron P.M.
Westminster
Sir,
Still think that the world’s sea ice is ‘melting’ and rapidly disappearing??
Actually, Antarctic sea ice is now at its greatest ever ‘recorded’ extent.
Antarctic sea ice extent:
http://climateinsiders.files.wordpress.com/2010/08/ice_ext_s-2.png
But you will not tell the public this?
Nor will the BBC or the newspapers?
It is against your Warmist religion to tell the truth?
The public should be treated like mushrooms (kept in the dark and fed bullshit) ?
I thought only the former USSR fed their public pure propaganda – are we now worse than the USSR?
And you may not know it, but Arctic sea ice is recovering well from its previous minimums.
Arctic sea ice extent:
http://climateinsiders.files.wordpress.com/2010/08/ssmi1_ice_area.png
And you may not know it, but it has been the coldest Arctic summer ever on record.
Arctic sea ice report:
http://wattsupwiththat.com/2010/08/15/sea-ice-news-18/
Want to pet some more huskies? Or should you join the real world at last?
Sincerely,
Ralph
The proximity of this post, which suggests the Arctic cold to be a part of a long term trend, with that of the Russian heat wave, whose cause is dismissed as weather, might be interpreted by some “warministas” as an observational bias.
latitude says:
August 15, 2010 at 6:41 am
Morning Gates
Snigger, it looks like the “canary” decided to keep it’s mouth shut.
Everybody lives, yeah!
How many wheels does this wagon have?
Yet another Sea Ice News with no MODIS satellite images or high-resolution ice concentration maps, such as the ones by Cryosphere Today or the University of Bremen. Too bad, they look interesting.
Steven Goddard, how do this year’s air temperatures compare to 2007, 2008 and 2009 around the same date? Not just the DMI modeled temperature above 80N, but the entire Arctic. That should give some perspective to your assertion that “the summer melt season will be the shortest on record”. You could be right, but perspective is never a bad thing, is it?
Cold nasty winter ahead IMHO. I feel we are one Volcanic eruption away from a
mini ice age..
Steve,
Another very well cherry picked update. Just last week you were asking whether or not we’d end up this year closer to 2005 or 2009. Now of course, we are looking at how close we’ll come in extent to 2008 (since as of today, we are still below 2008).
You keep bringing up the DMI temp data, yet all the melt right now is really based on ice that has diverged over water that is warmer than average:
http://polar.ncep.noaa.gov/sst/ophi/color_anomaly_NPS_ophi0.png
It is the water temps that drive the ice loss this time of year, though I know many readers here really believe everything you say, and that’s fine, but the DMI temps are not that critical and IMO your characterization of the general state of Arctic Sea ice is far off the mark. Eariler this season you were trying to compare 2010 to 2006, and look where that’s gone. Next, you were trying to compare it to 2005, and look where that’s gone. Of course, 2009 is the next mark on your target, and it looks like there is a very good chance now that 2010 extent will certainly be be lower than 2009. Of course that will mean that there will not be a third year in a row of a “recovery”, but I suppose that the AGW skeptics will have to start talking about a “Recovery Spiral”
In all your updates you seem to have completely failed to mention the entire issue of divergence in the ice that occured at the end of July and into August. Instead, you continually equated a slow down in the extent drop during this period of divergence with a slow down in melting, which is simply flat wrong. Both area and extent drop will slow down during this time, which has been happening more frequently as the general ice thickness has fallen over the past few years. Diverged ice lowers the concentration, though the area and extent drops will slow down. And BTW, it is some of this diverged ice, that doesn’t fully melt by the time the freeze up starts in September that will go on to become the much ridiculed “rotten ice”, in David Barber’s use of the term.
The real race now is whether or not 2010 will finish below 2008 or not. This is the most interesting race left. 2010’s melt looks most similar to 2008 here in the final weeks of the melt season. 2008’s low was hit on September 9th, but right now, I see the 2010 melt season lasting longer than that, with the low not being set until Sept. 20th-25th. It is these few extra weeks of melting that could make the difference between 2010 beating out 2008 or not.
You are right about one thing, this year’s melt did not show any change in course to the longer term downward trend in Arctic summer sea ice loss, and moreover, the sea ice spent most of the summer at record low, or 2nd lowest extents, only behind 2007.
Steven Goddard has said 2010 is tracking similar to 2006. 2006 flattened:
http://img411.imageshack.us/img411/8732/amsre8132010.png
If 2010 flattens it could be above 5.5 in JAXA. As Steven Goddard says it comes down to the winds.
I’m still looking for 2005 to be crossed in DMi.
(Sort of on topic – please Mr. moderator?) I watched Gavin Schmidt, Jeffrey Sachs (econ Columbia) and (I forgot who) from the CATO institute talk about global warming on Fareed Zakaria’s “GPS show and was pleasantly surprised at the friendliness of the mini debate. Gavin stated that we can’t draw AGW conclusions from the Russian heatwave or even the cluster of events (Pakistan flood, European flood, Petermann Glacier calving, etc) but there is no doubt that the planet has been warming. There seems to be an official cooling of the rhetoric and hyperbole on the degree of warming and the disaster quotient. Schmidt was quite charming, stating that he was an optimist and that he was certain that America and other countries would rally around solutions before things got too far out of control. The Cato climatologist was also reasonable in that he said sure there has been a warming trend but it is not the trend toward near term disaster that has been stated by the UN. His main point was that the biggest crippler of our ability to deal with it if it became necessary, was the ludicrous idea of destroying the capital that could be needed by bleeding off trillions in taxation to fund useless solutions. He said that whatever new energy technologies that are going to be needed require massive investment in research and development – even if we wanted to we won’t be able to continue burning fossil fuels for more than a century anyway and this has nothing to do with the climate. Only Jeffery Sachs, the non scientist in the group was waxing strongly on the planetary disaster (why is it the butcher, the baker and the candlestick maker have the strongest conviction that disaster is at hand with the climate?).
Anyway, the more considerate tone, the mentioning of uncertainties, the attentuation of the former steep curves, the new research being done….. is a change from the scientific “love-in” of the past couple of decades. This has come about because of the scientific “sit-in” by those skeptical of CAGW. A relatively small handful of intelligent, questioning individuals who were rallying points for many others have succeeded in turning the massive tide and providing alternative ideas for the many to consider – and look at the swing in the polls on the subject. Surely Anthony Watts, among this few has done much more to deserve a Nobel Prize than the recent crackerjack prize winners of the past few years. I’m afraid even if the Hudson River starts accummulating multi-year ice, though, he won’t receive one.
Yngvar,
Not to worry the penguins have happy feet,
Walt Meier says:
August 15, 2010 at 8:37 am
For not being a forecaster, he does talk alot about the future.
http://climateprogress.org/2010/05/24/arctic-sea-ice-extent-volume-nsidc-record-steve-goddard/
Interesting that there are no recent comments on that thread. 😉
Walt Meier says:
August 15, 2010 at 8:37 am
Also, the article that says Mark Serreze forecast this year would break 2007′s record is not a direct quote and is incorrect. Mark is not a forecaster, so he didn’t forecast anything. Second, I’ve never heard him say that we would break the record; he may have said “we could break the record”, which was a possibility.
Walt, have you ever heard Serreze say “we could see a continuing increase in Arctic sea ice”? I didn’t think so. Of course, it was also a “possibility”. Until NSIDC starts producing unbiased press statements their credibility will be questionable. And that affects your reputation as well.
Fortunately, this debate will soon be over once we start getting reliable satellite data.
That is, unless some start trying to compare it to the currently unknown sea ice situation.
Brad says:
August 15, 2010 at 7:19 am
Ahhh, but no need to worry, the folks funded by our tax dollars continue to push the AGW meme – why in the world would the videos available only show the period to 2006, and only in the Arctic? Hmmmm….why would that be….?
http://arctic.atmos.uiuc.edu/cryosphere/
So I sent this e-mail to them:
I would like to know if your web-site http://arctic.atmos.uiuc.edu/ has been updated recently. I only see information up to 2007.
As climate cycles vary with time, I am most interested in seeing where we are now and how the model projections are faring relative to observation.
Thanks.
Maybe they consigned the arctic to the “death-spiral” in 2007 and moved on to greener (because of increased CO2) pastures?
If I get a response, I will post it here.
Walt Meier says:
August 15, 2010 at 8:37 am
Also, the article that says Mark Serreze forecast this year would break 2007′s record is not a direct quote and is incorrect. Mark is not a forecaster, so he didn’t forecast anything.
………………………………………………………………………………………………………………….
If he is not a forecaster then will you get on tv and set the record straight that when he, Mark Serreze, the now head of NSIDC, said Arctic Ice is in a “death spiral” it had no validity because he is not a forecaster?
Mark Serreze is not a forecaster when the only thing that made him known was a forecast?
You take me for a fool?
Walt Meier says:
August 15, 2010 at 8:37 am
Also, the article that says Mark Serreze forecast …..I’ve never heard him say that we would break the record; he may have said “we could break the record”, which was a possibility.
“Could” is a relative term, isn’t it. The moon could turn toward the earth and crush the Lower 48 States.
When he made that forecast I am sure he wanted the reader/listener to infer that alarming things are happening in Arctic Ice because of ‘global warming’. But for someone in his position to be that far from reality in his statement, that lacking in understanding what is really happening in Arctic Ice, shows something is going on in that government agency other than informing the public about data.
Walt Meier says:
August 15, 2010 at 8:33 am
The idea of overlaying the Arctic and Antarctic Sea Ice Anomalies into one graph is MY contribution, as an image processor, to this whole mess. The purpose of my doing that was to highlight the transposition of the overall Arctic/Antarctic longterm anomalies from one pole to the other. i.e – at one time, the Arctic was at a higher than 1979-present overall anomaly than the Antarctic. They have swapped places. I’m sure you remember the Coming Ice Age scare of that time.
There is no Coming Ice Age scare over the Antarctic at present in this Post-Normal Science world.
This, Dr. Meier, is my handicraft: http://www.robertb.darkhorizons.org/seaice.anomaly.Ant_arctic.jpg
I have placed this graphic overlay work in numerous Sea Ice New updates, but until your post, I have not had anything more than a passing notice.
For that matter, the two anomaly wanderings are neither correlated nor in phase, yet they move over time relative to each other.
If you wish to take issue with what my handiwork says or does not say, please take that issue up with me, for I am it’s originator.
It’s my fault, not Steve Goddards.
Walt,
Mark Serreze is constantly being reported by the press as forecasting Arctic ice, and has been for many years. If that is not a role he is comfortable with, he should make that completely clear to the members of the press he is talking to. He certainly has Joe Romm believing that he is a forecaster.
Your north/south correlation isn’t valid because it is probably on too fine a granularity. The northern and southern hemispheres are 180 degrees out of phase (on an annual basis) with respect to freezing and melting. Try doing the same correlation using annual averages based on maximum-to-maximum in each hemisphere.
R Gates,
I have no idea what you are talking about. My forecast has never changed since day one.
Walt Meier says:
August 15, 2010 at 8:33 am
Steve,
What are the correlation numbers between the monthly Arctic and Antarctic anomalies?
Huh, looking at the graph anyone can there is a relation. You don’t see one?
http://img685.imageshack.us/img685/9959/uiucnorthsouth.jpg
Dr Walt Meiers says about his boss: “Mark is not a forecaster, so he didn’t forecast anything.”
That statement is ridiculous, and it shows the lengths to which underlings will go when they fear for their position. If we take Meiers’ statement at face value, then no one who is not a “forecaster” is allowed to forecast anything.
As a taxpayer, I demand a refund.
Richard M says:
August 15, 2010 at 10:16 am
have you ever heard Serreze say “we could see a continuing increase in Arctic sea ice”? I didn’t think so. Of course, it was also a “possibility”.
Interesting point. It is a possibility. Especially looking at what has been happening the last three years in Arctic Ice, the sun being quiet, and the slight cooling since 1998.
Well, my calculated guess at the minimum seems to have been a bit too optimistic this year at 6.12 Mkm2 by IARC extent graph. Since it has already scooted by that, my only hope would be to call an end to the summer melt today! Steve, seems you are more in line with the reality of the matter.
Günther Kirschbaum says:
August 15, 2010 at 9:20 am
how do this year’s air temperatures compare to 2007, 2008 and 2009 around the same date? Not just the DMI modeled temperature above 80N, but the entire Arctic.
What are the others?
I’m certainly no expert on polar ice, but I do have some simple observations:
1. The Earth dips and bobs in the plane of the ecliptic. As the planet dips and bobs through the plane of the ecliptic, it seems to me that slightly more or less solar radiation would strike each pole (axial pole, not magnetic), and that this would slightly increase radiation hitting one pole while slightly decreasing radiation hitting the other pole.
2. Although the tilt of the Earth with respect to the Moon is constant, it does not follow that the tilt of the Earth/Moon system with respect to the Sun is also constant. There’s got to be some degree of variability in the tilt of the Earth/Moon system (the center of gravity of this system) with respect to the Sun as the Sun’s gravity well drags the Earth/Moon system about the cosmos. This is similar to my point (1.) above.
So, my point would be: the relationship of ice on the axial poles has an inverse relationship due to the mechanics of the solar system. Total ice would be a factor of distance from the Sun and heat. Distribution of ice would be due to angle, and the angle doesn’t change significantly, only ever so slightly.
How can they keep showing the Arctic on fire (Temperature wise) while the Arctic temperatures are well below normal all summer?
“Walt Meier says:
August 15, 2010 at 8:37 am
Also, the article that says Mark Serreze forecast this year would break 2007′s record is not a direct quote and is incorrect. Mark is not a forecaster, so he didn’t forecast anything. Second, I’ve never heard him say that we would break the record; he may have said “we could break the record”, which was a possibility.”
Thanks for stopping by. You may be right, however:
Unfortunately, If Dr. Serreze says “we could break the record”, it gets reported as:
“Mark Serreze of the center forecast the ice decline this year would even break 2007’s record”
http://www.allheadlinenews.com/articles/7018784377
Using “weasel” words like this has destroyed the credibility of NSDIC in my mind. Your data is informative, the rhetoric sucks!
Walt,
The video below shows Antarctic ice anomalies overlaid on Arctic ice anomalies since 2001. It flips the data across the x-axis, shifts six months to account for winter/summer, and does a vertical shift to normalize magnitudes. Note how closely they track.
[youtube=http://www.youtube.com/watch?v=b-hrRCTtwVs]
Steven,
Any chance that Tamino will “cherry-pick” 2007 Artic Sea Ice Extent as a starting point for all future analysis?
R.Gates,
I thought you always dismissed extent and only thought volume important, what was that last post aout? I think you are projecting “selective” and “cherry-picking” upon others as your posts seem to track with which data supports your position best at a particular time?
Question: So if winds start to compact the ice and extent ends up below 5.5mkm2 but area is higher than last year how or when will PIOMASS be validated, discredited or even discussed? I mean they have been showing volume dropping off a cliff, but that does not seem realistic with where we are at and where we are likely to end up this year.
I believe Mark Serreze’s duties at NSIDC include contributing to newspaper articles like these:
From the UK Telegraph:
North Pole ice ‘may disappear by September’
By Paul Eccleston
Published: 2:45PM BST 27 Jun 2008
Ice at the North Pole may disappear completely within the next few months for the first time in 20,000 years.
.
.
.
Scientists who monitor the Arctic say the volume of Arctic ice peaked in March and has been in dramatic decline since.
“There is supposed to be ice at the North Pole – not water,” said Mark Serreze of the US National Snow and Ice Data Centre (NSIDC) in Colorado.
The Centre has been predicting that the Arctic Ocean could be virtually ice-free by 2012 but that point may be reached within months rather than years.
.
.
What say you, Walt Meier?
Steven Goddard, this isn’t entirely true. On Feb. 9th Anthony Watts wrote the following:
Steven Goddard writes below that he agrees with the prediction I made in late 2009 that we’d see another 500,000 km2 of Arctic sea ice recovery in 2010.
500K square km more than 2009 would be 5.88 million square km.
It wasn’t until your Sea Ice News #10 from June 23rd that you committed yourself to a hard number and a data set:
I’m forecasting a summer minimum of 5.5 million km², based on JAXA. i.e. higher than 2009, lower than 2006.
Now, would that be absolute minimum or September average?
This is Tom Wagner from NASA telling us that Greenland is warming at 3.5 degrees per decade. (presumably oF, not oC).
http://edition.cnn.com/video/#/video/world/2010/08/11/am.summer.wx.extremes.wagner.cnn?iref=allsearch
Any substance in these claims?
.
Three clear errors right of the bat;
1) “The entire ice covered region is now below freezing.” Not so.
http://www.esrl.noaa.gov/psd/map/images/fnl/sfctmp_01.fnl.gif
The above figure clearly shows the 0C-2.5C contoured area as coincident with the current ice pack.
So “The entire ice covered region is now below freezing.” is a factually incorrect statement.
2) “The reason being that almost all of the 1-2 year old ice (“First-year (< one year) ice") in the NSIDC map below will become classified as MYI next spring."
This is also a factually incorrent statement.
The area in turquoise is clearly labeled "First-year ( aqua blue, aqua blue -> dark green, dark green -> dark green.
3) “The image below shows in red how far off the mark their August 15 forecast was.”
The above statement and image are not from the latest current Zhang forecast dated August 5, 2010;
http://psc.apl.washington.edu/zhang/IDAO/seasonal_outlook.html
http://psc.apl.washington.edu/zhang/IDAO/z.gif
4) “Note that the Greenland Sea appears to have lost ice.” Appears?
In fact, that area of NE Greenland fast ice has been breaking up like gangbusters over the past 1-2 weeks as can be seen directly in the Terra/Aqua MODIS imagery.
So what “appears to have lost ice.” is in fact “is losing ice.”
” Walt Meier says:
August 15, 2010 at 8:37 am
Mark (Serreze) is not a forecaster, so he didn’t forecast anything.”
In this
http://www.arcus.org/files/search/sea-ice-outlook/2010/07/pdf/pan-arctic/meieretaljulyoutlook.pdf
Meier et al. talk about an “outlook”, and not a forecast, but here
http://www.arcus.org/search/seaiceoutlook/2010/july
words like estimate, prediction and (yes, in line 18) FORECAST are used. Since Serreze IS a member of Meier et al., who ARE doing a forecast of arctic ice, “Mark is not a forecaster” can only mean that his contribution to Meier et al. is regarded as useless.
From http://www.theglobeandmail.com/news/national/arctic-sea-ice-heading-for-new-record-low/article1575212/ and I quote…
> “Could we break another record this year? I think it’s
> quite possible,” said Mark Serreze of the National Snow
> and Ice Data Center in Boulder, Colo.
> “We are going to lose the summer sea-ice cover. We can’t
> go back.”
If the last 2 sentences aren’t a forecast, I don’t know what is. By the way, the Arctic was ice-free for 248,000,000 of the past 250,000,000 years. Yet, it did go back. So much for Mark Serreze’s claims.
Günther
5.5 million is the only number I have given for 2010.
Ralph
A lot of people cherry picked Greenland temperature/ice trends from 2003-2007 to write articles.
I must have missed the article where tamino objected.
Walt said:
“Also, the article that says Mark Serreze forecast this year would break 2007′s record is not a direct quote and is incorrect. Mark is not a forecaster, so he didn’t forecast anything. Second, I’ve never heard him say that we would break the record; he may have said “we could break the record”, which was a possibility.”
But Walt, we are all of forecasters because we all take in information which we then use to predict future events, I forecast my team will win because they won last time, I forecast rain because my knee injury aches. We all of us make forecasts of future events all the time and I can assure you that you do not need to be a forecaster to proclaim an educated opinion about future events in your own field of endeavour, indeed Mark did make a forecast because he stated what he believed a future event may turn out to be based on his experience and knowledge. Its pretty obvious that Mark did not state that ‘the sea ice may break the 2007 record OR it may not break the 2007 record. It is a matter of fact that Mark firmly stated his belief that Arctic sea ice would decline and he used his professional standing to make that forecast to the media knowing full well they would not make the differences between himself and lets say Joe Bastardi. Am I correct in assuming that you would take a forecast from Joe more seriously than from Mark simply because Joe is a highly experienced and gifted weather forecaster and Mark is just a climate scientist?
Loyalty is commendable however blind loyalty is neither commendable or ethical.
” Günther Kirschbaum says:
August 15, 2010 at 11:32 am
Now, would that be absolute minimum or September average?”
This “500K square km more than 2009 would be 5.88 million square km” looks like absolute minimum (but not JAXA), as is my estimate of 5, but they
http://www.arcus.org/search/seaiceoutlook/index.php
are outlooking the “September mean arctic sea ice extend”, which makes more sense, since one day cannot destroy your forecast. So Goddard really should confirm; his dashed forecast-line is in the JAXA diagram.
Dr Meier
Your participation on WUWT is welcomed, but your posts were (shall we say) something of a wind-up.
OK, Mark Serreze is not a forecaster. The NSIDC and Mark therefore have a duty to make this clear when he expresses his views in public. A disclaimer like this would do the trick: “Mark’s comments are his personal view and not those of the NSIDC. Mark is not a forecaster”
You describe someting as “a possibility”. It therefore rank with equal validity to the fairies at the bottom of my garden. Those mischievous fairies always disappear when I look for them, but I cannot rule them out as a possibility. How does this advance good scientific reasoning?
Steven’s video is an excellent reply to your challenge( i.e. “Before you make claims about “symmetry” between the two, you really need to at least do a basic correlation calculation.”)
Flip one series over, shift to broadly align the two and then scale to roughly equal magnitude. Would be very interesting to see what maximum correlation the NSIDC can come up with.
Would you have a shot at it and get back here please?
Am I correct in stating that an Arctic sea ice extent recovery over the next 3 years would put the theory of positive feedback at the Arctic in serious trouble?
Then there’s this:
http://www.ldeo.columbia.edu/res/div/ocp/pub/gorodetskaya/irina_ipccpaper.pdf
What do you think of this paper R. Gates?
Excellent and succinct as ever Mr. Watts, thank you.
stevengoddard says:
August 15, 2010 at 10:36 am
R Gates,
I have no idea what you are talking about. My forecast has never changed since day one.
What R. Gates said was probably a case of projecting.
“By the way, the Arctic was ice-free for 248,000,000 of the past 250,000,000 years.”
How do you know this? I haven’t a clue, because the vast majority of that period was before I was born…
It’s actually snowing at Santa’s workshop:
http://psc.apl.washington.edu/northpole/webphotos/noaa2.jpg
AGW? What AGW?
stevengoddard says:
August 15, 2010 at 11:19 am
Your transposition of the two anomalies does show correlation at times, and at other times there is still a magnitude of difference/phase inversion. There has to be several factors at play affecting the Polar regions, and not all of them are active at any given time.
So, it would be nice if we had the numerical form of the anomalies, then they could be smoothed out to show the relationship more clearly.
Evidence is king. Did any ships make it/ are there any trying to make it, through the NW Passage?
stevengoddard says:
August 15, 2010 at 11:19 am
It flips the data across the x-axis, shifts six months to account for winter/summer, and does a vertical shift to normalize magnitudes. Note how closely they track.
Nice!
Can I request you make what you did to make the video into a post?
It’s more evidence that global warming is not happening since the Poles are not doing as global warming says they should.
What the correlation between north and south ice shows is that something else is going on here.
It would suggest to me that arctic ixe decreases are even less of a concern.
Frank K. says:
August 15, 2010 at 11:23 am
Frank, no one at NSIDC has ever predicted a seasonally ice-free Arctic by 2012. That prediction was made by a scientist at the Naval Postgraduate School.
Walt
Why is there no Global Sea Ice Extent chart on NSIDC’s website?
Perhaps something like this;
http://arctic.atmos.uiuc.edu/cryosphere/IMAGES/global.daily.ice.area.withtrend.jpg
for Extent?
Frank K. says:
August 15, 2010 at 11:23 am
“There is supposed to be ice at the North Pole – not water,” said Mark Serreze of the US National Snow and Ice Data Centre (NSIDC) in Colorado.
XXXXXXXXXXXXXXXXXXXXXXXXXXXXXXXXXXXXXXXXXXXXX
Cherry picking your quotes? That’s not too “frank” of you Frank.
Please notice that it is stated as a 50/50 chance. You should haven ‘frank’ in admitting that qualification. Also their quote of Mark Serreze is suspiciously fragmented.
MECAGO
XXXXXXXXXXXXXXXXXXXXXXXXXXXXXXXXXXXXXXXXXXXXX
Ice at the North Pole may disappear completely within the next few months for the first time in 20,000 years.
Arctic sea ice is now retreating so quickly that scientists say there is now a 50-50 chance that it will have gone completely by September.
[– SNIP–]
“There is supposed to be ice at the North Pole – not water,” said Mark Serreze of the US National Snow and Ice Data Centre (NSIDC) in Colorado.
The Centre has been predicting that the Arctic Ocean could be virtually ice-free by 2012 but that point may be reached within months rather than years.
http://www.telegraph.co.uk/earth/earthnews/3345666/North-Pole-ice-may-disappear-by-September.html
Mr. Watts. Tony. (Can I call you that? Or should I just call you Master?)
Great post! (Standard intro.)
Oooww! Information overload!! Just shows you need absolutely no credentials to understand the true meaning of polar ice data!
Your NW passage bit. With the destination (Kugluktuk) no wonder they found a whole load of ice to crash through! Parry Channel looking pretty much ice free though. Check you geography and ice maps.
Can’t sort out a ALL the wheat from the chaff here, but i think your takehome message is: The Arctic ice is continuing to recover, multi-year ice is on the up (what no southward tranportation during winter?) Willing to put your head on the block here? Has the Great Cooling started? Yes, I know we have an El Nino and that that the global temp. figures from the ‘experts’ will show a dip – but is this the REAL THING? Not like the duds we have had in the past?
So. Is this it, or Watt?
I think Casper is on to something:
“Something must have happened in the atmosphere…”
Yup. Dead right there – chck out around pages 107-110:
http://www1.ncdc.noaa.gov/pub/data/cmb/bams-sotc/climate-assessment-2009-lo-rez.pdf
Maybe a little unsettling that there are record low temps. at the pole. More extreme weather?
Village idiot
Actually sea ice news is written by steve goddard
We recently had a moderate El Nino. It is not surprising if the rate of Arctic ice recovery pauses for a season. In any event the northern oceans retain warmth from the past long run of powerful late 20th Century El Ninos hence the still downward Arctic ice trend over the full 30 year period despite the recovery over the past two seasons.
The upcoming La Nina plus a slow cooling of the northern oceans as the late 20th Century effects gradually fade should produce the real turning point next year.
The quiet sun should keep the polar oscillation negative unless we get a large uptick in solar activity. Consequently, cold northern continents this coming winter should give the Arctic a slow start to next Spring’s melt season.
Much more significant will be the Arctic response to the upcoming La Nina
Amino Acids in Meteorites
I have some proprietary video editing/effects software (which I used to be lead developer for.) It is not publicly available yet.
You can get something similar here for free :
http://www.cinefx.org/
Jimbo says:
August 15, 2010 at 12:32 pm
Am I correct in stating that an Arctic sea ice extent recovery over the next 3 years would put the theory of positive feedback at the Arctic in serious trouble?
Then there’s this:
“The predicted substantial decrease in Arctic summer sea ice concentrations during the twenty-first century may favor cloud formation, which should diminish or even cancel the ice-albedo feedback by shielding the surface.”
XXXXXXXXXXXXXXXXXXXXXXXXXXXXXXXXXXXXXXXXXXXXXX
No, you’re not correct in making long term predictions based on (alleged) short term fluctuations. Remember that 10 years from now.
It’s also nice to see that you are focused on the reversal of a one dimensional factor such as albedo while ignoring the multi-dimensional consequences of altered weather systems and its effects on crops.
Hi Steven, its really nice with this complete ice-overview.
Hard to escape the facts this way.
Something bothers me: For weeks and weeks the compare utily at chryosphere is down.
And would it be interesting to see compares of Arcitc ice now-vs-previous-years? YES!
These days the compare utility has been parked under the “older products”
http://arctic.atmos.uiuc.edu/cryosphere/
– so its perhaps suddenly just an “old product” to compare between years?? And the money going to climate resaerch did not make t possible to continue this feature?
How long are Chryosphere going to keep the compare utility down? Until the summer minimum is well over?
K.R Frank
Pamela Gray-
Great point on wind driven change. That should be answerable, just not by me.
Figures. Seemed muddled. I wondered how you managed it with your day job 😉
Look at that Northwest Passage.
The Northern Sea Route looks about to be open any day now. The last remnant of ice attached to the Siberian shores is about to be pushed away northwards, if this weather forecast is accurate.
mecago says:
August 15, 2010 at 2:31 pm
“…altered weather systems and its effects on crops”
____
You must mean the projected bumper crops across the board this year. All of that snow was great for the crops this year, wasn’t it.
Gunther, what do you see in your links that says the passage will be clear? I’m seeing just the opposite. Clouds will prevent any further significant solar melting. The winds are forecasted to be not very strong and will diminish. Is your forecast mixed with hope?
An update on the Antarctic Oscillation (AAO), which appears to be a significant contributor to the current record high Antarctic Sea Ice Extent:
http://nsidc.org/data/seaice_index/images/s_plot_hires.png
In July 2010 the Antarctic Oscillation (AAO) had its 2nd largest positive anomaly in the historical record, following only May 1989:
http://www.cpc.noaa.gov/products/precip/CWlink/daily_ao_index/aao/monthly.aao.index.b79.current.ascii.table
Note that when viewing the top 15 largest positive anomalies in chronological order:
1979 June 1.70
1979 July 2.41
1985 July 1.91
1989 May 2.69
1989 June 1.99
1993 July 1.96
1994 August 1.91
1998 April 1.93
1999 May 1.64
1999 Oct 1.65
1999 Dec 1.78
2006 May 1.70
2007 Dec 1.93
2010 July 2.42
2010 June 2.07
2 occurred in 1979, 2 in 1989, 3 in 1999 and 2 thus far in 2010, indicating that there is a decadal aspect to the Antarctic Oscillation (AAO).
From a visual perspective:
Here is a animation of the Southern Polar Vortex and AAO over the last month;
http://www.cpc.noaa.gov/products/intraseasonal/z500_sh_anim.shtml
Here’s an animation of a global view;
http://www.cpc.noaa.gov/products/intraseasonal/z200anim.shtml
and here is an animation of the Northern Polar Vortex and Arctic Oscillation (AO) over the last month:
http://www.cpc.ncep.noaa.gov/products/intraseasonal/z500_nh_anim.shtml
Pamela, FWIW, there’s a big high forecasted over the Canadian Archipelago, which means less clouds and probably some even better satellite images of the area.
I agree with you that we won’t be able to see the Northern Sea Route opening up because of a low developing between the Kara and Laptev Seas. But there are people on the ground there who will tell us.
I am sure that the web cam at the north pole could be confusing visitors , the cams temperature has been averaging 10 degrees C for most of the Summer and gives the impression to the casual visitor that things are not too chilly at the north pole – so obviously the ice must be melting in the warmth – is this what people are supposed to think ?
Pamela is right.
Can we get a study of the amount of “ice” in the 15% ice number that is realy just ice drifting away from packs to be melted elsewhere. This would argue that the 30% number is the real number we should follow.
Welcome to the 2010 Arctic Time Portal.
Just trundle on up there and set sail in your catamaran through the NW Passage.
Hundreds of years from now, someone will stumble across the preserved remains of your trajedy in crystal-blue ice water.
Some may wonder what the hapless voyager was thinking….brave yet astonishingly stupid.
It’s easy to miss the fact that the author of a thread isn’t the person who posted it (you). Therefore, author’s names should be boldfaced and/or enlarged and/or centered.
I think that 5.5 is a very brave prediction at this point, with 4.5 equally brave. If we have an average reduction in ice extent from here, we get 5 million. Two standard deviations either way give us approximately 4.6 to 5.4 million.
David Gould
Using “average reductions” NSIDC came up with 3.58 for 2008
http://nsidc.org/images/arcticseaicenews/200805_Figure4.png
“Average reductions” don’t work.
Steve, that previous estimate from NSIDC was for a 40% ice concentration threshold since the ice age products use a 40% ice concentration threshold to track the ice. So unfortunately it doesn’t represent all the ice.
stevengoddard,
But your prediction relies on this season having a record low melt from now on in. You would have to admit that that is highly unlikely.
I also doubt that that is based on average extent loss. When it talks about an average estimate, it is, I assume, the average of a number of different estimates.
When I use JAXA data and take the average loss prior to 2008 and use that to predict 2008 final extent, I get the following:
Approximately 5.2 million +/-.4 million. Thus, I would have massively overestimated the minimum, as 2008 had a record loss from this point. So, you are correct that averages do not do a good job at predicting yearly variation, because records do happen. But records are not common. Averages and standard deviations do give us some good information.
Steven Goddard, how do this year’s air temperatures compare to 2007, 2008 and 2009 around the same date? Not just the DMI modeled temperature above 80N, but the entire Arctic. That should give some perspective to your assertion that “the summer melt season will be the shortest on record”.
On a second read of that graph, it does show what you say it does. On what date did they make that prediction? It says 200805. Does that mean May? May averages have very low correlation to final extent.
Out of interest, the first two weeks of August have had basically average extent reduction (very slightly over). So averages sometimes work. 😉
mecago says:
August 15, 2010 at 2:00 pm
“Frankly” speaking mecago, it’s too bad that the alarmist news headlines don’t state those probabilities “frankly” but instead produce the hype headlines that I noted above. As for Mark Serreze, I didn’t mean to imply that he made a prediction, since, as we all know now, he is NOT a forecaster, and any “forecasts” he does make are to be treated as his own opinions (you know, like “The Arctic is screaming”) and not official products of the NSIDC…
From: R. Gates on August 15, 2010 at 9:26 am
That’s good to know. Mainly because according to the real Sea Surface Temperature map
http://polar.ncep.noaa.gov/sst/ophi/color_sst_NPS_ophi0.png
as found from the main page (with many more such maps)
http://polar.ncep.noaa.gov/sst/ophi/
the water temps are quite chilly, with much of the Arctic basin at -1.5°C and below, and most of the rest at 0 to -1.5°C, thus the mostly freshwater sea ice appears to be in little danger of any dramatic additional melt.
Anyone know of an archive for these maps?
The PIPS Ice Displacement Forecast has shown for several days a tendency for movement roughly towards Greenland, more like the Nares Strait and Ellesmere Island. This is where the PIPS Ice Concentration Forecast shows the greatest Arctic sea ice concentrations, with predominantly 95-100% along the shore with a wide surrounding area being at least 85%, with a narrow strip alongside that being at least 80%. Thus, to me, looks like compaction is occurring there leading to high concentrations. The PIPS Ice Thickness Forecast shows a large chunk of thicker ice found in that area, 4.00-3.75 m thick, but it’s considerably smaller that the high-concentration region which otherwise has thicknesses comparable to about half the Arctic basin sea ice.
Anyone know of a map that clearly shows the individual “regions” like Baffin Bay and the Chukchi Sea etc? It’s time I should get around to memorizing them.
Still looking good for 5.7 +/- 0.1 million km^2 extent per IARC-JAXA (actually 5.6 +0.2/-0.0 10^6 km^2).
The Cat Index forecasts cooler weather approaching in central PA. Eight of the eleven were allowed (encouraged) to live outdoors during the yearly warm period. With food and fresh water supplied outdoors, few wished to come indoors even for brief visits and even when raining/sprinkling. Currently some are coming inside for longer visits, including long sleeps, portending cooler weather. Hopefully the tomatoes, which were put out late, will still get enough warmth and sunlight to finish up.
The Saturday to Sunday morning project (incl. afternoon nap) was replacing the old diaphragm pressure tank, which ended up being replacing everything between the plastic line coming in from the well and the copper pipe supplying everything, due to thick rust deposits in the steel portion of the piping (high iron concentrations in the water around here). PVC was selected, in 1″ (plumbing sizing), due to possible buildup/corrosion, me being borderline able to solder copper joints if absolutely necessary, and lack of space and a helper to wield the large wrenches on iron (the two-footers are a pain, the three- and four-footers are insane). A few threaded brass and steel bits were used. After extensive measuring, dry fitting, pipe cutting, avoiding of severe profanity, and inhalation of purple primer and PVC solvent cement fumes, the completed system was fired up after 5AM to 30-50 psi. After further thread tightening and determining a slow “weeper” at a PVC joint didn’t require immediate repair but rather a (temporary) small bucket, followed by purging of rust-contaminated water at the faucets, sleep commenced at 6AM.
Thus I have some catching up of site content to do. Responses to this comment may not be all that prompt. 😉
Steve, the average you quoted above is from our outlook based on May data and based on survival rates of different ice ages, not extent decline rates. You are correct that such approaches may not work very well any more because the character of the ice cover has changed so dramatically. Now that we’re in August, the decline gets more and more constrained – there’s only so much time left to lose ice and average is less likely to be far wrong. So Dave Gould’s assessment is reasonable.
As for Antarctic sea ice, “Just the Facts” is on the right track – look at the Antarctic Oscillation. In terms of out of phase behavior with the Arctic, Steve, your animation with the shifting axes, as nice as it is, is rather unconvincing. As I said before, if you look at the correlation numbers, the evidence just isn’t there
Finally, in regards to my comments on Mark’s “forecast”, I think it’s a fine line. We are always asked such questions and we can’t resist thinking about them. Scientifically, prognostications about the upcoming summer minimum are not particularly important (the long-term trend is), but if they’re a fun parlor game. Beyond this parlor game though, there is a serious issue in that seasonal forecasts are becoming more important and they are very difficult (especially in a changing climate).
Neither Mark or I or anyone else are “forecasters” in the strict sense of the work and on the front page of the Outlook it explicitly says:
“The intent of the SEARCH Sea Ice Outlook effort is not to issue predictions, but rather to summarize all available data and observations to provide the scientific community, stakeholders, and the public the best available information on the evolution of arctic sea ice.”
We do occasionally use “forecast” in an informal sense, though I can understand that some people may take it literally. I apologize if people take it the wrong way.
However, as for the long-term forecast, things are clearer – we will lose the summer sea ice as temperatures warm. It’s a matter of if not when. (And as Julienne states above, we have never said “2012” or “2013” as a plausible ice-free date.)
walt
stevengoddard says:
August 15, 2010 at 2:13 pm
Amino Acids in Meteorites
I have some proprietary video editing/effects software (which I used to be lead developer for.) It is not publicly available yet.
Actually I meant what you did with the graphs to make the video, the steps you took.
Julienne says:
August 15, 2010 at 1:41 pm
Frank K. says:
August 15, 2010 at 11:23 am
Frank, no one at NSIDC has ever predicted a seasonally ice-free Arctic by 2012. That prediction was made by a scientist at the Naval Postgraduate School.
—
Fair enough, Julienne, but the article I linked to states:
“The Centre has been predicting that the Arctic Ocean could be virtually ice-free by 2012 but that point may be reached within months rather than years.”
The Centre = NSIDC.
Was the Telegraph wrong? If so, I hope a request for a correction was submitted by the NSIDC…
Roger, are you joking? What dry technical article in any rag, internet or otherwise, has the author listed with such prominent font style and arrangement?
Here are a couple of possible scenarios for the next 2 weeks bearing in mind the 2008 rate of loss of 1.041 million sq km during the last 17 days of August was the highest on JAXA records whilst the lowest was 429,000 in 2006:
1) We match 2008’s rate of loss for the remainder of August taking the extent to 4.98 million sq km.
2) We match 2006’s rate of loss for the remainer of August taking the extent to 5.59 million sq km.
3) We lose 100,000 sq km than 2008 loss rate taking the extent down to 4.88 million sq km
4) We lose 100,000 sq km less than 2006 taking the extent down to 5.692 million sq km
Then compare those minimums at the end of August with:
2007 4.607
2008 5.029
2009 5.447
I’m putting my money on scenario 2. which would leave us about 100,000 sq km up on 2009 by the end of August.
We probably wont have a record low melt from here on in…but the JAXA record is short enough that it doesn’t take that much of an anomaly to get a “record”. 2008 saw a record melt from this point forward. But honestly, it was 7 years worth of data. Now its 9 years worth.
If this year flattens like 2006, then it certainly could challenge or surpass the “record” for least melt from here on out. The ice area plus 30% conecntration certainly suggests that we could see a pretty decent flattening of the line at any time now, however, I would probably think that we see something between 2009 and 2006 from here on out putting the min around last year or maybe just a hair above, but it shouldn’t be very shocking if its the “record” slow melt do to the pathetic sample size on the JAXA.
Roger Knights says:
August 15, 2010 at 4:18 pm
Anthony Watts says:
August 15, 2010 at 2:12 pm
Village idiot
Actually sea ice news is written by steve goddard
It’s easy to miss the fact that the author of a thread isn’t the person who posted it (you). Therefore, author’s names should be boldfaced and/or enlarged and/or centered.
——————
Roger, I know! That sneaky Anthony Watts authors the first 17 sea ice news posts, then this mysterious Steve Goddard slides in for number 18.
It should have been revealed in vivid red and underscored.
There again, Idiot got it straight with a little help, so it can’t be too tough. I wonder how he’ll do with number 19.
“By the way, the Arctic was ice-free for 248,000,000 of the past 250,000,000 years”
Not sure where this little factoid came from or whether it’s accurate, but if it’s even roughly true it gives us an interesting perspective on the nature of the Arctic, a totally marine environment.
It suggests that its default or “natural” state is to be ice free, and that makes sense to me. What is extraordinary is that so much ice does form, and then remains as ice, when the conditions for its formation and retention are so inimical.
The oceans are a massive heat sink of water (with high specific heat) between OC and 30C, with currents redistributing heat from warmer to colder places (the net result, according to basic thermodynamics). To freeze salt water, the air boundary layer – a puny heat-containing medium by comparison – must first depress the temperature of a column of water (not just the surface, because of density circulation effects) to -2C, and then remove the latent heat of fusion (80 cal/gm). All this while wave action is doing its best to prevent solidification from happening. Then, once ice has formed, it acts as an insulator, making it more difficult for the “coldness” to penetrate and further thicken the ice.
The fact that 15 million km2 of ice can form at all in these conditions is testament to the staggering hostility of the air/wind systems at high latitudes.
What is just as surprising is that in summer – with air temperatures above zero, sea temperatures above zero as well as warm(ish) currents flowing into the region, and with the sun potentially bearing on it for up to 24 hours per day around the summer solstice – not all of the ice melts, only about two thirds of it.
The wonder is not that some of the ice melts in summer, but that any remains at all, because all of the physical processes are stacked against it.
Even if the Arctic were to become ice free in the near future – which seems extremely unlikely, given current trends – it would not be anomalous – it is the existence of summer ice that is the anomaly. The trouble with warmists is that they are obsessed with the history of the last five minutes rather than taking the longer view, say, 250 million years.
For those who think the polar regions are fairly represented by a big red splotch (based on a single temperature station), I invite you to pick a spot up there, any spot, winter or summer, and stand there in your budgie-smugglers (Speedos) for 10 minutes. It’s not just icicles that snap off.
Günther Kirschbaum says:
August 15, 2010 at 4:56 pm
how do this year’s air temperatures compare to 2007, 2008 and 2009 around the same date? Not just the DMI modeled temperature above 80N, but the entire Arctic. That should give some perspective to your assertion that “the summer melt season will be the shortest on record”.
Günther,
You can look these numbers up yourself to find out. Then you could have the perspective you are looking for and not have to wait for someone else to do it.
It’s not hard to believe this year could have the shortest melt season.
And again, what are the other temperature data sources other than DMi for north of 80N?
R Gates
In the spring when Arctic air temps were above the line you and others were lecturing on how ice thickness was controlled by air temps. Now with Arctic air temp going through the floor, you dismiss it as irrelevant. WUWT?
And what in the name of the sweet Holy Mother is “diverged ice”?
You seem optimistic on your road to Calvary.
“Always look on the bright side of life”.
David W,
I would plump for somewhere in the middle: around 5.3 million by the end of August, with another 280,000 or so of extent loss for the remainder of the season.
David Gould says:
August 15, 2010 at 5:04 pm
Out of interest, the first two weeks of August have had basically average extent reduction (very slightly over). So averages sometimes work. 😉
I’m pretty sure I remember Steven Goddard saying the first 2 weeks of August would show a drop in extent and then it would slow down. (I may be remembering wrong)
At some point very soon JAXA 15% will have to head quickly toward showing what DMi 30% is showing, i.e., 2010 being higher than 2009 and having the possibility of crossing 2005. The only thing that can stop that is strong winds pushing ice backwards.
There’s only ~4 weeks left to minimum, probably less. 🙂
David Gould says:
August 15, 2010 at 4:45 pm
But your prediction relies on this season having a record low melt from now on in. You would have to admit that that is highly unlikely.
David we’ve had a record late date for the winter maximum and record melt during the Spring. Why would you think another record was “unlikely”? You know what they about things happening in threes.
More popcorn, please.
Frank K. says:
August 15, 2010 at 5:35 pm
……he is NOT a forecaster, and any “forecasts” he does make are to be treated as his own opinions (you know, like “The Arctic is screaming”) and not official products of the NSIDC…
Nice link. From it:
” “The Arctic is screaming,” said Mark Serreze, senior scientist at the government’s snow and ice data center in Boulder, Colo.”
Very non-alarmist. 😉
Walt Meier says:
August 15, 2010 at 5:43 pm
(especially in a changing climate)…… However, as for the long-term forecast, things are clearer – we will lose the summer sea ice as temperatures warm. It’s a matter of if not when.
But climate is cooling. Unless you believe computer animations and not data. Where is the missing heat?
Amino Acids in Meteorites,
If August stays on average, the extent drop will slow, as that is what happens at this time of year – on average. 😉
This is the list of averages I have made from the JAXA data for the rest of August:
57375.2
53687.6
50999.8
53375
57594
48124.8
38812.8
43374.8
43031.2
40687.6
41343.8
41531
32531.6
22843.6
35906.2
38125
19999.8
Note that they are only based on the last five years.
Richard M,
Of course it may happen. But it is unlikely. As you have pointed out, though, unlikely things have happened this season. 🙂
Richard M says:
August 15, 2010 at 6:46 pm
we’ve had a record late date for the winter maximum and record melt during the Spring
Also July had the lowest loss for any July on JAXA record. Temps are already below freezing above 80N. It’s actually easier to believe minimum will be reached earlier than usual that it is to believe it will be other than earlier than usual.
But it all comes down to the winds……. and I’ve already got more popcorn.
Well, not to beat a dead horse, but this is what Mark Serreze did say (or at least the BBC quoted him as saying) about that 2013 date.
“But Wieslaw is a smart guy and it would not surprise me if his projections came out.”
http://news.bbc.co.uk/2/hi/science/nature/7139797.stm
Yes, he expressed caution and noted that the forecast was probably too aggressive, but at the same time, the above quote seems to indicate to me that he himself thinks it’s “plausible”. It was also picked up as “evidence” by a number of climate activist sites, with no apparent clarification offered by Serreze or anyone else at NSIDC.
It’s not just a nitpick. People in the employ of governments who are charged with collecting and analyzing data for purposes of advising policy makers seem to all too often be loose cannons who are more intent on giving their personal opinon or pushing some agenda rather than in being sober analysts and scientists. They then find themselves having to say “that’s not what I meant” or “I was misunderstood” or “I was misquoted”.
These Arctic ice threads are so much fun….what will we do after minimum is reached??
Whilst you can say the DMI temps are only for the Arctic Basin, I would have to think this still has an impact on overall ice extent and area.
You have to remember that ice drifting out of the basin into warmer waters contributes to ice loss (as R Gates pointed out in an earlier post). Surely then, whats happening in the Basin itself governs the state of the ice drifting out inot warmer waters.
This is why I feel the very low DMI temps are relevant to whats likely to occur in the coming month.
Walt Meier says: August 15, 2010 at 5:43 pm
“As for Antarctic sea ice, “Just the Facts” is on the right track – look at the Antarctic Oscillation.”
Credit where credit is due, that’s actually based on an observation from Julienne a while back.
“In terms of out of phase behavior with the Arctic, Steve, your animation with the shifting axes, as nice as it is, is rather unconvincing. As I said before, if you look at the correlation numbers, the evidence just isn’t there.”
I think we should be careful before dismissing nascent indications of Global Sea Ice balancing mechanisms. We are not talking about a simple linear relationship easily isolated on a monthly basis, but rather complex interactions between the Global Atmospheric Oscillations occurring over significantly longer timescales. Here is some background on the relationships between the Global Atmospheric Oscillations;
http://webcache.googleusercontent.com/search?q=cache:SyNZdbGlSxAJ:scichina.com:8080/kxtbe/EN/article/downloadArticleFile.do%3FattachType%3DPDF%26id%3D418397+correlation+aao+decadal&cd=6&hl=en&ct=clnk&gl=us&client=firefox-a
and this article points out some of the differences between the Arctic and Antarctic Oscillations:
http://docs.google.com/viewer?a=v&q=cache:gRcNezOcO3oJ:www.scichina.com:8080/kxtbe/fileup/PDF/08ky1740.pdf+correlation+aao+and+AO&hl=en&gl=us&pid=bl&srcid=ADGEESgncEG2PmIfOCjT2KJlJah9_RoUFwVMnddP-TQ__CqZAetgZYiaBz9um9qTwsNKahvMhgnc5nYnz8S-wQDJUEHvmqOxFLVi5bRCbEc_XOYrBnV-5Tz_bLsP9SR-bXDdm_0p1XkM&sig=AHIEtbReOuylUK0He5qXPRx3CrZ46C_W4A
All of this aside, you didn’t address my question as to why NSIDC doesn’t offer a Global Sea Ice Extent chart. Note that as a skeptic, I try to put forth facts and let them speak for themselves. My issue with NSIDC is that sometimes it seems to be proselytizing, versus offering unbiased scientific reporting and analysis. Publishing a Global Sea Ice Extent chart prominently on the NSIDC website would be a significant step towards dispelling this perception.
David Gould says:
August 15, 2010 at 7:00 pm
This is the list of averages…
Those type of averages haven’t been working this year. This year is changing the averages. Averages smooth-over things sometimes.
Amino Acids in Meteorites,
We’ll all be in withdrawal. Counselling, perhaps? 😉
David W says:
August 15, 2010 at 7:21 pm
You have to remember that ice drifting out of the basin into warmer waters contributes to ice loss (as R Gates pointed out in an earlier post).
That was pointed out by Steven Goddard and others here at WUWT long before R. Gates did.
Just The Facts,
I don’t know what time frame or smoothing method should be used. I know I can look at the graph and see a relation:
http://img685.imageshack.us/img685/9959/uiucnorthsouth.jpg
The graph only goes back to 1979. I wish satellite data went back 2000 years.
Global warming says both Poles are supposed to be warming and losing ice. The graph shows the earth has a balance. Global warming is supposed to have taken the world out of balance—and I do have video evidence that it is supposed to have done that, not just written-in-a-news-report evidence. Video is mightier than the pen:
David Gould says:
August 15, 2010 at 7:27 pm
We’ll all be in withdrawal. Counselling, perhaps? 😉
lol!
Maybe we can switch over to trying to guess how low into negative anomaly temperature will go from La Nina.
Walt Meier says:
August 15, 2010 at 5:43 pm
The intent of the SEARCH Sea Ice Outlook effort is not to issue predictions,
AND
Scientifically, prognostications about the upcoming summer minimum are not particularly important (the long-term trend is), but if they’re a fun parlor game.
AND
We do occasionally use “forecast” in an informal sense, though I can understand that some people may take it literally. I apologize if people take it the wrong way.
Some recent Mark Serreze parlor game predictions
“Could we break another record this year? I think it’s quite possible,”
“We are going to lose the summer sea-ice cover. We can’t go back.”
“the decline is likely to speed up even more in June and July.”
“the ice decline this year would even break 2007’s record.”
“the upcoming 2010 sea ice minimum will set a new record.”
“We still expect to see ice-free summers sometime in the next few decades.”
Walt thanks for coming to WUWT and commenting. The problem I have is that the MSM tends to feed off Mark Serreze’s informal parlor games and takes them seriously. To put this all in the proper perspective shouldn’t he, on behalf of the NSIDC, formally advise the MSM that his forecasts are only a bit of light hearted fun.
It’s normal for author’s names to be centered. In Europe, it’s standard for them to be all-caps (including in references). And WUWT threads aren’t “dry technical articles,” so their standards needn’t be ours. In popular magazines, author’s names are often either enlarged or boldfaced.
Furthermore, in any blogware system where the name of the “poster” (Anthony) is automatically inserted beneath the title, the potential for confusion exists. I’ve seen at least a half-dozen comments this year where readers have made a mistake about authorship as a result.
Amino Acids in Meteorites says:
August 15, 2010 at 7:44 pm
Maybe we can switch over to trying to guess how low into negative anomaly temperature will go from La Nina.
That’s a capital idea. Looking over the temp drop with the sun still up, I dare say come Sept. 21st, when the Arctic Sun goes down, the white stuff will hit the fan.
Frank, yes the Telegraph article you read is in error. It’s not the first time the media has linked NSIDC to a quote that never came from NSIDC. We try to correct these when they occur. If you have a link to the article I can follow up with The Telegraph.
thanks, Julienne
Whilst I wouldn’t normally pay any heed to a single days loss, I couldnt help but mention the data is now out for 15th August on the JAXA site and its 40,256 sq km.
This struck me as kind of a coincidence considering we’ve discussed whether we might not follow the same pattern as 2006 for the remainder of the season which incidentally had an ice loss of 40,625 sq km on the 15th August 2006.
Before any of you warmers out there shout me down, I know a single day doesn’t really mean anything but if this year does end up following 2006’s path it would strike me as one of life’s little ironies.
rbateman says:
August 15, 2010 at 8:00 pm
Maybe we can switch over to trying to guess how low into negative anomaly temperature will go from La Nina.
That’s a capital idea. Looking over the temp drop with the sun still up, I dare say come Sept. 21st, when the Arctic Sun goes down, the white stuff will hit the fan.
Actually I meant after minimum is reached we won’t have these Arctic ice threads. So to occupy the months after minimum we could start guessing how far negative anomaly will go from the La Nina happening now. But readers couldn’t know that’s what I meant since they can’t read my mind. I wasn’t clear enough.
mecago says:
August 15, 2010 at 2:31 pm
[QUOTES JIMBO]
Jimbo says:
August 15, 2010 at 12:32 pm
Am I correct in stating that an Arctic sea ice extent recovery over the next 3 years would put the theory of positive feedback at the Arctic in serious trouble?
Then there’s this:
“The predicted substantial decrease in Arctic summer sea ice concentrations during the twenty-first century may favor cloud formation, which should diminish or even cancel the ice-albedo feedback by shielding the surface.”
XXXXXXXXXXXXXXXXXXXXXXXXXXXXXXXXXXXXXXXXXXXXXX
[MECAGO THEN RESPONDS TO JIMBO]
No, you’re not correct in making long term predictions based on (alleged) short term fluctuations. Remember that 10 years from now.
It’s also nice to see that you are focused on the reversal of a one dimensional factor such as albedo while ignoring the multi-dimensional consequences of altered weather systems and its effects on crops.
[WAYNE THEN MAKES A PARTIAL QUOTE FROM MECAGO]
wayne says:
August 15, 2010 at 3:15 pm
mecago says:
August 15, 2010 at 2:31 pm
“…altered weather systems and its effects on crops”
____
You must mean the projected bumper crops across the board this year. All of that snow was great for the crops this year, wasn’t it.
XXXXXXXXXXXXXXXXXXXXXXXXXXXXXXXXXXXXXXXXXXXXXXX
MECAGO NOW RESPONDS TO WAYNE:
You obviously don’t keep up with simple chronological order. Jimbo was originally speaking about the Arctic ice cap opening up and then producing cloud cover that would substitute for the ice albedo effect.
I then responded by bringing up the other changes that WILL OCCUR when that happens. WILL OCCUR is future tense. I hinted at when it may occur by telling him to keep note of his short term prediction of Arctic ice recovery ten years from now.
Ten to twenty years is the estimated time for the Arctic to be ice free (initially for days, then weeks and months) with the beginning of changing weather patterns for the entire Northern Hemisphere possibly beginning before it is even totally ice free.
What now is the relevancy of our CURRENT bumper crops with the probability that they will be adversely effected within THE NEXT ONE OR TWO DECADES?
What will we do after minimum is reached?
I think we should concentrate on warning citizens about preparing themselves for bad-to-the-bone winter cold .
The disasters in S. America are fresh in memory. No one need be caught looking.
Julienne
I see provocative and easy to misinterpret quotes from Mark Serreze all the time.
Two years ago he declared the Arctic to be an “ice island” to the press, and got an strong negative response from NIC. Then there was the ice free pole bet, and the “breathtakingly ignorant” WUWT. Not to mention the “death spiral.”
Sounds more like politics than science to me.
Amino Acids in Meteorites says:
August 15, 2010 at 8:25 pm
We need a N. Hemisphere Winter thread, or something similar.
A place for people to check the offical forecasts vs what’s going down on the ground.
Not that I don’t trust our climate institutions, it’s just that I don’t trust our climate institutions track record of the past 3 years.
After the minimum extent is done for the year we can start taking bets on where we might head for a maximum extent particularly if the minimum is reached early.
Roger, you’re actually serious about this!
Are you the one that came up with “the beverage you are about to enjoy is hot”?
You took note of the tiny, faded print saying who posted it, but failed to see the author’s name, printed so much larger and more prominently.
Okay, maybe you’re just springing to the defence of the foolish or careless, but there is just one Idiot and he’s onto it now, I think.
I’m assuming that when you wrote “author’s names”, you meant “authors’ names”.
It is the convention in Europe to do it thus.
Julienne says:
August 15, 2010 at 8:18 pm
Frank, yes the Telegraph article you read is in error. It’s not the first time the media has linked NSIDC to a quote that never came from NSIDC. We try to correct these when they occur. If you have a link to the article I can follow up with The Telegraph.
thanks, Julienne
—
Here it is, Julienne (it was embedded in my original post)…note that it is from 2008.
http://www.telegraph.co.uk/earth/earthnews/3345666/North-Pole-ice-may-disappear-by-September.html
Walt and Julienne
Further to my point about proselytizing, this report offers a good example:
http://www.arcus.org/search/seaiceoutlook/2008_outlook/downloads/monthly-reports/summary-report/12-meier-summary_report.pdf
Everything seems factual and reasonable until the last sentence:
“Regardless, with a growing radiative forcing, an eventual transition to ice-free summers seems inevitable.”
Why was this sentence included? It seems highly speculative and no supporting evidence is provided.
Frank K. says:
August 15, 2010 at 5:35 pm
mecago says:
August 15, 2010 at 2:00 pm
“Frankly” speaking mecago, it’s too bad that the alarmist news headlines don’t state those probabilities “frankly” but instead produce the hype headlines that I noted above.
XXXXXXXXXXXXXXXXXXXXXXXXXXXXXXXXXXXXXXXXXXXXXXXXX
In case you did not carefully read the article that you quoted; it was supposed to be “scientists”, unspecified of course, that made the 50/50 prediction. Who else would it be? So why are you saying that “ALARMISTS!” (Danger! Will Robinson) don’t state those possibilities?
And who produces those HYPE headlines if not the Media rag you quoted above? Not that one can trust anything the Telegraph says (Ever heard of Primary Sources?).
Furthermore, if one is going to be honest about quoting the other side of any issue, they should note THE RANGE or spectrum of different opinions instead of cherry picking ideas or dates of individuals that may be at one extreme or the other.
For example, 2020-2030 is the time range predicted for an ice free Arctic, in the
Summer (For a few days initially and excluding the Canadian Arctic Islands initially.). That was down considerably from 2040+ due to Earth’s own Reality Check.
Nevertheless, one can predict that, you chillists will claim that we were predicting 2013. This based on one individual by the name of Maslowski who stated that there was, if I recall correctly, a 70% chance of ice free summertime Arctic by 2013-2015.
I’ve even seen fools, on this very site, insist that it had to be 2013 because WE were responsible for the Media’s representation of us. Yeah right.
Quite the display of Wishful Thinking:
http://climateinsiders.files.wordpress.com/2010/08/myforecastverificationaugust15_2010.jpg
We’ll soon know if Santa brings you what you wished for.
This is what sea ice melt looks like (8/15/10 in the Beaufort Sea):
http://rapidfire.sci.gsfc.nasa.gov/subsets/?subset=Arctic_r05c02.2010227.aqua.250m
Those swirly lines show when sea ice becomes sea water – when the melting sea ice “runs out of thickness”. Look closely over the next 5 weeks – after that, melt season is pretty much over.
I may have a bit too much spare time on my hands, but I just noticed something interesting about the *DATES* of arctic ice extent minima, as per IARC JAXA. The dates of the minima average 8.5 days earlier in even numbered years versus odd-numbered years…
2002 => Sep 9
2004 => Sep 11
2006 => Sep 14
2008 => Sep 9
Mean day is Sep 10.75, with std dev 2.363
2003 => Sep 18
2005 => Sep 22
2007 => Sep 24
2009 => Sep 13
Mean day is Sep 19.25, with std dev 4.856
Note also that
2004 is 7 days earlier than 2003
2006 is 8 days earlier than 2005
2008 is 15 days earlier than 2007
I’m willing to throw out 2007 as an exception. It was a “double-dip” minimum, with the previous one being aboutt 8 or 9 days earlier. This would bring 2007-2008 in line with the previous 2 transitions. One week before Sept 13 (2009’s minimum) is September 6th. So if the pattern holds, we should see the minimum on or about Labour Day. An early minimum in 2010 looks distinctly possible, given the below-normal temps north of 80 this year, as reported by DMI.
I am not into numerology, so I’d prefer a scientific explanation. Would QBO (Quasi-Biennial Oscillation), and its effects on winds, be a candidate?
Amino Acids in Meteorites says:
August 15, 2010 at 7:42 pm
Just The Facts,
I don’t know what time frame or smoothing method should be used. I know I can look at the graph and see a relation:
http://img685.imageshack.us/img685/9959/uiucnorthsouth.jpg
The graph only goes back to 1979. I wish satellite data went back 2000 years.
Global warming says both Poles are supposed to be warming and losing ice. The graph shows the earth has a balance. Global warming is supposed to have taken the world out of balance—and I do have video evidence that it is supposed to have done that, not just written-in-a-news-report evidence.
—…—…—…—
And no NSIDC nor GISS nor IPCC commentator has given a reason why, if their Mann-made CAGW theory is correct, daily DMI Arctic summer temperatures at 80 north have not only decreased since 1958, but have begun decreasing much faster in recent years than when CO2 levels were higher (1962 – 1980). Worse, summer Arctic temperatures are decreasing at a rate that will shortly (10-15 years) mean that Arctic summer temperature never even get above freezing.
Amino Acids in Meteorites said:
August 15, 2010 at 7:10 pm
“Temps are already below freezing above 80N. .. But it all comes down to the winds……”
Temps are not below freezing above 80N, Alert was at +3.5C max yesterday. So it’s not just all wind either at this time of year either, although some people would like to paint it that way.
Andy
Pamela Gray said
August 15, 2010 at 3:40 pm
“Gunther, what do you see in your links that says the passage will be clear? I’m seeing just the opposite. Clouds will prevent any further significant solar melting. The winds are forecasted to be not very strong and will diminish. Is your forecast mixed with hope?”
————————-
Weather forecast for Arctic Bay and Resolute shows sunshine and some cloud
http://www.weatheroffice.gc.ca/city/pages/nu-27_metric_e.html
http://www.weatheroffice.gc.ca/city/pages/nu-10_metric_e.html
Andy
Anu
Did they teach you at MIT what the word “significant” means?
From the NSIDC FAQ page:
Wintertime Antarctic sea ice is increasing at a small rate and with substantial natural year-to-year variability in the time series. While Antarctic sea ice reached a near-record-high annual minimum in March 2008, this does not indicate a significant long-term trend. To borrow an analogy from sports, one high day, month, or even year of sea ice is no more significant than one early-season win would be in predicting whether the hometown team will win the Super Bowl ten seasons from now.
———————————
“a near-record-high annual minimum” in one month, in one year “does not indicate a significant long-term trend.”
NOT significant, NOT long-term, NOT trend
It doesn’t “indicate” ANYTHING, but it is yet another opportunity to mention the words “significant”, long-term, and “trend”.
J & W, doesn’t this unending use of suggestion and prevarication make you feel even a little uncomfortable.
Are we really to believe that indignant words will be directed at journalists for things written two years ago?
It’s embarrassing to witness the attempts at pacifying dissenters.
On the other hand, your contributions of analysis and perspective, including predictions, are great!
Walt Meier says:
August 15, 2010 at 5:43 pm
We do occasionally use “forecast” in an informal sense, though I can understand that some people may take it literally. I apologize if people take it the wrong way.
Better yet, stop doing it.
If you can’t make strong predictions, then don’t make any. If you do make strong predictions, don’t weasel out afterwards.
David W says:
August 15, 2010 at 9:24 pm
After the minimum extent is done for the year we can start taking bets on where we might head for a maximum extent particularly if the minimum is reached early.
Interesting. So just keep the Arctic threads coming year round?
Just The Facts says:
August 15, 2010 at 9:46 pm
[–SNIP–]
Everything seems factual and reasonable until the last sentence:
“Regardless, with a growing radiative forcing, an eventual transition to ice-free summers seems inevitable.”
Why was this sentence included? It seems highly speculative and no supporting evidence is provided.
XXXXXXXXXXXXXXXXXXXXXXXXXXXXXXXXXXXXXXXXXXXXX
Perhaps it seems inevitable because several decades of observations; discussed to death and proven up the Ying Yang while being duly denied by many; makes it obvious to the authors.
So while you’re claiming that no evidence has been provided, not only has it been ad naseum, but there’s no point in rehashing it in a single page of “Summary Report”.
Wait ten years and ask your question again. I suspect of course that the predictions of the ice cap recuperating in THICKNESS IN A FEW YEARS AS WELL AS EXTENT (Made on this very site) will have been long forgotten. The next step in proselytizing will be Natural Global Warming as the official Oil Company sponsored Truth.
Uh oh, JAXA just took a turn into 2008, headed for 2009. Is 2005 in its sites?
http://www.ijis.iarc.uaf.edu/seaice/extent/AMSRE_Sea_Ice_Extent_L.png
When all is said and done is Steven Goddard going to wearing the daddy pants?
Anu says:
August 15, 2010 at 10:06 pm
Quite the display of Wishful Thinking:
http://climateinsiders.files.wordpress.com/2010/08/myforecastverificationaugust15_2010.jpg
We’ll soon know if Santa brings you what you wished for.
stevengoddard says:
August 15, 2010 at 7:45 am
I don’t see any indication of significant melt occurring. It is compaction, not melt, we are seeing.
This is what sea ice melt looks like (8/15/10 in the Beaufort Sea):
http://rapidfire.sci.gsfc.nasa.gov/subsets/?subset=Arctic_r05c02.2010227.aqua.250m
Those swirly lines show when sea ice becomes sea water – when the melting sea ice “runs out of thickness”. Look closely over the next 5 weeks – after that, melt season is pretty much over.”
Took me a moment to get my bearings on the photo which conveniently cuts off just before the much higher ice concentrations off the Canadian Archipelago. Which incidentally if you check the current direction of ice drift is what the ice in the photo will be replaced with shortly.
I can go back several weeks and find in a simlar condition in the same area and guess what, that ice is still there today.
Another example of a very carefully framed photo covering a very specific area and not at all indicative of the overall picture. Nice one Anu. If you think a signifcant proportion of the ice in the Beaufort Sea side of the Arctic Basin is going to completely go in the next 4 weeks your completely deluded.
I can understand though Anu, after the early excitement in May and June you probably thought all your christmases had come at once. Then July came and its all been a bit depressing for you since.
” Walt Meier says:
August 15, 2010 at 5:43 pm
On the front page of the Outlook it explicitly says:
‘The intent of the SEARCH Sea Ice Outlook effort is not to issue predictions, but rather to summarize all available data and observations to provide the scientific community, stakeholders, and the public the best available information on the evolution of arctic sea ice.’
We do occasionally use “forecast” in an informal sense, though I can understand that some people may take it literally. I apologize if people take it the wrong way.”
The front page of the SEARCH Pan-Arctic Full Outlook states:
“…ice is very thin, leading Lindsay and Zhang to predict a new record low for September 2010 with an R2 value of 0.84, suggesting a high degree of skill in the forecast.”
Please, Dr. Meier, inform the author of these words (she has the initials J. S.) that “forecast” is a four letter word.
The DMI graph is especially impressive. However last week a few commented on a broken temperature sensor, on one of the automated stations out on the drifting ice. I assume that the Danes,
1.) Are aware of it
2.) Do not use that data
However I also know one shouldn’t assume. Lots of these arctic sites are run by understaffed and overworked crews, and I worry that the broken sensor might be automatically injecting its false and cold-biased data into a prearranged program.
I would be greatly reassured if someone could make absolutely sure this isn’t occurring. I’d be pretty embarrassed to use this DMI graph in a debate with an Alarmist, only to find out it isn’t accurate.
If it is accurate, it is truly remarkable. There’s nothing like it in any prior years.
Can any Danes out there reassure a worry-wart?
Steve,
Concerning the NSIDC data, as I pointed out before (http://wattsupwiththat.com/2010/08/05/analysis-of-nsidc-august-4-news/#comment-452214), there must be a bug in whatever method you’re using to count pixels from the NSIDC maps. When I count pixels from the binary data they use to generate their maps (which I’ve downloaded from their FTP), I get the same % difference as what you’ve calculated from their graph — 10%.
Here are the counts for Aug 14:
2007 — 8151 pixels
2010 — 9049 pixels
“Regardless, with a growing radiative forcing, an eventual transition to ice-free summers seems inevitable.”
What growing radiative forcing?
Oh, they must mean the GCM output rated at $Billions/.1C
Quite the business model, I must admit, for it’s got selling Super Bowl commercial time beat to a pulp.
“Regardless, with a growing radiative forcing, an eventual transition to ice-free summers seems inevitable.”
According to Spencer, there is no growing radiative forcing. Great minds do not think alike.
But if there were a growing radiative forcing, the conclusion would be correct.
Caleb says:
August 16, 2010 at 1:13 am
The Danes are not the only ones reporting plummeting temps @ 80N.
…”Yet the press continues to spread massive disinformation about the state of ice at both poles. Who could possibly be responsible for that?”
_____________________
We seem to have a pandemic of viral origin that even the CDC has yet to properly issolate and name – let me try: “Stupidus Climagechangeium Argumenti”. This is getting to be worse than the pandemic of the early 1940’s – “Whosi Ist Oni Firsti”.
Two critical observations:
1. Government hacks need to speak only facts.
2. The father of AGW had to be a guy named Soros.
The numbers continue to go down. Extent is now lower than 5,000,000 sk and the latest loss was still above 40,000sk.
They have slowed from closer to 60,000sk a day last week. But mother nature will have to put the brakes on before the end of august to stay above 5.5.
Hopefully this video will make it clear to everybody. Green represent areas with 2010 ice which were not present in 2007.
[youtube=http://www.youtube.com/watch?v=KlhZKosj4bI]
DMI shows 25% more ice in 2010.
mecago says: August 15, 2010 at 11:21 pm
“Perhaps it seems inevitable because several decades of observations; discussed to death and proven up the Ying Yang while being duly denied by many; makes it obvious to the authors.
So while you’re claiming that no evidence has been provided, not only has it been ad naseum, but there’s no point in rehashing it in a single page of “Summary Report”.
Wait ten years and ask your question again. I suspect of course that the predictions of the ice cap recuperating in THICKNESS IN A FEW YEARS AS WELL AS EXTENT (Made on this very site) will have been long forgotten. The next step in proselytizing will be Natural Global Warming as the official Oil Company sponsored Truth.”
Impressive gibberish. Thank you for providing us with another example of why skeptics are winning this debate…
mecago says:
August 15, 2010 at 10:03 pm
Mecago – I’m afraid your anger is misplaced. I was merely pointing out one many examples of past hyperbolic media reports of the “death” of the arctic, featuring some of our favorite CAGW types like Mark “The Arctic is Screaming” Serreze. Even if we “read further” that the chance was “50/50”, don’t you think the new article was over-the-top (and incorrect, as it turned out…)? I think you need to direct your ire at the UK Telegraph, and let THEM know how you feel. I know you can do it!
“I’ve even seen fools, on this very site, insist that it had to be 2013 because WE were responsible for the Media’s representation of us.”
“We” – “us”? Mecago – Do you work for the government-funded global warming industry? Don’t worry, Mecago – there’s enough Climate Ca$h to go around…
Does anyone have an opinion in which is more accurate? Area or extent? As both have been tossed around on WUWT.
Snowlover123,
Similar to the difference between average and median, they both matter, and they should both be taken into account. They each have slightly different definitions.
rbateman says:
August 16, 2010 at 3:44 am
Caleb says:
August 16, 2010 at 1:13 am
The Danes are not the only ones reporting plummeting temps @ 80N.
You also can see how is weather there here:
http://www.uni-koeln.de/math-nat-fak/geomet/meteo/winfos/synNNWWarctis.gif
Snowlover123
Area is more useful for measuring the amount of ice, albedo etc. Extent is more useful for telling you where you might bump into ice. Area measurements are more error prone.
Snowlover123 says:
August 16, 2010 at 6:27 am
Does anyone have an opinion in which is more accurate? Area or extent? As both have been tossed around on WUWT.
——————
During the melt season, extent would be the more “correct” number to be looking at, even though in reality there is less ice present than measured by the total extent. This is because melt ponds “appear” as open water in the sea ice algorithms applied to passive microwave brightness temperatures. Thus, the true area will be underestimated during advanced melt, with errors of 30-40%. This is the reason why NSIDC reports on the ice extent and not the ice area.
Alexej Buergin says:
August 16, 2010 at 12:32 am
” Walt Meier says:
August 15, 2010 at 5:43 pm
On the front page of the Outlook it explicitly says:
‘The intent of the SEARCH Sea Ice Outlook effort is not to issue predictions, but rather to summarize all available data and observations to provide the scientific community, stakeholders, and the public the best available information on the evolution of arctic sea ice.’
We do occasionally use “forecast” in an informal sense, though I can understand that some people may take it literally. I apologize if people take it the wrong way.”
The front page of the SEARCH Pan-Arctic Full Outlook states:
“…ice is very thin, leading Lindsay and Zhang to predict a new record low for September 2010 with an R2 value of 0.84, suggesting a high degree of skill in the forecast.”
Please, Dr. Meier, inform the author of these words (she has the initials J. S.) that “forecast” is a four letter word.
————————————
Alexej,
I think you don’t quite understand the sentence. The sentence is in reference to the forecast made by Lindsay and Zhang’s numerical model. The model shows an increase skill in forecasting the September minimum using G1.0 (area with less than 1.0m of ice) as a predictor for the minimum.
Temp north of 80N went a tad lower:
http://ocean.dmi.dk/arctic/plots/meanTarchive/meanT_2010.png
Its below freezing.
RACookPE1978 says:
August 15, 2010 at 10:25 pm
I have not worked with the DMI model data, but I have worked with other reanalysis data and in none of these data sets is there a trend towards cooler Arctic summer temperatures. You also do not see a negative trend in the AVHRR surface temperatures.
I am buying pop corn and awaiting how Mark Serreze’s “Death Spiral” will unfold.
Only, I am suspecting it will be a Spiral of Life, upwards, up, up, up! For many years.
And we, the tiny humans, can go back to concentrating on living our tiny lifes as good and constructive as possible.
The NOAA pole cam is showing one heck of a snow storm, its blowing snow around like crazy and with the melt ponds frozen or freezing over the snow is going to cover the melt ponds and this is going to affect the sea ice extent calculations and the next ‘cryosphere today’ picture of sea ice extent and concentration I think.
The question is of course just how many frozen melt ponds will be covered over by snow and how deep will that snow be, of course I assume that the the people who analyse the pictures count frozen over melt ponds as open ocean?
Walt Meier says:
August 15, 2010 at 5:43 pm
“… there is a serious issue in that seasonal forecasts are becoming more important and they are very difficult (especially in a changing climate).
…
However, as for the long-term forecast, things are clearer – we will lose the summer sea ice as temperatures warm. It’s a matter of if not when.”
walt
I notice you chose to refer to a “changing climate” in the earlier paragraph rather than the “warming climate” you appear to be assuming in the later paragraph.
But then, I also notice where you say “if not when” rather than the “when not if” that you most likely meant for public consumption. Perhaps this little slip is an indication of the sort of discussion going on behind the scenes lately in your shop? The sort of discussion that would lead you to use the phrase “changing climate”?
And are we to interpret the last paragraph as a forecast? And if so, by whom, since these suddenly seem to have become unexpected issues regarding your organization?
Julienne,
My take from this site is that summers must have been generally cold at the North Pole over the past decade.
http://www.arctic.noaa.gov/detect/ice-npole.shtml
Good news. The NSIDC graph is much more in line with their maps today.
http://nsidc.org/data/seaice_index/images/daily_images/N_timeseries.png
Julienne says:
August 16, 2010 at 7:41 am
“During the melt season, extent would be the more “correct” number to be looking at, even though in reality there is less ice present than measured by the total extent. This is because melt ponds “appear” as open water in the sea ice algorithms applied to passive microwave brightness temperatures. Thus, the true area will be underestimated during advanced melt, with errors of 30-40%. This is the reason why NSIDC reports on the ice extent and not the ice area.”
Julienne,
30-40% strikes me as a huge error. Can I assume you mean up to 30-40% of a particular cell being analyzed, and not of the overall Arctic sea ice area calculation?
Also, with this sort of underestimate (even in a cell) does that imply that many of the central Arctic regions that show reduced extent are actually solid ice sheets covered with significant melt ponds? Or do they tend to be areas of floating ice as I think some of us have been assuming (well, me anyway.)
Finally, regarding your comment on summer temperature trends, do you tend to discount the DMI temperature measurements then? Others are more accurate? If so, could you provide a link or two? Thanks.
Rod
David W says:
August 15, 2010 at 8:21 pm
As you say, one day isn’t that important. But typically JAXA puts up a revised number several hours after the original is posted, and with the revised number the daily drop was only 39688 km^2. 🙂
Incidentally, the average the last 12 days is 56133 km^2. This is a 833 less than 2005, >10000 less than 2007, >21000 less than 2008, ~6000 more than 2006, and ~2500 more than 2005.
If the remainder of the season is like 2002/2003/2006, we can expect to beat 2009 and maybe 2005 and end as high as 5.4e6 km^2. If it’s like 2004/2005/2009, we’ll end up short of 2009 in the 5-5.15e6 km^2 range. Finishing like 2007 puts us a bit below this, and finishing like 2008 is the only way to end up in the 2008 range.
If you believe Steve’s plots from PIPS 2.0, then barring wind-based compression, it’s quite possible for the ice extent to surpass 2009 and even 2005. If we see a lot of wind compression, then we’ll likely see something more like 5e6 km^2. We’d have to see a record drop from here on out to go lower than 2008…any hypotheses on what would cause that?
Note – all of this is using the JAXA data. I have optimism for the rest of the season reaching 2009 levels on this dataset since it already has reached 2009 on the DMI and NORSEX data.
-Scott
Breaking news:
http://fakescience.tumblr.com/post/963124050/research-in-antarctica
Rod Everson says:
August 16, 2010 at 9:19 am
Typically the accuracy of the total ice concentration is about +/-5% in winter and +/-15% in summer when melt ponds are present. Some additional weather related effects and land contamination will also occur, which together all affect the accuracy of the total ice extent and the total ice area.
A paper by Agnes and Howell (2003) found that when comparing the NASA team sea ice area (which is what NSIDC’s arctic sea ice news and analysis website uses) to Canadian Ice Charts, an error of 44% was found in summer, with differences reducing to less than 10% in winter.
Some of the reduced ice concentrations you see in the interior of the ice pack may indeed be a result of a melt pond over a solid sheet of ice. To check to see if that is the case, I typically take a look at the MODIS imagery to see if the reduced ice concentrations are a result of more open water or more melt ponds. For example in the Beaufort Sea at the moment, it is clear that the reduced ice concentrations reflect more open water within the ice pack.
There’s a paper by Andersen et al. (2007) that compares several different sea ice algorithms (many of which are used by the different institutions linked to on WUWT) that may of interest for many of you to read so that you can better understand the differences in ice extent being reported.
As for the DMI data, I am not sure if they are using the updated version of ECMWF in their temperatures or not. If they are not, I would not trust the trends as several papers have been written on accuracy problems with that data set, in particular with regard to the temperature record (a quick google search will help you find those papers, some of which were published in Nature a couple years ago). With any reanalysis data product there are going to be problems because of lack of observations to assimilate into the model, especially north of 80N. I never use surface temperatures from reanalysis because they have been shown to not be very accurate. Instead I use near surface air temperatures at 925 mbars.
stevengoddard says:
August 16, 2010 at 9:06 am
Julienne,
My take from this site is that summers must have been generally cold at the North Pole over the past decade.
http://www.arctic.noaa.gov/detect/ice-npole.shtml
———————————-
Steve, I’m not sure I follow. That link is to web cams at the North Pole starting in 2002. So first off there is not context to past decades, and the images on the page show melt pond evolution through summer, which when looking at July would certainly not lead me to believe temperatures were getting colder the last few years.
Just The Facts quoting Mecago:
Wait ten years and ask your question again. I suspect of course that the predictions of the ice cap recuperating in THICKNESS IN A FEW YEARS AS WELL AS EXTENT (Made on this very site) will have been long forgotten. The next step in proselytizing will be Natural Global Warming as the official Oil Company sponsored Truth.”
And responding:
Impressive gibberish. Thank you for providing us with another example of why skeptics are winning this debate…
XXXXXXXXXXXXXXXXXXXXXX
Congratulate yourself all you want because, while you’re mocking others for supposedly making iron clad predictions, you seem to have selective amnesia for yours.
Besides, the ten years are not over yet. When they are, go back to square one.
Julienne says:
August 16, 2010 at 7:51 am
That’s why we have a “look out the window” webcam. For model data analysts to compare numbers to reality.
Far too often, especially in these times, analysts do not pay attention to anything but computer-generated data.
This is also why we communicate ‘weather’ to each other.
It’s really difficult to find reports that match what is going on down on planet Earth, what with the
“It’s a matter of if not when” occupational bias that colors the presentation.
Viewed from afar, the climactic institutions are doing an exceedingly poor job of it.
Sorry, but that’s how it looks to us mere mortals.
Julienne,
I highlighted the interesting passage.
” Julienne says:
August 16, 2010 at 7:48 am
Alexej,
I think you don’t quite understand the sentence. The sentence is in reference to the forecast made by Lindsay and Zhang’s numerical model.”
It does not matter if I understand the sentence, just one of the words. So Lindsay and Zhang 3.96 is a forcast (because a computer is doing it?). Meier, Stroeve and Serreze 4.74 do the same thing, but it is not a forecast? So you use the word “forecast” differently than normal people (“to make a prediction”, according to Webster’s). Is Goddard 5.5 (based on almost anything aviable) a forecast? Is Buergin 5, based only on ice not having grown 3 years in a row before, a forecast?
And “skill” obviously has nothing to do with ability? And when Serreze twaddles about the future, what does he do in climatespeak?
Looks like everything turned bold ;^) Not much of a highlight.
Steve, according to passive microwave retrievals of melt onset, the average melt onset date for the central Arctic (note of course the north pole is not observed by the satellite) is day 174, or June 23rd. (and further note I am not including the Beaufort, Chukchi, E. Siberian, etc. in my definition of the central Arctic). In 2007 the mean melt onset date for the central Arctic was day 171, it was day 170 in 2008, day 177 in 2009 and day 173 in 2010. It was quite a bit earlier though in 2004-2006 with values of 166, 162 and 167, respectively.
Note also in your above highlighted text they talk about extensive melt pond coverage in 2003 and 2004, and the lack of information from 2005 or 2007. I wouldn’t make a bold statement that temperatures have been getting colder the past decade based on this limited set of melt pond pictures.
Steve,
One of the things that I distinctly remember when watching the 2008 ice recovery from 2007, was that the JAXA sea ice extent for 2007 was at its maximum essentially at March-1 (graph eyeball, not table data) and did not reach its all time low till the last week of September; and I commented at the time (late 2008) that the 2008 refreeze; or at least the sea ice minimum extent per JAXA started about two weeks earlier, or maybe it was ten days; but in any case the 2007 melt season at least as delineated by JAXA sea ice extent was pretty much the longest on record; and some part of the 2008 “recovery” was likely due to that two week earlier start to the refreeze.
Clearly 2010 is fixing to mess with our heads once again with its “anomalous” gyrations.
Legal disclaimer !
I hereby declare that I had no part in the bolding of the above, since I have no knowledge of how to accomplish that.
mecago says: August 16, 2010 at 10:41 am
“Congratulate yourself all you want because, while you’re mocking others for supposedly making iron clad predictions, you seem to have selective amnesia for yours.
Besides, the ten years are not over yet. When they are, go back to square one.”
More drivel. I have written a multitude of comments on this site, can you identify one where I;
1. Congratulate myself
2. Mock others for supposedly making iron clad predictions
3. Have selective amnesia for my own predictions
?
You are not worth arguing with, as you don’t make any sense…
Here is the mean melt onset date derived for the central Arctic region from 1979 through 2010 for those who are interested (values given in day of year):
year melt onset date
1979 180
1980 173
1981 174
1982 178
1983 180
1984 175
1985 170
1986 175
1987 174
1988 178
1989 174
1990 175
1991 176
1992 177
1993 167
1994 172
1995 171
1996 183
1997 173
1998 167
1999 168
2000 171
2001 276
2002 174
2003 172
2004 167
2005 162
2006 167
2007 171
2008 170
2009 177
2010 174
from this data, there is a small trend towards earlier melt onset in the central Arctic at 2.5 days per decade.
Steve,
Ahh, I see how it works here… so if I make a video that overlays ‘This is 10%’ superimposed on the arctic, then that makes me right. I’ll get right on it.
On second thought, I’ll just stick with the numbers that I calculated from the actual data used to generate your arctic maps. The numbers that unequivocally come out to 10% difference between 2010 and 2007, regardless of what the text overlay in your video claims.
oops, 2001 should be 176 of course..
Matt
How about you figure out what the maps and data don’t agree? I don’t generate either, I just report on them.
Julienne,
So why does NOAA say that melt normally starts in early June (around day 152?)
Steve, several approaches exist to determine timing of melt onset. There’s the passive microwave method, which relies on the differences in the dielectric properties of snow and ice, and therefore their emissivities, which change drastically with ice and snow wetness. When melt water forms at the surface, the emissivity increases to close to 1 causing the surface to appear as a blackbody at microwave wavelengths. Following this initial melt, the snow/ice will either increase in wetness or it will refreeze (most likely during the night), strongly affecting the temporal evolution of the microwave signature. If wetness increases, the snow will at one point approach the emissivity of open water (even before the development of melt ponds), whereas refreezing results in very large snow grains because of the polymorphic aggregation of snow grains under equitemperature metamorphosis. This causes increased scattering and therefore a reduction in brightness temperatures (TB).
Melt onset in the Arctic has also been determined from buoy data from the International Arctic Buoy Program / Polar Exchange at the Sea Surface IABP/POLES [Rigor et al., 2000]. Satellite observations of course have the advantage of covering the entire Arctic which the buoy data cannot. But passive microwave melt detection has another advantage and that is that the microwave emission is directly related to the melt signature of sea ice (or the overlying snow cover).
Now what I quoted with my numbers was the melt onset of continuous melt. So not the first date that melt was detected but the first date when the melt continues for the summer. A first melt event may be followed again by freezing and does not represent the true time-period of the melt season.n I believe NOAA is probably giving you the first day temperatures rose above freezing, but I’m not sure. Also when we compared with buoy data, we found that our continuous melt season occurred on average 8 days later than what the POLES buoy data would suggest. It should be noted, though, that the POLES temperatures are rather constant during the summer months so that small changes in the POLES threshold for determining melt conditions may significantly change the agreement between the two methods.
Steve,
Just guessing but probably the NOAA is referring to the date of onset of melt within some larger area than Julienne’s “central Arctic region “. Perhaps you ought to link to the specific statement by NOAA you have in mind so others could easily check up on what precisely they meant.
Alexej Buergin says:
August 16, 2010 at 11:05 am
Those are all forecasts, which is a projection into the future based on past information, it doesn’t matter if you use a model to estimate the minimum, or a statistical approach or a heuristic approach. The words prediction and forecast are not very different from each other, prediction tends to be more general term.
What I think you didn’t understand was the context of the sentence you pointed out. Skill has to do with how well the model (or method) forecasted or predicted the outcome.
Just The Facts said:
Impressive gibberish. Thank you for providing us with another example of why skeptics are winning this debate…
Mecago responded:
“Congratulate yourself all you want because, . . .”
Just The Facts, that statement about self congratulations was with reference to your declaring yourselves winners of this debate.
As for the statements that I made concerning yourself I believe I should have written “yourselves” instead. That would have been with reference to the whole Skeptic community that you stated was winning the debate, not necessarily with every individual.
Sorry for the typo, since I wasn’t thinking about you except for the self congratulations.
The selective amnesia and mockery is self evident on this thread and the site itself.
Julienne says:
August 16, 2010 at 12:35 pm
“What I think you didn’t understand was the context of the sentence you pointed out. Skill has to do with how well the model (or method) forecasted or predicted the outcome.”
IOW Mark Serreze has no skill..
Thanks
mecago says:
“The selective amnesia and mockery is self evident on this thread and the site itself.”
All of that gets corrected. Why? Because comments like yours are allowed here, even encouraged. But alarmist blogs are so frightened of the truth that they delete it before their readers are contaminated by it.
Please go tell your pals at realclimate that their tiny little echo chamber fails because of their policy of censoring comments that do not fit within their catastrophic global warming agenda.
Steve,
If I understand it right – you’re doing some kind of pixel counting on the NSIDC-produced images themselves to come up with your percent difference between 2007 and 2010. If I were trying to figure out where the discrepancy lies, the first thing I’d do is look for bugs in the code you are using to count the pixels.
“Julienne says:
August 16, 2010 at 12:35 pm
Those are all forecasts, which is a projection into the future based on past information, it doesn’t matter if you use a model to estimate the minimum, or a statistical approach or a heuristic approach. The words prediction and forecast are not very different from each other, prediction tends to be more general term.”
Well, the word “group” means something very different to a mathematician than to a sociologist. And “force” in the prayer is not “force” in physics. But we agree that a person doing a SEARCH outlook as a member of one of these groups is a forecaster. And we might agree that Dr. Meier is an original thinker.
Matt
There is nothing wrong with the code which does the pixel counting. I have done comparisons between NSIDC maps and graphs for two years, and normally they match fairly closely.
Anyone with even the most rudimentary estimation skills, can see that the growth since 2007 is considerably greater than 10%.
[youtube=http://www.youtube.com/watch?v=KlhZKosj4bI]
[REPLY – They’ll get that 10% number by averaging it throughout the year. Thing is that for most of the year there is almost no difference! It only really pops out during the peak of the melt season. During that period, the number is a HECK of a lot larger than 10%! ~ Evan]
mecago says: August 16, 2010 at 12:49 pm
“Congratulate yourself all you want because, . . .”
“Just The Facts, that statement about self congratulations was with reference to your declaring yourselves winners of this debate.”
I stated that “skeptics are winning this debate”. This is not self congratulations, but rather a statement of fact:
http://www.rasmussenreports.com/public_content/politics/current_events/environment_energy/energy_update
“Forty-five percent (45%) say global warming is primarily caused by long-term planetary trends. Thirty-four percent (34%) feel human activity is the main contributor. Eight percent (8%) think some other reason is chiefly to blame. Voters have been shifting away for well over a year from the idea that human activity is the primary cause of global warming. ”
Apparently a majority of the people can see through the empty rhetoric that you and your ilk tend to spout…
Evan,
The 10% number came from the NSIDC graph on the same date as the NSIDC maps.
Steve,
The eye is notoriously bad at estimating relative sizes and shapes. E.g. http://www.opticalillusion.net/optical-illusions/the-wonky-window-size-constancy/
In your comparison images, the eye would be easily fooled, since its comparing a relatively solid green area with scattered red areas. This is why we have computers. No need for sloppy estimates.
Now, on the subject of computers, since I have no idea what methods you’re using to reach your estimate of the difference between the two years, yet for the days I’ve compared I calculate exactly the difference suggested by the NSIDC graph, the only conclusion I can draw is that one of your methods is introducing error.
However, you can help clear this up – I believe this blog has frequently called for the scientific community to open their data and codes up for public scrutiny. So I ask you to do the same. Either post the ‘raw’ numbers your getting from your pixel counts, or post your code. Simple as that.
Re: Matt on August 16, 2010 at 1:29 pm
Response to “bugs in code” line.
BTW, if you think code can be allowed to progress this far without such a function being thoroughly tested and verified, you may be or have been a Microsoft programmer. 😉
Reply: Looks like the image you linked does not allow direct linking. ~ ctm
Just The Facts says:
I stated that “skeptics are winning this debate”. This is not self congratulations, but rather a statement of fact:
Congratulate yourself (Added correction. “yourselves”) all you want because, while you’re mocking others for supposedly making iron clad predictions, you seem to have selective amnesia for yours.
Besides, the ten years are not over yet.
Debates are not statements of facts, they are rhetorical combats played out in the minds of people. You would be the first to call people ‘stupid’; one moment, when a poll goes against your beliefs as you would call those same people ‘enlightened’, a split second later, when the polls turn your way.
I, on the other hand, go along with Dilbert (of cartoon fame) and say that “Everyone’s an idiot.” So there is nothing to win one way or another.
Also, as I keep saying, wait ten years and remember this moment. You could also take a poll then, if it will make you feel better. By the way, everyone that Scott Rasmussen was a consultant for the Bush administration. His polls seem to mysteriously lean right.
And, concerning the selective amnesia I keep mentioning; please always remember, and do never forget, that it was on this site that it was predicted that the Ice Extent would go back to 1979 levels. Ice thickness was supposed to recover in “a few years”.
Amazing, how 8, 9 and 10 year thick ice can recover in “a few years”.
Matt
There is no optical illusion. I can cover the 2007 ice with six of the current deltas. That is a 17% increase. 1 / 6 = 16.7%
[youtube=http://www.youtube.com/watch?v=keCMmJVl1Eg]
Julienne says:
August 16, 2010 at 11:38 am
from this data, there is a small trend towards earlier melt onset in the central Arctic at 2.5 days per decade.”
I guess it depends where you draw your trendline from but when your data set is such that one or two years unusual results can radically alter the trendline.
I can for example say that there has been no discernible trend either up or down over the past 18 years or I can say that since 1998 we’ve seen an upwards trend.
To: Charles the Moderator
Re: me on August 16, 2010 at 2:40 pm
Strange, Google image search found it here:
http://www.zgeek.com/forum/gallery/showimage.php?i=50905&catid=newimages
and right-click View Image brought it up with that URL:
http://www.zgeek.com/forum/gallery/files/1/0/8/polar-bear-face-palm_thumbnail1.jpg
I just pasted the URL in the address bar at a different browser tab and it worked.
But that URL doesn’t work from here.
Oh I see, it’s set up for “no blog use,” the “bad” URL is:
http://www.zgeek.com/noleech.jpg
Dang it, I’ve seen that one used here before. Maybe by smokey?
Oh well, here’s a TinyPic replacement URL:
http://i35.tinypic.com/4pyq02.jpg
Smokey says:
August 16, 2010 at 1:16 pm
mecago says:
“The selective amnesia and mockery is self evident on this thread and the site itself.”
All of that gets corrected. Why? Because comments like yours are allowed here, even encouraged. But alarmist blogs are so frightened of the truth that they delete it before their readers are contaminated by it.
Please go tell your pals at realclimate that their tiny little echo chamber fails because of their policy of censoring comments that do not fit within their catastrophic global warming agenda.
I have been to http://www.realclimate.org and seen your fellows comment there. More so on http://www.skepticalscience.com . On Skeptical Science your brethren comment very often and have a high level of acceptance without the name calling I so often times find here.
Also, it may interest those on this site to know that the Moderators at http://www.climateprogress.org have a policy on banning or carefully observing any negative mention of Lord Monckton. They must have his name in their computer censors, along with profanities.
At Skeptical Science, Lord Monckton dropped into their “Abraham responds to Lord Monckton” thread, with his usual rant. Not only was he not censored but a statement by someone apparently calling Lord Monckton a liar was edited.
http://www.skepticalscience.com/news.php?p=2&t=82&&n=218#16385
Matt
Today’s pixel count is :
27041 – 2007/2010 concurrent
6050 – 2010 only
1168 – 2007 only
That shows a 17% gain over 2007.
Today’s NSIDC graph also shows about 17% gain over 2007. As I mentioned earlier – today the graphs and maps match.
The problem occurred a few days ago, when the graph showed less than 10% and the maps were much higher.
Julienne, you give great educative answers, for which I thank and compliment you. If I may ask:
ECMWF is forecasting some big highs over Greenland and the Canadian Archipelago with depressions on the other side in the coming 7-10 days. What do you think it might do to the remaining ice, considering the state it seems to be in (ie thin and very mobile)?
mecago says: August 16, 2010 at 3:08 pm
“Debates are not statements of facts, they are rhetorical combats played out in the minds of people.”
Well I think we’ve identified a fundamental difference here, as us skeptics tend to think of facts as an intrinsic part of debate…
Matt says:
August 16, 2010 at 2:27 pm
Steve,
The eye is notoriously bad at estimating relative sizes and shapes. E.g. http://www.opticalillusion.net/optical-illusions/the-wonky-window-size-constancy/
Here’s another one that I like:
http://www.graphicdesignforums.co.uk/graphic-design-forum/608-adelson-checker-shadow-illusion.html
This could also possibly affect interpretation of some imagery.
mecago says:
August 16, 2010 at 3:43 pm
Interesting. A week or two back I made a fairly mild post pro-Judith Curry on Climate Progress, where she was being ritually lynched, and it vanished without trace.
mecago
Yes, I’ve noticed that tamino has cut back on his censorship recently too.
stevengoddard says:
August 16, 2010 at 4:44 pm
“Yes, I’ve noticed that tamino has cut back on his censorship recently too.”
I disagree he may let one comment through, which he will reply with a bunch of inline BS and allow for no further comment. Tamino is a CSP, I have met many in my life.
R. Gates says:
August 15, 2010 at 9:26 am
You may have (perhaps accidentally) done the ultimate cherry-pick here, as the JAXA numbers (km^2) for 08/15 are:
2008 = 5983125
2010 = 5981406
Just a hair’s difference, and considering that 2008 lost on average 21029 km^2 more per day over 2010 during the last 12 days (i.e. – greater than 250000 km^2 total), I imagine 08/15 may have been the LAST day of the melt season were 2008 had a higher extent than 2010.
So to be lower than 2008 will take tying the record high loss between now and the minimum, but this is a “real race” versus beating 2005 and 2009, where if it follows the 2006 track it will beat these by 85000 and 150000 km^2, respectively? Sorry, don’t buy it…there’s a good chance of finishing between 2008 and 2009, but there seems to be a much higher probability of topping 2009 and even 2005 than going below 2008, so I’ll consider topping 2009 the “real race”.
Last spring I thought you indicated only the minimum mattered because the “narrows” during the summer (and before) didn’t matter much. Has this changed?
-Scott
David W says:
August 16, 2010 at 3:31 pm
To see this visually, here’s the graph. (Sorry for the poor resolution—Open Office decided to start hicupping.)
http://img807.imageshack.us/img807/3873/meltonset.jpg
The r^2 value for the entire period is 0.2.
mecago says:
August 16, 2010 at 3:43 pm
Smokey says:
August 16, 2010 at 1:16 pm
mecago says:
“The selective amnesia and mockery is self evident on this thread and the site itself.”
All of that gets corrected. Why? Because comments like yours are allowed here, even encouraged. But alarmist blogs are so frightened of the truth that they delete it before their readers are contaminated by it.
Please go tell your pals at realclimate that their tiny little echo chamber fails because of their policy of censoring comments that do not fit within their catastrophic global warming agenda.
I have been to http://www.realclimate.org and seen your fellows comment there. ”
As someone who has seen a number of rational posts at Real Climate vanish without a trace I have to call you on this one Mecago.
The modus operandi of real climate is to let an initial anti-AGW post in which will then be countered with a flawed response from one of their plebs. They then selectively censor your follow up post dependent upon whether they think they can pick flaws in it or your presenting a solid, hard to rebut, position. From that point they will only let flawed responses through so they can point out how unsound the anti-AGW position is.
Unless you are a rabid AGW convert, it is very clear that Real Climate has no interest in real debate. They’re a bit like a radio shock jock that will cut the caller off as soon as the caller says something they dont want to hear.
Their highly misleading censorship approach is one of the early things that actually made me become more open minded about climate issues having previous been very much pro-AGW.
Günther Kirschbaum says:
August 16, 2010 at 4:06 pm
If it sets up to be the Dipole Anomaly, then I would expect more compression towards the pole. The ice divergence under the central Arctic low pressure helped to spread the ice out and likely thin it further from lateral and basal melting, so that would certainly make the ice easier to compact as it’s compressed poleward. NSIDC’s extent is currently just below 6 million sq-km, and the rate of ice loss for August thus far has been about average. A dipole pattern could certainly lead to enhanced ice retreat depending on how strong the pressure gradients set up and exactly where the highs and lows are located. You will likely also get more advection of heat into the Arctic under this SLP pattern.
Norm in Calgary says:
August 15, 2010 at 11:16 am
How can they keep showing the Arctic on fire (Temperature wise) while the Arctic temperatures are well below normal all summer?
______________________________________
Like this – CLICK
Ralph says:
August 15, 2010 at 11:32 am
This is Tom Wagner from NASA telling us that Greenland is warming at 3.5 degrees per decade. (presumably oF, not oC)….
________________________________
This graph puts the temperature in perspective:
Greenland for 10,000 yrs: http://4.bp.blogspot.com/_cHhMa7ARDDg/SsZbFvC5SJI/AAAAAAAABLY/uZxh6g17bmE/s1600-h/GISP2_10Ke.jpg
This paper, Temperature and precipitation history of the Arctic states:
“..Solar energy reached a summer maximum (9% higher than at present) ca 11 ka ago and has been decreasing since then, primarily in response to the precession of the equinoxes. The extra energy elevated early Holocene summer temperatures throughout the Arctic 1-3° C above 20th century averages, enough to completely melt many small glaciers throughout the Arctic, although the Greenland Ice Sheet was only slightly smaller than at present… As summer solar energy decreased in the second half of the Holocene, glaciers reestablished or advanced, sea ice expanded, and the flow of warm Atlantic water into the Arctic Ocean diminished. Late Holocene cooling reached its nadir during the Little Ice Age (about 1250-1850 AD), when sun-blocking volcanic eruptions and perhaps other causes added to the orbital cooling, allowing most Arctic glaciers to reach their maximum Holocene extent…”
The starting point sure make a difference doesn’t it? If you start at the end of the last Ice Age we are cooling by about 2-3C, if you start at the end of the Little Ice Age we are warming by 2C.
Richard says:
August 15, 2010 at 12:57 pm
Evidence is king. Did any ships make it/ are there any trying to make it, through the NW Passage?
___________________________________________
It sounds like that Icebreaker is crunching its way through the NW Passage so that makes comparisons apples and oranges. I do not consider the passage “open” if an Icebreaker is slamming its way through or other ships follow in its wake.
http://www.nunatsiaqonline.ca/stories/article/100810_Northwest_Passage_still_hard_to_navigate/
stevengoddard said August 16, 2010 at 4:44 pm:
Perhaps he needs the time to work on an album.
🙂
Walt Meier says:
August 15, 2010 at 5:43 pm
(especially in a changing climate)…… However, as for the long-term forecast, things are clearer – we will lose the summer sea ice as temperatures warm. It’s a matter of if not when….
________________________________________________
Dr Meier have you bothered to read these papers plus the NASA and Woods Hole Oceanographic Institution articles??? The certainly seem to cast doubt on what you are saying.
Temperature and precipitation history of the Arctic
“…Solar energy reached a summer maximum (9% higher than at present) ca 11 ka ago and has been decreasing since then, primarily in response to the precession of the equinoxes. The extra energy elevated early Holocene summer temperatures throughout the Arctic 1-3° C above 20th century averages…..”
Lesson from the past: present insolation minimum holds potential for glacial inception (2007)
“Because the intensities of the 397 ka BP and present insolation minima are very similar, we conclude that under natural boundary conditions the present insolation minimum holds the potential to terminate the Holocene interglacial. Our findings support the Ruddiman hypothesis [Ruddiman, W., 2003. The Anthropogenic Greenhouse Era began thousands of years ago. Climate Change 61, 261–293], which proposes that early anthropogenic greenhouse gas emission prevented the inception of a glacial that would otherwise already have started….”
Solar activity reaches new high – Dec 2, 2003
” Geophysicists in Finland and Germany have calculated that the Sun is more magnetically active now than it has been for over a 1000 years. Ilya Usoskin and colleagues at the University of Oulu and the Max-Planck Institute for Aeronomy say that their technique – which relies on a radioactive dating technique – is the first direct quantitative reconstruction of solar activity based on physical, rather than statistical, models (I G Usoskin et al. 2003 Phys. Rev. Lett. 91 211101)
… the Finnish team was able to extend data on solar activity back to 850 AD. The researchers found that there has been a sharp increase in the number of sunspots since the beginning of the 20th century. They calculated that the average number was about 30 per year between 850 and 1900, and then increased to 60 between 1900 and 1944, and is now at its highest ever value of 76….”
Solar Cycle 24 is not following the pattern of high activity according to the Solar Dynamics Observatory Mission News
“We want to compare the sun’s brightness now to its brightness during previous minima and ask: is the sun getting brighter or dimmer?”
The answer seems to be dimmer. Measurements by a variety of spacecraft indicate a 12-year lessening of the sun’s “irradiance” by about 0.02% at visible wavelengths and 6% at EUV wavelengths.”
Woods Hole Oceanographic Institution gives a warning about the myopic view of most climate scientists Abrupt Climate Change: Should We Be Worried?
“Most of the studies and debates on potential climate change, along with its ecological and economic impacts, have focused on the ongoing buildup of industrial greenhouse gases in the atmosphere and a gradual increase in global temperatures. This line of thinking, however, fails to consider another potentially disruptive climate scenario. It ignores recent and rapidly advancing evidence that Earth’s climate repeatedly has shifted abruptly and dramatically in the past, and is capable of doing so in the future.
Fossil evidence clearly demonstrates that Earth vs climate can shift gears within a decade….
But the concept remains little known and scarcely appreciated in the wider community of scientists, economists, policy makers, and world political and business leaders. Thus, world leaders may be planning for climate scenarios of global warming that are opposite to what might actually occur…“
I am trying to make sense of the atmospheric temperature anomalies reported by the NCEP Climate Data Assimilation System (CDAS) over Antarctica:
http://www.cpc.noaa.gov/products/intraseasonal/temp10anim.shtml
http://www.cpc.noaa.gov/products/intraseasonal/temp30anim.shtml
http://www.cpc.noaa.gov/products/intraseasonal/temp50anim.shtml
Is the large positive anomaly over Antarctica indicative of what occurs when the Antarctic polar vortex breaks down;
http://www.cpc.noaa.gov/products/intraseasonal/z500_sh_anim.shtml
and non-polar air penetrates? Is a portion of the anomaly associated with latent heat being released due to rapid and expansive sea ice formation? Is there another atmospheric temperature data set that these anomalies can be compared to in order to assess their accuracy?
Thanks a lot, Julienne.
If it sets up to be the Dipole Anomaly
At what point can one say: OK, the DA has set up? Or can you only do that in hindcast? To my amateur eyes it looks like the DA has set up since a few days, with PIPS ice displacement arrows finally pointing towards the right and ECMWF forecasting things to stay like this for at least a few more days.
Günther
As mentioned in the article, I agree. I expect to see a significant decrease in extent over the next week – because of winds compressing the ice towards the pole.
Frank K. says:
August 15, 2010 at 5:48 pm
Julienne says:
August 15, 2010 at 1:41 pm
Frank K. says:
August 15, 2010 at 11:23 am
Frank, no one at NSIDC has ever predicted a seasonally ice-free Arctic by 2012. That prediction was made by a scientist at the Naval Postgraduate School.
–
Fair enough, Julienne, but the article I linked to states:
“The Centre has been predicting that the Arctic Ocean could be virtually ice-free by 2012 but that point may be reached within months rather than years.”
The Centre = NSIDC.
Was the Telegraph wrong? If so, I hope a request for a correction was submitted by the NSIDC…
XXXXXXXXXXXXXXXXXXXXXXXXXXXXXXXXXXXX
One of the most absurd things I have heard from this site, and several times at that, is how we are responsible for Media falsifications. You know damn well that the Telegraph, an anti-AGW/right wing newspaper will write whatsoever it damn well pleases.
You display the same type of mentality as those who blame the victim of rape for her assault.
Besides, if you are really aware of what the other side is saying you would know damn well what they are really saying instead of relying on secondary sources. As I have already stated, 2020-2030 is what Climatologists are predicting, with some still clinging to later dates.
That is such a ridiculously easy fact to verify. That you continue to speak as if it where otherwise is an indication of bad faith. You obviously wish to continue pretending that you believe those pathological liars at the Telegraph just to have a lame and false argument.
If you really don’t know the target date which the majority of Climatologists are predicting a summertime ice free Arctic then you should have the humility not to speak on the issue at all.
Steve Goddard
Can you point me to links to easily readable formats for daily NH and SH sea ice extent (or area, or a reliable index would also do). csv or text files would be ideal.
NH data is fairly easy to get hold of, but SH is quite another matter.
I’d quite like to assess the question of correlation for myself.
mecago, you sound like a total lunatic. If you honestly think we’ll have an ice free arctic between 2020-2030, you are completely deluding yourself. You are exactly the type of poster that gives “AGW Almarists” a bad name.
Its almost laughable you think it’s a “ridiculously easy fact to verify” that it will ice free in 2020-2030….for one its not a fact at all since it hasn’t happened yet. Two, we would need an absolutely unprecedented decline in arctic sea ice sometime between now and then to even think about that occurring, something that would make 2007 look like a fly compared to a moose.
Your post is a complete joke and has zero scientific evidence to it. Where is this “Ridiculously easy to verify” evidence? Good luck coming up with a reasonable explanation.
Jordan,
Binary ice data for the northern and southern hemispheres are here ftp://sidads.colorado.edu/pub/DATASETS/seaice/polar-stereo/nasateam/ Recent data are in near-real-time, and historic data are in final-gsfc.
stevengoddard says:
August 16, 2010 at 3:52 pm
Matt
Today’s pixel count is :
27041 – 2007/2010 concurrent
6050 – 2010 only
1168 – 2007 only
That shows a 17% gain over 2007.
Steve – couple points:
1) How are you calculating the 17%?
If I understand it right, 27041 is the ‘OR’ area of 2007 and 2010. 6050 is what appears in 2010 only (the green in your maps), and 1168 is the 2007 only (the red in your maps). So from these numbers, we can determine the following:
2007 total area — 27041 – 6050 = 20991
2010 total area — 27041 – 1168 = 25873
So calculating a % difference:
(25783-20991)/((25783+20991)/2) = .208 or 21%
Or % error:
(25783-20991)/20991 = 23%
2) Considering the total amount of ice area pixels in the raw data has been less than 10k since the beginning of August, your pixel counts seem high. I’m not sure what source you’re using for your image, but if your total pixel area is in the neighborhood of 20k pixels, I suspect that somewhere in the data->image->data pipeline theres some subsampling going on. Depending how the subsampling is done, this could easily bias your results high or low.
Found another nice article in the UK Telegraph:
http://www.telegraph.co.uk/earth/earthnews/5116352/Arctic-will-be-ice-free-within-a-decade.html
How strange, around here when observational records, including anecdotal and photographic evidence, are presented that show the Arctic area had less ice within the last century, it gets discredited as unreliable and unbelievable and it is stressed only the satellite records are trustworthy. But such observational records can show the current levels are lower than they have been for at least a century, something scientists are confident of.
The South Pole is melting due to climate change? Those ice bridges just stayed in place indefinitely until
anthropogenic global warmingclimate change began?Well, at least Dr. Meier has noticed the climate models just don’t get it right.
😉
From: stevengoddard on August 16, 2010 at 3:52 pm
Therefore,
2007: 27041+1168=28,209
2010: 27041+6050=33,091
2010/2007 is 33091/28209 = 1.1731
Thus 2010 is 117% of 2007, aka a 17% gain.
And I have no idea just what the heck Matt is trying to show.
Kadaka,
Ah, gotcha – it works if the 27041 number is the ‘AND’ value between the two years. The wording Steve used wasnt clear.
The DMI ice graph (http://ocean.dmi.dk/arctic/icecover.uk.php ) dropped sharply today, bringing it down to 2009 levels. My hunch is that we won’t see 2005 levels this year, more likely 2009 levels or perhaps slightly below that (but I would be surprised to see 2008 levels or lower).
Meanwhile, it’s raining today and summer seems like already gone here at 60 N 🙁
Thrasher says:
August 17, 2010 at 12:18 am
mecago, you sound like a total lunatic. If you honestly think we’ll have an ice free arctic between 2020-2030, you are completely deluding yourself. You are exactly the type of poster that gives “AGW Almarists” a bad name.
Its almost laughable you think it’s a “ridiculously easy fact to verify” that it will ice free in 2020-2030…[–SNIP–]
XXXXXXXXXXXXXXXXXXXXXXX
Thrasher, I don’t know what time zone you’re in but you could use a caffeinated brew of some form or another.
You should first read the WHOLE post and then go back to the original post a person is responding to in order to pick up on the context of the discussion.
http://wattsupwiththat.com/2010/08/15/sea-ice-news-18/#comment-459188
I was responding to Frank’s statement directed to Julienne where he was trying to lay blame for a Telegraph article misquotation on the NSIDC. It seems that he and others want to claim that AGW’s are predicting 2012 (or 2013) as the date for “Summertime ice free Arctic [for a few days initially]”.
The above sounds like a distortion of a prediction made by ONE single gentleman, by the name of Maslowski, who made a prediction that went something like “%70 possibility of ice free Arctic, in the summer, from 2013-2015.”
Maslowski’s, or any other similar prediction is IRRELEVANT because, as I already have stated several times in the past (to no avail), virtually all Climatologists are saying 2020-2030 for that precisely defined occurrence.
So, read my lips. The emphasis of my complaint was that Climatologists are being misrepresented by having things put in their mouths that they never said.
As for what I believe, I do go along with the following precisely worded predictions I already stated, namely that:
“By the year 2020-30 we will have, with the exception of a thin band of ice hugging the Northern Canadian Arctic Islands, the following conditions in the Arctic Sea will occur: It will be seasonally ice free in the Summer. This ice free state will initially last for a few days and then progress to weeks, then months in subsequent years.”
I recall hearing a Naval official say that he expected to see the Arctic Sea open for 4 weeks by 2035. Below is an article from the Naval “Stars and Stripes” web site. Of course if it will make you feel better to call the Navy (Hmmm, what is it that you called me?) “total lunatics” be my guest. I’m sure that one of your “rational”; “level headed”; none dare call him “Total Lunatic” leaders like His Lordship, would calmly and sanely deduce that the Navy has been infiltrated with Fascistic Vegetarian Lesbians.
http://www.stripes.com/news/navy-s-role-in-the-arctic-may-change-as-icy-lanes-clear-up-1.94368
In the link below I give the example of a high powered consulting group such as Global Business Network, a member of the Monitor Group, that incorporates such predictions of an ice free Arctic into their business scenarios. (Another sneaky Communist plot this must be!)
http://arctic-council.org/filearchive/AMSA%20Scenarios%20of%20the%20Future%20-%20%20Narratives%20Report.pdf
In conclusion, Thrasher, you should do some research on what is being said outside of your community.
Espen
As I mentioned in the article, there have been strong winds from the south compressing the ice over the last few days. This will probably go on for three more days. NCEP forecasts a return to cold temperatures later in the week.
[youtube=http://www.youtube.com/watch?v=Uc4pJ-6fdDM]
Just why is the United States of America federal government spending money on this useless data? It is in the same category of spending millions of taxpayers money (borrowed from China) to predict the number of hurricanes very year.
It will be interesting to see how much ice those warm southerly winds will melt in situe before the change Steve and, I think, someone else forecast earlier.
Andy
Steve,
In your initial post you said
“It has been the coldest summer on record north of 80N, and temperatures have dropped below freezing ahead of the average date.”
Have you got the data source for that, ie the actual temp values? It doesn’t make it clear where you got the data to come up with that information.
Andy
AndyW
DMI temperature data is here. You can click on any year since 1958 for comparison.
http://ocean.dmi.dk/arctic/meant80n.uk.php
Steve, you may be right about the compression, but looking at the concentration image at http://www.ijis.iarc.uaf.edu/cgi-bin/seaice-monitor.cgi?lang=e it seems that there are some central areas that have less ice concentration than last year at this time. But of course we may still see an earlier end to the melt season this year than last year.
The final days of the 2010 melt season are here and the horse race is on.
2010 is the 9th year in the JAXA record. How will it place?
As of today 2010 already has the 2003 minimum beat. Sorry 2003 you will remain in last place. This puts 2010 in a comfortable 8th place so far.
Next up is 2004 at 5.78 million k^2. Will it fall? Only time will tell.
stevengoddard says:
August 17, 2010 at 6:28 am
AndyW
DMI temperature data is here. You can click on any year since 1958 for comparison.
http://ocean.dmi.dk/arctic/meant80n.uk.php
Are you saying you just eyeballed it and don’t have the figures? How can you be sure that you don’t have a bias introduced due to your leanings on this matter?
I think you should have at least put some sort of point to that affect with your statement if that is what you did.
Andy
AndyW
Gee. If climate people would start releasing the data which they use to make graphs, it would sure make life easy for us, wouldn’t it?
JAXA seems to be about the only organisation which provides simple, daily X-Y digital data.
I don’t know about the DMI data, but I just created a Jun-Jul mean from NCEP/NCAR 925 mbar air temperatures from 1948-2010 for the 80-90N region. The 1948-2010 average Jun-Jul 925 mbar air temperature is -0.34C. For 2010 the value is 0.58C. Thus, 2010 is not tracking as the lowest ever temperature for 80-90N in this reanalysis data set.
The mean for 2010 is lower than for 2007-2009, but it remains warmer than the 1948-2010 mean.
stevengoddard says:
August 17, 2010 at 8:50 am
AndyW
“Gee. If climate people would start releasing the data which they use to make graphs, it would sure make life easy for us, wouldn’t it?”
Good point. I doubt this will not be UEA mk2 though 🙂
As an aside do you have any thoughts on why there are such big fluctuations apart from in the summer months? I’m sure that point has cropped up before but I am more JAXA than this site so it may have passed me bye. It seems a bit odd.
Andy
oops spelling!
Thanks Julienne that’s good to know. The reason I came back to Steve’s point is that his statement has appeared somewhere else on the web and already he is being both misquoted and it is now becoming “fact” that Arctic summer 2010 is the coldest ever, even though it has not ended.
Andy
From: mecago August 17, 2010 at 4:45 am
Wikipedia:
From GBN’s “About GBN: What We Believe” page:
And the Ideas section of GBN’s main page:
Berkeley, “The West” losing relevance, and the Rockefeller Foundation.
Was that crack about a “sneaky Communist plot” supposed to be a joke?
True Communism is dead, the “intellectual elite” has gotten scared after seeing what happens when the “uneducated peasants” work their way into the power structure, as in the former USSR (or CCCP if you prefer), or a family line of megalomaniacs as in North Korea, and they have noted the Chinese example where their Communist Party has adopted elements of capitalism to prosper while maintaining rigid control over the people.
Thus One World Government controlled by the Intellectual Elite has been the goal for awhile now. Per Maslow, the “common people” must have their basic needs fulfilled: keep them clothed and sheltered with food in their bellies (by government handouts as needed), give them work to keep them occupied (even government jobs as needed and possible), let them feel they are accomplishing something (e.g. ownership of a home by paying off a large mortgage), and let them know they will not be discarded (Social Security, Medicare/Medicaid leading to “universal” health care). Thus they will be quiet and amenable to being led by their superiors (per China). Let capitalism control the economy, but in a tightly-controlled fashion, with capitalism being handy for blaming for any economic woes even when they are actually caused by the government. Then press for a One World government (Rockefeller Foundation, GBN’s repeated mentions of the importance of NGO’s which normally coordinate with the UN) so their government model is the only one available.
Thus the elite can have control, the power and the money, and not worry about the Ignorant Unwashed Masses screwing things up (for them) as usual.
Nope, not a Communist plot at all.
And of course, the Urgent Need to combat
Anthropogenic Global WarmingCLIMATE CHANGE is a great excuse for the resultant decline from the previously-expected Western (read United States-type) lifestyle…🙂
Breaking Global Warming (Climate Change) down to it’s purest base element: If all U.S. Government grants, subsidies and other funding for the studies, etc., of them were to cease today, so would they.
It really is that simple.
Put another way: Algore wasn’t able to use it to get himself into the White House, but he’ll take the next best thing– the penthouse.
Julienne
I am having a difficult time believing that the average summer temperature north of 80N is below freezing. I have always read that it is between 1 and 2 C, as DMI shows.
Most of the cold has been in August anyway, which is not included in your analysis.
Steve, I’m not able to include August yet since I used the monthly time-series link in the NCEP/NCAR data (http://www.esrl.noaa.gov/psd/cgi-bin/data/timeseries/timeseries1.pl).
One thing you should note is that I am reporting on near-surface air temperatures at 925 mbars and I’m not exactly sure what DMI is reporting. I do not trust surface temperatures from reanalysis data sets since reanalysis fields for variables such as terms of the surface energy budget are less reliable as they are not directly influenced by observations of that variable. It is also not clear (or easy to find out) what is actually assimilated at a given time and location.
This is about AO index which affects Northern temps. The NOAA CPC website shows May-August AO index as an undulating curve, with highs a bit over +1 and lows at -2.
http://www.cpc.noaa.gov/products/precip/CWlink/daily_ao_index/ao_index.html
Yet the 3- month running mean AO index graphic shows a positive value of +2 right now. Am I missing something?
http://www.cpc.noaa.gov/products/precip/CWlink/daily_ao_index/month_ao_index.shtml
Well my current forcast for 2010 Arctic sea ice minimum is 4.84E^ km^2 (standard deviation = 0.22E6 km^2).
2010 passes (is lower than) the minima for 2004, 2006, 2005, and 2009 on 8/19, 8/19, 8/29, and 8/31, respectively.
From: EFS_Junior on August 17, 2010 at 11:25 am (Sea Ice News #18)
From: EFS_Junior on August 10, 2010 at 11:08 am (SIN #17)
That’s the spirit! Keep being optimistic and adjusting that forecast upwards, maybe it’ll even get close to the final figure!
How long has Steven kept with his original numerated forecast made way back on…?
😉
Matt says “Binary ice data for the northern and southern hemispheres are here …”
Thanks for the tip Matt, but I have drawn a blank. I don’t know how to get data out of those binary files.
I’m looking for is a fairly simple series of daily southern hemisphere sea ice extent (or area or index or anomalies) in a csv file or txt file. There are graphs all over the place, but I cannot locate a data series.
NH is easy to get from JAXA.
Julienne
It appears that there have been low clouds over the North Pole for almost the entire summer. If those clouds are lower than 925 mb (800 metres) then your numbers are probably not going to be a good indicator of 1000 mb temperatures.
Julienne,
I looked up the info on the source of your “reanalysis” data and it’s described thus:
“PSD maintains a collection of reanalysis datasets for use in climate diagnostics and attribution. Reanalysis datasets are created by assimilating (“inputting”) climate observations using the same climate model throughout the entire reanalysis period in order to reduce the affects of modeling changes on climate statistics. Observations are from many different sources including ships, satellites, ground stations, RAOBS, and radar. Currently, PSD makes available these reanalysis datasets to the public in our standard netCDF format:
*
NCEP/NCAR Reanalysis I (1948-present)
This reanalysis was the first of it’s kind for NOAA. NCEP used the same climate model that were initialized with a wide variety of weather observations: ships, planes, RAOBS, station data, satellite observations and many more. By using the same model, scientists can examine climate/weather statistics and dynamic processes without the complication that model changes can cause. The dataset is kept current using near real-time observations.”
I’m sorry, but while this data might be useful for determining broad temperature trends, to use it to claim a few tenths of a degree trend over several decades is, to me at least, total nonsense, especially given what Anthony Watts has managed to uncover about the surface stations themselves. And should I really trust NOAA to tell me the temperature of the Arctic for the past 62 years when all sorts of arguments have broken out in here over their published Arctic temps for just the past 6 months?
Now, the DMI graphs might suffer similar issues, or different issues, but they, at least, seem to be focused on the Arctic north of 80 degrees. My inclination is to presently give them more credence than a model designed to analyze (or re-analyze) data all over the globe. (I wish someone would explore the issue of reliability of DMI’s data, by the way.) I should add that the only use I’ve made of it is to cycle through the years 1958 to present, comparing summer temperatures graphically. If one does that it will become quite clear that they indicate that this is the coldest summer ever in the arctic, by their measures.
As I keep saying in here, the data in this field is really suspect. The more I learn, the more corrupted it seems to me. By the way, is this “Satellitegate” nonsense going around now for real, or is it just some more loony talk we should ignore? The first report I saw on it seemed so far-fetched that I put it in the “ignore” bucket.
Rod, you should understand that DMI is based on ECMWF. They are not producing the temperature fields, they are only showing you the temperature fields extracted from ECMWF. You can extract “focused”80-90N NCEP/NCAR temperatures the same way as DMI is doing from the ECMWF data. You can also do it from the JRA-25 Reanalysis (which is supposed to be more accurate) or from the MERRA reanalysis data set (which is supposed to be the latest and greatest reanalysis dataset). JRA-25 isn’t as current though as ECMWF or NCEP which is why these are typically used for near real time analysis. To believe the DMI extracted temperatures are more accurate than NCEP is false. (note ECMWF and ERA40 are the same thing). You can go here for some more information on the accuracies of the different reanalysis data sets (and then click on appropriate links):
http://gmao.gsfc.nasa.gov/research/merra/reanalysis_precipitation_climatology.php
Steve, what is your source for cloud cover and cloud heights for the Arctic this summer? Have you looked at Calipso data or some other satellite data source? Or is it based on station data?
kadaka (KD Knoebel) says:
August 17, 2010 at 12:09 pm
From: EFS_Junior on August 17, 2010 at 11:25 am (Sea Ice News #18)
Well my current forcast for 2010 Arctic sea ice minimum is 4.84E^ km^2 (standard deviation = 0.22E6 km^2).
From: EFS_Junior on August 10, 2010 at 11:08 am (SIN #17)
My current estimate for Arctic sea ice extent, bases on JAXA data 2003-2010 inclusive is 4.79E+^ km^2 (standard deviation is 0.25E+6 km^2).
That’s the spirit! Keep being optimistic and adjusting that forecast upwards, maybe it’ll even get close to the final figure!
How long has Steven kept with his original numerated forecast made way back on…?
😉
____________________________________________________________
If enough people guess a number, one of them is bound to guess the right number.
I have a statistical model, updated each day with the latest JAXA number, so I could give you a new number every day. I’ve posted several times, with each SIEU, since #12 (or #13), my first estimate was 3.9E6 km^2, as each day passes, all future estimates pivot from that new data point (+/- four sigma, I chose +1 sigma BTW), the model automatically converges to the actual minima (you’ll note that the standard deviation decreases chronologically, in all my estimates (and obviously to zero at the minima).
Or I could just guess a number, as SG has done.
IMHO, not a very foolproof methodology.
Steven Goddard:
A question. I remember hearing Dr Lindzen mention that that whipsaw temperature swings that occur in the DMI reading in winter-spring and fall-winter were likely caused by weather systems moving into the region. Can you post weather maps to go along with the ice charts etc so we can get an idea of what’s happening north of 80? Not that you don’t have enough to do…
Sean Peake
Arctic summer weather is different. It is buffered by the heat required to melt ice and remains in a narrow range.
Julienne
I looked at the North Pole web cams (mainly PAWS) almost every day this summer and they were nearly continuously overcast with low clouds. Which probably explains the low temperatures.
WOW look at the New NSIDC Sea Ice News (Aug 17) – – way at the end !
A MELT ONSET anomaly MAP !
http://nsidc.org/arcticseaicenews/
Found a different Sea Ice Concentration site
http://www.osdpd.noaa.gov/m1/ocean/seaiceprd.html
BUT this is from Polar sats so we see LOW concentration “holes” near the Pole, instead of a big Blackout Circle.
Sorry forgot to mention: the problem with 2010 has been the Early melt END.
—Looked up the DMI site for my Sea Ice Update – – only 2 years are even CLOSE to as cold in mid-year – – and both after 2000. 2010 especially unique after Day 200 (July 19, i think). Does correllate with Wayne Davidson’s claim that lots of Open water leads to Clouds, unless the Dipole Anomaly – – he says unless an EARLY LA NINA — chases the Clouds away. Hmmm.
2005 is out.
Looks like DMI ice extent is nose diving.
DR
similar to what’s happened before
http://img337.imageshack.us/img337/6342/0000000000000000000.png
2 more
http://img153.imageshack.us/img153/4027/quickdrops.png
EFS_Junior says:
August 17, 2010 at 4:09 pm
I disagree with the uncertainty reaching zero at the minimum. This is because you don’t know WHEN the minimum happens in a real-time dataset. It’s not until after the fact that you know the minimum has been reached (sometimes several days/weeks after), thus there should still be uncertainty.
-Scott
It is looking more and more like a 5 million minimum. Difficult to support either a 5.5 or 4.5 minimum at this point. With only 30 days or so of the melt season left, 5.5 would require an average of approx. 10,000 per day; 4.5 would require an average of approx. 43,000 per day. The average for the past few years is approx. 27,000 per day.
David Gould
Statistics don’t drive wind patterns.
Scott says:
August 17, 2010 at 8:30 pm
EFS_Junior says:
August 17, 2010 at 4:09 pm
I have a statistical model, updated each day with the latest JAXA number, so I could give you a new number every day. I’ve posted several times, with each SIEU, since #12 (or #13), my first estimate was 3.9E6 km^2, as each day passes, all future estimates pivot from that new data point (+/- four sigma, I chose +1 sigma BTW), the model automatically converges to the actual minima (you’ll note that the standard deviation decreases chronologically, in all my estimates (and obviously to zero at the minima).
I disagree with the uncertainty reaching zero at the minimum. This is because you don’t know WHEN the minimum happens in a real-time dataset. It’s not until after the fact that you know the minimum has been reached (sometimes several days/weeks after), thus there should still be uncertainty.
-Scott
___________________________________________________________
Yes that would be correct, there is always uncertainty going forward, that increases with time.
78 000 uncorrected for yesterday, it will be interesting how soon the rate drops off, possibly before the weekend, but then what will it be? 40-50’s or 20-30’s??
Andy
stevengoddard,
But the statistics are basically the statistics of wind patterns, as that is what drives extent loss at this time of year. Average wind patterns give us around 800,000 extent loss for the rest of the season.
stevengoddard,
The wind a major factor loosing ices. I have been living in the north all of my life. Every spring I have seen ice melting. The wind actually makes the final step of loosing ices. You can’t cut the wind out of the equations.
Steve is just looking for a narrative to excuse his prediction if it turns out to be wrong.
He talks about wind like it’s some kind of new thing.
Next he’ll blame the sun or summer or magic elves.
I’m starting to doubt that if his prediction is wrong he’ll man up and just admit it.
As the Saharan Dust storms have supressed the Hurricane season
— how much are the RUSSIAN PEAT FIRES cutting the winds ?
Look at the NOAA Global Aerosol Map — they extend all the way from Africa PAST CUBA.
http://www.osdpd.noaa.gov/ml/air/aer_month.html
PS http://www.osdpd.noaa.gov/ml — leads to a LOT of products, including the different Sea Ice under “Oceans”
Jeff P
LOL I have written at least a dozen articles recently highlighting the importance of wind. Many specifically devoted to that topic. Here is a good one for you to start with.
http://wattsupwiththat.com/2010/06/09/2007-sea-ice-post-mortem/
Could the recent departure of heat out of Russia be contributing to the sudden rise in Arctic temps in recent days?
So was the wind hiding before 2007? And now it shows up twice in 3 years to lower the ice extent numbers.
LOL, as if wind wasn’t around before 2007 and isn’t part of the average ice extent.
You live by the JAXA numbers you die by the JAXA numbers.
Just as: if the ice extent remains above 5.5 million K^2 you will brag that ice is recovering.
Then: If JAXA even cracks 5.5 million K^2 your “ice is recovering” theory will need to be reworked. And “I’m right except when there is wind in the arctic” doesn’t cut it.
DR
Absolutely. The negative Arctic Oscillation has caused mixing of air with lower latitudes and southerly winds.
Jeff P
My narrative/forecast hasn’t changed one iota. You just haven’t bothered to read the articles.
Hi stevengoddard,
nice article. Some comments about :
“As seen below, the symmetry between the North and South Pole is impressive through the satellite record. They always seem to move opposite each other and produce an approximately constant amount of sea ice. It would be nice if the experts focused on solving this relationship rather than making up forced explanations like the “Ozone Hole” – which has just started forming for the year and will be gone before Christmas.”
-> so it obviously shows, that sun exposure to Earth is quite stable in given period and thus humidity formation and further ice formation. But the heat exhaust distribution thru Poles fluctuates. So sometimes either of dominates the process, like SP now. This is possible because the heat flow is somewhat quantized, so depending on summer-winter conditions at that moment that the heat/humidity decides to travel, the direction is kind of randomly selected (or not??).
-> now it looks also more clear how this influences us. we have been living extreame summer here subpolar areas, like record number of above 25 C days and also monthly alltime high temperatures. Russian are still suffering forest fires, this is because Gulf stream does not pump humidity thru heat normally, but both have travelled to SP. Normal Atlantic south-west mixing humid wind pattern is missing because of lacking driving force and continental mid-east summer is spreading even to Scandinavia. This is interesting, because this missing flow was already visible during winter 2009/2010 in Northern Atlantic temperature patterns, but I was not able interpret it correctly at all, but knew that some change will take place. I was more expecting just opposite what actually happened. But as Russian stated, they really saw once every 1000 years summer there. So not an easy point to understand.
-> so just for curiosity, please check Joensuu (holds now Finnish record temperature of 37,2 on 62,7 N, can you imagine!!!) Jul-2010 for the jump in GISS:
http://data.giss.nasa.gov/work/gistemp/STATIONS//tmp.614029290001.1.1/station.txt
http://data.giss.nasa.gov/cgi-bin/gistemp/gistemp_station.py?id=614029290001&data_set=1&num_neighbors=1
Jeff P
Whether final ice extent comes in a little above or below 5.5000000 million, the amount of MYI should see significant growth by next spring.
You are aware NSIDC’s official forecast was also 5.5 million? I’m assuming that you are familiar with the concept of precision and error bars.
The last two days’ losses have been fairly high, and for the first time in almost two weeks the “use previous minima to predict this year’s minimum using current extent” method is yielding a result below 5e6 km^2. This number for me represents a bit of an imaginary threshold, as staying above this means we’re well above 2007/08. It is also the halfway point between the predictions of Steve and R. Gates.
Anyway, these losses need to slow soon or any chance of reaching last year’s extents will rapidly disappear.
-Scott
Steve Goddard: “My narrative/forecast hasn’t changed one iota.”
Not quite:
In Sea Ice #8 you narrated: “Conclusion : Based on current ice thickness, we should expect September extent/area to come in near the top of the JAXA rankings (near 2003 and 2006.)”
Your ice thicknesses were miscalculated and so obviously not a good predictor. The Jaxa ice area is already well below both 2003 and 2006 minimum values, while the extent should drop below tomorrow. There are still weeks of the melt season left.
I don’t expect your more recent prediction of 5.5 million square kilometers to look very good by the end of the month, either.
I am prepared to be surprised by your explanations for all this, though.
Everybody get ready for youtube to be flooded with “rotten ice” videos. Maybe they’ll come up with a new term since that one is pretty well debunked. They’ll likely stick to the biggest polynas they can find to avoid getting icebound, claim they are in a position they are not, and start claiming “phantom ice” that doesn’t really exist, its the water that’s fooling the satellites… I can see it now, they’ll claim that “air chilled boundary layer water” is fooling the satellites into thinking open water is ice covered.
Well Tom P, what was your prediction at the beginning or previous to the melt season? I have respect for anyone with the cojones to stick their neck out and make testable predictions. Obviously you’re not one of them.
Armchair quarterbacks, back seat drivers and finish line betters are always the most obnoxious.
mikelorrey says:
August 18, 2010 at 8:48 am
Everybody get ready for youtube to be flooded with “rotten ice” videos. Maybe they’ll come up with a new term since that one is pretty well debunked.
Mike, just because it is traditional to ridicule the concept of “rotten ice” in this solipsistic circle of fellow believers doesn’t mean that it’s true. I have yet to see a so called “skeptic” do a Google” search on the most basic subject or term before he/she spouts the party line.
“ROTTEN ICE” HAS BEEN A BONAFIDE TERM IN DESCRIBING A WIDE VARIETY OF DISINTEGRATING ICE ON GROUND AND SEA FOR AT LEAST 150 YEARS! YOU COULD HAVE FOUND THAT OUT YOURSELF BY DOING A THIRTY SECOND GOOGLE SEARCH!
Below you will find a link to a 1914 book, The heart of the Antarctic, Volume 1
By Sir Ernest Henry Shackleton., where the term is used eight times in that one book!
http://books.google.com/books?id=kXkSAAAAYAAJ&pg=PA320&dq=rotten+ice&hl=en&ei=hQ9sTLCLKIn0tgOBkbTtBw&sa=X&oi=book_result&ct=result&resnum=8&ved=0CE0Q6AEwBzgK#v=onepage&q=rotten%20ice&f=false
AND YET ANOTHER EXAMPLE FROM 1913.
The conquest of Mount McKinley: the story of three expeditions … – Page 144- Belmore Browne, 1913
Fifty feet above us a rotten ice-bridge sagged from a shattered berg to the main wall, and as we looked a cold mist crept over us and everything was blotted from sight.
http://books.google.com/books?id=FtcBAAAAMAAJ&pg=PA144&dq=rotten+ice&hl=en&ei=hQ9sTLCLKIn0tgOBkbTtBw&sa=X&oi=book_result&ct=result&resnum=3&ved=0CC8Q6AEwAjgK
http://www.google.com/search?q=rotten+ice&hl=en&tbo=1&tbs=bks:1&ei=YA9sTPbnDYycsQP3q-CxBw&start=10&sa=N
Tom P says:
August 18, 2010 at 8:21 am
Steve Goddard: “My narrative/forecast hasn’t changed one iota.”
Not quite:
DR says:
August 18, 2010 at 9:50 am
Well Tom P, what was your prediction at the beginning or previous to the melt season? I have respect for anyone with the cojones to stick their neck out and make testable predictions. Obviously you’re not one of them.
DR, Tom P was not criticizing Steven Goddard for being wrong but for not admitting that he had changed his narrative/forecast.
By the way mine was 5 million.
Tom P,
You forgot to quote the entire paragraph. [snip]
Tom P said
August 18, 2010 at 8:21 am
Steve Goddard: “My narrative/forecast hasn’t changed one iota.”
Not quite:
In Sea Ice #8 you narrated: “Conclusion : Based on current ice thickness, we should expect September extent/area to come in near the top of the JAXA rankings (near 2003 and 2006.)”
Your ice thicknesses were miscalculated and so obviously not a good predictor. The Jaxa ice area is already well below both 2003 and 2006 minimum values, while the extent should drop below tomorrow. There are still weeks of the melt season left.
I don’t expect your more recent prediction of 5.5 million square kilometers to look very good by the end of the month, either.
I am prepared to be surprised by your explanations for all this, though.
_________________________________________________
Indeed, Anthony said the Arctic sea ice would put on 500 000 km^2 this year and said Steve and he agreed with that. Steve said nothing to contradict it at the time.
Steve continually plays on the wind being a major factor and ignores temperatures and melt, so being out of step with most folk who see it as a combination of factors.
Andy
Re: mecago on August 18, 2010 at 10:20 am
(to cite one of many examples)
Sad part is, you may really think all that funky emphasizing makes your comments more impressive and somehow more worth reading.
Well, the formatting can make for a good chuckle…
AndyW
You are talking about an estimate Anthony made almost a year ago. Chances are it comes closer than PIOMAS current forecast.
AndyW
Blah, blah, blah…
Ice thickness is an excellent predictor, and my PIPS based calculations are quite accurate. The only forecast I have made is 5.5, and see no reason to change it now.
NSIDC has lowered their forecast by 16%. How do you feel about that?
Steve,
Science is not a big game of chicken, where the one who stands by their claim the longest wins. Science is about using available data to make hypotheses, revising them in the face of contradictory evidence and thereby coming closer to the truth. Not this hairbrained, macho, ‘I was there first’ type of idea. Especially, when the hypothesis in the first place was a fairly rough guess. And even more especially in cases like this where a guess leads to no greater understanding of the problem at hand, and does nothing to further knowledge of a phenomenon.
Only fools and dead men don’t change their minds. Fools won’t and dead men can’t. ~John H. Patterson
Re: Matt on August 18, 2010 at 1:15 pm
Gee, I wonder how many (C)AGW proponents will accept they’ve now been called unscientific and fools…
🙂
You’ve missed something important. You defend your hypothesis, tear into the contradictory evidence, then consider if whatever remains can be worked into your hypothesis or if it needs modification. If nothing remains, no consideration is needed. Works in science, works in troubleshooting as well.
Matt
At the end of the season I will draw a target, plot out everyone’s predictions, and see who was closest to the bullseye.
How far has the insanity extended that we proclaim that ice “has recovered” -inferring its loss was some sort of ‘concern’.
Makes one think that the entire continent covered in miles of the stuff would be “wonderful”.
Black Flag says:
August 18, 2010 at 8:10 pm
How far has the insanity extended that we proclaim that ice “has recovered” -inferring its loss was some sort of ‘concern’.
Makes one think that the entire continent covered in miles of the stuff would be “wonderful”.
================================
Repeated for effect. Excellent!
Matt says:
August 18, 2010 at 1:15 pm
Steve,
Science is not a big game of chicken, where the one who stands by their claim the longest wins.
Only fools and dead men don’t change their minds. Fools won’t and dead men can’t. ~John H. Patterson
=====================
Sounds like the CAGW phenomenon to me.
[I know that is not what you meant, but thanks for being the pot calling the kettle black].
Chris
Norfolk, VA, USA
kadaka (KD Knoebel) says:
August 18, 2010 at 12:01 pm
Re: mecago on August 18, 2010 at 10:20 am
(to cite one of many examples)
Sad part is, you may really think all that funky emphasizing makes your comments more impressive and somehow more worth reading.
Wrong Kadaka. Sometimes I emphasize entire blocks of print, like I’m doing now, to distinguish it easily from other blocks of print.
However, the main reason I emphasize like I do is not because I think that people will find it more interesting but because experience has shown that some people are very dense. So dense that I hope, in defiance of the gods of rationality, that they may actually understand what I’m saying and not take it out of context.
Unfortunately, it does not work. I’ve come to the conclusion that some process in the brain automatically distorts whatever communication is being made to those who simply don’t want to listen. I metaphorically refer to it as “short circuiting” their minds.
So, I have to sadly regret that even a bullhorn, inches away from their ears, will fail to get the point across. Too bad. On other sites I was actually having fun using multi-colored text, highlighting, bold, italics, underlining and even large sized print, in all sorts of combinations, to get the point across.
It may have looked amusing in a garish way, but it wasn’t my idea of getting attention, as you imagined. It was simply my way of beating a dead horse.
From: mecago on August 18, 2010 at 9:50 pm
More like reasonable people tend to ignore those who continually feel the need to shout to get their points across. Italics and bold together, and frequent use of all caps?
If your points are good they will stand just fine without the continual emphasizing. You can’t do much for people who won’t listen to any reason and have their minds made up, no matter how loud you scream. To those who may be inclined to be reasoned with, right now you’re the raving lunatic on a streetcorner. Might be worth watching for the show, but the content just becomes part of the act.
Black Flag says:
August 18, 2010 at 8:10 pm
How far has the insanity extended that we proclaim that ice “has recovered” -inferring its loss was some sort of ‘concern’.
Makes one think that the entire continent covered in miles of the stuff would be “wonderful”.
It’s not as if the choice has to be between one state or the other. You have heard of Goldilocks I’m sure.
People will see, within 10-20 years; an ice free Arctic in the summer, at least for a few days at first, in 10-20 years. Weather changes will begin before total meltdown in about half that time, 2015-2020.
Yes, I’m aware of the foolish excuse used by many to shrug off the implications of such a radical change. Ohhh duhhh, it happened before so what?
Well . . . I guess this is where I’m supposed to get into a well thought out; highly detailed; and lengthy explanation. Instead, I’ll use another tactic.
“Do not give dogs what is sacred; do not throw your pearls to pigs. If you do, they may trample them under their feet, and then turn and tear you to pieces.” Matthew 7:6. New International Version
Since I’m not religious, I’ll translate it into non theological language. Find out yourselves or die in your ignorance.
Dear Mr.Watts and Mr.Goddard,
Since you did not post any analysis method, nor any data source, can you please inform us how you obtained your conclusion that “It has been the coldest summer on record north of 80N” ?
Especially since the summer officially does not end until September 12, this statement seems rather premature.
Also, can you please confirm (or deny) that your data source for the first graph in your post is from DMI :
http://ocean.dmi.dk/arctic/meant80n.uk.php
and can you please tell us how you obtained your conclusions that “Summer has come to a premature and frosty end” and “It also appears that the summer melt season will be the shortest on record” and “it appears likely that we are headed for an early minimum.” now that the temperature trend reversed, is again above 0 C, and is going up ?
Moreover, now that the trend is reversed, which part of your remaining projections and the starting point of your post (“Summer has come to a premature and frosty end at Santa’s workshop.”) and (“It has been the coldest summer on record north of 80N”) would still look anything more than wishfull thinking ?
Thank you
Rob
Re: Rob on August 19, 2010 at 12:40 am
From: Neither Mr. Watts nor Mr. Goddard
Oh come on! Of course that’s the DMI graph. As far as “coldest summer” goes, Steve already mentioned about that:
http://wattsupwiththat.com/2010/08/15/sea-ice-news-18/#comment-459428
Just run through the archive and see how much area is above the 273K (0°C) line. It’ll take a while above that line for this year to lose its “coldest” ranking, and I don’t see it happening with this blip. In any case, see the Sea Surface Temperatures. This little bit of warm air isn’t going to warm all that water up. The melt season will be ending, soon.
BTW, meteorological summer is June, July, and August. Meteorologists go by whole months. Thus August 31 is the last day of summer, just 12 days from now.
Re: mecago on August 19, 2010 at 12:40 am
But mecago, there is no choice. Per IPCC AR4, we are headed for many decades of further global warming, even if we shut down civilization and all related CO2 emissions now. It will go on for centuries to come, it may be a millennium until the rise finally stops.
Thus the temperature will rise, and all the glaciers and all that Arctic and Antarctic ice will melt away, no matter what we do. Thus adapting to the changes that will come is our only hope for the human species to survive.
Bye bye, Arctic ice! It was nice knowing you!
So kadaka, we have had the coldest summer on record north of 80N and during July and the first 10 days of August (the most important period of the melting season when decrease rates are highest) we’ve seen adverse weather conditions that greatly influenced the melt.
But despite all of that, both the Northwest Passage and the Northern Sea Route are opening up, and 2010 still has a chance of going below 2009 and perhaps even the 5 million mark (although weather is looking to flip again next week).
How is this possible? Wasn’t the ice so thick we would definitely see another ‘recovery’? Can you imagine what would have happened if instead of 6 weeks we’d had only 3 weeks of adverse weather conditions and a stalled Beaufort Gyre and Transpolar Drift Stream?
I can imagine. We’d be below 5 million square km right now and discussing whether a new record minimum extent was in the books.
mecago,
Here is another saying for you:
“We have no right to inflict our solutions upon the problems that our kids have not yet experienced or have”.
In other words, acting now for a problem that does not exist will most definitely create far worse problems for the future.
I am very confident that our children will be able to deal with their lives and their issues without our dabbling in pretense that we actually know what is going on.
stevengoddard says:
August 18, 2010 at 7:59 am
Jeff P
Whether final ice extent comes in a little above or below 5.5000000 million, the amount of MYI should see significant growth by next spring.
You are aware NSIDC’s official forecast was also 5.5 million? I’m assuming that you are familiar with the concept of precision and error bars.
———————-
LOL if you know what the MYI is going to be for next year where are you predictions for minimum ice extent for 2011, 2012 and 2013?
Yup, I am familiar with error bars and haven’t seen any on your predictions. If I’ve missed them please provide the link.
mecago says:
August 19, 2010 at 12:40 am
“Well . . . I guess this is where I’m supposed to get into a well thought out; highly detailed; and lengthy explanation. Instead, I’ll use another tactic.
“Do not give dogs what is sacred; do not throw your pearls to pigs. If you do, they may trample them under their feet, and then turn and tear you to pieces.” Matthew 7:6. New International Version
Since I’m not religious, I’ll translate it into non theological language. Find out yourselves or die in your ignorance.”
Hmm, I’m guessing a more realistic interpretation is:
“The high priests of the AGW cult have declared these pearls of wisdom sacred. Let not the unwashed masses examine them too closely or they will trample upon our divined data and tear our arguments to pieces.”
I can see why Matthew 7:6 could be making the rounds in the AGW community. It fairly accurately describes both their attitude and their actions toward those holding dissenting views. Ah, Climategate, a door that, once opened, cannot be closed.
Julienne,
Thanks for attempting to guide me through the DMI maze yesterday. I’m afraid I have neither the time nor the background to plow through all the links, etc., and figure out whether a) temps are warmer than average in the Arctic this summer as you claim from your data, or b) they are colder than ever in the Arctic this summer as illustrated on the DMI graphs. (I also doubt that even someone with the requisite background could actually settle the issue, but that’s beside the point.)
I’m agnostic on the issue of this summer’s arctic temps, except that it is one more item added to the pile that convinces me that reliability of data in this field is exceptionally poor. I do, however, tend to place more weight on the DMI data (presently) for the simple reason that they have devoted effort to maintaining a specific long-term record of temps north of 80 degrees, whereas you apparently used your database yesterday to “check” their claims and now disagree with them. I hope you can see how I might be more inclined to trust the data promulgated over a sustained period over that of a one-time computer run and reported on a blog. That doesn’t mean I think your result is wrong; only that right now I tend to place more weight on the DMI charts, though less than I would have two weeks ago. Also, this is from my perspective only; you might have a similar long-term record that’s been examined daily, but that I’m unaware of so far. (The reason I put some emphasis on a daily examination as the record is accumulated is because that enables errors to be more readily detected during the initial data collection and analysis, in my opinion.)
Messy business, this temperature recording. I suspect the general public would be quite surprised to find out just how messy. I know I have been.
Again, thanks for trying to help me out. I do have a better grasp of the situation now, though it’s still quite confusing overall.
Rod
Black Flag says:
August 19, 2010 at 6:29 am
mecago,
Here is another saying for you:
“We have no right to inflict our solutions upon the problems that our kids have not yet experienced or have”.
In other words, acting now for a problem that does not exist will most definitely create far worse problems for the future.
I am very confident that our children will be able to deal with their lives and their issues without our dabbling in pretense that we actually know what is going on.
The children of tomorrow will use their ancestors graves for latrines.
Yours is the pretense of knowledge, or in your case anti-knowledge. You cannot even sense the contradiction of your faux wisdom.
If it is, as you stated, “. . . pretense that we actually know what is going on.” then how can WE deal with our own “lives and issues” today?
Furthermore, how can your children deal with their own lives and issues if they, like us by your description, are “dabbling in pretense that [they] actually know what is going on.”?
Do you presume that they will have a wisdom that YOU don’t have?
Rod Everson says:
August 19, 2010 at 8:25 am
“The high priests of the AGW cult have declared these pearls of wisdom sacred. Let not the unwashed masses examine them too closely or they will trample upon our divined data and tear our arguments to pieces.”
I can see why Matthew 7:6 could be making the rounds in the AGW community. It fairly accurately describes both their attitude and their actions toward those holding dissenting views. Ah, Climategate, a door that, once opened, cannot be closed.
There has been no such declaration by “The high priests of the AGW cult”.
[snip]
Matthew 7:6 is not making the rounds of the AGW community so far as I know. But then I can see why you would imagine it is. You don’t have the independence of mind to come up with something on your own so you project that inability upon others.
[snip]
And finally, a door has been opened that cannot be closed. It’s called a “tipping point” and I’m referring to the meltdown of the Arctic Ice Cap and its subsequent effects.
mecago,
To make such as statement must mean you do know, for fact, the causation and consequence of current human action on the climate.
This would put you far above everyone on Earth.
And you have the gall to claim I have “faux” wisdom!
WE deal with it the best we can.
To use this as a claim that we should be dealing with issues that do not exist in the future for our children is irrational.
Because (wait for it), it is their own lives! … and not “mine” to determine for them.
I have infinite faith in our children to do the best they can in THEIR future.
MY dabbling is unnecessary in every way.
Absolutely!
Or do you believe you are much more ignorant than your parents and grandparents?
Günther Kirschbaum says:
August 19, 2010 at 6:26 am
I thought air temperatures didn’t matter much for ice melt and water temps dominated? If that’s the case, why do air temperatures (and your entire argument) matter? Given the strong El Nino this year, I’d say that topping 5e6 km^2 is pretty decent, especially seeing as we’re supposed to be in a death spiral.
-Scott
Well I have to admit, the mecago ‘Repent, you ignorant heathens!’ show does have noticeable entertainment value.
🙂
The final days of the 2010 melt season are here and the horse race is on.
2010 is the 9th year in the JAXA record. How will it place?
Today 2010 has the 2004 and 2006 minimums beat. Let’s look at the standing.
2003 Min.: 6,041,250: Beat on 8/14/10
2004 Min.: 5,784,688: Beat Today!
2006: Min.: 5,781,719: Beat Today!
This puts 2010 in 6th place in the JAXA record.
Next up is 2002 at 5,646,875. After that 2010 will have a long way to go to beat the Goddard Minimum at 5.5 Million K^2.
From: Jeff P on August 20, 2010 at 9:42 am
Actually, 2002 was a partial year, data starts in June. Thus in general terms you could say 8 years (eight twelve-month periods) have already been completed with the 9th year underway, otherwise the end of December will mark the 8th full year in the record.
Goddard wrote :
“My forecast (dashed line below) minimum of 5.5 million (JAXA) continues to look conservative.”
Since 5.5 million km^2 would be below the 2009 minimum, I wonder if Goddard needs to pick a bone with Anthony, who predicted early this year that the 2010 summer ice extend would recover over previous years.
Either way, sonsidering that Goddard’s prediction of 5.5 million km^2 minimum is very close to record miminmum, I find the repeated use of “recovery” in sea ice extent and ice volume here on wattsupwiththat rather misleading.
With JAXA 2010 ice extend minimum standing at 4813594 sq.km (set September 18), painfully close to being second smallest Arctic ice extend since recordings started 30 years ago.
That fact alone makes this post by Goddard irrelevant, barely a month after its conception.
Maybe next time when you claim “premature end of Arctic summer” or “my predictions of 5.5 million sq.km look conservative” or “2010 will see a ‘recovery’ of Arctic sea ice” you may want to add some disclaimers that you are just talking from pre-conceived beliefs that AGW is non-existing rather than scientific understanding.
I’m sure that your fans won’t mind if you would tell them the truth every now and then.