By Steven Goddard
The topic this week is verification of data sources. NSIDC reports :
At the end of the month, extent fell near the level recorded in 2006, the lowest in the satellite record for the end of May
That sounds bad! Let’s see how 2010 compares with ten, twenty and thirty years ago :

Ice looks healthier than 10 years ago

Ice looks healthier than 20 years ago

Ice looks healthier than 30 years ago
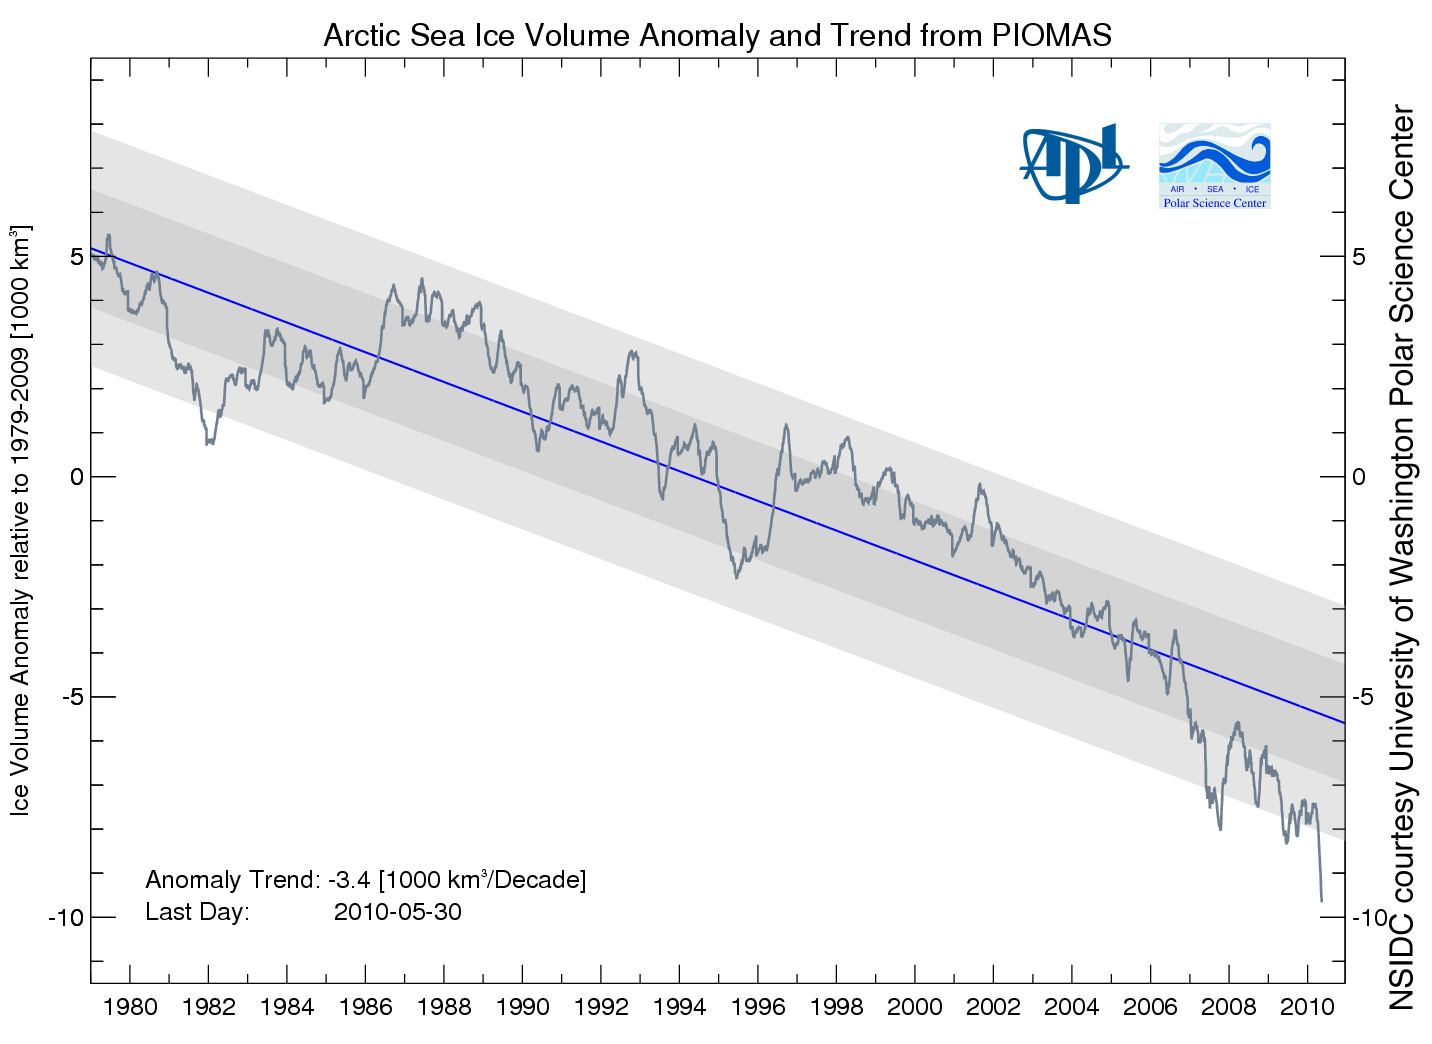
Then NSIDC discussed my favorite graph from PIOMAS, showing a record low anomaly of Arctic ice volume.

PIOMAS shows an anomaly nearly 50% greater than 2008. If that is correct, then surely we will have a record minimum this summer. However, the PIOMAS data seems inconsistent with PIPS2 data, which shows thicker ice covering a much larger area in 2010. My guess is that PIOMAS is looking at only a small region of the Arctic interior.
Next data source to look at are the Arctic Ice Concentration maps. UIUC has archived lower resolution maps since the start of the satellite record, such as the one below for June 11, 2010.

Their newer maps appear to show a lot more detail.
")
Note that the newer map shows a lot of low concentration ice in the Beaufort Sea (green, yellow, light pink.) Let’s see how that compares with a current satellite photo.

I must be missing something, because I don’t see much of that low concentration (green) ice in the satellite photo. The two videos below compare satellite vs new and old concentration maps. New comparison first :
The old concentration maps correlate much more closely with the satellite photo.
You can also see in the video below how erratic the bands of yellow and green are in the newer maps. They appear one day and disappear the next.
In the low colour version of the video, it appears that they may be having trouble differentiating between cloud cover and low concentration ice. We see large areas of open water switching to saturated ice overnight, and vice-versa.
It appears that the precision of the newer maps is much greater than their accuracy. Better to use a low precision map which is matched correctly with its accuracy.
Moving on, Barrow Sea Ice is starting to show first signs of thinning. By June 16, 2007 the ice had already broken up.
.
http://seaice.alaska.edu/gi/observatories/barrow_sealevel/brw2010/BRW_MBS10_overview_complete.png
Temperatures in the Arctic have continued below normal and below freezing for the last few weeks.
")
http://ocean.dmi.dk/arctic/meant80n.uk.php
NCEP is forecasting below freezing temperatures for much of the Arctic Basin during the next week.

This week, the sun reaches its highest point in the sky. Next week it starts its decline towards winter.
Now, the really interesting stuff. Arctic Basin sea ice volume (calculated from PIPS maps) remains close to the 2006 track, and well above the last three years

Area is slightly below 2006 and 2009.

Thickness is nearly identical to 2006 and 2007.

Conclusion : 2010 minimum extent is on track to come in just below 2006. With the cold temperatures the Arctic is experiencing, the likelihood of a big melt is diminishing.
NSIDC shows extent lower than 2007. The modified NSIDC map below shows where they believe the gaps are (in red.)

On the surface, this appears to disagree with my measurement above that Arctic Basin ice area is greater than 2007. The difference is that I am only considering regions that have perennial ice – i.e my PIPS calculations assume that there is no summer ice in Hudson Bay or the Barents Sea, and that they are a “don’t care” for estimating minimum extent. You can see in my PIPS ROI (Region of Interest) maps for June 14 below, that there is excellent agreement between PIPS and NSIDC. 2007 had less ice in the Chukchi and Laptev Sea, and more in the Beaufort Sea.

PIPS June 14, 2010

PIPS June 14, 2007
The modified NSIDC image below shows ice loss since June 3.

The modified NSIDC image below shows ice loss since early April.

And finally, the modified NSIDC image below shows regions which have below normal ice extent.

My analysis indicates the highest late summer extent since 2006. In discussing, please remember that the regions in red above normally have no ice in September. They don’t figure in to the summer minimum.
I guess that means you are estimating around 5.7 to 5.9 x10 ^6 km2 in extent then Steve?
Jaxa seems to have got stuck on the website again. Also, quite a few clear days on the northpole webcam this year compared to last year I seem to recall, just as an aside.
Andy
AndyW
I should probably attach units to the graphs. My measurements are in pixels, and I haven’t calculated the relationship to km2. You can’t compare my numbers to JAXA or NSIDC anyway this early in summer, because my ROI is smaller.
Looks like ice maps are now much more detailed. See this Loeb’s slide set:
http://science.larc.nasa.gov/ceres/STM/2003-10/pdf/Loeb.pdf
Slide 9:
“SSF ED1A used the NSIDC map incorrectly: It assumed that if snow/sea-ice was
present, it covered 100% of the area.
SSF ED2A will correct this problem: ED2A will account for fractional seaice.”
Now the question is: when this change did happen? Has something changed this year with JAXA and Cryosphere?
That are the datasets JAXA and Cryosphere are now using to calculate sea ice cover?
About the more detail map in the post ( http://climateinsiders.files.wordpress.com/2010/06/arctic-seaice-color-000-1.png ), please note the scale of the map is different to the map we are used to, the yellow and red represent a concentration of 85-90%, even the green one are like 75%, so it might be hard to notice the difference in an ordinary satellite picture, and because the difference is so small, I do expect the % in the map would be highly volatile because of the dirfting or otherwise.
Facinating Steve! You of course know how much I completely disagree with your analysis, and believe that this years summer minimum will be just slightly more than the low seen in 2007, and I shall have a longer response later (as this is my favorite topic, as you know), but let’s look at just one of your faulty points of analysis. You claimed that you could not see the larger area of lower concentration in the Beaufort Sea as shown in the higher resolution UIUC maps. You indicated that you think the lower res map was more accurate, and the maybe even the higher res map was seeing clouds, or other inaccuracies. You seemed to gather all of this from a low res satelite image. Well, I would suggest that you, and the other readers take a look at this very high res image of the Beaufort sea:
http://ice-map.appspot.com/?map=Arc&sat=ter&lvl=7&lat=74.321318&lon=-140.843843&yir=2010&day=165
Now, oddlly, the trained and even untrained eye can clearly sea the ice is breaking up in a pattern extending outward that oddly matches the pattern of yellow, green, and blue shown in the higher res UIUC concentration map– not so oddly actually, as that concentration map is quite accurate, as the close up analysis of the high res pic shows. The concentration and extent are falling in the Beaufort Sea already this early in the melt season, as this accurate graph clearly shows:
http://arctic.atmos.uiuc.edu/cryosphere/IMAGES/recent365.anom.region.11.html
and according to one PIOMAS based model, we’re going to see a very big melt continue in this region this summer:
http://psc.apl.washington.edu/zhang/IDAO/seasonal_outlook.html
More importantly, you’re absolutely dead wrong in discounting the early melt in both the Beaufort Sea, the Barants Sea, and the Kara Sea, as these have a much higher correlation to the condition of the sea ice later in the season than anything you’ve mentioned so far and all three are well below their 30 mean for this time of year, so early in the melt season. I strongly suggest that you and your readers read Ron Lindsay’s 2010 Arctic Sea Ice Analysis here, where he makes a great analysis of why the early season ice in these regions is so closely correlated with the summer minimum:
http://psc.apl.washington.edu/lindsay/prediction.html
Dr. Lindsay’s prediction is also based on PIOMAS, but a little different slant (as you’ll see) from Dr. Zhang’s.
I have much more to say about your update, but I think this provides an early quick rebuttal. But as always, a nicely put together post and one that I couldn’t disagree with more!
Perhaps we can just rename this WUWT Sea Ice News?… 🙂
So I did some digging in NSIDC archives, and here’s the Antarctic Sea Ice concentration for yesterday;
http://nsidc.org/data/seaice_index/images/daily_images/S_daily_concentration_hires.png
and as compared to the same day in 2007;
http://nsidc.org/data/seaice_index/images/daily_images/S_record_concentration_hires.png
they seem to confirm the significant increase in Antarctic sea ice concentration I found in the Cryosphere Today data last week.
(Steve, the Arctic Cryosphere Today charts you found have much more detail than the ones I used last week, please let me know if you come across an Antarctic archive on Cryosphere Today with these more detailed concentration maps)
Also, as I mentioned last week, Antarctic Sea Ice Extent is currently above NSIDC’s misleadingly narrow normal range;
http://nsidc.org/data/seaice_index/images/daily_images/S_stddev_timeseries.png
and I found some good Antarctic Sea Ice Extent maps that show 2007 Extent;
http://nsidc.org/data/seaice_index/images/daily_images/S_record_extent_hires.png
and the significant increase in Extent in 2010.
http://nsidc.org/data/seaice_index/images/daily_images/S_daily_concentration_hires.png
These maps help to demonstrate how widespread the comparative increase has been, except for an apparent decrease in the Ross Sea, which calls into question the hypothesis that an ozone hole driven offshore wind over the Ross Sea is the primary driver for recent increases in Antarctic Sea Ice:
http://www.nasa.gov/topics/earth/features/antarctic_melting.html
In the NASA article/press release you’ll note a familiar name, “Jinlun Zhang, an oceanographer at the University of Washington, has pieced together a complex computer model that helps explain why Antarctic sea ice is expanding even with signs that ocean and air temperatures are on the rise.”
Yes, that’s the same Zhang whose responsible for the spurious PIOMAS Arctic Sea Ice Volume model and chart:
http://psc.apl.washington.edu/ArcticSeaiceVolume/IceVolume.php
Seems that Zhang and his models can explain away all of the Warmist’s sea ice troubles…
I am in agreement still. I believe 2010 minimum will be close to 2006. Nothing about this year would indicate to me (yet) that we will see a dramatic summer ablation unless some odd winds come from somewhere.
NCEP is forecasting below freezing temperatures for much of the Arctic Basin during the next week.
What is the difference between the NCEP forecast and ESRL plot:
http://www.esrl.noaa.gov/psd/cgi-bin/data/histdata/fnl.pl?date1=20100614&date2=&days=1&var=Air+Temperature&level=1000&type=0&proj=Northern+Hemisphere&custproj=Cylindrical+Equidistant&xlat1=&xlat2=&xlon1=&xlon2=&labelc=Color&labels=Shaded&cint=&lowr=&highr=&scale=200&Submit=Create+Plot
I cannot find the freezing temperatures.
Best regards
One wrong link in there, here’s the current Antarctic Sea Ice Extent Map:
http://nsidc.org/data/seaice_index/images/daily_images/S_daily_extent_hires.png
apologies for the missing by line steve, fixed.
mosh
R. Gates
In a few weeks there won’t be any need to speculate about the accuracy of my predictions ;^)
“I cannot find the freezing temperatures.”
The deepest shade of violet means temperatures < 5 degrees. You aren't getting enough resolution on that graphic to see "freezing" temperatures because the coldest it displays are temperatures "less than 5".
I recommend you view the lecture by David Barber at the recent IPY conference in Oslo
http://video.hint.no/mmt201v10/osc/?vid=55
Perhaps you will then be less sanguine.
If you look at this graph:
http://ocean.dmi.dk/arctic/meant80n.uk.php
You will see that the AVERAGE temperature above 80N is just about at 0C. One would be safe to conclude that temperatures over some portion of the area above 80N would be below freezing.
I’d make a friendly wager with Mr. Gates regarding the minimum this year. I do not believe it will be close to the 2007 mark. I’ll
let him decide what “slightly more” than 2007 actually means and we can then set the
terms of the wager.
According to PIOMAS: “Shaded areas represent one and two standard deviations of the anomaly from the trend. Updates will be generated at 3-5 day intervals.”
But the graph is now two weeks out of date.
While Steve continues to show his miscalculated ice thicknesses, here is plot of the ice thickness, volume and area correctly derived from the PIPS 2.0 data:
http://img7.imageshack.us/img7/6466/pipshistorybig.png
The relationship between thickness and volume is worth examination. Within a few days we should expect to see the annual sudden drop in thickness. If this drop is precipitous, like on 2008, we would be heading for a low minimum volume. If the drop comes to an abrupt halt as in 2007 that might indicate a low ice extent. We should know which in just a week or two.
I really wish that each article would start with an abstract, or executive summary.
Regarding sanguinity, according to JAXA’s data, June is thus far having the fastest decline of the years that they display. It should be noted that ice extent has dropped below the value it had at 26 November last year, so not all of this decline has been melt of ice only a month or two old. (There is nothing that unusual in it reaching the 26 November mark by around this date – in both 2005 and 2006, this occurred. For 2007, 2008 and 2009, thing were a week or two later).
crosspatch says: (two times)
1. June 15, 2010 at 12:13 am
Thank you. But does it mean the ESRL was more reckless (less precise?) than NCEP in data visualization? Please do not be offended but I saw the colors in right context. Writing my words I wanted to turn your (readers) attention to discrepancies. Plotting the lowest temperatures from 0 (zero) to 5 deg C with ONE color is too big simplification as far as Arctic issues are concerned. There’s too much at stake to make such “simple” plots.
2. June 15, 2010 at 12:13 am
Nope. Far fetched claim. Either there is an area (Arctic Basin is a big one) with above freezing temp or just contrary. It is a game changer. GISS is being flocked constantly for such infers leading to “brown” Arctic Ocean areas on their plots.
I asked my question because I am a layman in climatology but not without inquisitive nature.
Best regards
stevengoddard,
I would also be wary of a comparison that showed current ice in a healthier state now than it was 30 years ago. While it is possible that ice is recovering (although I do not think that it is) the proposition that it *has recovered* does not pass the smell test. The cryosphere today comparison images have problems, in that they are never the same as the image for the day that is on the main page – most of the detail is wiped out, as you have seen (due to differences in resolution, I guess).
And two more question.
1.
NCEP shows -5 to 0 (zero) deg C for Arctic Basin. ESRL 0 (zero) to 5 deg C.
We got -5 to +5 deg C gap – a range too big for me.
2.
NCEP plot shows __forecast__ for the area. What presents ESRL? Which one is closer to the “truth”?
Regards
R Gates is counting his chickens a little too early I fear, confusing ablation and current led break up with melting and ignoring mass for extent.
There are some early signs that point to a big melt and signs that point to an average melt, a confusing picture where the real outcome is still a couple of months away and we shall see what we shall see when we see it.
I certainly understand his eagerness to see what he wants to see, we all do that but in a month we should see a clearer picture so staking out a determined position at the moment is a little premature.
Please don’t write “normal” when you mean “average (1979-2000)”
Cassandra King,
Is stevengoddard being a little premature, too? 😉
Interesting plenary talk by Professor David Barber at the very recent Oslo Science Conference, mainly focusing on the 4th International Polar Year. Dr. Barber, a Canadian, has been studying polar ice for the last 30 years by actually taking research vessels out into the ice. His talk, titled: “On thin ice” talks about how the multiyear ice was much more rotten then expected in 2009, that they were able to cruise at high speed through ice that they did not even expect to get through with their ship.
According to this “on the ground truthing” the satillite data are substantially overestimating the thickness and strength of sea ice in the arctic. Here is the link
http://video.hint.no/mmt201v10/osc/?vid=55
Has anyone heard at WUWT of the Southern Hemisphere?
(I believe AW is there right now).
CT has Nth Hemp sea-ice 1.1 million km^2 below averge.
CT has Sth Semp sea-ice 1.3 million km^2 ABOVE average.
So it appear world-wide sea-ice is above average.
I just noticed a post above referring to Antartic sea-ice.
It is said that everything you need to know about life, you learn in Kindergarten.
My compliments to Steven Goddard and R Gates for having learned to play so well together.
It is always a pleasure when intelligent people disagree while retaining thier mutual respect.
Regards,
Steamboat Jack (Jon Jewett’s evil twin)
R. Gates:
Your link to Ron Lindsy’s web pages provides an excellent summary of summer sea ice prediction.
End of May: 4.44 +/- 0.39 million sq km based on extent
End of May: 4.76 +/- 0.51 million sq km based on thickness
End of April: 5.12 +/- 0.42 (extent)
End of March: 5.05 +/- 0.45 (extent)
End of March: 4.95 +/- 0.52 (mean ice thickness)
End of March: 5.93 +/- 0.56 (ice concentration)
In other words, 2010 predictions range from a low of 4.44 to a high of 5.93, give or take half a million. Thanks for confirming that summer sea ice extent cannot be accurately predicted.
Steve Goddard:
If you look at daily arctic temperatures versus historical average it seems as though most days were above normal for 2010 (so far). Showing the daily value subtracted from the average daily would show this more clearly. This would suggest a trend toward lower ice extent this summer if one believed daily temperatures were a driving factor.
Perhaps it would be interesting if you would address the Plenary Lecture by Dr. David Barber at the Polar Science conference in Oslo. http://video.hint.no/mmt201v10/osc/?vid=55
Dr. Barber’s points cannot easily be refuted using fancy statistical tricks or graphical analysis. Good luck with this one. One note, do not attack Dr. Barber’s credibility, there is no one on this blog who has more expertise than him on this subject and I think even Goddard and Watts would have to confirm that. Furthermore, Dr. Barber wasn’t always a climate change proponent, he was originally a skeptic but finally he saw the truth.
Przemysław Pawełczyk says:
June 14, 2010 at 11:07 pm
You haven’t been looking at the right maps:
http://weather.unisys.com/surface/sst.html
Jim,
discussing antarctic sea-ice is a moot point. see http://www.skepticalscience.com/antarctica-gaining-ice.htm
why is Antarctic sea ice increasing? There are several contributing factors. One is the drop in ozone levels over Antarctica. The hole in the ozone layer above the South Pole has caused cooling in the stratosphere (Gillet 2003). This strengthens the cyclonic winds that circle the Antarctic continent (Thompson 2002). The wind pushes sea ice around, creating areas of open water known as polynyas. More polynyas lead to increased sea ice production (Turner 2009).
Another contributor is changes in ocean circulation. The Southern Ocean consists of a layer of cold water near the surface and a layer of warmer water below. Water from the warmer layer rises up to the surface, melting sea ice. However, as air temperatures warm, the amount of rain and snowfall also increases. This freshens the surface waters, leading to a surface layer less dense than the saltier, warmer water below. The layers become more stratified and mix less. Less heat is transported upwards from the deeper, warmer layer. Hence less sea ice is melted (Zhang 2007).
Ed Struzik wrote at Yale Environment 360 that until recently the Arctic was locked up in ice year-round. I wrote a comment that the Northwest Passage was sailed in 1903-1906 by Roald Amundsen and in 1940 and 1944 by Henry Larsen, but my comment did not make it through moderation.
http://www.e360.yale.edu/content/feature.msp?id=2281
BillD
“Rotten multi-year ice.” That is a new term. Where can I find a boat that cruises through four metre thick ice? Too bad the Titanic didn’t have that technology.
Jim says:
June 15, 2010 at 4:00 am
Yes, you have hit upon the key data point: The Global Sea Ice is above normal and rising.
Something that did not happen in most of 2007.
The forecast models are for a lot of the N. Hemisphere to be below normal temps well into November.
The Ice Panic Alarmists are pushing vaporous buttons.
What else is new?
Przemysław
Measured temperatures near the pole have been below freezing.
http://psc.apl.washington.edu/northpole/PAWS_atmos_recent.html
John Silver says: June 15, 2010 at 2:30 am
“Please don’t write “normal” when you mean “average (1979-2000)””
Please pass your comment onto NSIDC;
http://nsidc.org/about/contacts/
as they are responsible for misleading the public as to what “normal” is. Last week I noted that it was, “(misleadingly narrow due to NSIDC’s choice to exclude 2001 – 2010 data in order to make their Arctic chart look scarier/abnormal):”
http://nsidc.org/data/seaice_index/images/daily_images/N_stddev_timeseries.png
We’ve been down this road, and I believe that Dr. Walt Meier of NSIDC agrees, but thinks it it would cause too much confusion if they corrected their error now.
I am in complete agreement that a 21 year sample, or 31 years for that matter, in no way represents what the normal range of sea ice extent is for a 4.5 Billion year-old planet.
Steve,
This is slightly off topic yet may also have some contributing value.
Saskatchewan and Manitoba are close to the Arctic. Usually in the past they have had severe draughts yet this year, the basin is full of water. This is like 4 U.S. States growing fields underwater. This is flat land that grows mostly grains. The province beside it, Alberta was still recieving snow storms at the end of May.
Note how the low-concentration ice healed up between June 10 and June 13. Indicates a likely problem with the maps.
Steve from Rockwood
Does ice melt faster at -30C or -33C?
Is there some reason why a 3C temperature anomaly in January in the Arctic is relevant to forecasting summer extent?
I don’t see why minimum ice extent has to be the measure of arctic temperature.
There are any of several means by which ice can melt besides air temperature and sunlight, such as ocean currents and disruption of the ice sheet by the fleet of icebreakers that break up the ice every spring to open Russian and Scandinavian ports and shipping lanes. There are tours to the Pole. Nuclear ice breakers can make 10 knots through 8 feet of ice. There are ice breaking cargo ships. This breakage opens up more sea to sunlight and more ice area to water. Once old ice is broken and melts, it is new ice every year.
I think a better measure is the formation of new ice in the winter (max area less succeeding minimum area), which is at highs not lows.
Google “ice breaker” – lots of video available too.
Don B,
Amundsen completed a three-year voyage after THREE winters trapped in ICE. Although his chosen east–west route, via the Rae Strait, contained young ice and thus was navigable, some of the waterways were extremely shallow (3 feet, or 1 meter, deep) making the route commercially impractical. Henry Larsen took 27 months the first time in an ice fortified schooner.
On May 19, 2007, a French sailor, Sébastien Roubinet, and one other crew member left Anchorage, Alaska, in Babouche, a 7.5 m (25 ft) ice catamaran. The goal was to navigate west to east through the Northwest Passage by sail only. Following a journey of more than 7,200 km (4,474 mi), Roubinet reached Greenland on September 9, 2007, thereby completing the first Northwest Passage voyage made without engine in one season.
Slight difference in the amount of open water between the two eh? Ice-forified schooner and no engine catamaran…
As Stephen Wilde said (in other post), this seems to be the cause:
When the polar high pressure cells drift equatorward during a period of negative polar oscillations that allows more inflow of warm air into the polar regions at the same time as there is a greater flow of cold air to the mid latitudes.
Which it does not mean the earth is warming but the contrary.
I find it cheering news that so many here are convinced of the expertise of the esteemed Dr. David Barber, and are so highly recommending his presentation. After all, he decisively demonstrated the inaccuracies of satellites, specifically with their identifying as thick multi-year ice what was in reality rotten thin ice.
Thus if you accept that he is indeed an esteemed expert on Arctic sea ice, you logically should also accept that the satellite data is best not used when discussing Arctic sea ice as it has been decisively shown to be flawed and unreliable.
Also, based on the expertise of the esteemed Dr. Barber, one must logically conclude that Steven Goddard is likely correct about the “phantom thin ice” of the UIUC images, as both he and the esteemed Dr. Barber are in agreement that the satellites do get it wrong.
Cheering news indeed.
Robert says @4:44 am:
“Jim,
discussing antarctic sea-ice is a moot point…”
No, it is merely an inconvenient point to our friends visiting from RC. The Antarctic is gaining ice, and Robert doesn’t want to discuss that uncomfortable fact because it debunks the CAGW conjecture.
Three months until ice reaches minimum. Time goes by fast.
Steve,
I love it when you completely ignore the rebuttal points I made regarding the concentration the the Beaufort Sea, as well as Dr. Lindsay’s analysis of why the early season condition of ice in the Beaufort Sea, Kara Sea, and Barants Sea is one of the best predictors for late summer sea ice extent. Also, the fact that all three of these are well below their 30 year means just passes right over you, as you try to suggest that somehow the Arctic sea ice is in better shape than it was 30 years ago.
You said it will be a “few weeks” until there will be no reason to speculate about the accuracy of your predictions. Well, more like a few months, but whose to quibble about the bulk of the melt season.
And BTW, I’ve been rock solid at a 4.5 million sq. km. projection for minimum melt (based on IJIS/JAXA data) for many months (since March actually), and that’s well documented here on WUWT, so please don’t try to put any other words in my mouth or spin what I say.
In more important news, New Zealand scored with 30 seconds left to tie Slovakia 1-1. Something which actually affects people’s lives.
Robert says (at 6/15, 5:38): “Slight difference in the amount of open water between the two eh? Ice-forified schooner and no engine catamaran…”
Very interesting trip by Mr. Roubinet, and not one with which I was familiar. Kudos to him!
I think, though, that using Roubinet as an example weakens the argument that the ice is less now than in some past periods. Here is why I think that. Roubinet’s catamaran is quite a bit faster than a single hull gaff rigged sloop (which Amundsen had) and in fact has a VERY much shallower draft. Where as Amundsen’s ship needed between 7.5 and 12 feet of water, Roubinet’s catamaran needs between zero and 4 feet of water. Zero? How can a boat sail in zero feet of water?! Because Robinet’s catamaran is a combination catamaran and ice boat. It is equipped with blades like ice skates and can literally be sailed on ice when there is no water at all. By the way, perhaps 150 years ago, ice boats were the fastest means of transportation in the world. A well designed one (and I am not saying that this typifies Mr. Roubinet’s boat while in ice mode) will hit between 60mph and 100 mph. Fast!
Anyway, congratulations to Mr. Roubinet on a wonderful adventure, but his success does not in any way demonstrat that the Artic ice is unusually sparse these days.
stevengoddard says:
June 15, 2010 at 5:11 am
Note how the low-concentration ice healed up between June 10 and June 13. Indicates a likely problem with the maps.
Thanks for pointing these things out. Some will say we’re not supposed to be focusing on Arctic ice like this, and I do see why they say it. But Al Gore has forecast that Arctic ice could be gone in summer of 2013 (he is now hedging his bets on that) and we’ve been told, and are still being told, Arctic ice is in a ‘death spiral’. But it looks like there is no alarming loss of ice happening. It looks like everything that is happening is within normal variation.
Standing back and looking at the big picture, I can’t see how counting ice cubes matters at all. This is weather, not climate.
@BillD:
Did Professor David Barber try cruising at high speed through the ice in 1979 as well? Or in 2001? 2009? Or did he just try this last year, thinking that this must be unusual?
For this method to have any validity whatsoever, he should made this trip every year over a 20-year period, with the same speed, same ship, following the same route.
And even then, this doesn’t seem like a very scientific method to me: cruising at high speed through “rotten” ice one year, and drawing sweeping conclusions about the state of the arctic from this little trip.
Interesting, but probably not indicative, that the north of 80 temperature reached the long term average right on time, to the day.
Are these images and is the data into the PIOMAS model corrected for surface melt water? Even with the temperature slightly below zero, sunshine will melt the surface of the ice.
Mr. Gates, your detailed photos show a very high compaction, even if they do indicate some breakup. To all intents there is no 15% concentration, or even 50%. I continue to think that you are missing, or choosing to ignore this point. Comment?
I wonder how much more evidence some will need before they agree the PIOMAS graph cannot be right?
/me yawns and looks at calendar. Another two weeks and I’ll start getting interested again.
stevengoddard says:
June 15, 2010 at 6:23 am
In more important news, New Zealand scored with 30 seconds left to tie Slovakia 1-1. Something which actually affects people’s lives.
I think the blaring of those obnoxious horns is affecting people’s lives more. I have read there has been a run on ear plugs in the stores there.
Of four sea ice extent products, 3 show extent at the lowest in the record for this time of year, and the fourth is close to the minimum for this time of year.
http://nsidc.org/data/seaice_index/images/daily_images/N_stddev_timeseries.png
http://www.ijis.iarc.uaf.edu/seaice/extent/AMSRE_Sea_Ice_Extent_L.png
http://www.iup.uni-bremen.de:8084/amsr/ice_ext_n.png
http://arctic-roos.org/observations/satellite-data/sea-ice/observation_images/ssmi1_ice_ext.png
How come these products, which were regular features at this site a couple of months ago when they showed near average (normal) sea ice extent, are not discussed in some detail?
I think rather they try to assess total Arctic sea ice. They model “pan-Arctic” and assess “Total Arctic Ice Volume”.
http://psc.apl.washington.edu/ArcticSeaiceVolume/IceVolume.php
Arctic ROOs, the greatest extent of the four above, also has ice area at near-record lows, currently tracking 2008 as the second lowest area in the record.
http://arctic-roos.org/observations/satellite-data/sea-ice/observation_images/ssmi1_ice_area.png
The Cryosphere Today map comparisons heading the top post have this disclaimer boldly printed:
Historic snow cover data not displayed on these images. Sea ice concentrations less than 30% are not displayed in these images. Snow cover data is displayed only for most recent dates.
So you’re not getting the full picture there.
It is much easier to establish extent and area than volume. That there is a discrepancy with the concentration maps and the extent data might be an artefact of the missing data covering <30% concentrations. I wouldn't be too confident about the findings in the top post.
stevengoddard says:
June 15, 2010 at 5:31 am
Steve from Rockwood
Does ice melt faster at -30C or -33C?
Is there some reason why a 3C temperature anomaly in January in the Arctic is relevant to forecasting summer extent?
Yes, the colder the ice gets in winter the thicker it gets which means more ice to melt the following summer. (ice thickness grows approximately as the squareroot of the number of days below -1.8ºC)
Nice propaganda piece, you really must learn to use the zoom button on your monitor though!
stevengoddard says:
June 15, 2010 at 5:31 am
Does ice melt faster at -30C or -33C?
I still remember in another thread R. Gates saying the Arctic “enjoyed warm conditions” this past winter. -30 instead of -33, or -51 instead of -54 made it enjoyably warm there.
Great football comment from the Guardian Web Site. Brazil and Portugal both have matches this morning.
http://www.guardian.co.uk/football/video/2010/jun/15/vuvuzela-an-idiots-guide?showallcomments=true#CommentKey:b6436cee-cda7-4c47-900c-ac551e180df1
Smokey says:
June 15, 2010 at 6:18 am
Robert says @4:44 am:
“Jim,
discussing antarctic sea-ice is a moot point…”
No, it is merely an inconvenient point to our friends visiting from RC. The Antarctic is gaining ice, and Robert doesn’t want to discuss that uncomfortable fact because it debunks the CAGW conjecture.
Most of us follow Anthony’s admonition to stick to the subject of ‘Arctic’ in these posts, you being a persistent exception! Nice try at changing the subject though, hopefully no-one takes the bait.
Rotting ice can only come from a warming earth. But temperatures have decreased slightly since 2001. If you wanted to include El Nino warmth then there has been cooling since 1998.
Ice is ‘rotting’ in a cooling earth??
rbateman says:
June 15, 2010 at 4:43 am
Przemysław Pawełczyk says:
June 14, 2010 at 11:07 pm
You haven’t been looking at the right maps:
http://weather.unisys.com/surface/sst.html
No, I was looking into right maps of Air Surface Temperature, _not_ Sea Surface Temperature ones.
stevengoddard says:
June 15, 2010 at 4:50 am
Przemysław
Measured temperatures near the pole have been below freezing.
Steve,
You showed NCEP _forecasting_ map which I wasn’t able to confirm with ESRL _observed_(?) map of AST.
Also, _one_ IABP PAWS Buoy does not confirm your claims related to the NCEP map. I need something more convincing.
BTW. rbateman has touched very important issue related to Arctic maps (it was rattling in my mind for some time) – which of them are much credible? Why NCEP is better then ESRL, etc. or vice versa?
I beg your pardon but many times I have an impression that there is too much “cherry picking in” (some of you likes the expression, I prefer “juggling with”) the Arctic maps domain.
Best regards
Jason Calley says:
June 15, 2010 at 6:26 am
Robert says (at 6/15, 5:38): “Slight difference in the amount of open water between the two eh? Ice-forified schooner and no engine catamaran…”
Anyway, congratulations to Mr. Roubinet on a wonderful adventure, but his success does not in any way demonstrat that the Artic ice is unusually sparse these days.
At least 6 yachts successfully sailed the NW Passage last year and the previous year without being equipped with ‘ice skates’. Amundsen’s 47 ton yacht Gjoa did indeed have an engine, according to Amundsen: “I may say that our successful negotiation of the North West Passage was very largely due to our excellent little engine”.
Steven Goddard,
Thanks for making all these videos!!
These are comments from the PIOMAS website – the bit which amuses me is: “These data are not suitable for time series, anomalies, or trends analyses”.
PIOMAS is a numerical model with components for sea ice and ocean and the capacity for assimilating observations. For the Ice Volume simulations shown here, sea ice concentration information from the NSIDC near-real time product are assimilated into the model to improve ice thickness estimates.
Snow and Ice Data Center (NSIDC) creates the current NISE product using passive microwave data from the Special Sensor Microwave Imager/Sounder (SSMIS) on board the Defense Meteorological Satellite Program (DMSP) F17 satellite. The SSMIS instrument is the next generation Special Sensor Microwave/Imager (SSM/I) instrument. These data are not suitable for time series, anomalies, or trends analyses. They are meant to provide a best estimate of current ice and snow conditions based on information and algorithms available at the time the data are acquired. Near-real-time products are not intended for operational use in assessing sea ice conditions for navigation.
On my earlier post at 6:26 today, in reference to a post by Robert I gave incorrect figures on the draft of Amundsen’s boat. Clear mistake on my part, my apologies. If anyone has the correct figures, I would welcome a correction.
I’ll have to ask my brother if the Canadian military has been doing any coring as they are right there on Baffin’s northern shores. If the rumours are true, then CF presence in the High arctic are going to once again be commonplace as they are withdrawn from Afghanistan. There’ll be an opportunity for satellite data and models to be tested against actual measurements taken by real live humans without an agenda outside that of Canadian sovereignty.
Robert says: June 15, 2010 at 4:44 am
“discussing antarctic sea-ice is a moot point.”
Yes Robert, ignoring the Southern Hemisphere and more than half of the average sea ice on Earth is clearly the best path to expanding human knowledge…
And this Global Sea Ice Area chart should be completely discounted as well…
http://arctic.atmos.uiuc.edu/cryosphere/IMAGES/global.daily.ice.area.withtrend.jpg
Steven Goddard says:
“Does ice melt faster at -30C or -33C? Is there some reason why a 3C temperature anomaly in January in the Arctic is relevant to forecasting summer extent?”
I would turn it around and ask you does ice grow faster at -33C or -30C (I don’t know the answer myself but I assume colder temps lead to faster ice growth). If ice “grows” more slowly in the winter because of higher than expected surface temperatures it seems reasonable to assume there is less ice when it starts melting in the summer.
Steve, I think it is important for your readers to understand what the ice concentrations actually mean at this time of year. Once melt water appears, the passive microwave sea ice algorithms underestimate the actual sea ice concentration since melt water “appears” as open water in these algorithms. Thus, when you see lower ice concentrations, that can imply either open water or surface melt/melt ponds. If you look at the MODIS image from the Beaufort Sea area as R. Gates linked to, you will find that both open water and surface melt are contributing to the lower passive microwave-derived ice concentrations in that region.
Because of this, NSIDC focuses on the actual binary extent (i.e. ice or no ice based on a 15% sea ice concentration threshold) rather than the actual ice area (area multiplied by ice concentration).
It is the sea ice extent that is today the lowest observed during the satellite era. Other years have shown lower ice concentrations at this time of year than today (2007 is a good example), which may imply more surface melt rather than more open water (MODIS or SAR imagery could be used to validate that).
Peter, you are correct that the near-real time data from NSIDC are not meant to be used for long-term trends since they are not the highest quality checked fields, but NSIDC has done a lot of comparisons with the near-real time data and the higher quality data received from RSS and there are very little differences between the two data sources. The main differences appear related to occasional geolocation errors in the near-real time data stream. Of course NSIDC is going to advocate using the highest quality product for any long-term analysis.
R Gates suggests a 4.5 million sq KM minimum this year?
I suggest we place bets on the minumum now, perhaps a widget on the side to vote for our favoured minimum, say from 6.5 down to 4.0?
My guess as a lay person is 5.8 million sq KM although making estimates now with any sort of determination could well make the person doing the guessing look quite foolish.
Perhaps a prize of a signed copy of Al gores new book for first prize and two copies for second place?
Steve from Rockwood says:
June 15, 2010 at 7:55 am
Steven Goddard says:
“Does ice melt faster at -30C or -33C? Is there some reason why a 3C temperature anomaly in January in the Arctic is relevant to forecasting summer extent?”
I would turn it around and ask you does ice grow faster at -33C or -30C (I don’t know the answer myself but I assume colder temps lead to faster ice growth). If ice “grows” more slowly in the winter because of higher than expected surface temperatures it seems reasonable to assume there is less ice when it starts melting in the summer.
As I pointed out above you are correct, thickness depends approximately on the square root of (freezing degree days), freezing degree days being the number of days below -1.8ºC multiplied by (abs(T)-1.8).
Julienne
You sound like you may know what you are talking about.
Which is better for estimating ice volumes and thicknesses – PIOMAS or PIPs2 (or 3 or 4)? Both use defense satellites to gather their basic data – yet once ‘interpreted’ both produce very different results. Or is this just a simple case of comparing apples with oranges?
Lucia already has a “betting” pool. I believe her long-range one is closed, but later there will be a mid-range bet and a short-range bet.
Julienne
As always, thank you for the very helpful explanations!
Steve from Rockwood
Water which is insulated from the air by two metres of ice and a foot of snow, will scarcely know the difference between -33C and -30C air temperatures.
stevengoddard says:
June 15, 2010 at 4:48 am
BillD
“Rotten multi-year ice.” That is a new term. Where can I find a boat that cruises through four metre thick ice? Too bad the Titanic didn’t have that technology.
Steve;
Anyone who wants to understand what’s happening with the arctic sea ice should probably look at Dr. Barber’s presentation. My undertanding is that the multi-year sea ice is melting from below and breaking into chunks that ships can readily go through. Barber and his team and the ships crew were also very surprised to see swells penetrating miles into what was considered multiyear ice. This means that there were numerous gaps in this long term ice. His presentation is on the order of 40 minutes,with many photos and diagrams as well as graphs of data and I only watched it once. The point is that their ship was only supposed to be able to penetrate solid ice < 2 m thick, but there readily sailed through ice that was 4 m or more thick because it was broken into chunks. Presumably, the icebergs that the Titanic ran into were much more substantial than last year's sea ice. Since the ship's crew and a scientists with about 30 years of experience in the arctic were very suprised by the condition of the "multiyear ice", one would assume that the conditions that they observed were not routine. Barber and his graduate students are working on journal publications, but we need to wait for the peer-reviewed works.
Oslo says:
June 15, 2010 at 6:33 am
@BillD:
Did Professor David Barber try cruising at high speed through the ice in 1979 as well? Or in 2001? 2009? Or did he just try this last year, thinking that this must be unusual?
For this method to have any validity whatsoever, he should made this trip every year over a 20-year period, with the same speed, same ship, following the same route.
And even then, this doesn’t seem like a very scientific method to me: cruising at high speed through “rotten” ice one year, and drawing sweeping conclusions about the state of the arctic from this little trip.
Oslo:
My understanding is that his ship was in the actic for several months and that he has conducted similar criuses over the last thirty years. He was showing data and photos of conditions that he and others have not reported in the past. I assume that the peer reviewed journal articles will be more rigorous in documenting change, than this plenary lecture, aimed at showing something new.
Joe Lalonde says:
June 15, 2010 at 5:01 am
No, Saskatchewan and Manitoba are not close to the Arctic, especially not any of the parts that actually see agriculture. And Alberta’s little skiffs of snow toward the end of May are not in any way unusual. Annoying, yes, but not unusual.
Alberta, Saskatchewan and Manitoba are all part of the zone that saw lots of precip and cooler overall temps as a result of El Nino, which is also not unusual. In fact, we (I’m in Alberta) look forward to the crappiest, coldest weather in the rest of the continent, that’s when we get the best weather (warmer is better… no matter what some people think).
stevengoddard says:
June 15, 2010 at 8:43 am
Steve from Rockwood
Water which is insulated from the air by two metres of ice and a foot of snow, will scarcely know the difference between -33C and -30C air temperatures.
Right, under those conditions it won’t grow any thicker so there’ll still be less ice to melt in the summer!
Peter Miller says:
June 15, 2010 at 8:35 am
Julienne
You sound like you may know what you are talking about.
Which is better for estimating ice volumes and thicknesses – PIOMAS or PIPs2 (or 3 or 4)? Both use defense satellites to gather their basic data – yet once ‘interpreted’ both produce very different results. Or is this just a simple case of comparing apples with oranges?
———————–
Peter, since I haven’t actually done the comparisons between the two models (and validated them with observations of ice thickness) I can’t say for sure which one is better. I know PIOMAS was validated from 2003-2007 using ICESat ice thickness fields as well as sea ice concentrations from SSM/I and at least during those years, the model performed well. I don’t know what years/data sources PIPS2.0 was validated against.
Any comparisons between the two models should be done using the same fields and over the same spatial region. I’m not sure from the discussions on here if that has been done by Steve or anyone else.
R. Gates says: “I have much more to say about your update, but I think this provides an early quick rebuttal. But as always, a nicely put together post and one that I couldn’t disagree with more!”
I think it certainly is OK to favor a high resolution image over a low resolution but I don’t think I would call it a rebuttal until you provide a high resolution image of 2007 also.
Better technology does not discover a “new” anomalies in comparison to old technology, it discovers new detail and whether it is an anomaly or not isn’t known.
What Steve is doing here is roughly applying a ground truthing to the new data interpretations in comparison to the old. It may well be he lacks the resolutions necessary to do that that others may have but apparently you lack that also so it really isn’t a rebuttal at all.
We have seen unusual steps in datasets occurring frequently in our temperature records and almost always they can be traced to changes in data collection methods or equipment. It becomes a real problem when you have confirmation biases at work where anomalies in one direction are more suspect than they are when in the “right” direction. From this effect alone its pretty clear many of our climate records reflect some level of inaccuracy from this. Unfortunately, there may not be an easy way to resolve this as this kind of new interpretation can be forwarded right into the ice minimum, generate a new record low ice measure despite a complete lack of evidence that what is being seen in the newer higher resolution technology wasn’t there all along.
Thanks Steve for producing this. I can see it isn’t the final word on the matter but will be expecting a real response, not just more new angle shots of leads in the ice pack.
Bill D,
I completely agree with your assessment and I think it is indeed a must watch for anyone who actually wants to understand the science behind current sea-ice conditions in the arctic. Many of the people here have their minds made up about arctic sea ice but those who actually feel they can learn should look up the plenary lecture.
The fact that Goddard is making commentary which suggests that what barber has to say isn’t important begs the question of whether the purpose of all these analysis of sea ice on this site is really to inform the viewers or whether it has another purpose.
I will give Goddard the benefit of the doubt on this one but ignoring the commentary of an actual true expert in studying sea-ice because what he has to say is not what you want to hear is not doing justice to the true state of the science
BillD
Walt Meier tells me that before sea ice starts forming, the water below it has to reaching the freezing point down to a depth of several tens of metres. That makes Barber’s explanation rather unpalatable.
Anyway, water on the Pacific side is running below normal.
Peter Miller says:
“Which is better for estimating ice volumes and thicknesses – PIOMAS or PIPs2 (or 3 or 4)? Both use defense satellites to gather their basic data – yet once ‘interpreted’ both produce very different results.”
Agreement between the two, and to the measured data of IceSat, is actually pretty good. That is if, unlike Steve, you calculate the volumes properly:
http://img808.imageshack.us/img808/6980/pipsvspiomasvsicesat.png
http://ocean.dmi.dk/arctic/meant80n.uk.php can show temperatures above 80N for 2007 too.
kadaka (KD Knoebel) says:
June 15, 2010 at 6:01 am
Why not take a look at the phantom thin ice?
http://ice-map.appspot.com/?map=Arc&sat=ter&lvl=7&lat=74&lon=-139&yir=2010&day=165
And for my 2 cents worth, in the huge arctic basin a fleet of icebreakers becomes quite insignificant.
Steve Goddard says:
“Water which is insulated from the air by two metres of ice and a foot of snow, will scarcely know the difference between -33C and -30C air temperatures.”
I’m not so sure. If a winter shows daily higher averages of a few degrees – even under very cold conditions – the rate of ice growth will be lower. As Phil points out (thanks Phil) there is a relationship between temperature and ice growth.
But I see your point. Summer ice extent varies more greatly than does winter extent, suggesting that summer temperatures are more important in determining minimum ice extent and the approaching summer temperatures appear very close to “normal”.
If you separate short term (year over year) from longer term (the downward trend from 1979) variations in minimum ice extent, the short term variations seem much higher than the error estimates given for ice extent predictions. So a year to year variation of 1.5 million sq km might be considered normal and we should expect a 4.0 – 6.5 million sq km range.
The real question is the downward trend from 1979. Is it part of a longer periodic trend or a worrisome sign of impending doom?
Julienne
As mentioned in the article, I’m not sure what region PIOMAS uses. I’m guessing it is a relatively small area close to northern Greenland – because that is the only place where their numbers make sense.
I’ve been following the individual sea ice areas along with low level wind vectors and oceanic current SST’s. There is nothing unusual about the melt patterns I see. Those that are under ice retaining conditions show average extent/area. Those that are under the influence of wind and currents show predictable extent and area patterns. You absolutely cannot have a conversation about ice extent, area, volume, and thickness data without taking into account – conditions on the ground. Those conditions are available. If you keep tabs on them regularly, Arctic conditions will not prove anything other than Arctic ice responds to wind and currents, neither of which are related to CO2.
As in:
http://www.aari.nw.ru/clgmi/forecast/show_drift.asp?fign=0&lang=0
http://polar.ncep.noaa.gov/sst/ophi/color_anomaly_NPS_ophi0.png
http://www.aquatic.uoguelph.ca/oceans/ArticOceanWeb/Currents/frontpagecur.htm
With just these three weather and SST maps, along with a basic understanding of Arctic currents, one can make a very good educated guess regarding where extent/area has decreased, and where it has not.
‘Polar Heat Bringing Harder Winters by Stephen Leahy’ from IPS website (Jun 15, 2010):
“Barber says an ice-free summer may be just three or four years away, when icebreakers will no longer be needed to navigate the region.”
http://www.ipsnews.net/news.asp?idnews=51826
and…
‘Reports of Record Arctic Ice Melt Disgracefully Ignore History’ by Noel Sheppard (September 9, 2007):
“Roald Amundsen, a Norwegian explorer who successfully navigated the Northwest Passage on August 26, 1905… this Passage was clear enough of ice for a wooden sailboat, with a crew of seven, to successfully navigate it more than 100 years ago”.
http://newsbusters.org/blogs/noel-sheppard/2007/09/09/reports-record-arctic-ice-melt-disgracefully-ignore-history
In view of Steven Goddard’s analysis, I am a bit pressed to accept the notion that the arctic will be ice free by 2014.
In the 1970’s, an impending ice age was all the rage by climate scientists – now it’s global warming and rapidly increasing in sea levels… unprecedented in earth’s history. What next?…
from ‘New Study Says Global Warming May Be Signal of Impending Ice Age
http://www.redstate.com/jeffdunetz/2010/03/04/new-study-says-global-warming-may-be-signal-of-impending-ice-age/
and, ‘Earth on the Brink of an Ice Age’
http://english.pravda.ru/science/earth/106922-0/
Smokey,
What part of “why is Antarctic sea ice increasing? There are several contributing factors. One is the drop in ozone levels over Antarctica. The hole in the ozone layer above the South Pole has caused cooling in the stratosphere (Gillet 2003). This strengthens the cyclonic winds that circle the Antarctic continent (Thompson 2002). The wind pushes sea ice around, creating areas of open water known as polynyas. More polynyas lead to increased sea ice production (Turner 2009).
Another contributor is changes in ocean circulation. The Southern Ocean consists of a layer of cold water near the surface and a layer of warmer water below. Water from the warmer layer rises up to the surface, melting sea ice. However, as air temperatures warm, the amount of rain and snowfall also increases. This freshens the surface waters, leading to a surface layer less dense than the saltier, warmer water below. The layers become more stratified and mix less. Less heat is transported upwards from the deeper, warmer layer. Hence less sea ice is melted (Zhang 2007).”
did you not understand? Because if you like I can explain these concepts to you so that maybe it is easier to understand.
Also, for the record, Antarctica is not gaining ice in general. It is losing land ice extensively (Chen et al. 2009, Velicogna… Rignot… Cazenave… Allison et al. ) and gaining sea-ice in regions away from the west antarctic ice sheet.
For future discussions of glaciological events, be more concise and be prepared to read the core literature.
Finally, i’m not a big RC reader. Too much climategate defensiveness these days.
Steve,
I always enjoy your articles. Thank you.
With all the points/counterpoints made about thickness, extent, minimums, averages, and means, fortunately there is one thing we call all agree on: No matter what happens in the arctic this September, it won’t have anything to do with CO2. We could just as accurately look to the outcome of the World Cup as a driver of sea ice extent. 🙂
And I forgot to mention solar parameters:
“A comment about the seasonal cycle of solar radiation
The following description of the seasonal cycle of solar radiation based on gridded global radiation fields has been drawn from the data section of the Arctic Climatology Project Arctic Meteorology and Climate Atlas.
The field of global radiation for March shows a primarily zonal pattern, that is, one in which radiation decreases with latitude. This occurs because in March, the amount of solar radiation at the top of the atmosphere decreases sharply with increasing latitude. From April through August, latitudinal variations in solar radiation at the top of the atmosphere are less pronounced, so that cloud cover plays a strong role in determining the flux reaching the surface. Consequently, radiation patterns from April through August are very asymmetric. Fluxes are lowest over the Atlantic sector, where cloud cover is greatest. Fluxes peak over central Greenland from May through August. In large part, this illustrates the tendency for the high central portions of the ice sheet to be above the bulk of cloud cover. The highest fluxes are found in June because radiation at the top of the atmosphere peaks in June. Note for June the rather high fluxes over the central Arctic Ocean. This is largely explained in that cloud cover over this region is comparatively limited. From July onwards, radiation fluxes decline. September shows a zonal pattern, which as with March, arises from the strong latitudinal variation in solar flux at the top of the atmosphere for this month.”
http://nsidc.org/arcticmet/factors/radiation.html
Phil. says:
June 15, 2010 at 7:09 am [ … ]
…
You took the wrong bait, Phil. Check out Robert’s 4:44 am post, which I had responded to.
This is what the mountains above the National Snow and Ice Data Center look like this morning, covered with lots of fresh snow. View from the north.
Oslo,
Before you criticize the work of Canada’s Research Chair in Arctic System Science perhaps you should learn a bit more about him and his work
http://web.mac.com/barber1818/D.G.Barber/Welcome.html
If you think that he doesn’t know what he’s talking about then I believe you should read some of his publications and research work and then you will become more acquainted with non-blogosphere science and will actually learn to appreciate the mans work. I don’t think even Goddard or Watts would be naive enough to criticize this man’s knowledge on arctic system science. There is not a person on this forum and barely any in the world who have this kind of knowledge so give him a little respect. When an expert speaks, listen.
Of all the comments I’ve read to this, this one made me chuckle the most (so far):
“No matter what happens in the arctic this September, it won’t have anything to do with CO2..”
___________
By that, I assume you meant the excess CO2 that may have been put in the atmosphere by human activties over the past few hundred years…for certainly, CO2 plays a big role in providing a nice warm planet, and without it, the ice in the Arctic would be covering the whole planet in very short order. So yes, CO2 has very much to do with what goes on in the Arctic, both this September, and every single day.
Sounds like a classic case of The Heisenberg Principle. Better break that ice up as quickly as possible to assure maximum melt.
No doubt Barber is correct and the Arctic will be ice free in three years.
“Science is the belief in the ignorance of the experts”
Richard Feynman
Xi Chin made an interesting comment when he wished there were a abstract or summary at the beginning of the article/post. The back and forth of “I said-he said” does leave one scratching his head at times, though obviously the writer believes he comes out best. The response-blogs are the equivalents of peer-reviewed comments, but without a synopsis or consensus agreement.
There is a huge amount of value in the post-normal science, intelligent-observer auditing going on as represented by this and other high quality blogs. The problem is that, as there is no summary/conclusion, it becomes fluff, or a tangle of string. There are books here made up of chapters simply created by distilling the statements and counterstatments (and data) each topic stimulates. The AGW and anti-AGW positions already have books, of course, but they are predictable and one-sided positions (and, in part, rants). If ever there is to be a public debate about the current temperature rise, ice loss and ocean acidification, the skeptic position would be enriched by an objective review of these blog dialogues. The alarmists don’t do these things (nor do they list the skeptic blog locations). They claim that giving time to skeptics gives credence to their doubts. I’d say it weakens their ability to rationally discuss the subject. But then, the main alarmist argument is to fall back on authority, either of the government spokesperson or the scientists who gathered the data. The difference between explaining what a thing is (i.e. the picture the data shows) is, of course, different from explaining how or why a thing is (i.e. the key items, patterns or processes involved). The alarmist view does not recognize this difference; the blog-audits do.
To return to Xi Chin’s point about abstracts or summaries: if, every few months, a wrap-up of key reports and rebuttals were done, we would be both enlightened and armed against the non-reflective alarmist arguments. Either the Arctic sea ice is increasing (extent, thickness, volume) or it is not: regardless of what we read here, the pro-melt faction doesn’t budge or reconsider their position. Why? Is it because we don’t finish what we started, don’t answer their dismissals with data they cannot refute, or because our position is no more tenable than theirs, and their advantage is fundamentally that they, like the incumbent politician, are the ones “in office” right now. In military situations, it takes a 4 to 1 (or more) advantage to take a defended position: is that where we are at in the AGW battle?
Layne Blanchard
The big question is – can the US ever score a goal in the World Cup, or do they always have to rely on the other team to put the ball in the net for them?
In the 1970′s, an impending ice age was all the rage by climate scientists – now it’s global warming and rapidly increasing in sea levels… unprecedented in earth’s history. What next?… ”
No. The majority of peer reviewed studies in the ’70s predicted warming due to Co2 and stated that the cooling trend was just a short term trend.
http://www.skepticalscience.com/ice-age-predictions-in-1970s.htm
It would help the skeptic cause not to constantly repeated widely confuted factless claims that are little more than urban legends. It makes skepticism sound like 9/11 conspiracism.
The one thing few people consider when arguing about Arctic ice and that is the variations in the salinity of that ocean.
Northern Canada appears to have had unusually low rainfall this winter, therefore the rivers there will be transporting less fresh water into the Arctic. Fresh water is less dense and probably slightly warmer than the Arctic Ocean’s water – therefore fresh water from the rivers should tend to lie on top of the sea water.
Therefore reduced inflows of fresh water into the Arctic Ocean should act as an effective inhibitor to the rate at which ice forms in winter and as as accelerator to the ice melt in summer. This is almost certainly a localised effect, but may help explain why the ice does not melt at an even rate throughout the Arctic.
Paul McCulloch says:
June 15, 2010 at 9:56 am
‘Reports of Record Arctic Ice Melt Disgracefully Ignore History’ by Noel Sheppard (September 9, 2007):
“Roald Amundsen, a Norwegian explorer who successfully navigated the Northwest Passage on August 26, 1905… this Passage was clear enough of ice for a wooden sailboat, with a crew of seven, to successfully navigate it more than 100 years ago”.
So clear of ice was it that shortly after that he had to leave his ship at King’s point for the winter and sled overland to send a telegram to tell the world that he had traversed the passage and was clear of the archipelago! He resumed his journey the following summer. Of course he’d had to complete the passage piecemeal over three seasons, in contrast to yachts travelling from Alaska to Newfoundland (or vv) in a single summer these days.
stevengoddard says:
June 15, 2010 at 10:19 am
This is what the mountains above the National Snow and Ice Data Center look like this morning, covered with lots of fresh snow. View from the north.
__________
Thanks for that Steve…we are indeed quite fortunate to live in the beautiful State of Colorado…aren’t we!
R. Gates,
I love summers in Colorado. As a cyclist, the past few winters have had too much ice on the road though. I gave up on cycling for more than four months this winter.
NCEP is now forecasting freezing Arctic temperatures into July.
http://wxmaps.org/pix/temp2.html
Steven Goddard
“It appears that the precision of the newer maps is much greater than their accuracy. Better to use a low precision map which is matched correctly with its accuracy.
This useful set of animations would seem to reinforce the argument I have made several times on these Arctic ice threads, that higher imaging resolution does not necessarily translate to better detection of trends. Although as R Gates repeatedly shows its easy to be dazzled by such technical parameters in a nerdish sort of way. As you demonstrate, high resolution can introduce spurious phenomena which militate against accurate determination.
phlogiston says:
June 15, 2010 at 11:39 am
Steven Goddard
“It appears that the precision of the newer maps is much greater than their accuracy. Better to use a low precision map which is matched correctly with its accuracy.
This useful set of animations would seem to reinforce the argument I have made several times on these Arctic ice threads, that higher imaging resolution does not necessarily translate to better detection of trends. Although as R Gates repeatedly shows its easy to be dazzled by such technical parameters in a nerdish sort of way. As you demonstrate, high resolution can introduce spurious phenomena which militate against accurate determination.
___________
Or, as the high resolution satellite image that I gave a link to displayed– that the high resolution concentration data was pretty much right on target, and the lower resolution version missed the finer detail, and when it comes to Arctic Sea ice and so many other things in science, the devil is indeed in the details!
Stevengoddard says:
Given that, I can’t see how multi-year ice can get significantly thicker than new ice – apart from snowfall on the surface.
And, as ice-covered water loses heat a lot slower than open water, ice thickness must be influenced far more by the speed, direction and temperature of the sea currents beneath the ice than by the air temperature above it.
Hypnos says:
Ah yes, science by consensus.
Many of us are old enough to remember the ’70s, and I can tell you that there was a lot more to it than just a Newsweek article.
I forgot to add: how did they explain the ‘short-term cooling trend’?
“Hypnos says:
[…some revisionistic statement about the 70ies…]”
Cool nickname, Hypnos! Hail…
..the…
…Hypnotoad..
This is what Stephen Schneider looked like in the 70ies:
This is what Schneider looks like today:
The first video states that Schneider said in an interview “In 70, 71 i was more worried about cooling” so Hypno Toad might be right: The alarmist cause might have switched somewhere in the mid 70’s from cooling to warming, giving “warming” an opportunity to gain the pole position in that grand game of counting peer-reviewed papers we colloquially know as “science”.
This fellow Barber has quite a following of trolls and appears to be their new Messiah. Hardly surprising that they would need a new Messiah, since their previous spiritual leaders have all recently been proven to have feet of clay, big time.
I was nearly caught up enough in the religious fervour to click one of the links to his many gospels being pressed upon us, until I read a post referring to his many student assistants.
No change there then. Just another freeloader on the gravy train justifying his existence.
And by the way, this lot of trolls are extremely discourteous in some of their postings – whilst prepared to tolerate their points of view, I find their manners boorish and tiresome.
Dr Barbers presentation is an absolute treasure. It’s a must see for skeptics like me.
It seems that the recovery from the little ice age continues unabated.
stevengoddard says:
June 15, 2010 at 11:29 am
NCEP is now forecasting freezing Arctic temperatures into July.
http://wxmaps.org/pix/temp2.html
Hm, I see the anomaly map at the bottom shows mostly red (positive) in the Arctic, so temperatures will be above average.
Dang! The first video is a part of this:
and it’s from 1978 – so the imminent Dr. Stephen Schneider, grandmaster of global climate alarmism, didn’t switch from cooling to warming before 1978. Ok, Hypnos, i think your scecpticalscience link is a severe distortion of the facts.
Xi Chin says:
June 15, 2010 at 1:36 am
I really wish that each article would start with an abstract, or executive summary.
Well this particular article in its entirity consists of about 4 dozen sentences and a whole load of pretty pictures (with captions) – an executive summary would be a significant fraction of that.
Articles on WUWT are not 200 pages of turgid waffling (thankfully) where executive summaries are required to prep you for how much of your life you’re going to be wasting by reading it.
jakers
I didn’t realize that there is a lot of sea ice in central Alaska.
This is not a challenge or accusation, I’m deeply skeptical but …I wonder could someone explain to me how the six polar images at the start of this article, from ten, twenty and thirty years ago all use exactly the same format/background etc. I would have expected there to have been some change or modification just to the style, colouring or layout. How were these images generated? Thanks.
DirkH, I really don’t get your point.
Someone states scientists in the ’70s were predicting an ice age. I show that as false, given that most scientists in the ’70s were predicting warming.
That is not to prove any kind of truth by consensus. I am not saying the majority of scientists predicting warming were right (even tho they proved to be right). I am saying the claim “Scientists were predicting an ice age in the ’70s” is demonstratably false because most of them were predicting the exact opposite.
You post some videos about one scientist changing his mind. So what? That goes to his credit. He refined his theory and discovered he was wrong. In fact, in 1977 he said: “we just don’t know enough to chose definitely at this stage whether we are in for warming or cooling— or when.” Sounds to me like proper science.
http://stephenschneider.stanford.edu/Publications/PDF_Papers/Schneider1977.pdf
So, my point is: the claim that a majority of climate scientists predicted an incoming ice age is the ’70s is false.
If you want to counter it, you need to find a majority of climate scientists in the ’70s (the period given by Skeptical Science is 1965-1978) claiming an ice age was upcoming. One will not do. Two won’t either. It’s that simple.
Interesting to look at the Laptev Sea from sat pics vs. the cryo concentrations. They have mostly greens and blues, and the sat image doesn’t seem to jive with that.
http://arctic.atmos.uiuc.edu/cryosphere/NEWIMAGES/arctic.seaice.color.000.png
http://ice-map.appspot.com/?map=Arc&sat=ter&lvl=7&lat=73.190674&lon=-137.618661&yir=2010&day=161
Thoughts?
Of all the comments I’ve read to this, this one made me chuckle the most (so far):
“By that, I assume you meant the excess CO2 that may have been put in the atmosphere by human activties over the past few hundred years…for certainly, CO2 plays a big role in providing a nice warm planet, and without it, the ice in the Arctic would be covering the whole planet in very short order. So yes, CO2 has very much to do with what goes on in the Arctic, both this September, and every single day.”
Trust in the real science of geology and natural cycles, not in the dodgy scientific theories of grant-obsessed, government employees seeking to preserve comfortable lifestyles by peddling alarmist nonsense to the gullible masses. Correction: not so gullible masses – the tide of public opinion on AGW is moving steadily in the direction of sanity, not stupidity.
As I said in a comment upthread, the first bunch of graphs do not assess all the sea ice.
That’s in bold from the link to the first graph. PIOMAS state that their assessment is “pan-Arctic”, and of “total Ice volume”
Their list of data sets cover the Arctic well beyond ‘a relatively small area close to northern Greenland’, and “PIOMAS has been extensively validated through comparisons with observations from US-Navy submarines, moorings, and satellites.”
Have you contacted PIOMAS to verify your speculation?
Pls check for my post in the spam filter. I think it doesn’t like the PIOMAS links. Thank you.
Reply: Please do not waste time with requests such as this. The spam filter is checked regularly. ~ctm
Hypnos says:
June 15, 2010 at 10:51 am
“It would help the skeptic cause not to constantly repeated widely confuted factless claims that are little more than urban legends. It makes skepticism sound like 9/11 conspiracism.”
Perhaps this was my point… the general public is inundated with ‘scientific’ views, and their understanding of what they read or hear will be heavily influenced by those who promote their ‘science’ through MSM. And who in the 70’s would not believe a documentary hosted by Mr. Spock? After all, he had the backing of ‘real science’! Do any modern examples come to mind?
“BillD says:
June 15, 2010 at 9:14 am
Oslo:
My understanding is that his [Barber’s] ship was in the actic for several months and that he has conducted similar criuses over the last thirty years. He was showing data and photos of conditions that he and others have not reported in the past. I assume that the peer reviewed journal articles will be more rigorous in documenting change, than this plenary lecture, aimed at showing something new.”
The arctic is mighty big BillD. Where did Mr. Barber go with his little boat that was supposed to only be able to crack 2 meters of ice but instead cracked 2 meters? Did he go all over the place? Did he sail the exact same route on the same days with the same boat all those times he has supposedly been in the arctic over the years? Did he go in the 1880s too? Or in 1950? or 1960? is his observations really abnormal?
Mr. Barber immediately comes over as an alarmist trawling for new grants. His methods and the way he draws conclusions from more or less anecdotal “evidence” seems a tad unscientific too me.
Hypnos says: June 15, 2010 at 2:30 pm
“If you want to counter it, you need to find a majority of climate scientists in the ’70s (the period given by Skeptical Science is 1965-1978) claiming an ice age was upcoming. One will not do. Two won’t either. It’s that simple.”
How about a “few dozen experts”? Does that still count a majority consensus?
barry
If PIOMAS is correct, we certainly should expect to see a huge meltdown this summer.
Think about it. Ice volume is at a record low. Ice extent is at a record low. And even the multi-year ice is thoroughly rotten. Record temperatures in the Beaufort Sea. Warmest May on record for planet earth. Warmest year on record for planet earth. El Nino. Polar Bears drowning. Penguins drowning. Penguins drinking Coke with Polar Bears. How bad can it get??????
I can’t imagine why anyone who trusts the experts, wouldn’t go out and bet a lot of money on a record minimum. Seems like a done deal, based on the wealth of informative comments coming from the leading experts.
“And Brutus is an honorable man”
Mark Anthony
Layne Blanchard says:
June 15, 2010 at 10:03 am
With all the points/counterpoints made about thickness, extent, minimums, averages, and means, fortunately there is one thing we call all agree on: No matter what happens in the arctic this September, it won’t have anything to do with CO2. We could just as accurately look to the outcome of the World Cup as a driver of sea ice extent. 🙂
The Ice Ages were caused by Milankovitch cycles – that was the climate driver, for that time period. (In fact, they are still operating, but on very long time scales, overshadowed recently by the CO2 climate forcing.):
http://en.wikipedia.org/wiki/Milankovitch_cycles
As the Earth’s climate descended into an Ice Age, or climbed out of one, each single summer still had variable weather – but the overall trend was forced by the climate driver. Who cares what the snowfall in “Sweden” was for one particular year as the ice sheets formed ?
Same thing with the vanishing Arctic summer sea ice:
http://nsidc.org/images/arcticseaicenews/20091005_Figure3.png
The climate driver is known (CO2 buildup), and increasing. The details are “weather noise”. Who cares if the Arctic is ice free in summer 2018, or 2022, or 2028 ?
You don’t have to know the exact day, month and year Kobe Bryant retires to predict it will be before he turns 50.
Paul McCulloch,
Piers Corbyn sees general cooling coming too over the next ~30 years and staying cooler than now for ~100 years.
Paul McCulloch,
Henrik Svensmark says global warming is over:
“enjoy global warming while it lasts……In fact global warming has stopped and a cooling is beginning. No climate model has predicted a cooling of the Earth – quite the contrary. And this means that the projections of future climate are unreliable,”
http://wattsupwiththat.com/2009/09/10/svensmark-global-warming-stopped-and-a-cooling-is-beginning-enjoy-global-warming-while-it-lasts/
“Freezing”
If you take the Surface temp of Ice, or the Sea Surface temp :
It is ALWAYS freezing.
If we needed it to be above Freezing for there to be melting, Melting would NEVER HAPPEN.
You have to look at the amount it is ABOVE AVERAGE to get an Idea, and until the last week, it has been FAR above average virtually continuously
see: uah Arctic Ocean air temp
(last 5 months’ anomaly: + 3.2 December, 1.6, 2.92, 2.53, MAY = +2.68 degrees C.) http://vortex.nsstc.uah.edu/data/msu/t2lt/uahncdc.lt
This is a few 1000 feet up, but it gives an idea.
As to why melting off is a problem
1. It dries out the Plains States (& I mean a sand-dune DESERT)
2. IF and ONLY IF, it happens ALL IN 1 YEAR — with a HUGE El Nino, RECORD TEMPS, etc. and yet a high Ice extent to start with, THEN we might get Ocean Current Shutdown
= 300 mph Winds
= ALL structures above ground Destroyed
= We all DIE.
.. THIS year offers such a chance – – which is why I am worried.
Oh, & Milankovich cannot be the Ice Age Cause — it is a 108,000 year cycle — wrong: Ice ages have a 101,000..
Many favor a Jupiter interraction but Interplanetary dust was found to be only 4% less when in the plane of the Orbit (PS, yet I remember a “Zap” of Shoemaker-Levy — frankly, THAT explains the Sudden Ice AAge ends to me).
stevengoddard says:
June 15, 2010 at 4:38 pm
If PIOMAS is correct, we certainly should expect to see a huge meltdown this summer….. Think about it. Ice volume is at a record low. Ice extent is at a record low. And even the multi-year ice is thoroughly rotten. Record temperatures in the Beaufort Sea. Warmest May on record for planet earth. Warmest year on record for planet earth….. I can’t imagine why anyone who trusts the experts, wouldn’t go out and bet a lot of money on a record minimum.
They won’t put their money where their mouth is.
He also probably had the advantage of satellite-based pictures of the ice ahead of him.
The latest odds on this year being icier than last are 43% at https://www.intrade.com
Amino Acids in Meteorites says:
June 15, 2010 at 5:54 pm
Sounds like a great opportunity for the Science Doubters.
Bet early, bet often.
I think it would be great if a few knowledgeable WUWT participants like Pamela and Lucy were given administrators privileges and allowed to “mine” the threads here for the best stuff, including portions of comments, edit them (inside brackets), and fashion them into a loose-jointed summary of the points made here.
[Wholeheartedly agree. Not that it means anything. ~dbs]
Only Anu would refer to honest skeptics as “science doubters.”
He’s having fun trolling for RealClimate.
Anu says:
June 15, 2010 at 7:43 pm
You can lead a horse to water, but you can’t make him drink.
Record contraction in the Arctic, opposite phenomenon + in the Antarctic.
Never heard of global climactic hopscotch?
I highly reccomend it. Been happening for over 2 years now.
It’s not a time to goad others to gamble, it’s a time to prepare.
PS: Here’s the link to the thread on Lucia’s site where one can “bet” in monopoly money (“quatloos”) on Arctic ice extent. I bet 3 quatloos on 5.1^6 km^2, because this would be annoying to both sides. It would fail to continue the recovery (being a bit less icy than 2009), but it would also fail to meaningfully continue the decline. It would go mostly sideways.
http://rankexploits.com/musings/2010/sea-ice-weekly-average-summer-minimum-longish-range-forecast/
Well, you made my day — thanks!
When I was studying climatology in the early 1970s I recall no talk of warming; the cooling trends of the previous 3 decades had convinced many in the literature, and my profs, that another ice age was on its way, and it was mostly our fault. Aerosols and particulates from our industrial activities were to blame. Dr. Schneider went so far as to explain that CO2 could never overcome the effect of all that increased high atmosphere reflectivity.
And somehow our erstwhile commenters above leapt from Amundsen to the 2000s, entirely ignoring the RCMP motorized schooner St Roch, which went West to East in 1940-41 then East to West in three months over summer of 1944, the first vessel to do so. The St Roch is on display at the Vancouver Maritime Museum.
Smokey says:
June 15, 2010 at 7:49 pm
Only Anu would refer to honest skeptics as “science doubters.”
I have a special category for you, Smokey.
It rhymes with “appropriate”.
I have a special category for you too, Anu.
It’s just missing a letter.
rbateman says:
June 15, 2010 at 8:10 pm
You can lead a horse to water, but you can’t make him drink.
OK then.
Record contraction in the Arctic, opposite phenomenon + in the Antarctic.
Never heard of global climactic hopscotch?
Never.
There’s a reason people are argumentatively interested in “Arctic Sea Ice News” and Antarctica won’t be on their radar for another 60 years:
http://nsidc.org/monthlyhighlights/august2009.html
http://earthobservatory.nasa.gov/IOTD/view.php?id=42456&src=eoa-iotd
The Arctic meltdown is the “canary in the coal mine” – since you like animal sayings.
It doesn’t matter if 99 out of 100 clueless people you know don’t care about the Arctic summer ice disappearing – once it does, or close to it, the people that make the decisions that affect the world will be moving on to phase 2 – what to do about Global Warming.
I’ll miss these blogs when they’re gone.
Smokey says:
June 15, 2010 at 9:05 pm
I have a special category for you too, Anu.
It’s just missing a letter.
knowledeable ?
intellignt ?
cnning ?
Don’t give up so easily – here, try this:
http://mw2.merriam-webster.com/
Once you learn to spell, all those sciencey papers will be easier for you to read.
Who knows, maybe one day when you grow up, you’ll make an informed citizen…
Anu
In Hawaii, the leaders met regularly to decide how to stop those awful volcanic eruptions.
They recognized that a sacrifice had to be made, and threw thousands people into the volcano. Far fewer deaths than the number which will be killed by similarly useless carbon taxes.
Steven,
With all of the crap and vitriol you are receiving here, you struck a vein that must have been deeply revered as part of believer’s deeply held beliefs.
Robert says:
June 15, 2010 at 5:38 am
On May 19, 2007, a French sailor, Sébastien Roubinet, and one other crew member left Anchorage, Alaska, in Babouche, a 7.5 m (25 ft) ice catamaran. The goal was to navigate west to east through the Northwest Passage by sail only. Following a journey of more than 7,200 km (4,474 mi), Roubinet reached Greenland on September 9, 2007, thereby completing the first Northwest Passage voyage made without engine in one season.
—–
On the point of the Catamaran I would have to believe, as previously posted, that this vessel could manage the ice without water, and so, should not be considered in this discussion.
Of more relevance would be the open passages of the 1940’s and the 1900’s when wooden vessels made the NW passage. So to Robert, are you afraid to ask about the natural variability of arctic ice?
Oops, I meant to say above that I bet 5.1 *10^6 km^2, not 5.1^6 km^2.
stevengoddard says:
June 14, 2010 at 10:10 pm
AndyW
“I should probably attach units to the graphs. My measurements are in pixels, and I haven’t calculated the relationship to km2. You can’t compare my numbers to JAXA or NSIDC anyway this early in summer, because my ROI is smaller.”
Sorry, completely misled you there, I was taking about summer minima in my first post? You seemed from your piece to be edging towards thinking about that range for it.
Andy
1) Ice Age in the 70s
The link I gave lists 42 scientific papers published between 1965 and 1978 suggesting Co2 could warm the Earth (mind it, they were far less certain then they are now). Over the same time period, a total of 7 scientific papers claiming impending cooling were published.
If you want to claim the Ice Age scare of the ’70s had support from a majority of scientists, you should find at least 40 scientific papers published in the period stating an Ice Age was in the making. I will be more than happy to change my mind if presented with sufficient evidence. I am, after all, a skeptic.
2) Ships crossing the Arctic.
No ship sailed accross the Arctic in one season before the melt the 2000s. They all overwintered. And no commercial ship made it through before the melt of the 2000s – the St. Roch wasn’t a little wooden ship, it was a fortified shooner built specifically to withstand ice pressure. What’s remarkable of the recent melt is that it allowed commercial ships to make it through without ice breakers. That had never happened before.
3) Alarmism.
Suggesting that mankind modifying climate could have an harmful impact on civilization -> alarmism
Suggesting a tax on carbon will disrupt the world’s economies and kill millions -> coolheaded rationalism
It’s a wonder how the world managed to survive the oil shocks! Besides, the persistently high oil prices in the second half of the 2000s and the current disaster in the GOM should convince everyone that regardless of AGW, relying on fossil fuels isn’t a good receipt for the economic health of a country.
Anu says:
June 15, 2010 at 9:12 pm
There we go again. Boorish and tiresome trolls. There are many other blogs where this childish type of posting can be found in spades, but this blog has until recently avoided them and remained an arena for grown up and civilised discussion.
Those who predicted on earlier threads that the revelations of climategate and the subsequent debunking of the myths of CC/AGW would create a vituperative backlash from disappointed adherents have been proven correct in short order!
Hypnos,
The St Roch traversed the passage in one season. What this proves, or disproves, about Arctic Ice Extent is another story, but the basic fact is not up for debate and it does not advance your argument when you begin it with factually incorrect statements.
As for the cooling vs warming trends in the 1970s, the Newsweek cover stories of the day captured the popular beliefs of the day, just as they do now. The popular beliefs were fed by a combination of scientific research and publicity, just as they are today. Speaking as someone who was there, and paying attention, I am here to say that the climatologists who were getting attention were telling the world the ice age was imminent, and it was all our fault. Those climatologists who expressed a skeptical or opposite view somehow failed to get equal time in the popular media.
Some things don’t change much.
AndyW
Seems like JAXA 5.5 Mkm2 is a decent WAG at this point.
June 6:
Steve Goddard: “Based on current ice thickness, we should expect September extent/area to come in near the top of the JAXA rankings (near 2003 [6.1 Mkm2] and 2006 [5.9 Mkm2].)”
June 16:
Steve Goddard: “Seems like JAXA 5.5 Mkm2 is a decent WAG at this point.”
Steve’s estimates of the minimum extent are dropping almost as fast as the arctic ice itself is melting.
Steve,
From what I have seen about 2007, the currents were the most important factor for the heavy melt that year, with heavy flushing of multi-year ice into the Atlantic. You need to present more information about the historic paterns of the arctic winds and currents, particularly the strength of the East Greenland Current. I think the rest is just noise.
This is rhetoric. Have you nothing to say about sources and data problems that I outlined in my post? The graphs at CT that you have used are clearly labeled as lacking information on sea ice at less than 30% concentration. You don’t see this as problematic regarding your conclusions? Why didn’t you alert us to the disclaimer in your original post? And have you yet contacted PIOMAS to determines whether or not they confine their analysis to a small are North of Greenland as you speculate?
As we all know by now, weather conditions (like wind patterns), have a large influence on final sea ice extent. Betting on a record-breaking year, even with low-volume indicators, is chancy. For the record, I will state that I am very confident this year’s minimum sea ice extent will be amongst the four lowest in the satellite record – i’d wager money on that. I am slightly less confident that it will be lowest or second lowest, and think it’s 50/50 that the record will be broken this year. That’s the best I can do. I don’t bet on the weather months in advance. But I’m willing to make bets based on longer-term trends.
I look forward to your post at sea-ice minimum.
(Thanks to the mods for explaining they regularly check the spam filter. I’ve lost posts before and didn’t know that this occurred)
Halfwise, the stuff posted by Hypnos alleging to “refute” the ice age scare of the 70s appears to be standard cut-and-paste from several of the warmist sites. Apparently the ice age scare is to be given the MWP treatment and erased from history. In many cases it is the exact same “climatologists” making the proclamations, too. Wrong then, wrong now. Eventually they will figure out what a sine wave looks like.
A remarkable oddity is the persistence of the ice in the SW corner of the Sea Of Okhotsk.
stevengoddard says:
June 15, 2010 at 9:27 pm
Anu
In Hawaii, the leaders met regularly to decide how to stop those awful volcanic eruptions.
They recognized that a sacrifice had to be made, and threw thousands people into the volcano.
And the people of Rapa Nui wiped out the trees on their island worshiping their deified ancestors by erecting the Moai – what’s your point, before Science people were ignorant, superstitious, and made bad policy decisions ?
Yes, I agree.
Far fewer deaths than the number which will be killed by similarly useless carbon taxes.
So you’ve thrown off the skeptic hat and declared global warming over, have you ? No more wait and see ? The antonym of “skeptic” is “believer” – is that what you are, Steven ?
I see why the Arctic sea ice melting away worries you…
http://nsidc.org/images/arcticseaicenews/20091005_Figure3.png
roger says:
June 16, 2010 at 2:53 am
There are many other blogs where this childish type of posting can be found in spades, but this blog has until recently avoided them and remained an arena for grown up and civilised discussion.
There we go again – gleefully attacking official “enemies” while imagining it to be “grown up and civilised discussion”, e.g.:
http://wattsupwiththat.com/2010/01/10/mann-erisms-where-did-we-get-that-idea/
http://wattsupwiththat.com/2010/06/09/climate-change-have-we-reached-the-irreversible-stage/
and whining when someone voices an opinion you don’t agree with.
Those who predicted on earlier threads that the revelations of climategate and the subsequent debunking of the myths of CC/AGW would create a vituperative backlash from disappointed adherents have been proven correct in short order!
Climategate revealed little, AGW has not been “debunked”, the moderator saves people like you from my vituperation, I’m neither disappointed nor an adherent – but I do appreciate you putting all your errors in one succinct sentence.
SteveSadlov says:
June 16, 2010 at 9:35 am
A remarkable oddity is the persistence of the ice in the SW corner of the Sea Of Okhotsk.
Or maybe not too odd.
http://arctic.atmos.uiuc.edu/cryosphere/IMAGES/recent365.anom.region.14.html
“Climategate revealed little, AGW has not been ‘debunked’, the moderator saves people like you from my vituperation…”
How can one guy get everything so completely wrong?
Answer: Cognitive dissonance. When the flying saucers don’t arrive on schedule, it doesn’t mean there are no flying saucers. It just means their arrival has to be re-scheduled.☺
Just like Mrs. Keech’s flying saucers, seemingly breakthrough CAGW findings have all vanished, every one of them, after independent replication proved impossible. CAGW has now been downgraded from a hypothesis to an unsupported conjecture; a pseudo-scientific opinion kept on life support only by large infusions of grant money. Time to re-schedule.
They’ve got ’em at Intrade.
Roger Knights says:
June 15, 2010 at 7:39 pm
The latest odds on this year being icier than last are 43% at https://www.intrade.com
————————-
Know what you are talking about. It is not 43%, it is the the price of the bet at $43.00 on a volume of trading of 48 since the start in April. I dare you to eplain how that came to be a percentage.
In any case, the September sea ice extent will be lower than 2009, perhaps lower than 2008, or even coming close to 2007. Don’t forget that there has only be a partial recovery (as expected) of the massive 2007 loss, remaining about 500,000 sq km’s below the average (don’t confuse with normal). 2008 and 2009 recovered about 1/3rd each leaving 1/3rd unrecovered. In order to return to average, 2010 needs to recover another 500,000 sq/km’s, yet as of today (May 16) 2009 trails the 2010 melt by nearly 700,000 sq/km’s. Hence, as of today the ice melt would have to slow dramatically, which is highly unlikely, nor do past records show that it has done so during the time of credible record keeping. In that context 1979 is a good starting point
Tom P
Given that 5.5 was the first numeric estimate I have made for this year, I would have to say that you are being quite dishonest.
Smokey says:
June 16, 2010 at 1:28 pm
“Climategate revealed little, AGW has not been ‘debunked’, the moderator saves people like you from my vituperation…”
How can one guy get everything so completely wrong?
Answer: Cognitive dissonance. When the flying saucers don’t arrive on schedule, it doesn’t mean there are no flying saucers. It just means their arrival has to be re-scheduled.☺
————————-
Good grief, the astonishing logic floors me. Just because pigs don’t fly by my window, doesn’t mean there are no flying pigs; just reschedule their departure! I’ll call the nearest pig farm asap. (not sarcasm but an analogy)
———————–
Just like Mrs. Keech’s flying saucers, seemingly breakthrough CAGW findings have all vanished, every one of them, after independent replication proved impossible. CAGW has now been downgraded from a hypothesis to an unsupported conjecture; a pseudo-scientific opinion kept on life support only by large infusions of grant money. Time to re-schedule.
————————–
All vanished after independent replication? Downgraded from a hypothesis to unsupported conjecture? Pseudo scientific opinion? The latter I am quite familiar with just by reading this blog. There are some people here that argue from a scientific basis but in between there is a lot of garbage too. I test Steven Goddard’s hypothesis, just like some others (gratefully) do and judge it on it’s merits. Sometimes he does indulge in sarcasm, as in; Amino Acids in Meteorites says: June 15, 2010 at 5:54 pm
stevengoddard says: June 15, 2010 at 4:38 pm, which is not becoming.
Putting a self-calculated ice volume curve on an ice extent chart was deceptive and silly. Maintaining the “arctic recovered” claim, smells of having painted oneself into a corner as is the “global cooling” claim. I nevertheless appreciate his knowledge of scientific data and use and/or manipulation thereof. We can always counter argue the right and wrong.
Steve,
I mention that you had written on June 6 “Based on current ice thickness, we should expect September extent/area to come in near the top of the JAXA rankings (near 2003 [6.1 Mkm2] and 2006 [5.9 Mkm2].)”, with my addition of the relevant values, as I had done when you first reached this conclusion earlier in June.
Now you call me dishonest! How, exactly?
“All vanished after independent replication? Downgraded from a hypothesis to unsupported conjecture? Pseudo scientific opinion?”
Yep.
CO2
I can’t be responsible for whatever is going on inside your head.
Tom P says:
June 16, 2010 at 6:49 am
June 6:
Steve Goddard: “Based on current ice thickness, we should expect September extent/area to come in near the top of the JAXA rankings (near 2003 [6.1 Mkm2] and 2006 [5.9 Mkm2].)”
June 16:
Steve Goddard: “Seems like JAXA 5.5 Mkm2 is a decent WAG at this point.”
Steve’s estimates of the minimum extent are dropping almost as fast as the arctic ice itself is melting.
Ah, but like a seasoned politician, Steve left himself some wiggle room:
http://wattsupwiththat.com/2010/06/06/wuwt-arctic-sea-ice-news-8/
Conclusion : Based on current ice thickness, we should expect September extent/area to come in near the top of the JAXA rankings (near 2003 and 2006.)
The word “near” might not mean what you think it means. To a normal person, it would mean “near 6 million sq. km.”:
http://www.ijis.iarc.uaf.edu/seaice/extent/AMSRE_Sea_Ice_Extent_L.png
Certainly above 2009.
But to a person with an agenda, “near” will mean whatever it has to mean, come October: $4.2 billion is very near $6 billion.
Seems like JAXA 5.5 Mkm2 is a decent WAG at this point.
5.5 is just a wild ass guess – come October, that can be hand waved away as unimportant/very-approximate, and besides, Arctic sea ice melting away in the summer is no big deal.
Tom P
Given that 5.5 was the first numeric estimate I have made for this year, I would have to say that you are being quite dishonest.
Yes Tom P., how dare you hold Steve to his non-numeric predictions which merely used the years 2003 and 2006 ? (sure, the Year is a number, but you know what he means… he never said “near 6.1 Mkm2 and 5.9 Mkm2”)
As for my prediction of Arctic sea ice minimum extent being less than 2009 – maybe I meant 2009 * 10^6 sq. km.
I’ll let you know at the end of September.
Smokey says:
June 16, 2010 at 8:10 pm
“All vanished after independent replication? Downgraded from a hypothesis to unsupported conjecture? Pseudo scientific opinion?”
Yep.
They don’t call him “Smokey” for nothing:
http://blogs.ocweekly.com/navelgazing/arnold_smoking-pot.jpg
It just looks that way, and looks can be deceiving. All betting is done in terms of contracts that each pay out $10 to the winner when they are settled. The 43 means (absurdly) that it will cost a bettor $4.30 to buy a $10 “contract” affirming the truth of the contract’s wording. If he wants to buy 10 contracts, it will cost him $43, if he wants five it’ll be $21.50, etc. Hence a contract selling for 43 is offering odds of 43%. (IMO Intrade should not have employed such a confusing arrangement; it took me quite a bit of betting there for me to wrap my head around their way of doing things.)
See above.
(Here’s more detail, which I skipped because I just wanted to indicate approximately what the odds are without an extraneous tangent. The 43 means only that the “last” trade occurred at that price. At any moment there are actually two prices, a lower (bid) price that you can sell at and a higher (ask) price that you can buy at, as on the stock market. Or you can place a bid or make an offer yourself in between the two, and hope someone will make a contract with you later.)
PS: You can actually make a bid or offer at any price, in hopes that the odds will move in that direction and you’ll “catch a bid.” This is one of the “pluses” of Intrade — you don’t have only a take-it-or-leave-it choice about the odds. You can specify the odds you like and hope someone eventually will agree to bet with you at that level.
http://climateinsiders.files.wordpress.com/2010/06/piomas.png?w=510&h=371
I really do detest Anomaly taxation without Data representation.
Anomaly study may be great for calculating a slope, but it doesn’t do anything for expressing the significance of said slope.
I’m sure someone could come up with a PIOTSI Anomaly map looking equally scary.
Roger Knights says:
June 16, 2010 at 9:53 pm
It remains a tortuous way of creating 43% and the illusion of general consensus based on the betting of a few people. Hardly a piece in the bigger picture.
Anu
You appear to be getting really desperate.
stevengoddard says:
June 16, 2010 at 8:37 pm
CO2
I can’t be responsible for whatever is going on inside your head.
——————–
I do not seek responsibility; the difficult I do straight away, the impossible just takes a little longer. Why disclaim responsibility for something you have no control over to begin with. As it is I am quite comfortable with my thought processes though. However I do recognise a diversion when I see it.
Smokey says:
June 16, 2010 at 8:10 pm
“All vanished after independent replication? Downgraded from a hypothesis to unsupported conjecture? Pseudo scientific opinion?”
Yep.
——————–
Care to cite all the independent replications? Who did the downgrading from one supposition to another? Read this blog and others like it, then give me a definition of ‘pseudo scientific opinion’. Perhaps using ‘lay-person’s scientific opinion’ may be better? Generalisations seldom serve a purpose.
What’s the significance of 6 November? Random or selective? Look at http://igloo.atmos.uiuc.edu/cgi-bin/test/print.sh?fm=09&fd=16&fy=1980&sm=09&sd=16&sy=2009.
While there look at the 1980 – 2007 comparison. Not a healthy look at all.
For a sobering look at sea ice extent visit COI (Centre for Ocean and Ice Denmark ) http://ocean.dmi.dk/arctic/icecover.uk.php
Using data from OSISAF and counting 30% cover as continuous ice, they calculate the extent now (June 16) to be 7.8 million km2 and the minimum of 2007 at 3.5 million km2
Agreed. Intrade’s notation system is Byzantine.
Creating such an impression was not my intention; nevertheless, I’d say that money-backed opinions carry more weight than mouth-backed opinions.
That’s why I’m trying to rustle up more bettors — to obtain a weightier “gauge” of seriously held opinion on the topic.
Yes and no. Although betting-markets are often “thin,” Intrade’s bettors are collectively quite shrewd: they are well known for having often “called” the outcome of many events better than the punditry’s consensus, especially on election results. (A recent example is their refusal to give much credence to the proposition that any country would leave the eurozone, which several stock-market-opinionators were claiming was inevitable.) However, when I post a number like 43%, I don’t really think it carries much authority. Odds can often get quite detached from reality.
I have other goals in mind. For instance, I’d like to post the odds in the next two weeks, four weeks, etc., in order to indicate the direction in which bettor-opinion is trending, which is a matter of some interest. I also want to cool down the heatedness of conflict here by encouraging combatants to “take it outside” by betting against each other over there.
Halfwise, Codetech,
So you cannot find any scientific papers supporting this hypothesis of yours of a majority of climate scientists declaring an imminent ice age in the ’70s.
I’ll thus provide a summary of what the facts are:
1) There was no ice age predicted by science in the ’70s.
2) Popular media took a couple of comments from a few scientists and wildly exaggerated them to sell papers.
You have so far provided no refutation of these facts. Arm waving and derogatory remarks about revisionism aren’t facts. A list of scientific papers predicting an ice age in the ’70s would be fact. Google Scholar is but two clicks away. Have at it.
On the St. Roch: yes, I didn’t want to imply it didn’t cross in one season (once), I know it did. What I was saying is that it wasn’t an average ship, it was reinforced to cross through a partially iced arctic, breaking through if necessary. The ships that crossed in the 2000s were commercial ships. Big difference.
From: stevengoddard on June 15, 2010 at 10:38 am
I want to know where he found a captain of an icebreaker willing to plow right through 14 meter thick ice with a vessel normally capable of laboriously breaking up just over a meter thick ice. Didn’t they expect any tough spots, at all? Maybe someone was getting a bit heady from their daily ration of grog. 😉
Hypnos says:
June 17, 2010 at 1:39 am
On the St. Roch: yes, I didn’t want to imply it didn’t cross in one season (once), I know it did. What I was saying is that it wasn’t an average ship, it was reinforced to cross through a partially iced arctic, breaking through if necessary.
During its first crossing the St Roch had to overwinter and at one point had to dynamite its way out of the ice
The ships that crossed in the 2000s were commercial ships. Big difference.
And recently by several yachts each year, like this one: http://www.sail-world.com/photos/Alt_Berrimilla_heads_south.jpg
“Berrimilla is the first yacht to circumnavigate the world under sail via the North West Passage and the first to circumnavigate via both Cape Horn and the North-West Passage – opposite ends of the Americas.”
stevengoddard says:
June 16, 2010 at 10:53 pm
Anu
You appear to be getting really desperate.
“Desperate” is a good word for you to be using:
http://ocean.dmi.dk/arctic/icecover.uk.php
I’ll be back in late September to gloat.
Keep those amusing quotes coming – the Internet doesn’t forget.
Yup, we have confirmation from the esteemed Dr. William Connolley, PhD Climatology:
“Was an imminent Ice Age predicted in the ’70’s? No”
*cough*
This is confirmed by the authoritative Wikipedia Global cooling article, which rather than be some dry factual article providing a scientific description of possible actual cooling of the globe and its possible effects, is wisely instead a long thought-out historical treatise about global cooling myths and hysteria and the debunking thereof, since global cooling can absolutely never ever occur, and it will especially absolutely never ever occur without serious reductions of atmospheric CO2 concentrations to below pre-industrialization levels.
And of course Wikipedia is well known for its absolute unquestionable authority, absolutely especially on matters related in any way to climate. For example:
Compare that to this line from “Invasion of Kuwait”:
Thus it is established as absolute unquestionable fact that Kuwait was known for massive oil well fires in the 1980’s, said knowing leading to a prediction of significant effects on climate, before the invasion by Iraq and Iraq’s subsequent expulsion during the Gulf War.
CO2 says:
June 16, 2010 at 11:17 pm:
“Care to cite all the independent replications? Who did the downgrading from one supposition to another? Read this blog and others like it, then give me a definition of ‘pseudo scientific opinion’. Perhaps using ‘lay-person’s scientific opinion’ may be better? Generalisations seldom serve a purpose.”
OK, one by one: Care to cite all the independent replications?
My point went over your head: there are no independent replications of the CO2=CAGW conjecture. It is not testable, therefore it is not science. Read Popper if you think that statement is incorrect: “… the criterion of the scientific status of a theory is its falsifiability, or refutability, or testability.”
Who did the downgrading from one supposition to another?
I and others downgraded CO2=CAGW from a hypothesis to a conjecture, which is what it is, by definition. And we pointed it out many moons ago, and repeatedly, not just in this thread. You’re new here, but you can check the archives. Absent falsifiability, refutability, or testability, CO2=CAGW is nothing but a non-scientific scare tactic.
Read this blog and others like it, then give me a definition of ‘pseudo scientific opinion’.
OK. For examples of pseudo-scientific opinion, I give you: RealClimate, DeSmogBlog, climate progress, tamino, etc. And any other source that still believes the repeatedly debunked idea that a tiny trace gas controls the Earth’s climate, and will bring about runaway global warming and climate catastrophe. The real world disagrees; who are you going to believe?
Perhaps using ‘lay-person’s scientific opinion’ may be better?
Perhaps — if the lay person’s opinion is independent, and not bought and paid for by organizations with a CAGW agenda. If you haven’t noticed, climate science has been corrupted by money.
Generalisations seldom serve a purpose.
Wrong. People routinely generalize, you do it too, therefore it serves a purpose. QED.
I’ve answered your questions. Now please answer just one of mine: what’s your favorite alarmist blog? You know, the one you came here from?
Anu,
My guess is that you will be gone in September, because you are too embarrassed.
Enviroment Canada paints a rather worrying picture of arctic sea ice in their 30 day forecasts.
http://ice-glaces.ec.gc.ca/app/WsvPrdCanQry.cfm?subID=2008&Lang=eng
For (hopefully) the last time, the region north of 80N is only about 20% of the Arctic and the DMI polar temp. is not the average temperature of the Arctic! Why don’t you use NCEP/NCAR instead, as you can see the anomalies everywhere. I’m beginning to suspect cherry picking because NCEP/NCAR shows the first 15 days of June being warmer than normal over almost the entire Arctic, with one major exception being the immediate vicinity of the pole. The NCEP/NCAR plot shows that the period from June 8-15 averages above +1 C over most of the Arctic Ocean (but again not the immediate vicinity of the pole which is what DMI sees.)
http://www.esrl.noaa.gov/psd/cgi-bin/data/composites/comp.day.pl?var=Air+Temperature&level=Surface&iy%5B1%5D=&im%5B1%5D=&id%5B1%5D=&iy%5B2%5D=&im%5B2%5D=&id%5B2%5D=&iy%5B3%5D=&im%5B3%5D=&id%5B3%5D=&iy%5B4%5D=&im%5B4%5D=&id%5B4%5D=&iy%5B5%5D=&im%5B5%5D=&id%5B5%5D=&iy%5B6%5D=&im%5B6%5D=&id%5B6%5D=&iy%5B7%5D=&im%5B7%5D=&id%5B7%5D=&iy%5B8%5D=&im%5B8%5D=&id%5B8%5D=&iy%5B9%5D=&im%5B9%5D=&id%5B9%5D=&iy%5B10%5D=&im%5B10%5D=&id%5B10%5D=&iy%5B11%5D=&im%5B11%5D=&id%5B11%5D=&iy%5B12%5D=&im%5B12%5D=&id%5B12%5D=&iy%5B13%5D=&im%5B13%5D=&id%5B13%5D=&iy%5B14%5D=&im%5B14%5D=&id%5B14%5D=&iy%5B15%5D=&im%5B15%5D=&id%5B15%5D=&iy%5B16%5D=&im%5B16%5D=&id%5B16%5D=&iy%5B17%5D=&im%5B17%5D=&id%5B17%5D=&iy%5B18%5D=&im%5B18%5D=&id%5B18%5D=&iy%5B19%5D=&im%5B19%5D=&id%5B19%5D=&iy%5B20%5D=&im%5B20%5D=&id%5B20%5D=&monr1=6&dayr1=8&monr2=6&dayr2=15&iyr%5B1%5D=2010&filenamein=&plotlabel=&lag=0&labelc=Color&labels=Shaded&type=1&scale=&label=0&cint=1&lowr=-3&highr=3&istate=0&proj=Custom&xlat1=55&xlat2=90&xlon1=0&xlon2=360&custproj=Northern+Hemisphere+Polar+Stereographic&level1=1000mb&level2=10mb&Submit=Create+Plot
The areas below +1 C over that period are a small area near the New Siberian Islands, the Barents Sea, east of Greenland, and a large area of the Arctic Basin which remained ice-covered even in 2007. The vast majority of the area of the “bite” out of the ice pack in 2007 has been above freezing for the last week.
Nightvid Cole,
You talk about “cherry picking,” then you only post an Arctic reference.
FYI, most of the Antarctic is getting more ice cover. That’s why global ice cover is increasing.
See? No more cherry picking only one hemisphere, please. You have to include the Antarctic.
Smokey says:
June 17, 2010 at 5:22 pm
Nightvid Cole,
You talk about “cherry picking,” then you only post an Arctic reference.
The title of this thread is: WUWT Arctic Sea Ice News #9
Anthony has said before that he doesn’t want these threads going OT on the Antarctic so ~SNIP~
Ok, take the Antarctic
http://www.esrl.noaa.gov/psd/cgi-bin/data/composites/comp.day.pl?var=Air+Temperature&level=Surface&iy%5B1%5D=&im%5B1%5D=&id%5B1%5D=&iy%5B2%5D=&im%5B2%5D=&id%5B2%5D=&iy%5B3%5D=&im%5B3%5D=&id%5B3%5D=&iy%5B4%5D=&im%5B4%5D=&id%5B4%5D=&iy%5B5%5D=&im%5B5%5D=&id%5B5%5D=&iy%5B6%5D=&im%5B6%5D=&id%5B6%5D=&iy%5B7%5D=&im%5B7%5D=&id%5B7%5D=&iy%5B8%5D=&im%5B8%5D=&id%5B8%5D=&iy%5B9%5D=&im%5B9%5D=&id%5B9%5D=&iy%5B10%5D=&im%5B10%5D=&id%5B10%5D=&iy%5B11%5D=&im%5B11%5D=&id%5B11%5D=&iy%5B12%5D=&im%5B12%5D=&id%5B12%5D=&iy%5B13%5D=&im%5B13%5D=&id%5B13%5D=&iy%5B14%5D=&im%5B14%5D=&id%5B14%5D=&iy%5B15%5D=&im%5B15%5D=&id%5B15%5D=&iy%5B16%5D=&im%5B16%5D=&id%5B16%5D=&iy%5B17%5D=&im%5B17%5D=&id%5B17%5D=&iy%5B18%5D=&im%5B18%5D=&id%5B18%5D=&iy%5B19%5D=&im%5B19%5D=&id%5B19%5D=&iy%5B20%5D=&im%5B20%5D=&id%5B20%5D=&monr1=6&dayr1=8&monr2=6&dayr2=15&iyr%5B1%5D=2010&filenamein=&plotlabel=&lag=0&labelc=Color&labels=Shaded&type=1&scale=&label=0&cint=&lowr=&highr=&istate=0&proj=Custom&xlat1=-90&xlat2=-55&xlon1=0&xlon2=360&custproj=Southern+Hemisphere+Polar+Stereographic&level1=1000mb&level2=10mb&Submit=Create+Plot
Smokey writes,
“You have to include the Antarctic.”
Sea ice around Antarctica is fine for now, the ice sheets not so much. From Geophysical Research Letters last fall:
“Increasing rates of ice mass loss from the Greenland and Antarctic ice sheets revealed by GRACE
I. Velicogna,
Department of Earth System Science, University of California, Irvine, California, USA
Jet Propulsion Laboratory, California Institute of Technology, Pasadena, California, USA
We use monthly measurements of time-variable gravity from the GRACE (Gravity Recovery and Climate Experiment) satellite gravity mission to determine the ice mass-loss for the Greenland and Antarctic Ice Sheets during the period between April 2002 and February 2009. We find that during this time period the mass loss of the ice sheets is not a constant, but accelerating with time, i.e., that the GRACE observations are better represented by a quadratic trend than by a linear one, implying that the ice sheets contribution to sea level becomes larger with time. In Greenland, the mass loss increased from 137 Gt/yr in 2002–2003 to 286 Gt/yr in 2007–2009, i.e., an acceleration of −30 ± 11 Gt/yr2 in 2002–2009. In Antarctica the mass loss increased from 104 Gt/yr in 2002–2006 to 246 Gt/yr in 2006–2009, i.e., an acceleration of −26 ± 14 Gt/yr2 in 2002–2009. The observed acceleration in ice sheet mass loss helps reconcile GRACE ice mass estimates obtained for different time periods. ”
http://www.agu.org/pubs/crossref/2009/2009GL040222.shtml
Nightvid Cole,
Ooh. I see. Scary bright red. Which, if you look closely, means freezing.
Anyway, since there’s been sniveling about the Antarctic, here is a paper on the Arctic.
Well, Smokey, at least we can be pretty sure the sea ice in the Antarctic will pretty much all melt away, as it does each year. http://arctic.atmos.uiuc.edu/cryosphere/IMAGES/seaice.recent.antarctic.png
Yawn
The Legend of Nightvid Cole is on Facebook
Dang, you’d think someone that smart would know how to do a short “href” HTML link, or could at least have stopped at http://tinyurl.com/ first. 😉
The Arctic one: http://tinyurl.com/29c4bth
The Antarctic one: http://tinyurl.com/2ufuj9b
Wow, the surface air temperatures in central Antarctica are down to -60° C and below. Someone better double-check with Hansen to make sure that’s included in the GISS global average temperature.
The Arctic surface air temperatures map is also cute. Just look at how cold Greenland is, so much deep-frozen glacial ice it just yanks down the air temps. It’ll be a shame when that all melts away and the Arctic area loses its main reservoir of cold in the summer. Surely the Arctic will be free of sea ice in summer after that happens!
Roger Knights says:
June 17, 2010 at 1:20 am
Perhaps it is better to keep betting out. Some may be shrewd but still subject to the law of averages. Good try though, the 43% that is, but it’s bound to muddy the waters for some. If that was the purpose, yes it works for some.
Smokey says:
June 17, 2010 at 5:22 pm
Nightvid Cole,
You talk about “cherry picking,” then you only post an Arctic reference.
————————
Don’t use the Antarctic as a diversion or excuse. In all aspects they are poles apart. The Arctic Ocean is surrounded by land, the Antarctic by oceans. The dynamics are different. If you want to discuss Antarctica call for a thread, avoiding references or comparisons with to the arctic; any direct relationship is tenuous and they are not sharing ice.
Smokey says:
June 17, 2010 at 5:39 am
CO2 says:
June 16, 2010 at 11:17 pm:
If independent replications were not possible, then what is the basis for the vanishing?
You said; “I and others downgraded CO2=CAGW from a hypothesis to a conjecture, which is what it is, by definition. And we pointed it out many moons ago, and repeatedly, not just in this thread. You’re new here, but you can check the archives. Absent falsifiability, refutability, or testability, CO2=CAGW is nothing but a non-scientific scare tactic.”
As for commenting, yes I’m new but I read a number of blogs from both sides of the argument. So you and others downgraded the hypothesis, so what makes that valid?
On pseudo science you said; “OK. For examples of pseudo-scientific opinion, I give you: RealClimate, DeSmogBlog, climate progress, tamino, etc. And any other source that still believes the repeatedly debunked idea that a tiny trace gas controls the Earth’s climate, and will bring about runaway global warming and climate catastrophe. The real world disagrees; who are you going to believe?
That’s not telling me what you understand pseudu science is. You state that all those opposing your view offer pseudo science, regardless of whether they are scientists or not. I am not about to start debating CO2 ‘the tiny trace gas’ with you, I don’t believe in preaching to the converted. If this is what you believe, no one is going to change your mind. Not even Mother Nature because whatever happens, it will all have happened before; if not hundreds, then thousands of years ago and failing that millions of years ago.
Then you say; “Perhaps — if the lay person’s opinion is independent, and not bought and paid for by organizations with a CAGW agenda. If you haven’t noticed, climate science has been corrupted by money.”
Does that apply to both sides of the argument?
Your final question;
“I’ve answered your questions. Now please answer just one of mine: what’s your favorite alarmist blog? You know, the one you came here from?”
In fact, until recently I have not commented on any blog whatsoever. I read a lot of scientific papers from both sides of the argument. I am saddened by the fact that science has become politicized and disturbed by allegations of a global conspiracy. I ask myself if someone like Lord Christopher Moncton has reached the point of emberrassment for even the global skeptics. His recent diatribe about arctic sea ice almost made me blush.
This writing which you cite by Tim Ball (who is known for using repeatedly re-debunked climate ~SNIP~ myths such as the claim that the lag of CO2 behind temperature in ice core data somehow falsifies AGW theory) is not a scientific writing. It is published in a policy context, not a scientific journal.
CO2:
I just knew you would dodge my one and only question.
NC:
As I explained along with a solid reference, AGW is not a “theory,” and CO2=CAGW — the real debate — is nothing but an unsupportable conjecture designed to wring more money out of taxpayers by using false alarmism. Words matter, and mis-using words is typical of the warmist crowd.
And by all means, let us know when you’ve learned as much as Dr Tim Ball.
K? Thx bye.