By Steve Goddard

JAXA shows the area immediately west of Barrow, Alaska as ice free. And it appears to be melting away from the shore.
The animation below shows the month of May so far.
This apparent melt surprised me, because the University of Alaska reports sea ice at Barrow 4-1/2 feet thick and topped by another foot of snow. The ice has thickened six inches during the past month and about 18 inches since the start of the year.


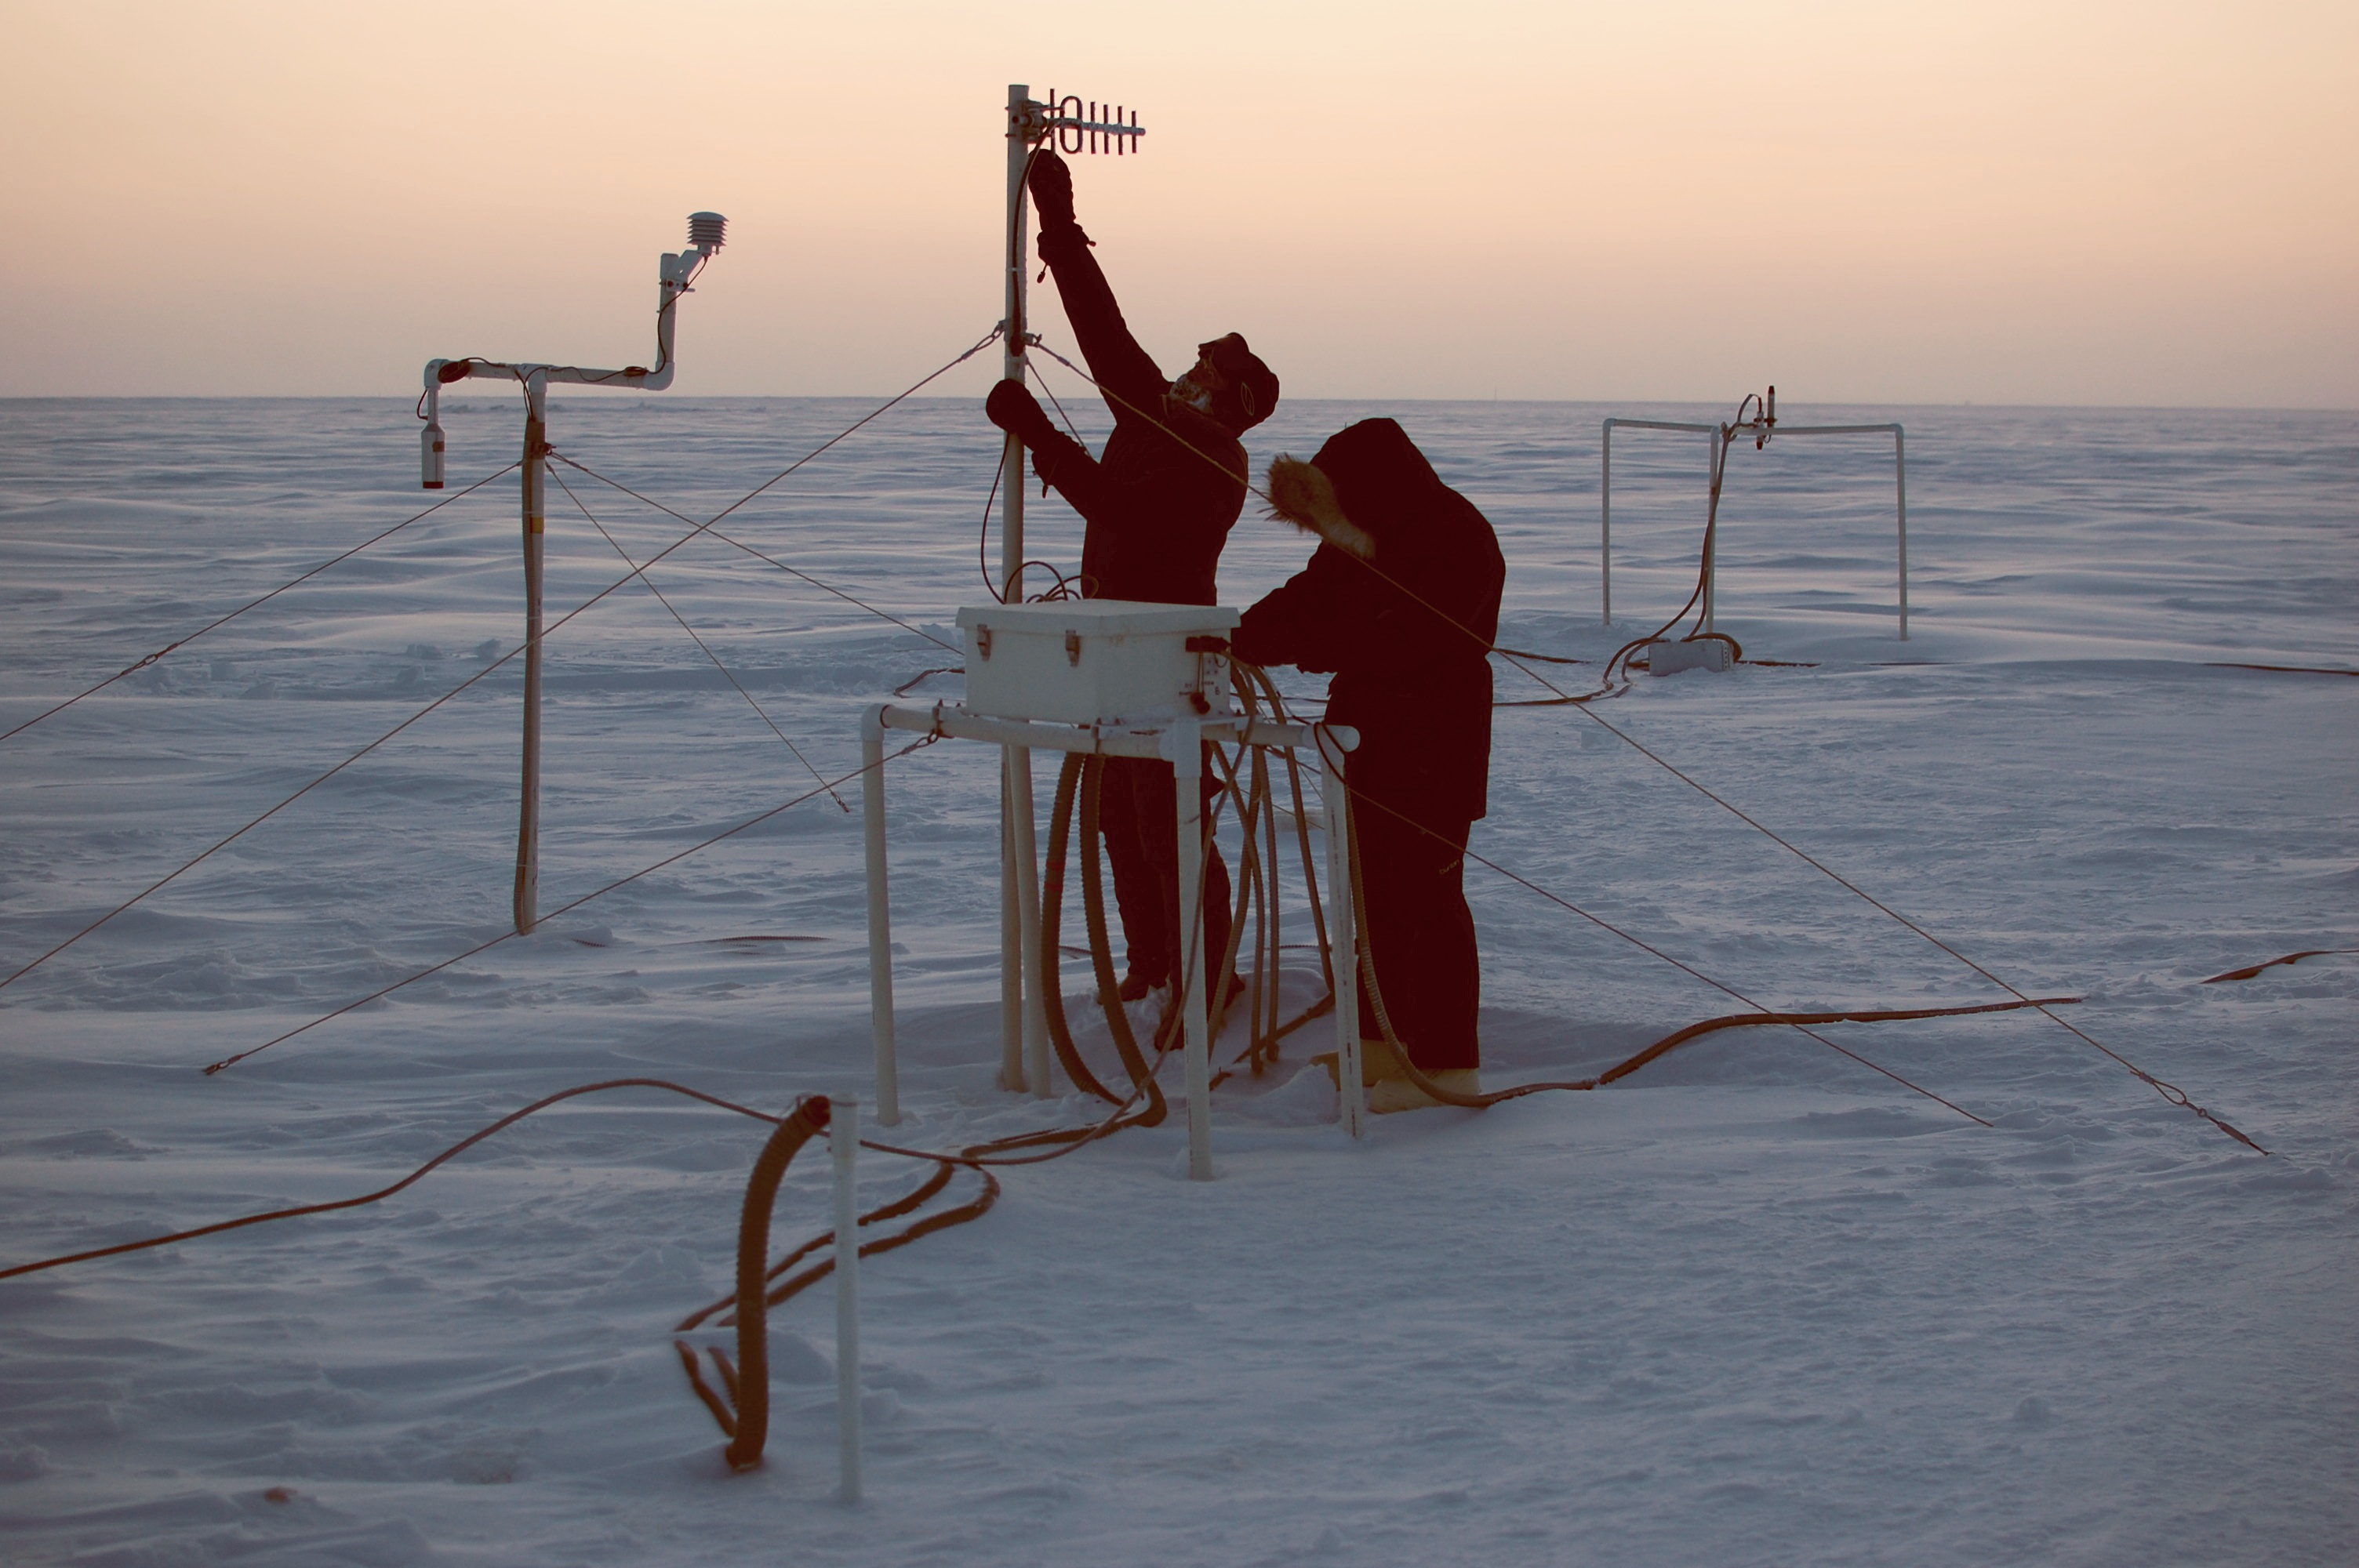
The sensor is located immediately offshore of Barrow, as seen below.

Below is the current view of the ice from Barrow.

We have an apparent paradox. The ice has been steadily thickening all year, yet a big hole has appeared in the ice near Barrow. The hole can be easily seen in the enhanced NASA satellite image below.

What could be causing the hole? The edges of the ice are clean and it has been too cold all month to melt, so something else must be going on.
The video below of the entire Arctic makes it clear. There has been a clockwise circulation which is shearing the ice away from the land in at least four locations (outlined by blue squares.)
We have found the recent decline in the JAXA extent graph, and it isn’t primarily due to melt.

It’s worse than we thought…sorry couldn’t resist
It’s global warming, absolute proof, what else can it be, WAGTD!
Less sarcastically it’s interseting that the ice appears to be thickening despite this apparent clearing (not melting)of ice.
If we’re going along those lines, Eddie, perhaps someone should “hide the decline”! Now who could we get to do something like that?
Steve, maybe I’m a bit thick, but your points seem difficult to follow.
Why do you show the current photo of Barrow? Are you saying something is wrong with the satellite photographs? I think the photo shows a dark line near the horizon which could be an ice opening. But, again, what has this photo got to do with the apparent point of your article?
All you need to show is the animation of the entire arctic area in support of your hypothesis of a clockwise rotation. Or are you also saying that the AMSR-E graphs are inaccurate? If so, why did you place so much emphasis on the same graph back when the red worm was strong?
This is shear madness … couldn’t resist either.
But a death spiral is so much more interesting than mere wind or currents. Come on Mr. Goddard, you need to get with the program.
Is it similar to what NASA reported in 2007?
http://www.nasa.gov/vision/earth/lookingatearth/quikscat-20071001.html
http://wattsupwiththat.com/2007/10/03/nh-sea-ice-loss-its-the-wind-says-nasa/
Here you go again Steve…
First, you said:
“The video below of the entire Arctic makes it clear. There has been a clockwise circulation which is shearing the ice away from the land in at least four locations (outlined by blue squares.)”
RESPONSE: It’s called the Beaufort Gyre, and it’s a nearly constant feature of the Arctic ocean. Nothing new this year with that.
__________
Then you said: “We have found the recent decline in the JAXA extent graph, and it isn’t primarily due to melt.”
Seems that no matter what happens, AGW skeptics will try to find any OTHER reason for the ice to decline in the Arctic, other than the fact that the region has seen the bulk of global warming so far. And have you considered the fact that thinner ice, with lower volume will be more easily moved by the Beaufort Gyre? I remember no too many weeks back that you had reported (erroneously) that the sea ice off of Barrow was “at least 10 feet thick”. I of course quckly corrected you and first pointed out the fact that it was only a little over 4 feet thick. Now at least you’ve got that right, but please don’t try to make the clockwise circulation of ice in the Arctic anything new. It exists pretty much all the time, every year, so that pretty much every year the ice is subject to the same clockwise sheer forces…but thinner ice can be sheered away much more easily.
Now I can begin to see what your repsonse and other AGW skeptics may be if we see a summer sea ice minimum in the arctic that is below 2008 and 2009— you’ll claim that early melt season “sheering forces” tore the ice away, and that it had nothing to do with warming or climate change…all the while, completely ignoring all the other consequences of the obvious warming in the arctic, such as the melting of permafrost. Last time I checked, the Beaufort Gyre wasn’t able to melt permafrost.
For those interested, this graph shows the warmth the Arctic has seen over the past few months:
http://data.giss.nasa.gov/gistemp/graphs/
Though of course, we’ve already heard why the GISS data is not to be trusted…so I guess “sheering” forces must the reason. 🙂
REPLY: Seems that no matter what happens,, that AGW alarmists will ignore any other possibility than CO2 as a cause. – A 🙂
Two days ago, on my plane trip from Minneapolis to Narita/Tokyo (then to Manila), the plane’s route is south Alaska including Anchorage. I saw thick snow on the mountains and glaciers east of Anchorage. At least 1 1/2 hrs of the plane ride above Canada and Alaska, sights of snowy mountains. After Anchorage, a lake, then lowlands, and then the snowy mountains are back. I thought that if south Alaska has wide snow cover, then north of Alaska should have wider and thicker snow cover. The sea west of south Alaska, is it Bering Sea, has lots of floating ice. Further north of that area, the sea ice are more compact. So I doubt that it’s correct to say “less/declining ice extent” up there.
It’s the rotation of the earth and the curvature of the land northward that is east of Barrow is blocking the movement of the ice. There must be a huge shove of ice at the location where the ice is jamming. Anyone living up there and can take pictures?
Thanks for the videos that makes it easy to see! And thanks for the explanation that’s makes it easy to understand. 🙂
See the current Barrow Sea Ice Radar imagery here:
http://seaice.alaska.edu/gi/observatories/barrow_radar
There is some cool stuff on this site.
It appears to me to be new, clear ice, forming at lands edge due to wind driven leads opening along the shore line as the, snow covered, pack moves away. In some areas the wind blown snow is covering the new ice. The ice measuring station, originally at the ice edge, has moved out as the ice is moved.
R. Gates says:
May 27, 2010 at 7:08 am
gosh R Gates, why are you so long winded all the time?
There is not ‘warmth’ in the Arctic. You call it warmth and then provide a temperature anomaly map that you think proves it. But the anomaly map is just showing there’s above average temperatures. Which means, for example, instead of being -25F it’s -22F. And you call that warmth.
You don’t know what you are doing R Gates. And I appreciate that you talk a lot so that everyone can see that you don’t.
Meanwhile south of the Mason Dixon line, and the equator, winter is setting in. It appears the Antarctic is growing above norm: http://arctic.atmos.uiuc.edu/cryosphere/IMAGES/seaice.recent.antarctic.png
As to the Arctic, give it a rest on all sides. There is more we don’t know that we do know. Currents, wind, tides, rotations, etc. Harping on a single factor is rather misleading.
Anthony said:
“REPLY: Seems that no matter what happens,, that AGW alarmists will ignore any other possibility than CO2 as a cause. – A :)”
______________
Touche’ — except I really hate being called an “alarmist”, that indicates something far different that simply studying whether or not CO2 is causing climate change, inferring that the change might be catastrophic, etc. I currently am far more interested in what is happening and why, then the impacts of that, and I think you be hard pressed to find postings on this site where I’ve raised “alarmist” kinds of issues.
Amino Acids in Meteorites says:
“You don’t know what you are doing R Gates…”
_______________
That well may be the case…or may not be. But I posit a question here: If I’m right, and the summer sea ice minimum is this year turns out less than 2008 or 2009, and not more, as Steve has said he believes will happen, then what? I suspect that your AGW skeptical nature will find other reasons why I just happened to be right, such as “sheer” forces or wind or who knows what else. I was ridiculed yestereday for example for pointing out that waves change the albedo of ocean water, especially for low sun angles, until I had to dig up all the research to prove my point.
I may well not know what I am doing, but I think I know a bit more about the Arctic then given credit…:)
Mike Jowsey wrote May 27, 2010 at 6:53 am:
Why do you show the current photo of Barrow? Are you saying something is wrong with the satellite photographs? I think the photo shows a dark line near the horizon which could be an ice opening. But, again, what has this photo got to do with the apparent point of your article?
Here’s a stab at it –
The Barrow photo appears to support the claim that it is still very cold and area ice has been increasing in thickness. So, if is cold enough to make area Ice increase thickness, what caused the gap between the land South and West of Barrow and the arctic ice mass? His observations point toward the shear forces, rather than to warming induced melting. He’s just covering the bases, by providing various forms of information to support the conditions at this time. I find his approach to be very helpful. Hopefully these comments are pretty close and address your question.
In my opinion, too much is focused on the ice and not enough on the water under this ice, nor the wind and water currents.
As a harbor master in the lesser 48 for the best part of a decade, we most often had the fresh water lake frozen over.
The BP oil spill in the Gulf is having a devistating effect on the Arctic. We simply must take them to the World Court and sue their pants off. Who needs Big Oil anyway? After all what have they ever done for us? It’s a crying shame that Alaska has a Gopper for Governator, and Canada has a Conservative PM, but at least we can give trillions in compensation to Russia and Northern Europe. Right?
Since BP is a “British” firm, we really take the GB to court and make the paupers too. Left?
______________________
For more charts:
http://www7320.nrlssc.navy.mil/pips2/index.html
Steve, in the MODIS imagery you can see fast ice attached to the shore near Barrow, even Elson Lagoon appears to still be ice covered. The camera image you show in your post also shows open water beyond the fast ice still attached to the shore. Thus, your post is very misleading and conclusions reached do not follow from the figures you chose to display.
R. Gates is correct, the Beaufort Gyre is always present, but for thinner ice, the ice moves more easily. It would probably have been good to include in your post the SLP fields as you can see a very well-developed Beaufort Sea High. And then it would have been good to discuss the implications of a strong Beaufort Sea High. It doesn’t surprise me at all to see the ice being pushed away from the shores of Barrow by the Gyre, especially given how thin that ice is.
I’m also curious why you wouldn’t bother actually addressing the decline that according to the latest AMSR-E data shows it has now become the lowest extent on record for this time of year. Seems you want to hide the decline.
I think it’s important to remember that there are so many processes at work, many of them linked, so it’s not that easy to separate them out. Changes in atmospheric circulation are a consequence of changes in energy balance, so it’s a bit of a chicken-and-egg issue. Thus, saying it’s all wind w/o understanding that wind changes may also be a result of warming, is just plain wrong. Just as it would be incorrect to say all the changes in the ice cover are a result of warming.
R. Gates
If it turns out that my forecast for summer ice is incorrect, I’m sure you will let me know. That judgment date is still 3-1/2 months off, so why speculate now?
The Naval Ice center has alot of information about the state of the Arctic sea ice. For other “Ice Watchers”, here is an article about the PIPS model used for short term forecasts.
http://www.tos.org/oceanography/issues/issue_archive/issue_pdfs/15_1/15_1_preller_et_al.pdf
An interesting read.
The curent PIPS 2.0 model forecasts are available at,
http://www7320.nrlssc.navy.mil/pips2/ithi.html
This includes concentration, movement and thickness data; both current and archives from prior years. I find comparisons of the 2007, 2008, 2009 and 2010 data for the same date interesting. The current thickness for 2010 depicts a substantially greater average thickness across the entire arctic basin than is shown for 2009. It certainly doesn’t look like the ice volume model estimate that are referenced here by the AGW fans.
The model includes the current movement vectors and illustrates how the Beuafort Gyre changes and how movement toward the Fram Strait is an on-again-off-again dynamic.
It’s an interesting site to click around to see a different set of ice data.
The post by Henry chance @ May 27, 2010 at 7:36 am may be the best reflection in a response. The sharp edges reflect a tearing effect. Hydraulic lifting of the ice?
Plate movement, volcanic activity, collision of sub-surface currents?
All this weather and climate talk is a debate in vacuum. The best we can hope for in understanding long term trends and application thereof is how it affects us, not how we affect it. Most of us are along for the ride and filling dead time…
Its obvious.
God put his/her finger on the ice to prevent rotation, while the Earth and water continued to spin underneath, causing the differential motion.
Well, that is according to the Gospel of Gore in the New Warmist Testament, anyway (King James version).
My employer was involved in a lawsuit awhile back. The opposing lawyers had our expert witnesses disqualified and then claimed we offered no expert testimony.
And so it goes with AGW. Put forth any evidence that CO2 is not the primary cause of the Arctic icepack melting and the warmers dismiss it out of hand. Then they claim there is no evidence which contradicts AGW orthodoxy, so it must be caused by CO2.
jeff brown says:
“R. Gates is correct, the Beaufort Gyre is always present, but for thinner ice, the ice moves more easily.”
Let’s think about that for a moment …OK, time’s up. Bogus statement.
A big iceberg moves along as fast as a small iceberg in the current. Otherwise, all the little icebergs would be out in front.
I’m not sure that I would call 4-1/2 foot thick ice “thin.”
R. Gates:
The temperature anomalies in the graphs on the link you posted are of the order of less than 1 degree celcius. What is the current temperature in that place?
How important a factor is a small rise in temperate, at those low temperatures, compared to other factors that can cause ice extent to decrease, such as humidity, wind, and of course the gyre?
Sure, those other factors may (or may not, who knows) have changed due to human activities, but is warming by itself the most important direct factor in creating that hole?
jeff brown
Your criticisms sound like a bunch of meaningless words. Please explain more coherently.
stevengoddard says:
May 27, 2010 at 7:48 am
R. Gates
If it turns out that my forecast for summer ice is incorrect, I’m sure you will let me know. That judgment date is still 3-1/2 months off, so why speculate now?
________________
If models don’t help us speculate, what good are they? Not only are there models for what arctic sea ice will be doing in the longer term, there are models that can accurately predict human attitudes based on a matrix of factors.
R. Gates.
Warming may or may not have something to do with changing currents in the Arctic.
CO2 levels may or may not have much of anything to do with the observed “warming”.
SMokey, once again you don’t seem to understand basic Physics. The internal stressors change as a function of ice thickness. Thin ice ridges and rafts more easily than thick ice. Also, ice bergs are not the same thing as sea ice, I hope you understand where each originates from.
And Steve, while there may be some local thick ice attached to the shores of Barrow, that doesn’t mean the ice isn’t thin elsewhere. There was transport of old ice into the region from the negative AO, so I would expect local variations. But I would expect that the overall warmer winter temperatures all winter in the Arctic impacted on ice growth rates throughout the Arctic Basin.
R. Gates: May 27, 2010 at 7:33 am
I was ridiculed yestereday for example for pointing out that waves change the albedo of ocean water, especially for low sun angles, until I had to dig up all the research to prove my point.
You might want to re-check that — see below.
Steve Keohane: May 27, 2010 at 7:30 am
Interesting, not relevant here though. Your first link only allows for SUB-arctic atmospheric modeling. The second proves there is little to no change wrt wind/waves and albedo. Results below for a 45° angle of incidence:
Wind Speed (MPH) Albedo
1 .037
2 .036
3 .036
4 .036
8 .036
16 .037
32 .037
There doesn’t appear to be much difference, no matter how hard the wind is blowing the waves around.
@ R. Gates,
I think what our friends are saying, it isn’t melt. Go here, (http://www.wunderground.com/history/airport/PABR/2010/5/27/MonthlyHistory.html#calendar ) for the temps for Barrow this month. As you can see, the temps show what ever is occurring, one can’t call it melt. At least, not from the top. There are other means for ice to dissipate other than melt, it is easily witnessed in north Alaska. Yes, I know salt water freezes at a lower temp, for those who are curious, Ocean water with a typical salinity of 35 parts per thousand freezes at −1.8°C (28.9°F). Still, it didn’t reach 30 deg. F. until the 22nd of May. Personally, I believe the underwater currents combined with volcanic activity underneath the Arctic is what we’re observing, but I’ve no way to prove it. Another personal opinion, I think both sides of the AGW hypothesis puts way too much emphasis on the ice coverage of the Arctic. Given what I’ve shown, (the temps not being warm enough to melt sea ice) it seems likely, (to me anyway) that we’re observing a completely different phenomenon from any hypothetical CO2 induced heating. Further, while many people fear some ecological shutdown if the ice does melt, I haven’t seen any evidence of that assertion. But then, in my perspective, that’s the whole reason for the discussion. It isn’t whether we’re getting warmer or not, it is whether warmer is detrimental to the human condition or not. Well, some people worry about polar bears, and I do too, but only as they relate to human well being.
On a smaller scale, I have been out on Lake Erie when the wind has picked up out of the south and broken off huge sections of ice and sent them to Canada, much to the dismay of the ice fishermen on the lake at that time. In that case wind, alone, was the cause. Happens quite frequently when the lake is not completely frozen over.
R. Gates
Suppose I am correct and the models are wrong? I will expect mea culpa. ;^)
Dear Mr Defense Minister R. Gates, the Arctic is just – normal. It is even colder than in 40ties.
http://climexp.knmi.nl/data/icrutem3_hadsst2_0-360E_70-90N_na.png
Despite all flaws in HadCRUT, I will take it over GISTEMP with its mad creator any day.
Smokey says:
(…)
A big iceberg moves along as fast as a small iceberg in the current. Otherwise, all the little icebergs would be out in front.
————-Reply:
Well, they are. The smallest ones are found the farthest south, just before they melt completely. 😉
Can’t resist.
Smokey:
“A big iceberg moves along as fast as a small iceberg in the current. Otherwise, all the little icebergs would be out in front.”
R Gates is not making a bogus statement, neither are you. However, lets keep the snips to a minimum. The point should be this: Thin ice is more susceptible to wind forces. However, once the ice succumbs to the wind it doesn’t matter if it is thick or thin it is going to move until something stops it. Hence, if the ice at Barrow is a bit thinner, it will break free easier. Once free it is going to move whatever distance until it hits shore, wind eases or the ice bunches up into existing ice.
R Gates:
2007 left the Arctic with less ice. However, wind pushed ice, thick or thin, is not melting, it is bunching up. So that 4′ ice is now piled on top of other ice, making for thicker and therefor slower melting ice.
To support my point, a little, look at the ocean.dmi.dk site. It indicates that Arctic Temperatures are right at normal values at the moment. There is no special melting, or any special warming/cooling going on. So, big breaks in the ice doesn’t support anyones pet theories, AGW pro, against, agnostic or otherwise.
However, Thanks R Gates. Keep it up.
@James,
I wonder if the atmospheric temperature really needs to reach the salt water melting point before there is melting of the ice. As was stated yesterday, currents bring warmer water to the arctic and the ice acts as an insulator. I’m imagining water below too warm for sea ice, a layer of insulating sea ice, and air above too cold for sea water. The warmer the water below, the colder the air needs to be above to maintain ice. I’m no expert and would like someone who knows more to comment further.
A kind reminder that the models were wrong in 2007 🙂
R Gates “If I’m right, and the summer sea ice minimum is this year turns out less than 2008 or 2009, and not more, as Steve has said he believes will happen, then what?”
Then what? I guess we’ll know what we know today.
Sea ice extent fluctuates short term and long term.
What we don’t know now or will now then is if there is any connection to CO2 emissions and AGW.
But we’re stuck in an era of convenient presumptions by alarmists to establish, by suggestion and declaration, as many connections as possible where none exists.
Here in Oregon, academia and the press have reached comedic levels with their broadening suggestions.
“Your Nose Knows: Climate is Changing.”
http://www.oregonlive.com/environment/index.ssf/2010/05/post_14.html
The Beaufort Gyre is not a fixed phenomenon (anymore than any other aspect of the climate). See this site: http://www.whoi.edu/beaufortgyre/results_fwcdecadal.html
It appears the Gyre was stable from the 50’s through the 80’s, then shifted in the 90’s. Could this be yet another 30 year oscillation?
At any rate, I think it is safe to assume that the shearing effect of the BG could vary from year to year, and is at least as likely to be contributing to the current conformation of sea ice as is CO2.
This must be the begining of the Death Spiral.
Excerpt from the newest book by the world’s leading paleoclimatologist:
Climate: the Counter-consensus (Independent Minds)
by Professor Robert Carter
The time scales in which the oceans absorb, recirculate and re-emit heat are often much larger than is dreamt of in the Warmists’ philosophy.
“….Major time lags are built into the climate system such that a warming or cooling event that occurs today (say the Great Pacific Climate Shift in 1976/1977 which corresponded to a worldwide step increase in temperature of about 0.2 degrees C) may be reflecting a change in heat energy that was stored in the ocean hundreds of years ago…
Indeed, he says, some scientists suggest that the rise in atmospheric CO2 in the Twentieth Century may represent ocean outgassing caused as long ago as the Medieval Warm Period.”
I have been trying to say this all along, that the hunt for correlation and causality is befuddled by the long lag times due to the heat capacity of water, and the overwhelming weight of the oceans. Not just water, it is salt water. AGW fundamentalist scientists are pathetically backward where it comes to understanding these principles. Couple that with their lack of comprehension of basic statistical methods, and we have a train wreck.
I am having trouble seeing how CO2 is causing the arctic ice cap to rotate, but we know this must be the case.
My linear projections show that if the rotation is this fast now, that by 2035, the ice cap will be rotating so fast that all the polar bears will spin off into the water and drown, and the baby seals will be crushed as the ice caroms off the coastline.
Sell your SUV’s, kill your dogs, shut down the factories….disaster is imminent!
KW
The University of Alaska sensor shows that ice thickness is increasing. I’m surprised that anyone would try to argue that it is melting. A bit of cognitive dissonance, eh? ;^)
Norseman
“Death Spiral” – LOL
The only real fault with the post as written is the early use of the phrases
“And it appears to be melting away from the shore.”
and then “This apparent melt surprised me, . . .”
Unless someone else first brought up melting these phrases seem out-of-place, insofar as Steve G. then provides us evidence that he knew the ice was not melting.
The exchanges in the comments section suggest this movement or sheer is now a well accepted process. So other than a few ill chosen words, what’s the problem? This is very interesting to see and learn about but otherwise how it relates to CO2 induced climate change seems a long and tenuous path.
***********
R. Gates says:
If I’m right, and the summer sea ice minimum is this year turns out less than 2008 or 2009, and not more, as Steve has said he believes will happen, then what? I suspect that your AGW skeptical nature will find other reasons why I just happened to be right, such as “sheer” forces or wind or who knows what else. I was ridiculed yestereday for example for pointing out that waves change the albedo of ocean water, especially for low sun angles, until I had to dig up all the research to prove my point.
I may well not know what I am doing, but I think I know a bit more about the Arctic then given credit…:)
*****************
Joe Bastardi is calling for a rather large melt also. It has nothing to do with global warming though:
“I realize I may raise the ire of people on my side of the AGW debate, but look I have a big ice melt season forecast and it is plummeting already. So yes, I am “rooting” on the ice melt here to demonstrate forecast accuracy, so when these people attack me for my colder viewpoints, you know who is objective and who isn’t. But this forecast was made over a couple of months ago, even before the recovery all the way to normal! Over the last month, Sea ice on all the data has moved from close to normal (in some sites above) to below normal for the Northern Hemisphere. My prediction is that while we don’t get to 2007, we will go past ’09 and ’08, but recover nicely this winter and beyond. But I am reading accounts that seem to be asleep at the switch at the dramatic downturn in Northern Hemisphere sea ice in the last month. It is real, it was expected as the forecast from this person continues to be a step back for the summer compared to the last two. All I care about is the right forecast and this looks to be one that will be spot on, no matter who gets mad about it. But remember what is following a rapid ramp up to a higher peak after the La Nina! Last year, and the year before I correctly predicted less ice melt, this year, I am solidly in the camp of more than the past two years. While my overall AGW position puts me on thin ice with those that are convinced that the Earth is warming because of man, I am sure this will also put me on thin ice the other way, but facts are facts. Look for yourself: ‘
http://www.accuweather.com/ukie/bastardi-europe-blog.asp
Should any body think that the total global sea-ice cover is declining must have a look at the south pole. The current sea-ice cover at the S-pole is breaking the record for this time of year. One must consider that the south polar sea-ice cover is about 20 % more then the north pole one. Hence an increase of say 1.0 % at the S Pole will balance out a decrease of 1.2% at the N Pole. The Global Sea ice cover is not decreasing. The total energy of the planet is the most important scientific parameter to measure in this debate. What is decreasing is the belief in AGW at global level. AGW is dead but politicians are pumping out millions of dollars/euros to keep AGW on life-support, so that they will be able to keep on taxing us and thus feed the AGW-business monster they had created and keep it ‘alive’.
http://www.iup.uni-bremen.de:8084/amsr/ice_ext_s.png
Put a couple of plots up on arctic ice extent, been meaning to do this for some time.
The situation continues to be ambiguous so all we can do is wait and see.
Wordpress short link
http://wp.me/PMOi6-2V
Hey, the ice is what it is.
Like waves on the oceans, they vary.
But the problem is we’re paying people to essentially count waves and speculate as to why they all don’t stay the same size and same frequency.
And as they ponder they recognize advantages to certain speculations.
Then the speculations morph into convenient conclusions which calls for more counting.
All we get is the privilege of paying for it.
But what do I know?
John F. Hultquist
It does “appear” from the JAXA maps to be melting, and that is exactly the belief being expressed in dozens of comments over the last few weeks – wrt the decline in the sea ice graphs.
I wonder if there is any data to indicate that there might be net polar rotational winds in right direction to account for this shearing or if this effect could be caused by under-ice ocean currents?
The sea ice situation is worse than it appears. All of that ice in the Bering Sea will rapidly melt in the coming days and at the time the true anomaly will become apparent and we’ll be way below any other year for this date.
REPLY: I think you are off in that prediction. We’ll see in about one to two weeks. Commenters take note. -A
I think the most likely explanation was the very negative Arctic Oscillation which would promote high pressure in the high Arctic, which would promote a clockwise flow of ice. Since the AO was so negative, there could be some momentum causing the ice to flow against the spin of the earth.
I think a positive AO is actually better for high Arctic ice formation and larger minimum extents due to low pressure creating cold weather and a counter-clockwise ice flow that while drawing in more salty, warm, Atlantic water, doesn’t flush vast amounts of ice down the east coast of Greenland (like we saw in 2007).
The last large summer minimum we had was in 1996 which came off of a very small winter maximum… thanks to a negative AO in the winter and a strongly positive AO during the summer. It was a perfect storm for lack of ice melt. I believe that extremely small amount of ice melt in summer ’96 aided the development of the super Niño in 1997/98… kind of like the vast melting in summer 2007 likely enhanced the upwelling in the equatorial Pacific, and thus strengthening the La Niña from the bottom up, rather than from changes in trade winds.
JJ
No doubt all that 4-1/2 foot thick ice will melt during the next week with 30 degree air temperatures.
James Sexton says:
May 27, 2010 at 8:33 am
@ R. Gates,
I think what our friends are saying, it isn’t melt.
…
As you can see, the temps show what ever is occurring, one can’t call it melt. At least, not from the top.
…
Personally, I believe the underwater currents combined with volcanic activity underneath the Arctic is what we’re observing, but I’ve no way to prove it.
Yes, I think you’re right.
Melt from the bottom – the warm waters from the Atlantic (mainly) and Pacific (a bit) are causing the unprecedented melt rates this Spring:
Dropping. Like. A. Rock.
http://www.ijis.iarc.uaf.edu/en/home/seaice_extent.htm
In a few days, 2010 will have dropped past all the lowest sea ice extent years, and become the lowest for that date in recorded (satellite) history.
Notice how 2010 cut across all the other years ? (2006 coming soon)
How much heat gets into the Arctic from the warmer oceans ?
Too bad Argo can’t send floats under the Arctic ice yet – but they are working on next generation gliders to get this info.
8.5 °C water in, 2.0 °C water out. Sounds like a lot of ice-melting heat going up there from the warm southern oceans.
Because of the very narrow Bering Strait, most of the ocean heat enters the Arctic by way of the North Atlantic. It just so happens that this April, and this January to April, has had the warmest northern hemisphere ocean temperatures on record:
http://www.ncdc.noaa.gov/sotc/?report=global
The warmth was most pronounced in the equatorial portions of the major oceans, especially the Atlantic.
Warmest oceans on record, with an especially warm Atlantic.
Record fast melting of the thinning ice in the Arctic this April and May.
So, it’s not CO2 causing the Arctic ice to melt at record rates. It’s the warmer water making its way to the pre-conditioned Arctic ice, from the warmest oceans on record.
Which was caused by CO2 buildup.
Circling the drain?
(Down into the hollow earth.)
Isn’t “Death Spiral” a fighting technique used by Norsemen berzerkers?
>>>My linear projections show that if the rotation is this fast now,
>>>that by 2035, the ice cap will be rotating so fast that all the polar
>>>bears will spin off into the water and drown, and the baby seals will
>>>be crushed as the ice caroms off the coastline.
And it it rotates fast enough, we will get the biggest ice-circle in the world…
http://forgetomori.com/wp-content/uploads/2009/01/icecircledasf.jpg
http://208.106.181.133/_media/imgs/articles2/a96726_a474_icecircles.jpg
http://lh5.ggpht.com/_g4jfQ9COILQ/SkTeVoWqIkI/AAAAAAAAHxM/OE9ygQxdqMA/Ice%20Circle5%5B2%5D.jpg
I would like to see a calculation of how much of this ice melt was caused by Al Gore’s huge luxury $8.5 mansion, one of many which he owns. How much warming would occur if we all followed Al Gore’s example of how to live the green life?
Double standard much, Al?
Anu
If you believe undersea currents are melting the ice, then you should also believe that cold temperatures in the north Pacific hints at a significant recovery this summer.
@R. Gates
‘Seems that no matter what happens, AGW skeptics will try to find any OTHER reason for the ice to decline in the Arctic, other than the fact that the region has seen the bulk of global warming so far.’
Must be truly odd if you can’t see the hilarious in your attack, using a logical fallacy no less, of a scientist’s use of more proper logic debunking a crappy hypothesis.
ROFL. Do you see it now?
If I see one more occurrence of ‘sheer’ when people mean ‘shear’ I’m going to scream.
REPLY: Sheerly you jest? 😉 A
Non-update on the terrifying Arctic Sea Ice Volume Anomaly chart from the Polar Science Center using the PIOMAS model which the (C)AGW proponents have been posting for months as telling THE REAL STORY and clearly showing the Arctic Sea Ice Death Spiral:
No change. Last updated May 13, posted schedule for updates is every 3-5 days (based on data availability), now 14 days since last update when the graph was showing an alarming steep decline.
Maybe they read the criticisms of it here and decided the model needed further “validation.” Perhaps when done they can demonstrate it has all the robust accuracy of a tree ring, at least.
Look at Antarctic.Then Arctic. Arctic ice is floating in water. Antarctic ice is on land.
Antarctic ice is “exposed to air” only. Arctic to air and water. Whats the temperature of the air? Its above zero. Which one is thickest? What does it tell us regarding how much melting because of CO2? The answer is obvious; Its the ocean currents.
Ocean currents will be colder soon. No significant warming of air since….2001? So there will be a el Nino spike forwards; Some will gloat and say its CO2.
I think Gaia will come back and bite next winther. For 20-30 years.
But then again, I dont believe in Gaia.
R. Gates:
Yes, we do tend to look for reasons other than ice melt while the temperature remains at well below freezing point.
oh yawn are we still on the “oh yes it is, oh no it isn’t” pantomime chants about ice thickness and extent.
I’m not sure these endless updates about ice in the Arctic advance the cause for either side, as nobody knows the exact reasons or the implications. It is all speculation.
So lets wait until September shall we and then see wher we are?
Tamara says:
May 27, 2010 at 9:16 am
The Beaufort Gyre is not a fixed phenomenon (anymore than any other aspect of the climate). See this site: http://www.whoi.edu/beaufortgyre/results_fwcdecadal.html
It appears the Gyre was stable from the 50′s through the 80′s, then shifted in the 90′s. Could this be yet another 30 year oscillation?
At any rate, I think it is safe to assume that the shearing effect of the BG could vary from year to year, and is at least as likely to be contributing to the current conformation of sea ice as is CO2.
I have suspected for some time now that the primary driver of the decline in Arctic sea ice was the dramatic shift in the BG and the Transpolar Drift which occurred in 1989. What started me down that path was this animation from Rigor and Wallace
http://iabp.apl.washington.edu/animations/Rigor&Wallace2004_AgeOfIce1979to2007.mpg
Here is their description of the animation
The red dots shows the current location of buoys used to estimate the age of sea ice. The areas of older, thicker ice are shown in white, while younger, thinner sea ice is shown as darker shades of blue.
This animation of the age of sea ice shows:
1.) A large Beaufort Gyre which covers most of the Arctic Ocean during the 1980s, and a transpolar drift stream shifted towards the Eurasian Arctic. Older, thicker sea ice (white ice) covers about 80% of the Arctic Ocean up to 1988. The date is shown in the upper left corner.
2.) With the step to high-AO conditions in 1989, the Beaufort Gyre shrinks and is confined to the corner between Alaska and Canada. The Transpolar Drift Stream now sweeps across most of the Arctic Ocean, carrying most of the older, thicker sea ice out of the Arctic Ocean through Fram Strait (lower right). By 1990, only about 30% of the Arctic Ocean is covered by older thicker sea ice.
3.) During the high-AO years that follow (1991 and on), this younger thinner sea ice is shown to recirculated back to the Alaskan coast where extensive open water has been observed during summer.
The age of sea ice drifting towards the coast explains over 50% of the variance in summer sea ice extent (compared to less than 15% of the variance explained by the seasonal redistribution of sea ice, and advection of heat by summer winds).
For me what is most significant is the dramatic shift in where the residual ice ends up at minimum in Sept. Prior to ’89 most of the old ice is left west of the pole, after the change in the current circulation the old ice is left along the Canadian coast where the TPD, which changed from running mostly parallel to the Lomonosov Ridge to running almost exactly along the Prime Meridian, works almost year round to move it out through the Fram.
From reading the comments around here, it appears most people think that the winds are the primary drivers of ice movement in the Arctic, but having spent more than 60 yrs. living on the bank of the Mississippi in southern Minnesota, I tend toward currents being more important. If you’ve spent time in a houseboat, almost the perfect inverse of an iceberg, on the Mississippi you might also suspect that when it comes to a faceoff between the the wind and the current, the current comes out on top almost every time.
I’ve been watching the ice drift maps at DMI for a while and to my eye the patterns from this Spring suggest the BG may be returning to a pattern close to what it was in the ’80s, but they’ve shut them down for the season so we’ll have to wait to see how that pans out.
My Minnesota experience also tends to make me doubt the claims that melting is the leading cause of ice disappearing in the Arctic, at least within the confines of the Arctic Ocean itself. The west to east flow of the TPD across from the Bering Sea to the Fram looks to be somewhere between 1 and 1.5 degrees of latitude per month, which would suggest that open water from the Alaskan coast to Lat 77 to 80 or more west of the pole could be accounted for by movement alone.
So its NOT undersea volcanoes now
http://wattsupwiththat.com/2008/06/25/surprise-explosive-volcanic-eruption-under-the-arctic-ice-found/
Billy Liar says:
May 27, 2010 at 11:59 am
If I see one more occurrence of ‘sheer’ when people mean ‘shear’ I’m going to scream.
REPLY: Sheerly you jest? 😉 A
Yeah, it’s not shear that causes the polynyas anyway!
Extent graphs are disagreeing again.
2010 below 2006:
http://www.iup.uni-bremen.de:8084/amsr/ice_ext_n.png
Date on graph May 26 2010.
2010 still above 2006:
http://www.ijis.iarc.uaf.edu/en/home/seaice_extent.htm
Date on graph also May 26 2010.
Both use AMSR-E data. The possible difference? First is from IUP University of Bremen which carries a hefty disclaimer on their “High Resolution AMSR-E 89 GHz Sea Ice Images” page:
The second graph, of course, is from IARC-JAXA. And yes, both use 15% minimum sea ice concentration.
So, who do you want to trust?
From Billy Liar on May 27, 2010 at 11:59 am:
Current and former metalworkers may talk about shear nonsense, as they are best able to gauge it. 😉
As noted, the daily high at Barrow and Prudhoe Bay as reported on the evening news just broke freezing. It hit a high of 38F yesterday. Normal winter temps run around -35F, so this winter arctic warming does not mean much.
Isn’t it obvious? Some one pulled the plug from the Arctic Ocean floor. The water is swirling clockwise as it drains. This pulls the surface ice along creating the shear. There’s only one thing that needs to be done: Plug the damn hole!
Dave Wendt says: May 27, 2010 at 12:37 pm
Tamara says:May 27, 2010 at 9:16 am
The Beaufort Gyre is not a fixed phenomenon (anymore than any other aspect of the climate). See this site: http://www.whoi.edu/beaufortgyre/results_fwcdecadal.html
It appears the Gyre was stable from the 50′s through the 80′s, then shifted in the 90′s. Could this be yet another 30 year oscillation?
At any rate, I think it is safe to assume that the shearing effect of the BG could vary from year to year, and is at least as likely to be contributing to the current conformation of sea ice as is CO2.
I have suspected for some time now that the primary driver of the decline in Arctic sea ice was the dramatic shift in the BG and the Transpolar Drift which occurred in 1989.
Interesting that what you propose also agrees with the snowmelt in the northern hemisphere: (which I posted earlier rebutting R. Goates on http://wattsupwiththat.com/2010/05/25/the-western-snowpack-is-137-of-normal/ )
The discovery of a sharp decline in late winter and early spring snow
cover starting in the 1980s until 1990 was revealed after researchers
made overdue adjustments to decades of daily snow cover maps.
After the fine tuning the maps, New Jersey State Climatologist and
Rutgers University professor David Robinson found a 1990 decline in spring
snow extent that we still see today.
“It has remained lower over the past 20 years compared to the previous 20 years in
North America and Eurasia,” he said.
http://climate.rutgers.edu/snowcover/chart_anom.php
?ui_set=0&ui_region=nhland&ui_month=4
Comments
1. There should be evidence of folding or buckling or of one sheet overriding another in areas where the rotation has caused compression. It would be interesting to look for that.
2. Such a shear process should decrease ice extent but have a much lesser impact on ice volume since the ice is simply moving and not melting. I seem to recall some story being told a week or tow ago about ice extent being unimportant and ice volume being the only thing that matters.
3. At some point, maybe this year – maybe in a few year’s time, we will have another big melt. The world DID warm slightly over the last decade or two of the 20th century. We should expect to see more frequent big melt events as a result. Big melt events do not validate AGW just as their lack does not invalidate it. I see an unfortunate tendency for people of all persuasions to get sucked into thinking that it is all about the extent – volume – whatever – of arctic ice.
R. Gates
“Now I can begin to see what your repsonse and other AGW skeptics may be…”
We skeptics aren’t a monolith like the “consensus”. Heck, we take each other to task regularly. FWIW, I too, find Steve’s post this time a thin bit of unconvincing rationalization on ice decline – a bit like the NSIDC’s, 2nd lowest, then 3rd lowest and then 4th lowest minimum with the rebound when common sense tells us that if it is in recovery, then it is most likely to go through a staged increase. In any case, as a geologist, I can’t get too excited by changes in a handful of years one way or the other.
The founding of “nouveau” climate science started off on the wrong foot 30 years ago or so when astronomers and physicists began examining the short instrumental record of temperatures (not even a fraction of a second in a long geological record) and used these to arrive at uprecedented this and robust that. When paleoclimatologists (geologists) started coming out of the woodwork to teach them that there is indeed a venerable record of climate change going back 4B yrs or so and what we have now is in the middle of the spectrum of change, then, and only then, did the problems start. Having gone beyond the point of no return on their entrenched positions and the hyperbole to describe these alarming events (and the considerable arrogance that seems to be in the field of physics and astronomy), they spent the next couple of decades actually rediscovering the various warming and cooling periods and devising methods of “neutralizing” these inconvenient swings in climate so as not to have to go back on their dire assessment of an unprecedented and out-of-control warming. As they ran aground on many of these issues (still trying to get things hotter than the 1930s, pictures of subs surfaced at the north pole in March 1950, drying Lake Mead filled back up with water, snow in Johannesburg, Buenos Aires, Melbourne, the Emirates, Jerusalem, etc), they were forced to give up or change horses and switch the concerns to “climate change” and we got all this “cold and ice is because of warming” and worst winter in 50 years or more with new cold records in UK and much of Europe. Even the Copenhagen Summit got deservedly snowed on and ravaged with “unseasonable” cold. The desperate machinations and conspiracies with data and black-balling of sceptics from publishing and the like then came to light in the Climategate affair which showed the world that peer review was rigged, the non peer-reviewed propaganda from WWF, Greenpeace, Koffie Annan and other socialist and anti-American entities and individuals made up significant portions of IPCC reports. This is where we are now in the Climate ‘Debate’. Actually most scientific sceptics hold the position that the climate has been warming a degree or two as it rises out of the Little Ice Age – the ad hominem assaults, the insulting flat earther labels and the references to Nazi era horrors (“deniers, death trains, and the like) in putting down sceptics is in itself enough to discredit the entire “consensus” and it is no surprise that many scientists in the fold began to back away from it and the public began to melt away along with this. You get the general idea.
Phil,
So you are suggesting that the ice is simultaneously thickening and melting? Good call.
stevengoddard says:
May 27, 2010 at 11:45 am
Anu
If you believe undersea currents are melting the ice, then you should also believe that cold temperatures in the north Pacific hints at a significant recovery this summer.
If I believed the 53 mile wide Bering Strait (with an average depth of 30 to 50 meters) was as important to Arctic warm water transport as the 770 mile wide (ocean part, not including Iceland), deep (800m and 600m channels), Greenland Scotland Ridge,
then yes,
I might believe in a “significant recovery” this summer.
But record melt rates this Spring hint at a different outcome:
http://www.ijis.iarc.uaf.edu/en/home/seaice_extent.htm
The warm Atlantic is the dominant oceanic influence on the Arctic.
Anu,
The unusual “melt” in 2007 was on the Pacific side, in the Chukchi and east Siberian seas.
The 3,000,000 or so sq. km of ice extent lost in the Arctic since the yearly high on March 30 didn’t all vanish by shearing nor by melt, or being washed out of the Fram Strait by the currents…it was a little bit of each of them. What they all have in common is that they involve energy. Here in Denver and along the front range, the quickest way to melt snow is rarely by air temperature being raised, but by wind. The Chinook winds come in and ‘eat’ the snow, (Chinook means snow eater). But wind is another form of energy, and can be considered as a “macro-temperature” as it is the macro-motion or kinetic energy of large masses of air, as opposed the molecular level kinetic energy. Both wind and air temperatures are primarily driven on this planet by solar insolation, and so they are both expressing the same source in different ways.
So, AGW is an issue of energy imbalance. Those who believe it is happening would say more net energy is entering earth’s systems than leaving. How might that energy show up? And where the heck is it? This causes scientists like Kevin Trenberth and John Fasullo no small amount of toil “looking” for it, as we all know. Wind and ocean currents are another form of energy, and if they cause ice to go away, along with higher water and air temps, then in a system that is experiencing an overall energy imbalance, does it matter what clears the arctic of ice…or what combination it is since ultimately it energy all the same, right?
\
Obviously created by
those giant Russian
nuclear tourist icebreakers
making their first excursions.
http://www.sailwx.info/shiptrack/shiplocations.phtml
You will have to look
for them.
R. Gates says:
May 27, 2010 at 2:46 pm
In other words what you are saying is CO2 is the Kevin Bacon of the climate system. Throw in six degrees for any weather or climate issue and you get back to CO2. Thanks for clearing that up.
R. Gates
Arctic sea ice extent has declined almost as low as 2006, which had the second largest summer extent in the JAXA record. Scary ….
I’m trying to put this all together.
The ice in the Arctic Basin is rotating (clockwise)
It’s pulling away from land in at least 4 areas, opening big holes
This shear away from the coast is causing the decline in ice area
The ice is not melting
OK. So that’s a lot of ice – where is all this ice? I’ve been puzzling over the satellite photos http://ice-map.appspot.com/ trying to find where it went… I see lots of cracks where the ice is pulling apart.
Ok, I will wade in.
1.) The chart from Barrow shows the ice they are measuring is still increasing and is now at 4.5 feet. with even more insulating snow on top of it.
2.) The air temperature has increased to a whooping 30F (still below freezing)
3.) There is a hole forming offshore relatively near where these measurements are being taking.
We are told the Ice is “melting” but the above data does not support that especially with a strong negative AO (low sea water temp.)
As Steve points out shear does explain the hole especially since it is shaped like a long narrow “tear” The other “holes” along the shore line are also long narrow tears.
Excerpt from: R. Gates on May 27, 2010 at 2:46 pm
From IARC-JAXA data (csv file):
So March 31 was actually higher, according to them.
14,407,344 – 11,300,781 = 3,106,563 km^2 lost from the 3/31 max to now.
Those numbers are fun to play with once you get them crammed into a spreadsheet, which I did for practice with Open Office yesterday. Going by the full datasets for 2003 to 2009, going by the max and min, 2007 did have the largest drop by percentage, only retaining 30.5% of the maximum. Yet while 2008 had less percentage loss at 32.4%, it had a greater extent loss than 2007 and greatest of the group, 9,809,062 km^2 versus only 9,691,094 in 2007.
Wow, play with these numbers long enough and you can start to believe they actually mean something.
jakers
Ice is three dimensional. If it is losing area on the leeward side of a peninsula due to shear, then it is increasing volume by piling up on the windward side.
stevengoddard says:
May 27, 2010 at 3:03 pm
R. Gates
Arctic sea ice extent has declined almost as low as 2006, which had the second largest summer extent in the JAXA record. Scary ….
______________
Absolutely terrifying! But 2006 had a much different dynamic as it essentially bounced around a -1,000,000 sq. km. negative anomaly the entire year, whereas this year, as we all know, we were almost at normal back in April and have seen a steep drop since then.
I certainly don’t expect the steep drop to continue, but I do think we’ll end up below Sept. 2006’s summer minimum (and 2008 and 2009)…and if we don’t, of course and a mea maxima culpa for Steve!
R. Gates says:
May 27, 2010 at 2:46 pm
The 3,000,000 or so sq. km of ice extent lost in the Arctic since the yearly high on March 30 didn’t all vanish by shearing nor by melt, or being washed out of the Fram Strait by the currents…
…yada, yada, yada. Give it a rest, please.
You go on and on in an attempt to establish AGW as an energy imbalance. Of course it is! Climate is an energy imbalance by its very nature. Why, then, do you concentrate on the loss of Arctic ice with no mention of Antarctic sea ice gain? If you look at any one part of a system, you most certainly will find an energy imbalance, but that also means you are looking less closely at the other part or other systems, increasing the likelihood of missing the big picture.
One of these “big picture” items is your oversimplification in implying that wind is a “macro temperature”, suggesting that global warming leads to greater wind energy. This is not necessarily so. As you must know, winds depend more on a varied or wider temperature gradient and not simply an increase in temperature. And according to the IPCC (and I gather, the great “consensus”), AGW is not so much manifested by an increase in daytime highs as it is in an increase of night time lows. In other words, AGW should result in an INCREASED HOMOGENIZATION of temperatures, and thus a decrease in temperature gradients.
I’m not claiming that wind energy is lower or higher than normal, globally. I just find your reasoning that AGW is at the root of it lacking.
JJ says:
May 27, 2010 at 10:47 am
The sea ice situation is worse than it appears. All of that ice in the Bering Sea will rapidly melt in the coming days and at the time the true anomaly will become apparent and we’ll be way below any other year for this date.
REPLY: I think you are off in that prediction. We’ll see in about one to two weeks. Commenters take note. -A
stevengoddard says:
May 27, 2010 at 11:00 am
JJ
No doubt all that 4-1/2 foot thick ice will melt during the next week with 30 degree air temperatures.
______________
But since JJ said the Bering Sea and the 4.5 foot thick ice is at Point Barrow in a completely different ocean, I’m wondering how Steve’s comment makes any sense? There is not much (if any) 4.5 foot thick ice remaining in the Bering Sea right now. JJ is probably right…Bering Sea ice will be gone in the next few weeks….
Daniel M says:
May 27, 2010 at 4:07 pm
“I’m not claiming that wind energy is lower or higher than normal, globally. I just find your reasoning that AGW is at the root of it lacking.”
____________
AGW or not, one of the forms of energy that sunlight is converted to wind…and so when looking at the total energy balance of a system, you need to look at all the forms of energy that solar radiation may be converted to and that multiple forms of energy (that once were sunlight) can cause sea ice to melt. That was my point. I never said wind would increase or decrease because of AGW. But but one thing is certain, if AGWT is correct, that extra energy that is not leaving the earths systems will be somewhere.
Anu says:
May 27, 2010 at 2:00 pm
“The warm Atlantic is the dominant oceanic influence on the Arctic.”
I would tend to agree, especially for the present rather rapid decline. Recent work suggesting increased warm flow into the Barents and Greenland seas seem to align well with where the most precipitous declines are occurring
http://wattsupwiththat.com/2010/02/16/greenland-glaciers-melt-due-to-sea-current-change-not-air-temperature/
http://wattsupwiththat.com/2009/10/08/new-paper-barents-sea-temperature-correlated-to-the-amo-as-much-
Actually the beaufort gyre has been strong all winter. That publicity seeking bunch of polar walkers struggled with it in trying to reach the pole remember?
The ice moves/rotates all the time and you consequently always get these areas where the sheets are pulling apart. In winter the open water so created quickly freezes. As it gets warmer this freezing slows and you reach a temperature where it happens too slowly to cope with the rate at which the sheets are pulling apart. Then you start to see open water. Nothing has to melt. The temperature doesn’t even have to go above freezing for this to happen.
This is probably how the ice cap breaks up every year. It is just part of the natural mechanism by which that happens.I don’t think there is much point quibbling over whether this means the ice has moved or melted. The bottom line is that natural processes are starting to diminish the extent of the pack ice as they do every year, and that this year, after a very slow start, the process now seems a little ahead of schedule.
R. Gates
So you are saying that a 1 Mkm^2 anomaly in 2006 is different than a 1 Mkm^2 anomaly in 2010?
I’m just curious about what has happened up there. The ice is spinning faster than the Earth??
Or, did the Earth slow down ever so slightly that the ice continues and tears away?
Or (c) unknown forces at work.
It is, however, most interesting that the ice has continued to thicken.
stevengoddard says:
May 27, 2010 at 3:58 pm
Ice is three dimensional. If it is losing area on the leeward side of a peninsula due to shear, then it is increasing volume by piling up on the windward side.
One would think that might be happening but I can’t see where it is. The big hole north of Alaska should then pile up along the other side of the basin, Siberia. But there are plenty of open leads, and then big holes, along there too. The only place I can’t see clearly (too thick clouds) is NE of Greenland. Kind of a small area for all the missing ice to be?
Billy Liar says:
May 27, 2010 at 11:59 am
And don’t call him ‘Sheerly’!
Gary Pearse says:
May 27, 2010 at 1:30 pm
Spectacular summary. Well done!
And to whomever it was felt it was pointless to have a close up of the ice: I will often include the steps of discovery so others can see the process happen. Throws some folks who want the pablum pre-chewed; helps other learn to not stop at the first odd thing but keep going till the picture forms. Also, I’m fond of both close up and far away views of things. You see different details. Like the edge on the ice…
@Anu:
As you ought to know, it’s not the size, it’s the change of size that matters (ie. the anomaly). This graph:
http://www.john-daly.com/polar/flows.jpg
from this writeup:
http://www.john-daly.com/polar/arctic.htm
Has the rather interesting image of that Pacific water hitting the edge of the ice right where you would push to get the gyre to move… and with water draining away toward Canada off the other side. That the Pacific water is closer to the surface says to me that it is what is hitting the ice, not the deeper Atlantic currents that go all sorts of odd directions.
So I’d suggest two things. First, read that article. It will clear your cobwebs a bit. Second is more speculative.
I’d speculate that the increased gyre is partly due to increased Pacific inflows as the residual heat works it’s way out of the Pacific. It’s an 18 year lag from Equator to Arctic, so in 5 or 6 years it runs out, but until then it’s a heat engine running for the polar radiator.
So my speculation would be that the gyre speed could be matched to Pacific heating cycles, but with a 15-18 year lag; and I’d speculate that Arctic “melt” (that doesn’t melt but breaks up and washes out) is going to similarly lag Pacific heat.
You get 5 more year of Arctic Panic, then it’s game over.
R. Gates says:
May 27, 2010 at 7:08 am
Warmth in the Arctic winter. Interesting concept.
Just to be accurate the graphs you show don’t show warmth they show an anomoly from the norm. This years Barrow weather record shows that the thermostats only hit 0oC in the past few days. Back in March it reached a barmy -40oC.
There has been no warmth in Barrow this year to melt the ice. That will come from now onwards.
Excerpt from E.M.Smith on May 27, 2010 at 5:00 pm:
See here, specifically this graph. Esteemed Arctic sea ice experts like Berber, Meier, Stern, and Zhang agree with you, the Arctic Ice Death Spiral will soon have a long extended pause.
Of course all that evil human-made CO2 is still up there so it will resume eventually. In about twenty years from now.
R. Gates says: AGW or not, one of the forms of energy that sunlight is converted to wind…and so when looking at the total energy balance of a system, you need to look at all the forms of energy that solar radiation may be converted to and that multiple forms of energy (that once were sunlight) can cause sea ice to melt. That was my point.
And it’s a broken one.
The wind comes from the DIFFERENTIAL heating, not heating per se. A colder arctic can just as easily be the driver for higher winds. So I’d postulate that a drop in atmospheric thickness and a reduction in 03 (leading to higher IR radiation to space) at the poles (both most likely from changes in solar activity) result in higher heat transfer to space at the poles. That makes for a higher temperature differential with the (still warm) oceans that have spent 30 years in the warm phase of the PDO. Thus higher winds from LESS solar activity. (Note: No CO2 need apply).
Now play this forward for 30 years and we’ll have one very very cold arctic and a pretty cool Pacific and Atlantic oceans. And a very solid ice cap. Then the PDO can flip again and we’ll start the whole PDO cycle all over again.
So please, when doing all your ‘thought experiments’, please remember that a heat engine is driven by a heat DIFFERENTIAL and not by a heat level.
I never said wind would increase or decrease because of AGW. But but one thing is certain, if AGWT is correct, that extra energy that is not leaving the earths systems will be somewhere.
AGWT ? That’s a new one on me. “T” ? Well, it’s been a month, guess it’s time for the AGW crowd to mutate their argument again… and their name… and …
Oh, and all that “excess heat” – it’s all “in the pipeline”. Now all you have to do is find the pipeline… (It’s not the air, nor in the water, nor even in the land… maybe it’s hiding in the Aether…. or the ‘zero point’ energy of all the CO2 atoms or… /sarcoff>
So enjoy your hunt for “The Lost Energy of Hansen and Cru” … I hear it’s a great work of fiction…
I guess winds moving around the ice will always have a impact on ice extent. Winds from the north for example will somtimes push ice north of Europe out into the north Atlantic ocean where it will melt faster.
One other important point is the possibility that the older thicker ice is melting more and more leaving the arctic with a higher percentage of young thinner ice. Thinner ice is easier to break and easier to move around by wind and sea currents. This will potentially make faster transportation of sea ice out into open waters, depending on the wind direction of course. I think the potentially largest leaking and melting of arctic sea ice would happen if there is wind patterns favoring transportation of ice out into the Atlantic sea. See this youtube animation illustrating this possibility http://www.youtube.com/watch?v=Co68_tod0dQ&feature=PlayList&p=26FEF7FD6D6260E1&playnext_from=PL&index=0
Good night!
k winterkorn: “My linear projections show that if the rotation is this fast now, that by 2035, the ice cap will be rotating so fast that all the polar bears will spin off into the water and drown, and the baby seals will be crushed as the ice caroms off the coastline.”
lmao
Incidentally, my seven year-old daughter also thought this was hilarious and she fervently adores both polar bears and baby seals.
stevengoddard says:
May 27, 2010 at 1:47 pm
Phil,
So you are suggesting that the ice is simultaneously thickening and melting? Good call.
How do you get that from being told that it’s not ‘shear’ that causes polynyas, I guess ‘Normal Ice Decline’ didn’t make for a good headline?
stevengoddard says:
May 27, 2010 at 2:16 pm
Anu,
The unusual “melt” in 2007 was on the Pacific side, in the Chukchi and east Siberian seas .
Maybe by late September.
And yet in this year of record Spring melt, it is the areas closest to the incoming Atlantic warm water that show the biggest sea ice loss compared to the 1979-2008 mean:
Baffin/Newfoundland Sea:
http://arctic.atmos.uiuc.edu/cryosphere/IMAGES/recent365.anom.region.4.html
Greenland Sea:
http://arctic.atmos.uiuc.edu/cryosphere/IMAGES/recent365.anom.region.5.html
Barents Sea:
http://arctic.atmos.uiuc.edu/cryosphere/IMAGES/recent365.anom.region.6.html
Kara Sea:
http://arctic.atmos.uiuc.edu/cryosphere/IMAGES/recent365.anom.region.7.html
Laptev Sea:
http://arctic.atmos.uiuc.edu/cryosphere/IMAGES/recent365.anom.region.8.html
Hudson Bay:
http://arctic.atmos.uiuc.edu/cryosphere/IMAGES/recent365.anom.region.13.html
The areas not yet melting are all farthest from the North Atlantic, and its warm water flow into the Arctic:
http://nsidc.org/arcticmet/factors/land_sea_distribution.html#ocean_currents
Notice where all the biggest melts are:
http://nsidc.org/data/seaice_index/images/daily_images/N_daily_extent_hires.png
Are you going to have a special “Arctic Sea Ice News” when 2010 drops out the floor ?
http://www.ijis.iarc.uaf.edu/en/home/seaice_extent.htm
E.M.Smith:
“AGWT ? That’s a new one on me. “T” ? Well, it’s been a month, guess it’s time for the AGW crowd to mutate their argument again… and their name… and …”
Mike, what R. Gates means by AGWT is “Anthropogenic Global Warming Thermogeddon,”
[snip]
E.M.Smith says:
May 27, 2010 at 5:45 pm
The wind comes from the DIFFERENTIAL heating, not heating per se.
_______________________
I appreciate the point and I agree, but it does not invalidate my basic point that thermally derived wind represents another form of what was originally solar energy. You can’t get differential heating without just plain heating…you need the solar energy.
Thank for a good comment Anu!
I you list of great links I want to add the Arctic sea ice VOLUME. Because the ice has a thickness and is not just flat 🙂
http://psc.apl.washington.edu/ArcticSeaiceVolume/IceVolume.php
http://psc.apl.washington.edu/ArcticSeaiceVolume/images/BPIOMASIceVolumeAnomalyCurrent.png
R. Gates says:
May 27, 2010 at 8:16 am
If models don’t help us speculate, what good are they?
Very good question. The answer should be based on the state of the model. If the model has been tested and verified then they should help us make intelligent decisions. If they haven’t … well, now you know the problem.
Here is a illustration of what might be happening in the Arctic at the long run.
R. Gates says:
May 27, 2010 at 7:27 pm
If winds are picking up in the Arctic due to increased differential heating due to extra heat trapped, then the winds should also be increasing all across the globe. Not just in the Arctic and nowhere else.
Bering Strait water flow properties:
http://psc.apl.washington.edu/HLD/Bstrait/bstrait.html
Mattias says:
May 27, 2010 at 7:57 pm
Thank for a good comment Anu!
I you list of great links I want to add the Arctic sea ice VOLUME. Because the ice has a thickness and is not just flat 🙂
That’s very true, the shrinking volume of Arctic sea ice is a key component of how much the ice extent will shrink in the years and decades ahead.
I look forward to the CryoSat-2 data, and updates to the PIOMAS Arctic Ice Volume chart.
http://www.esa.int/esaLP/ESAOMH1VMOC_LPcryosat_0.html
E.M.Smith says:
May 27, 2010 at 5:00 pm
Read your own citation:
http://www.john-daly.com/polar/arctic.htm
Also note that, even in your citation, the Atlantic has 10 times the flow of water into the Arctic as the Pacific (8 Sv vs. 0.8 Sv). Half the entering Pacific water flows against the Beaufort Gyre.
You get 5 more year of Arctic Panic, then it’s game over.
At least you attempted a prediction – when it is falsified, you might be able to change your mind and move on. That’s better than those who prescribe everything to “natural variation”, and thus will never admit that CO2 is changing the climate.
jakers
If the ice is pulling away west of Point Barrow, then it is probably piling up east of Point Barrow.
According to NOAA:
‘Upper atmospheric winds conducive for storms. Wind shear, which can tear apart storms, will be weaker since El Niño in the eastern Pacific has dissipated. Strong wind shear helped suppress storm development during the 2009 hurricane season. ‘
So, why would the winds be stronger in the Arctic and not in the Atlantic if Anthropogenic Global Warming has created excess heat?
Problem: Making predictions based on PIOMAS and other models that depart from the reality of what’s going on.
Didn’t learn a darn thing from Pioneer, Voyager and HST observations of changing climate on other planets in the Solar System.
Garbage In to Spagehtti code / Garbage Out from Spaghetti code
Smokey says:
May 27, 2010 at 7:11 pm
E.M.Smith:
“AGWT ? That’s a new one on me. “T” ? Well, it’s been a month, guess it’s time for the AGW crowd to mutate their argument again… and their name… and …”
Mike, what R. Gates means by AGWT is “Anthropogenic Global Warming Thermogeddon,” [snip]
_________________
Hey Anthony, I realize that we “warmists” are outnumbered here and merely tolerated or seen as side-show attractions, but I sure don’t think we should be called such names and you’d never let us get get away with calling AGW skeptics “Fascists”…oh well, I know, it’s your site and you can do want you want…
REPLY: I agree, out of line, snipped. -A
Anu says:
May 27, 2010 at 7:11 pm
[Steve Goddard]
Are you going to have a special “Arctic Sea Ice News” when 2010 drops out the floor ?
http://www.ijis.iarc.uaf.edu/en/home/seaice_extent.htm
Soooo close…
11,230,469 km2 (May 27, 2010)
http://www.ijis.iarc.uaf.edu/en/home/seaice_extent.htm
Sea ice extent value to beat for May 27, 2006: 11,222,500
Still, we have a few more days in May, and 2010 has the steepest melt curve in recorded history. I’m going to go out on a limb and predict 2010 breaks through the floor before June.
Mattias says:
May 27, 2010 at 8:06 pm
Thanks for posting that animation. It’s an improved and extended version of one I linked to earlier
Dave Wendt says:
May 27, 2010 at 12:37 pm
I think it shows even more clearly that the primary driver of the decline in ice age, and as a consequence ice volume, was a dramatic shift in the circulation patterns of the Beaufort Gyre and the Transpolar Drift that occurred in ’89-’90 possibly related to the AO. See Rigor’s and Wallace’s notes for their animation that I included in my comment above.
Since the shift in the BG and the TPD seems largely unrelated to CO2, and on its own seems sufficient to account for the declining sea ice, it’s likely that in this case the canary in the coal mine might be dropping off its perch not because of bad gas but just because of plain old age.
stevengoddard said May 27, 2010 at 10:22 am
“It does “appear” from the JAXA maps to be melting, and that is exactly the belief being expressed in dozens of comments over the last few weeks – wrt the decline in the sea ice graphs.”
That’s cause it is melting, in the Pacific, in the Atlantic and Hudson bay. You have picked areas in the Arctic basin which you don’t think is melt but “shear” due to overall rotation. However temps in the regions are now around 0C and so this is actually higher than the melting point of the ice. This is why you don’t see this in mid winter but do tend to see it in Spring onwards, look at the multiyear animations for proof it is a combination of factors.
If it was just “shear” then we’d expect some to stay constant and some to shrink back to nothing, lets see if they do.
Andy
AndyW
What part of the ice is getting thicker is it that you don’t understand?
http://seaice.alaska.edu/gi/observatories/barrow_sealevel/brw2010/BRW_MBS10_overview_complete.png
Anu,
If the Arctic ice “drops through the floor” I will definitely have super-special story just for you.
So it’s not GLobal Warming that’s causing the ice loss, it’s….
GLOBAL SPINNING.
We’d better tax that straight away.
Anu says:
May 27, 2010 at 11:04 am
‘The warmth was most pronounced in the equatorial portions of the major oceans, especially the Atlantic.
Warmest oceans on record, with an especially warm Atlantic.
Record fast melting of the thinning ice in the Arctic this April and May.
So, it’s not CO2 causing the Arctic ice to melt at record rates. It’s the warmer water making its way to the pre-conditioned Arctic ice, from the warmest oceans on record.
Which was caused by CO2 buildup.”
Not necessarily. I hate to keep bringing up Evans and Puckrin 2006 mostly because I think, at least in terms of the analysis offered, that it is pretty worthless. However the experimental technique they utilized of using spectral analysis to quantify the contributions of the various atmospheric components seems reasonably well designed and their data reasonable. From my point of view though they very much buried the lede, which is that in the presence of over 200W/m2 contribution from H2O the contribution from CO2 is greatly suppressed, going from 35W/m2 of 150W/m2 total in their winter data to 10.5W/m2 of 270 W/m2 total in summer.
How this relates to your statement is that the heat in the North Atlantic waters is transported there from tropical and subtropical latitudes by the Gulfstream. Most estimates and measurements of DLR in those latitudes are in the range of 375-450+W/m2, which if the suppressive phenomenon measured by E&P holds, would indicate that CO2 is responsible for less than 2% of the greenhouse effect at those latitudes and wouldn’t be culpable for any significant amount of all that heat moving into the Barents and Greenland seas.
When I first came across the E&P paper the first thing that struck me was that at last we have a technique which can settle the question of CO2’s role in the climate system and since they did the actual work in ’99-’00, I thought I’d find multiple examples of similar work done to expand the record. Despite a number of searches the only other example I’ve ever come across was done at the South Pole where predictably the frigid desert conditions showed CO2 accounting for a solid third of the total DLR. Total DLR is measured at dozens of sites across the planet, but near as I can tell none of them have added this kind of spectral analysis to show which components of the atmosphere are generating the radiation. If I was a more cynical type I’d have to think that they really don’t want know.
oops, should be “they really don’t want to know”
R. Gates says:
May 27, 2010 at 7:27 pm
“You can’t get differential heating without just plain heating…you need the solar energy.”
Heating is heating. I think you mean you can’t get heating without solar energy? But, you seem to have missed Daniel M @ May 27, 2010 at 4:07 pm, who makes the valid point that AGW is supposed to decrease differential temperatures, not increase them.
Someone above might have corrected already, but the term is “SHEAR” not “sheer”.
Sheer, among other things, is a measurement of the fineness of stockings, which is a much more interesting topic to measure, especially as you approach the maximum height, where there can be a doubling of sheer – and a place for the tipping point. Ah! the warmth. The gyre. The response to perturbation. The mass perturbation. The memory of days gone by …….
When I look at unisys for the temperature at sea level in one of the shear areas, I see a temperature below freezing.
Specifically off Pt. Barrow the temp is -2C. No wonder the ice is growing off Pt. Barrow…the salt water is below freezing.
http://weather.unisys.com/surface/sst.html
So much for the theory of open water on May 27th in the Arctic Ocean being hot enough to melt ice.
Test: Failed.
Anomaly: Misleading.
R. Gates says:
May 27, 2010 at 7:08 am
Here you go again Steve…
First, you said:
*
*
So then, you’re an AGW propagandist?
You must be, seeing as how you’re continually pushing your propaganda message.
As Goebbels once remarked: “If you repeat a lie often enough, it becomes the truth.”
Ice in the Arctic sheers and shears in the Spring and the boy ice (you know) and then the calfs come. It’s a birds and bees and ice thing, y’know. Ice won’t get much thicker unless this happens. The same thing happens to glaciers, how else does it get miles thick? Thin ’bout da sea’r bu’tee ob id all.
PS: I thought spelling went out in the ’60s with draft cards;-)
Stevge Goddard,
When are you going to stop ignoring points that seem to counter what you say and instead bring up something I haven’t even commented on? I see this as a common trait in your replies, and they are also getting increasingly combative too for some reason. Some of your points are interesting and right, some are interesting and wrong, at least to my current knowledge, so I am giving you the chance to put counter arguements, but instead you side step always.
Andy
@Anu
‘If I believed the 53 mile wide Bering Strait (with an average depth of 30 to 50 meters) was as important to Arctic warm water transport as the 770 mile wide (ocean part, not including Iceland), deep (800m and 600m channels), Greenland Scotland Ridge, then yes, I might believe in a “significant recovery” this summer.’
So, essentially, just because you can’t understand that a “narrow” strait can lose more ice than a whole “wide” ocean you don’t, dare I say want, to believe it.
That’s about sums it up.
So from which side does the ice come from when it’s pressed out the other side from, well, the other side? Here’s some troll reasoning for ya’, which side exert the most cumulative pressure you think the narrow side or the “broad” side? :p
R. Gates:
Two things wrong with your argument:
1) As energy cannot be created or destroyed, if more net energy is entering earth’s systems than leaving then the total energy in the earth’s systems would continue building, even if everything else remained static. And, as that process would have begun when greenhouse gases first appeared, the earth would have been baked to a crisp a few billion years ago already – in which case, this discussion would certainly not be happening.
2) If some proportion of the energy in the system is manifesting itself as wind, ocean currents etc (of which I have no doubt, BTW), then simply measuring temperature anomalies (or trying to) without measuring anomalies in wind and ocean currents etc, or even quantifying energy proportions, tells us little or nothing about the energy flow in the system, or how much it’s changed – or not.
AndyW
You are quoting ice figures for regions of the Arctic which are always ice free in late summer. They have no relevance to the minimum, thus I am not spending any effort discussing them.
Steve Goddard said
“You are quoting ice figures for regions of the Arctic which are always ice free in late summer. They have no relevance to the minimum, thus I am not spending any effort discussing them.”
You are correct and I agree, but it was you who said the whole of the reduction up to now was due to not melt, a broad generalisation that I think is totally wrong. Similarly, I can turn the argument back on yourself and say lets not discuss these Arctic Basin “shear” polynyas now because come September they won’t mean a damn.
I think we should toss everything up in the air and get a better understanding.
The acid test to your theory is whether this ice free zone gets smaller or stays the same size or gets larger. If it gets larger then I’d fall on the side of melt encouraging the wind and currents here to expand the area.
Andy
stevengoddard says:
May 28, 2010 at 8:16 am
AndyW
You are quoting ice figures for regions of the Arctic which are always ice free in late summer. They have no relevance to the minimum, thus I am not spending any effort discussing them.
You’re not discussing anything relevant to the minimum anyway, your model results don’t agree with the actual observation in 2007/8 but still you trot them out. Pre-emptive strike for when your predictions for the fall are wrong perhaps?
This is how it started in the film” the day after tommorow”.
Latest Bremen map
http://www.iup.physik.uni-bremen.de:8084/amsr/arctic_AMSRE_visual.png
Ice free zones in the Artic basin are still getting bigger.
Andy
ratata says:
May 28, 2010 at 7:54 am
@Anu
‘If I believed the 53 mile wide Bering Strait (with an average depth of 30 to 50 meters) was as important to Arctic warm water transport as the 770 mile wide (ocean part, not including Iceland), deep (800m and 600m channels), Greenland Scotland Ridge, then yes, I might believe in a “significant recovery” this summer.’
So, essentially, just because you can’t understand that a “narrow” strait can lose more ice than a whole “wide” ocean you don’t, dare I say want, to believe it.
That’s about sums it up.
So from which side does the ice come from when it’s pressed out the other side from, well, the other side? Here’s some troll reasoning for ya’, which side exert the most cumulative pressure you think the narrow side or the “broad” side? :p
—…—…
Ratata:
Please note that an isolated system (a single inlet or outlet) would have almost no flow at all: the only transport path (for warm water to replace the water cooled by melting the ice) would be blocked by the water trying to exit. Today’s double entrance provides an inlet and outlet for continuous current flow of warm water to replace that which is cooled by the ice above.
So, if only a single entrance were present, Anu would need a strong in-rushing (warm) water flow going right over top of a colder, deeper outbound flow. Possible, but the net flow is much less – particularly when even part of that “hot ” outbound current itself passes under surface ice (as it must!) and cools down (as it must) and then falls down in front of the in-rushing cold currents trying to go the other way.
But, get a single strait wide enough and deep enough and Anu would get some flow through his (her?) single passage.
But his concern (about a single entry Arctic Ocean) is only applicable to another planet. It does NOT occur here – we have two straits providing access to the Arctic circulation patterns, so we can ignore his concern completely. Of course, if we close the Bering Straits off to much of the flow with a “dam” or causeway, then we would assure of ice freezing the Arctic completely. (Or we could wait another 30 years and let Mother Nature do it herself……)
Good find JK!
From his link above about the Bering Strait currents:
“WHY IS THE BERING STRAIT THROUGHFLOW IMPORTANT?
For the Chukchi Sea
– primary source of nutrients for the Chukchi (one of the most biologically productive regions of the world oceans)
– dominates the water properties of the Chukchi
For the Arctic
– primary source of nutrients for Arctic ecosystems
– melts back sea-ice in summer,
– provides cold waters in winter to stabilize the upper Arctic ocean (thus influencing ice thickness and upper ocean mixing)
– provides ~40% of the freshwater input to the Arctic
– water properties determine ventilation depth of the Arctic
For the World Ocean
– an important part of the global freshwater cycle
– believed to influence the Atlantic overturning circulation
Pacific waters can be traced through the Arctic and out through Fram Strait and the Canadian Archip”
Seems the current experts about arctic currents agree that much/most of the warm water melting arctic sea ice is from the Bering Straits.
The force be with you (Gates, are you switching from the dark side?). CO2 or warming isn’t causing ice sheer. In fact, ships are warned about this mirage. Do not think that these openings are signs of melt, lest you get caught in one that closes and traps your ship. This is what seductively opens up fake shipping lanes and then traps you, as Gates so kindly mentioned:
http://www.aari.nw.ru/clgmi/forecast/show_drift.asp?fign=0&lang=0