By Steve Goddard
I like to watch the sea ice graphs as much as anyone, and have wondered how much value they have in forecasting the summer minimum. So I researched it a bit and discovered that their predictive power this early in the melt season is very poor. The DMI graph below highlights the problem:

http://ocean.dmi.dk/arctic/icecover.uk.php
Note that 2006 had the highest summer minimum, yet was lowest most of the winter and through part of the spring. The graph below shows the rsquared correlation between relative monthly ranking and September ranking, and indicates poor correlation prior to August 1.

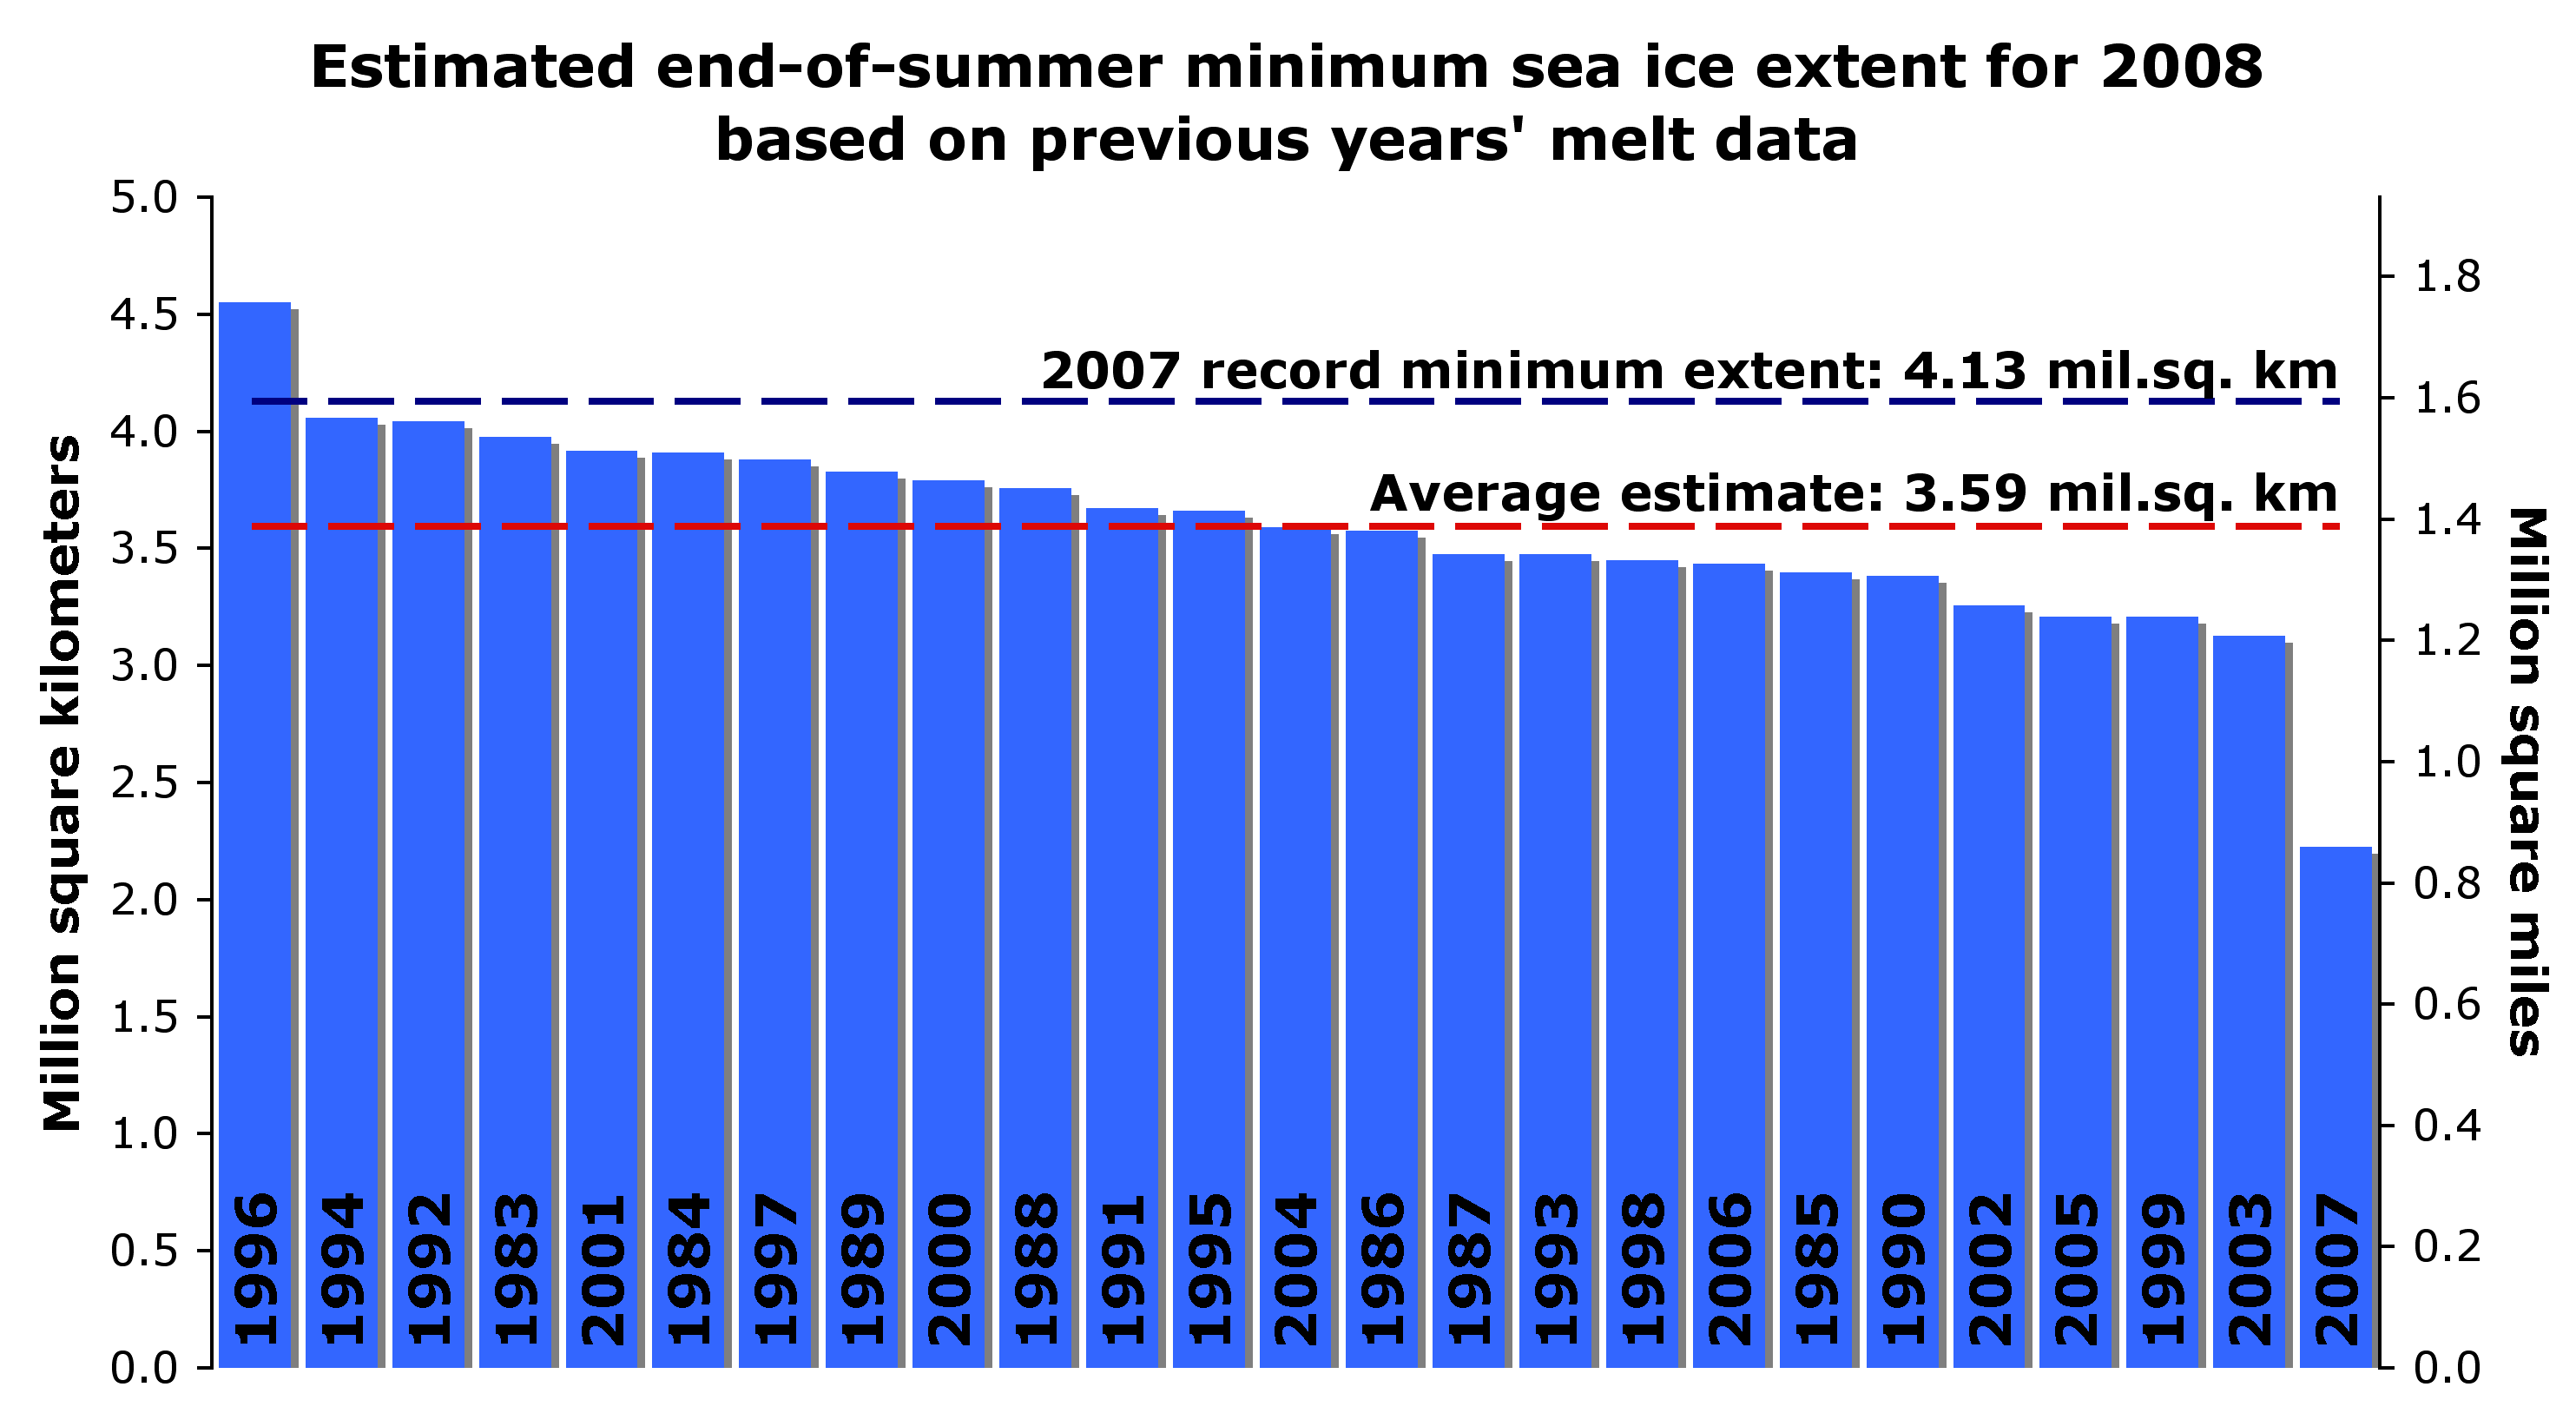
Conclusion: Prior to August 1, the graphs tell us just about nothing about how the summer minimum is likely to turn out. The fact that April, 2010 had the highest extent in the DMI record tells us little or nothing about the summer minimum. There are too many dependencies on ice thickness and summer weather to make a meaningful prediction based solely on the extent graphs. NSIDC has used other methods of prediction, and done poorly – such as this forecast of a record low made in May, 2008.

http://nsidc.org/images/arcticseaicenews/200805_Figure4.png
The Barrow Ice Observatory has studied the relationships between cloud cover and ice breakup date, and found some correlation, seen below. They believe breakup occurs after the ice has received 700 MJ/m² of solar energy. A sunny summer means an earlier breakup date. A cloudy summer means the ice will break up later. The three earliest breakup years occurred in 2002, 2003, and 2004. The last two years were among the latest.

It is also interesting to note how dirty the snow and ice is around Barrow. No doubt this is a contributing factor.

http://seaice.alaska.edu/gi/observatories/barrow_webcam
A curiosity is that May/June and Dec/Jan seem to have the smallest inter-annual variation. These are near maximum and minimum points for insolation, but not temperature. Any speculation on why the variances gets so small?
It is an indicator of wind water currents and cloudiness? So they actual lines are very crooked. It must mean th ice is relevant in terms of general ranges but in detail, ignore it. We also have very few years of estimates gathered.
Gary
In June, the amount of ice is tightly constrained by the land surrounding it in the Arctic Basin and Hudson Bay.
“Any speculation on why the variances gets so small?”
I’ll take a stab at it Gary.
Even though there can be differences in max and min, when you look at the big picture…
……..they don’t mean squat
“It is also interesting to note how dirty the snow and ice is around Barrow”
Dirty how, and dirty why?
Is all arctic ice so dirty?
Local dirt, or transported dirt?
Looks like local dirt.
Ice breakup also depends on wind direction and strength. I witnessed a strong downslope wind clearing the ice from Northstar Bay and Wolstenholmfjiord at Thule in a few hours in July 1962.
I used to live in Boston and had a driveway to keep clear in the winter. Shovel early, shovel often.
Solar effects are very significant — get enough snow off the driveway that sun can get through the rest and warm the asphalt, and you’ll have dry pavement shortly after the next decent sunny hour or two. Just need to make sure meltwater from elsewhere doesn’t run across the cleared patch — it will freeze into a thin skating rink overnight.
If there’s dirt & sand mixed into the snow (common among crap kicked up by plows), it tends to concentrate on top of snow as the snow melts, which in turn accelerates the melting as it concentrates. I imagine you’ll get the same effect from soot.
What happened to albedo and water temp as factors. The AGW theorists used the reduced albedo in 2007 to predict increased ocean warming and the death spiral for arctic ice. I guess if it doesn’t spiral down inexorably, then it doesn’t spiral up either with increased extent. Perhaps there is some correlation of melt slope and freeze-up slope with El Nino-La Nina? What do you think, Steve?
The Next Big Thing to look for is what hapens at that second time tick in June – the summer solstice. That’s when the potential insolation for the high latitudes will be at maximum and the albedo effect most critical for the Arctic Ocean. So far on this record there has been little change at that stage from year to year. If there is a major departure one way or the other over the next two months the ocean surface will be receiving significantly more (less) solar radiation.
Caveats: There are obvious uncertainties in the ice cover numbers as given, and even after the radiation hits the water intricate feedback loops come into play.
That the maxima and minima have little correlation with each other is obvious once one notices that around 1 June, all years are very tightly bunched together. On the 1st of June, there is very little difference in ice extent from one year to another regardless of what the current year’s maximum extent was or what the prior year’s minimum was. In short, the graphs have absolutely no predictive skill at all, they are simply a reflection of what was and what is, not any indication of what things will be.
In fact, 15% ice extent is more an indication of storms rather than temperature. The more storms you have, the more the ice can get broken up and scattered. This can increase the 15% extent figure while actually breaking up the ice pack. The DMI 30% number is, in my opinion, a more accurate indication of the health of the ice pack and that number even more tightly bottlenecks at around 1 June than the 15% number does.
http://ocean.dmi.dk/arctic/icecover.uk.php
So why is the snow so dirty?
I wonder what thet hump is in june, in the JAXA plot. DMI doesnt have the june-hump.
It is also interesting to note how dirty the snow and ice is around Barrow. No doubt this is a contributing factor.
Watching the webcam video series (recommended), you can see the snow gets a lot dirtier when the underlying dirt roads start to come open due to plowing or spring melt. Don’t have that problem in Houston because all our roads are paved.
Gary says:
A curiosity is that May/June and Dec/Jan seem to have the smallest inter-annual variation. These are near maximum and minimum points for insolation, but not temperature. Any speculation on why the variances gets so small?
Those are the nodes between the high and low points on the curve. To change the nodes much within our fixed one-year oscillation frequency, you’d have to shift the max and min ice dates, or alter the slope of the curve between max and min.
Nice post Steve. Like any season of the year, each arctic ice season can be considered as weather, not climate, and the character of any individual melt season can’t be predicted from short term seasonal charts. However, longer term charts do have more robust predictive value, especially when used in combination with highly refined sea ice models. I would direct readers attention to three specific web sites. First, my favorite chart for looking at the long term state of arctic sea ice:
http://arctic.atmos.uiuc.edu/cryosphere/IMAGES/sea.ice.anomaly.timeseries.jpg
If you study this graph you do see the longer term downtrend in arctic sea ice. This is predicted by AGW models, however, some of those models predicted sea ice gone by 2100 or so, and that date has been moved forward to between 2030 and 2050. But models do not predict the exact sea ice extent for any given year– despite the pronoucement by one scientist of an ice free arctic by 2013. The “recovery” of the arctic sea ice in 2008/2009 was encouraging, if that was all that one looked at. Though no direct link as been found, I would relate this quasi-recovery almost entirely to:
1. The La Nina of that time period
2. The long and deep solar minimum of that same period
But more predictive of long term arctic sea ice is the volume of ice present, not extent. As we’ve seen from March’s “bump up” in extent, followed by a similar “bump down” in April-May, sea ice extent is highly variable. But volume, which measures sea ice in three-dimensions is far more important a predictor of future sea ice conditions, and the best chart we currently have for that is here:
http://psc.apl.washington.edu/ArcticSeaiceVolume/images/BPIOMASIceVolumeAnomalyCurrent.png
Yes, this is a model, but if you read the page it explains the validity of the model, and while I think it has some minor flaws, I do think it is telling the general direction of arctic sea ice volume very well. Such negative volume anomaly shows that the predictions of general arctic sea ice models of declining arctic sea ice year-to-year seem to be valid. For more on the best of the sea ice models. go here:
http://oceans11.lanl.gov/trac/CICE
So in general, Steve is quite right, this years sea ice chart early in the melt season has very little predictive value for where we’ll be at September’s minimum, but my prediction of 4.5 million sq. km. based on IJIS/JAXA (less than 2008/2009 but more than 2007) is not based on the current chart, but is based on:
1. The end of the solar minimum
2. The negative AO index that brought warm temps to the arctic this winter and kept multi-year ice relatively thin (lower volume). Areas such as the Barants sea were especially warm this winter, and that is of course, exactly where we’ve seen such a dramatic melt already this spring.
3. The general declining arctic sea ice volume on a historic basis (as shown in the chart referenced above.
The fact that we are currently below 2008 & 2009 means nothing and wasn’t the basis for my prediction as I made my prediction of the 4.5 million sq. km. summer low during the March “bump” up, when the 2010 ice was way more than 2008/2009 levels for the same period…
I am curious as to why the graph was ammended to exclude the 2003 maximum that shows up in the original graph available from [url=http://www.ijis.iarc.uaf.edu/en/home/seaice_extent.htm]IJIS[/url] it gives the appearance that 2010 had the highest ever maximum but it is surpassed by 2003.
graph
[url]http://www.ijis.iarc.uaf.edu/seaice/extent/AMSRE_Sea_Ice_Extent.png[/url]
So the real question is…what drives Arctic cloud cover? It appears to be another indicator that Roy Spencer is right: it is the cloud cover that is in control of the temperature and ice, not the temperature controlling the ice and the cloud cover, as most of the AGW crisis climate community insists.
We need to learn more about cloud cover and what regulates it. More specifically, we need to determine a mean cloud cover for regions and the globe, then determine the factors that make it more or less cloudy. Initially, it seems likely that it is the ever present ocean circulations that are driving cloud cover, with perhaps a cosmic ray factor involved.
Quick question. When you look at the IJIS graph then there is a little blip just before the start of June where the extent of sea ice increases for a short time. Can anyone tell me why this is?
Steve – below is your March 31, 2010 post. I may be getting the wrong impression, but you certainly seemed more positive about this data set when the graph was going up. Time will tell what the minimum ice extenct will be for 2010 and, as the NSIDC trend shows, it will most likely indicate a minimum extent well below the 1979-2000 marker used by the study.
Arctic Sea Ice about to hit ‘normal’ – what will the news say?
By Steven Goddard and Anthony Watts
Barring an about face by nature or adjustments, it appears that for the first time since 2001, Arctic Sea ice will hit the “normal” line as defined by the National Snow and Ice Data Center (NSIDC) for this time of year.
NSIDC puts out an article about once a month called the Sea Ice News. It generally highlights any bad news they can find about the disappearance of Arctic ice. Last month’s news led with this sentence.
In February, Arctic sea ice extent continued to track below the average, and near the levels observed for February 2007.
But March brought good news for the Polar Bears, and bad news for the Catlin Expedition and any others looking for bad news. Instead of ice extent declining through March like it usually does, it continued to increase through the month and is now at the high (so far) for the year.
If it keeps this trend unabated, in a day or two it will likely cross the “normal” line.
stevengoddard says: “…In June, the amount of ice is tightly constrained by the land surrounding it in the Arctic Basin and Hudson Bay.”
Duh.
Arctic Sea-ice melt makes no difference to sea-level but has now for some years become the flag waver for ‘proving’ Global Warming and quite illogically used as a popular ‘proof’ that it is all man made. But this is one of several hostages to fortune that can be found in the tabloid science of Global Warming hysteria. As normal fluctuations produce upswings as well as downswings in the extent of Arctic ice public scepticim will grow.
But be warned. The AGW crowd already have their excuses all prepared. If Arctic ice shows another uptick this year it will all be down to the Iceland volcano. Without that volcano there would have been so much less ice and we would all have been so much warmer, honest.
crosspatch
If the maximum is related to cold winter temperatures. then it will also affect the minimum – because the ice will be thicker. The fact that area is fairly constant in June doesn’t tell you anything about thickness.
DMI (30%) and NSIDC (15%) are tracking each other very closely.
u.k.(us)
I flew over Greenland during the late summer 2007 Armageddon, and the ice was filthy for many miles on the western side. Dirty snow/ice plays a big part in Arctic melting.
Winter sea ice extent has NOTHING to do with the end-of-summer ice extent. Scientists who work on sea ice have known this for years. Nice to see Steve finally realizes it as well. So then what’s up with the constant postings that the ice is recovering when you realize that it doesn’t depend on the winter ice extent?
That is the dirtiest I have seen the snow around Barrow. Wonder if the volcanic eruption in Iceland has resulted in more soot deposited this spring. Could also be related to earlier snow melt over the land and winds transporting dust over the ice. Either way, dirty snow speeds up melt…
Steve, there are several papers that discuss sea ice prediction and what variables give the most predictive skill. Winter ice extent is not one of them. Ice thickness and summer circulation patterns remain the main drivers defining the September ice extent, and since summer circulation patterns cannot be well-predicted, there really is no way of knowing right now what the summer ice extent will be. But model simulations do show that as the ice cover continues to thin, summer circulation becomes less important as a predictor variable. Might be good in your post to discuss some of these factors and reference some of the papers written on this topic…
“A sunny summer means an earlier breakup date. A cloudy summer means the ice will break up later.”
Nah, couldn’t be. That would actually follow known laws of physics. For which 23 different models (showing the science is settled) is not required.
It has to be the result of more CO2 trapping emitted radiation and bouncing it back down to the ice, sorta like a laser bounces light between two parallel mirrors until it builds up sufficient power to blast through the partial mirror end. The ice has to heat up to eventually get the radiation past all that CO2 and into the vast blackness of space. Ice can only heat up so much, then it must melt (something about properties of water ice, melting point, etc).
But to attribute this to increased incident solar radiation (insolation, or “sunny summer”), and less albedo (“cloudy summer”) is just far too speculative.
(/sarc)
There. I feel better now.
GeoFlynx
My expectations for the summer minimum haven’t changed.
Sea-ice extent graphs are not predictive. They are observational records,as Crosspatch points out. Why should they have any predictive value?
Mining that graphic from the NSIDC May 2008 press release is not very illuminating; in its actual context it was not presented as a hard prediction,but more as a discussion point,a ‘simple estimate’. Two actual model projection projects were then discussed,the second of which [fromUW’s Applied Physics Laboratory] was on the money. The press-release was headed: “Arctic sea-ice forecasts point to lower-than-average season ahead”. Which is very much how it panned out.
If you want to discuss prediction,why not look at various groups modelling projects?
stevengoddard says:
May 15, 2010 at 4:37 pm
u.k.(us)
I flew over Greenland during the late summer 2007 Armageddon, and the ice was filthy for many miles on the western side. Dirty snow/ice plays a big part in Arctic melting.
=========
O.K. agreed I guess.
How far off might a long warming trend throw off the ice core timeline.
What about the Arctic “wind flushing”.
Did you fly over Greenland during the cooling scare of the 70’s.
Nothing personal, i’m just sick of this never ending AGW hype.
My comment came out wrong, not sure what i was trying to say.
stevengoddard says:
“My expectations for the summer minimum haven’t changed.”
————–
Steve,
On what do you base your prediction, and exactly what is your prediction for summer minimum arctic sea ice? (please specify which data set you will base in on)
There is a long-term trend of decreasing sea ice in the Arctic even if it does proceed chaotically. We have satellite records that show a steady decline of summer ice cover since 1978 when the records first became available. This is all part of Arctic warming that has been going on for well over a century now. Kaufman et al. (Science 325:1236-1239) have pinned its beginning down to the start of the twentieth century. It started very suddenly after a two thousand year cooling trend, paused for a few decades in mid-century, and has continued on to this day. Contrary to the AGW dogma it cannot be caused by the greenhouse of effect because of its sudden beginning. That is because laws of physics demand that carbon dioxide partial pressure has to jump when a sudden warming occurs, and this simply did not happen. We need a physical process that can suddenly deliver warmth to a large geographical area of the Arctic, one that is capable of retracting as happened in mid-century, and then continuing on as before. The only possible way to accomplish this is through a rearrangement of the North Atlantic current system to direct warm water to the Arctic. Satellite views show that the Gulf Stream today carries huge amounts of warm water to the the Arctic and thereby keeps Russian Arctic ports ice free. It is likely that it assumed this northerly course at the turn of the century when Arctic warming began. Smaller amounts of warm water enter the Western Arctic Ocean through the Bering Strait. Usually that is enough to keep the Chuckchi Sea, just north of the strait ice free, but it may extend to the north coast of Alaska, depending upon the pattern of winds in the area. The big melt of 2007 was all on the Bering Strait side of the ocean, implicating warm water coming through the strait as the culprit. Together these currents are sufficient to explain all observations of Arctic warming and thereby make any greenhouse theories of warming doubly superfluous.
Stevie baby…
Let’s talk.
Solar rays and cloud cover DO have a factor. The angle of the planet to the sun and the solar rays would mean that the distance through the atmosphere would be MUCH greater. Unlike at the equator where the sunlight is just about perpendicular to the planet.
R. Gates
Same criteria I based it on when I made the forecasts. Main factors are the retention of multi-year ice this winter due to the negative AO, and the cold water in the North Pacific.
Barrow looks like that all year round (muddy and mud-splashed). It’s got lots of gravelly soil, not much asphalt, and when you plow it in to heaps like that you’re going to pick up some dirt with it. During the thaw there’s no shortage of muddy slush.
Sea ice will sometimes be pushed ashore and it (what I’ve seen) tends to be typical of coastal sea ice – grounded ice will pick up some inclusions. Ice in shorebreak (when it exists) is churned into a muddy soup and refrozen, adding to the mix.
I generally agree with you, Steve. But I’d back it up to July 1 rather than August 1. I look at the last few years and July 1-July 15 has some value, I think.
I’ve said it a few times in the last month or so. . . but I think ice concentration in the “core” as shown in the comparative tool at Cryosphere is much more indicative of eventual minimum at this time of year. We’ll see if that stays true this year –but I’m betting it will.
What we know is that areas outside the core are going to melt. They just are. To the degree they have predictive value, it could be those areas that are natural exits to the south. To the degree those areas are gummed up with higher concentrations during early melt season they could delay the exit of some ice and contribute to a higher minimum.
But outside of that, from Spring Max to July 1 I’m sitting on the concentration values of the core as the most important indicator of eventual Fall minimum.
Still sitting on 6.0-6.2M minimum.
Plane falls through High Arctic ice
The passengers, who were conducting a scientific survey in the High Arctic, spent about two hours on the ice before they were rescued.
Read more: http://www.cbc.ca/canada/north/story/2010/05/11/borek-plane-arctic.html#ixzz0o4A4aBQI
I did a phase plot of the sea ice extent. What I found was that there is no correlation between the maximum extent and minimum extent as stated in the initial post. However, there is a way to predict the minimum extent a few months in advance. Between the points of 10e6 and 8e6 sqkm, high derivatives lead to low minimum extents. It’s a pretty easy thing to do. Just plot dA/dt vs. A and take a look at what happens when A ~= 9e7 sqkm.
“When you look at the IJIS graph then there is a little blip just before the start of June where the extent of sea ice increases for a short time. Can anyone tell me why this is?”
I don’t know but the first place I would look is how sea ice extent is calculated. I vaguely remember it’s the sum of those areas that have more than 15% sea ice. If so that knuckle (or bump as you put it) might be sea ice breaking away from the main ice and covering a larger area for a short period of time. So it might not be “more ice” but the same amount of ice over a larger area.
Steve,what retention of MYI are you talking about? What ice age category? Because the ice 5 years or older actually declined even further this winter, and the 2nd and 3rd year ice that was advected into the Beaufort Sea this winter is likely not going to survive the transit through the Gyre. What exactly are you basing your prediction on? Doing some hand-waving? Statistical correlation analysis? Running a physical coupled atmosphere-ocean model? I would love to know what you use to back up your statements. Scientists could not make base their predictions on the negative AO and MYI ice cover. Data has shown again and again that it doesn’t work.
Bill says:
May 15, 2010 at 1:22 pm
I used to live in Boston and had a driveway to keep clear in the winter. Shovel early, shovel often.
…I imagine you’ll get the same effect from soot.
Or volcanic ash?
Is it dirty because of the increased droppings of the polar bear population?
skye
Given that essentially all of the first year ice disappeared in 2007, any third grade math student can figure out there isn’t much four year old ice in 2010. But there is a lot of multi-year ice on the Alaska side which wasn’t there during the last two years.
http://nsidc.org/images/arcticseaicenews/20100406_Figure6.png
September will come soon enough. Please save the spin.
u.k.(us) says:
May 15, 2010 at 1:05 pm
“It is also interesting to note how dirty the snow and ice is around Barrow”
Dirty how, and dirty why?
Is all arctic ice so dirty?
Local dirt, or transported dirt?
Looks like local dirt.
________________________________________________________________________
No it is not local dirt. It is soot from the Chinese coal fired generators. I have a friend in Alaska who about fou/five years ago was complaining about the amount of SMOG now seen in Alaska blowing in from China.
“From 500 miles in space, satellites track brown clouds of dust, soot and other toxic pollutants from China and elsewhere in Asia as they stream across the Pacific and take dead aim at the western U.S.
A fleet of tiny, specially equipped unmanned aerial vehicles, launched from an island in the East China Sea 700 or so miles downwind of Beijing, are flying through the projected paths of the pollution taking chemical samples and recording temperatures, humidity levels and sunlight intensity in the clouds of smog.
On the summit of 9,000-foot Mt. Bachelor in central Oregon and near sea level at Cheeka Peak on Washington state’s Olympic Peninsula, monitors track the pollution as it arrives in America.
By some estimates more than 10 billion pounds of airborne pollutants from Asia — ranging from soot to mercury to carbon dioxide to ozone — reach the U.S. annually. The problem is only expected to worsen: Some Chinese officials have warned that pollution in their country could quadruple in the next 15 years….
“East Asia pollution aerosols could impose far reaching environmental impacts at continental, hemispheric and global scales because of long-range transport,” according to a report earlier this year in the Journal of Geophysical Research. The report said that a “warm conveyor belt” lifts the pollutants into the upper troposphere — the lowest layer of Earth’s atmosphere — over Asia, where winds can bring it to the U.S. in a week or less….”
Read more: http://www.mcclatchydc.com/2008/08/31/51148/scientists-fear-impact-of-asian.html#ixzz0o5c2E5ed
Paul Nottingham,
read http://www.ijis.iarc.uaf.edu/en/home/seaice_extent.htm please. They describe it very well in “Method for calculating sea-ice extent”.
I should have added to my above post that I am talking about sea ice and wilderness snow cover that would not be effected much by local human activity.
“Is it dirty because of the increased droppings of the polar bear population?”
Yeah. Global warming scares the poop out of them.
stevengoddard says:
May 16, 2010 at 3:59 am
skye
Given that essentially all of the first year ice disappeared in 2007, any third grade math student can figure out there isn’t much four year old ice in 2010. But there is a lot of multi-year ice on the Alaska side which wasn’t there during the last two years.
http://nsidc.org/images/arcticseaicenews/20100406_Figure6.png
September will come soon enough. Please save the spin.
Indeed it will. We know where that MY ice came from, it’s drifted from the Canadian shoreline where the oldest ice always accumulated. The trouble is that it’s broken up over the last few years and become more amenable to drifting, and is being replaced by one and two year ice, hence the dramatic reduction in ice volume. The Arctic sea ice is becoming seasonal like the Antarctic sea ice.
This movie shows the breakup starting in late 2007, similar breakup is causing that tongue of ice north of Barrow that you showed.
http://ice-glaces.ec.gc.ca/content_contenu/SIE/Beaufort/ANIM-BE2007.gif
If there is another SEARCH Sea Ice Outlook competition this year, we will be able to see how the experts are doing (last years answer: very badly).
The prognosis of NSIDC-personnel in AUGUST 2009 (for September 2009) was 4.7 millions square kilometers.
As one can see here:
http://www.arcus.org/search/seaiceoutlook/2009_outlook/full_report_august.php
(click on Meier et al)
they tried to “apply statistical averages of rates of decline” and failed because they “took into account the nature of younger ice”.
Gail Combs says:
May 16, 2010 at 4:07 am
No it is not local dirt. It is soot from the Chinese coal fired generators.
You mean to say soot might be melting the ice and not massive AGW???
Let’s see wood stoves, coal burning, diesels generators(electricity in northern communities), vehicles (planes, trains, and automobiles), forest fires, volcanoes, fires, explosives, controled and uncontroled burns, grass fires, oil well fires…hmmm.
Now let’s see..winds carry soot so far (unless an up draft can carry them further),but water particulates in clouds can carry them much further before depositing them.
Black absorbs more solar heat…hmmm.
The science says, you could be right.
But it is not peered reviewed or published so… sorry you lose.
It is therefore incorrect!
kwik says:
May 15, 2010 at 2:16 pm
I wonder what thet hump is in june, in the JAXA plot. DMI doesnt have the june-hump.
++++
This is a perennial question that comes up many times every year at this time. NSIDC has an algorithm they apply from June to October or November (I forget which) that takes into account the fact that puddles of water on top of the melting ice make it harder for the satellite to tell what is open water and what is ice. So during that period they make an adjustment to allow for it, and when they turn it on and turn it off again it causes a blip up in June and a blip down later on when they quit doing it.
Has Phil given us his prediction for 2010 minimum yet, or is he just doing his braying jackass impersonation re any barndoor in sight?
stevengoddard says:
May 15, 2010 at 8:45 pm
R. Gates
Same criteria I based it on when I made the forecasts. Main factors are the retention of multi-year ice this winter due to the negative AO, and the cold water in the North Pacific.
——————–
Fair enough…though I of course disagree on how strong of influence those will be as multi-year ice has less volume than it hjstorically has. And what is your forecast for the summer low sea ice extent in September in millions of sq. km. (greater or less than 2009?) and which data set will you use?
I don’t think anybody at WUWT is foolish enough to predict the Arctic summer sea ice minimum extent will be larger than average, whether the average is from 1972-2008:
http://iup.physik.uni-bremen.de:8084/amsr/ice_ext_n.png
or 1979-2000:
http://nsidc.org/images/arcticseaicenews/20091005_Figure2.png
The big question is: will the minimum extent be greater than in 2009 ?
If it is, I expect most people at WUWT will trumpet this as a full recovery of Arctic sea ice. If not, I expect they will dismiss it as insignificant.
My prediction: it will be less than in 2009.
And if the CryoSat-2 data is in by the summer minimum, showing that the Arctic ice volume continues to shrink as expected:
http://psc.apl.washington.edu/ArcticSeaiceVolume/images/BPIOMASIceVolumeAnomalyCurrent.png
I expect most people here will dismiss it as not being correctly calibrated yet. Or fundamentally flawed. Or manipulated data.
My prediction: the first CryoSat-2 data will show the Arctic ice volume continues to trend down.
This is why Arctic sea ice is the most interesting of the climate change arenas – arguing about the climate in 2100 might be important for government leaders and corporate planners, but few if any of us reading today will be around to see it.
But the Arctic sea ice minimum this September ? You’d have to be pretty unhealthy/unlucky not to be around to see that.
Here’s hoping everyone here will be around come October.
“Anu says:
My prediction: the first CryoSat-2 data will show the Arctic ice volume continues to trend down.”
The satellite will be in orbit for only a few years and cannot therefore establish a climatic trend (about 30 years necessary).
As Polar 5 showed last year, the thickness of the ice is not well known (was up to twice as thick as thought). Therefore the published volumes are not much more than guesswork.
The volume is only being discussed because the extent did not do as wished.
Alexej Buergin, May 16, 2010 at 11:56 am:
“The volume is only being discussed because the extent did not do as wished.”
Yes. And the Arctic ice extent is only being discussed because the Antarctic is not doing as they wish.
And the current natural fluctuation is only being discussed because the Arctic has been ice free repeatedly in recent, pre-SUV times.
And sea ice is only being discussed because hurricane frequency and intensity have diminished, not increased as repeatedly predicted by the alarmist crowd.
And because the coral bleaching turned out to have nothing to do with CO2.
And because sea level rise is at or below normal.
And because Himalayan glaciers are not receding as predicted.
And because ocean “acidification” is another failed prediction.
And because there is no real world evidence that CO2 has anything to do with the either planet’s temperature or local climates.
And because CO2 is highly beneficial; more is better.
And because rather than CO2 causing warming, CO2 is the result of warming.
And because the ARGO buoys show that the deep ocean is cooling, not warming as predicted.
And because warm is beneficial, while cold kills.
Alarmist scientists and their cognitive dissonance-afflicted followers tell lies because the government pays the scientists to tell lies; the followers are what used to be known as useful fools.
So now the alarmist contingent has just one scare story left: temporarily decreasing Arctic ice. Every other scare has been debunked, and the Arctic ice scare will be debunked within a couple more years, if not this year.
The bought and paid for climate industry has cried “Wolf!” long enough. They have lost their credibility. And the Arctic ice cover scare is not going to bring it back.
Anu
The Arctic will be ice free before 1980
https://docs.google.com/viewer?url=http://wattsupwiththat.files.wordpress.com/2008/07/nyt_arctic_77442757.pdf
Anu says:
May 16, 2010 at 10:04 am
The big question is: will the minimum extent be greater than in 2009 ?
Anu, if it gets larger than 2009, I think you can agree on the following;
-There is no death spiral.
-The world isnt going under.
-Gordon Browns 50 days until the tipping point was just another AGW foolishness.
-The arctic ice coverage is doing its cyclic thing, now probably going up for a while.
-Al Gore and Stoere made fools of themselves in Copenhagen.
Agree?
Anu says:
May 16, 2010 at 10:04 am
The big question is: will the minimum extent be greater than in 2009 ?
If it is, I expect most people at WUWT will trumpet this as a full recovery of Arctic sea ice. . . .
++++
Anu, this is the most gross strawman I’ve seen at WUWT in some time. Please provide some evidence/context for this claim. There have been a lot of articles at WUWT on Arctic sea ice over the last few years, and since the 2007 minimum –so you should have a target rich environment to prove your claim. Please provide even one article that used the modifier “full” or comparable modifer in this context.
Yes, yes. . . I know. You won’t believe in any kind of “recovery” until it is “full” or nearly so. But so far as I can tell, you’re projecting on that issue, and no WUWT article has claimed “full” recovery for 2008 or 2009. . .nor any suggestion that further increase in 2010 would constitute “full” recovery. My prediction for 2010 is higher than Steve and Anthony’s, yet I wouldn’t (and haven’t) suggested, let alone stated, that it would constitute “full” recovery (and I’m not a WUWT contributor of articles anyway).
So put up or retract your claim. What is your basis in actual history of WUWT articles on Arctic sea ice that would lead any reasonable fair-minded person to believe that WUWT would claim “full recovery” of Arctic sea ice if 2010 extent minimum is higher than 2009?
stevengoddard says:
May 16, 2010 at 1:40 pm
Anu
The Arctic will be ice free before 1980
https://docs.google.com/viewer?url=http://wattsupwiththat.files.wordpress.com/2008/07/nyt_arctic_77442757.pdf
Thanks Steven, interesting article.
Personally, I wouldn’t call Colonel Bernt Balchen, “polar explorer and flier” (and at the time retired from the Air Force and working for General Dynamics) an expert on Arctic sea ice trends, even in 1969 – and he was the only one in the article proposing that the “ocean at the North Pole may become an open sea within a decade or two.” But it is nice to see how quaint the writing from that era sounds today : the use of giant computers to simulate the world’s weather patterns to see what would happen when the Arctic Ocean is free of ice, and actually spelling out carbon dioxide all the time.
I think the Rand Corporation research (see the chart) showing how important the heat from the Gulf Stream currents in the Atlantic is to melting ice in the Arctic is still accurate – all the talk here about “Arctic surface temperatures – above the ice – being constant for x decades” misses the point of the warming oceans beneath causing the downward trend of Arctic summer sea ice. The sea ice is melted from both above and below. This ocean warming is also causing the overall thinning – the decreasing sea ice volume over the recent decades.
Smokey says:
May 16, 2010 at 1:24 pm
Smokey, sir, you are a pseudoscientific prostitute and an idiot.
Anu,
I provided seventeen links and citations to support my comments. Your emotional response amuses me.☺
Anu says:
May 16, 2010 at 6:39 pm
Smokey says:
May 16, 2010 at 1:24 pm
Smokey, sir, you are a pseudoscientific prostitute and an idiot.
================================
Do you have to pay extra for a: pseudoscientific prostitute.
Or does a liberal vote get you the rebate.
geo says:
May 16, 2010 at 5:47 pm
I’m glad to see you scrutinize every single word of my Comment – I could use a good editor, especially on Comments in which I am interrupted by my children. Perhaps “full” was the wrong adjective; I should have used “great” or “strong” or “promising”:
http://wattsupwiththat.com/2008/10/22/sea-ice-approaching-the-edge-of-normal-standard-deviation/
http://wattsupwiththat.com/2009/02/03/arctic-sea-ice-increases-at-record-rate/
http://wattsupwiththat.com/2010/03/31/arctic-sea-ice-about-to-hit-normal-what-will-the-news-say/
(search for “recovery” to see these adjectives in use)
Or perhaps I should have said people will claim Arctic sea ice is back to “normal” – as in this thread:
http://wattsupwiththat.com/2010/04/27/wuwt-sea-ice-news-2/
But I’ll keep in mind that “recovery” means “partial recovery” at WUWT, not “full recovery”.
I still think the actual value of this summer’s minimum sea ice extent in million km^2 is of less importance than the big question: will this value be greater than in 2009 ? If it is, I expect most people at WUWT will trumpet this as a
fullgreat/strong/promising recovery of Arctic sea ice.Smokey says:
May 16, 2010 at 6:57 pm
Anu,
I provided seventeen links and citations to support my comments. Your emotional response amuses me.☺
Well, I stand corrected.
I expected the Moderator would snip that comment, as I argued here:
http://wattsupwiththat.com/2010/05/13/now-its-lizards-going-extinct-due-to-climate-change/#comment-39058
Congratulations, you’re being treated like an actual scientist.
kwik says:
May 16, 2010 at 3:50 pm
Anu says:
May 16, 2010 at 10:04 am
The big question is: will the minimum extent be greater than in 2009 ?
Anu, if it gets larger than 2009, I think you can agree on the following;
Shouldn’t it be “we can agree on the following” ?
-There is no death spiral.
Death spiral delayed a bit – ok.
-The world isnt going under.
You mean ocean levels ? I think those problems are many decades away – 8 or 9, and at first will just be inconveniences for coastal cities. Nobody cares about tiny islands going under (except the people living there). I bet insurance companies are very interested in this stuff…
-Gordon Browns 50 days until the tipping point was just another AGW foolishness.
I don’t follow British politics – but I do read the Guardian online once in awhile.
-The arctic ice coverage is doing its cyclic thing, now probably going up for a while.
I would look at this more closely – I would probably read more about PDO and ocean warming, currents, oscillations.
-Al Gore and Stoere made fools of themselves in Copenhagen.
You must read a lot of “news” – I don’t even know Stoere. Didn’t follow Copenhagen too closely, since it was DOA.
Agree?
As stipulated above, sure.
And if it’s lower than 2009 ?
Would you agree that there is a “gentle death slope” with annual random weather superimposed on the trendline ?
And here’s a nice image of the Arctic ice, updated daily:
http://nsidc.org/data/seaice_index/images/daily_images/N_bm_conc.png
Stay tuned.
kwik says:
May 16, 2010 at 3:50 pm
I forgot to include the “gentle death slope” graph:
http://nsidc.org/images/arcticseaicenews/20091005_Figure3.png
Seriously, I think the “death spiral” idea is about when the thinning ice meets the warming ocean one summer, and the sea ice extent shrinkage falls off its linear downslope. I’m waiting for CryoSat-2 data to show where things stand this summer…
and the PIOMAS graph is getting outdated:
http://psc.apl.washington.edu/ArcticSeaiceVolume/images/BPIOMASIceVolumeAnomalyCurrent.png
There’s a small chance 2010 could bounce up to lower than 2006 before dropping below the trendline again in 2011, but I’ll stick with my prediction of 2010 < 2009.
R. Gates, I believe this is the official WUWT CAGW (Centre for the Arctic by Goddard and Watts) forecast: “Steven Goddard writes below that he agrees with the prediction I made in late 2009 that we’d see another 500,000 km2 of Arctic sea ice recovery in 2010”.
Of course, no mention of any data set, but I guess they mean the one by IARC-JAXA as it is the only dataset they show in the right hand bar. That would come down to a minimum extent of around 5.75 million square km.
I’ll go for a minimum sea ice extent of less than 5 million square km. If the El Niño dies quickly we might get some prolonged periods of clear skies. But anything can happen.
Ice minimum extent has (up to now) never increased 3 years in a row, so if 2010 is a bit smaller than 2009 is not of great importance. The question is: Is there a trend towands zero in the next few years, or towards normal.
[snip]
I protest against Anu’s use of words like prostitute or idiot; that is not nice.
Alexej Buergin says:
May 17, 2010 at 2:16 am
Ice minimum extent has (up to now) never increased 3 years in a row, so if 2010 is a bit smaller than 2009 is not of great importance.
++++
That’s true. However, the anomalous nature of 2007 shouldn’t be ignored, and contributes to the possibility of creating an anomaly on the rebound.
What the AGWers *should* be arguing is that even a modest third year rebound will merely return Arctic ice decrease to around the downward linear trend before 2007. But so many of them seem wedded to the “worse than we thought!” meme, that they just can’t bring themselves to do it.
It seems to me that a carbon dioxide enhanced greenhouse effect would show up as a reduced tendency for arctic-ice to form in the winter because less heat would be escaping to outer-space. We do not appear to be seeing this.
On the other hand, black-carbon surface soot on the ice-pack might cause what could be called an ‘asphalt effect’ which would, conversely, lead to more melting in the summer and perhaps more heat loss in the long arctic night as a result of reduced albedo (reflectivity.) This more closely resembles the arctic ice loss pattern we have seen in recent years.
A study of arctic-ice surface pollution and estimation of the magnitude of any ‘asphalt effect’ should be worth a research grant for someone qualified to do the work.
Alexej Buergin says:
“The question is: Is there a trend [of arctic sea ice] towands zero in the next few years, or towards normal.”
————
No, really, that’s not the question. The question is whether or not there is a downward spiral of arctic sea ice to a summer free arctic over the next several decades AND if that trend is as a result of the build-up of human generated GH gases.
Some of you may want to look at this graph:
http://www.esrl.noaa.gov/gmd/aggi/aggi_2008.fig3.png
And really stop and consider whether some vast left-wing tree Al Gore conspiracy really exists, of if a few scientists made some bad judgement calls, but that underlying all that, CO2 science and physics is pretty solid, and that we are seeing real effects in the Arctic and elsewhere. I myself am not 100% convinced, and probably won’t be until I’m sailing on cruise ship in the open arctic when I’m 80, but I’m about 75% convinced. Finally, if you think that it’s all about the money to be made, consider how much The Heartland Institute is making from their little get together this week attended by our humble WUWT founder. If you don’t think that money flows on both sides of this issue, think again. My suggestion: always go back to the pure science and your own intelligence and put your politics aside if you can…
The amateurs (?) have set the most recent odds of this year’s minimum extent exceeding last year’s at only 30%, as of the last trade on the topic at https://www.intrade.com . It’s easy to enter a bid against them, as I just have.
I see that R. Gates has beamed down from the mother ship to pontificate about the “downward spiral” of Arctic sea ice. As usual, he ignores the Antarctic. Cognitive dissonance will make a person ignore inconvenient facts like that.
Gates’ latest alarmism comes in the form of a chart with a ridiculous y-axis, deliberately intended to make it appear scary. For instance, when a normal y-axis is used, without tiny fractions of a degree, the planet’s temperature doesn’t look so scary. In fact, it looks completely normal.
And after his usual but unbelievable disclaimer about his percentage of skepticism vs alarmism [which in truth is closer to 0% & 100%], our entertaining R. Gates instructs us to put our politics aside – “if you can” – as he proceeds to get political by presuming to know how much profit, if any, that Heartland is making on this conference. Gates gives no numbers, of course, because as with most everything he says, he doesn’t know. He’s just blindly speculating as usual, based on his fact-free beliefs.
R. Gates wants us to think about all the loot he believes is being made, pointing out that “money flows on both sides of the issue.” But that’s not saying anything, since money flows everywhere and all the time on every issue. The real question is: how much funding does each side receive? What is the ratio of alarmist funding versus funding provided to scientists skeptical of Mr Gates’ Catastrophic Anthropogenic Global Warming? The answer explains the rampant corruption in the government climate industry. For every thousand dollars a skeptical scientist receives, an alarmist scientist get a million dollars.
Gates wants us to go back to “pure science.” But skeptics never left pure science; without skepticism, there is no scientific method. It is the alarmists pushing their repeatedly falsified CO2=CAGW conjecture who have abandoned science for politics and pseudo-science. The demonization of CO2 has nothing to do with science, it is simply a means to tax the air. But R. Gates already has his mind made up that “GH gases” are causing the Arctic to go into a “downward spiral” of melting due to AGWT: Anthropogenic Global Warming Thermogeddon.
The fact that the very same gases are not causing melting in the Southern Hemisphere remains unexplained by those afflicted with CD. Mr Gates would rather explain to us instead the immense profits he believes Heartland is making, because that is the alarmist contingent’s latest talking point – and it is much easier than explaining the Antarctic.
Although “Sea Ice Graphs Have Limited Predictive Value”, they are interesting to look at during the long wait for the summer minimum:
http://www.ijis.iarc.uaf.edu/en/home/seaice_extent.htm
Zoom in on the 2010 red line (save it locally, then zoom in): it quickly dropped down past the 2009 curve, then the 2008 curve, then more slowly crossed the 2003 curve, then the 2005 curve. Next up – 2007.
And keep in mind all these curves are way below the 1972-2008 average:
http://iup.physik.uni-bremen.de:8084/amsr/ice_ext_n.png
Alexej Buergin says:
May 16, 2010 at 11:56 am
“Anu says:
My prediction: the first CryoSat-2 data will show the Arctic ice volume continues to trend down.”
The satellite will be in orbit for only a few years and cannot therefore establish a climatic trend (about 30 years necessary).
As Polar 5 showed last year, the thickness of the ice is not well known (was up to twice as thick as thought). Therefore the published volumes are not much more than guesswork.
The volume is only being discussed because the extent did not do as wished.
If CryoSat-2 was the very first data on arctic sea ice thickness, you would be correct, but they have been measuring this for decades with ICESat, submarines and airplanes.
You might argue that the scientific estimate of arctic sea ice thickness (assimilating all known measurements into a model of the arctic sea ice) is not accurate enough for your standards of perfection:
http://psc.apl.washington.edu/ArcticSeaiceVolume/images/BPIOMASIceVolumeAnomalyCurrent.png
but you cannot argue “the volume is only being discussed because the extent did not do as wished.” Arctic sea ice volume is a crucial parameter for understanding this part of the cryosphere, since the ice is so thin (centimeters to a few meters), and satellites like ICESat were being designed back in the 1990’s, which had nothing to do with “sea ice extent did not do as wished” in 2008 or 2009.
As for the aircraft Polar 5, they concluded:
All in all, the ice was somewhat thicker than during the last years in the same regions, which leads to the conclusion that Arctic ice cover recovers temporarily
http://tinyurl.com/yeyxpq4
The “Financial Post” might have thought the sea ice was “up to twice as thick as thought”:
http://network.nationalpost.com/NP/blogs/fpcomment/archive/2009/05/04/lawrence-solomon-deep-arctic-ice-surprises-scientific-expedition.aspx
but the researchers themselves don’t say that.
Unfortunately, airplanes can only measure limited areas of the Arctic, which is why satellites like ICESat and CryoSat-2 are important.
I’d be quite surprised if the PIOMAS model was not already incorporating this April 2009 data, since that’s what it does – incorporate all known measurements of Arctic sea ice thickness. Maybe the Polar 5 data is part of the little blip of ice volume growth in 2009.
Anu says:
May 17, 2010 at 12:43 pm
Although “Sea Ice Graphs Have Limited Predictive Value”, they are interesting to look at during the long wait for the summer minimum:
http://www.ijis.iarc.uaf.edu/en/home/seaice_extent.htm
Zoom in on the 2010 red line (save it locally, then zoom in): it quickly dropped down past the 2009 curve, then the 2008 curve, then more slowly crossed the 2003 curve, then the 2005 curve. Next up – 2007.
++++
Uh huh. And look at 2007 vs 2006 for this date. How’d that work out for their respective extent minimums?
And where did the divergence really begin to show up for those two? July 1, right where I’ve been pointing for several weeks now.
Steve, I don’t know how DMI differs from JAXA; presumably they are both measuring the same planet; but both of them show the 2007 fall minimum coming somewhat later than the 2009 and also the 2008 minimum but not so much. As I recall, the JAXA 2008 minimum came quite a bit earlier than 2007; and then some time later they revised it, and quite changed the shape of the 2008 refreeze.
And of course that was what I had cited that barefoot girl said I was totally wrong on; well it wasn’t my data; I just read the graphs they put out.
As for predicting what 2010 will do; or anything else about it; well I plan to be a spectator, and predict it after the fact. I have no basis for guessing what will happen; and I’m only curiosity interested in seeing what happens; I’m sure it will be different again and I still won’t have any reference as to what the total sea ice mass is; or is doing. I know that is of concern to researchers; and I guess Gaia will run the ice down to where she wants it to be.
I love it when some researcher or maybe it’s a reporter; says that the ice is twice as thick as they thought; or is disappearing twice as fast as they thought;
Why on earth are they thinking it is different from what it is. Why not observe what it is; and then report that; and cut out these faster than we knew silly statements. It is growing just as fast as it is; or now shrinking actually so that is what you should be thinking; not some other numbers.
geo says:
May 17, 2010 at 3:52 pm
Yes, it is not predictive, just interesting.
Interesting that it dropped below four previous years so quickly, and is now poised to drop below 2007.
That’s all.
George E. Smith says:
May 17, 2010 at 4:37 pm
That comment was twice as reasonable as I expected.
This is an interesting video showing Woods Hole researchers, including Sarah Das, in the field studying the melt-water lakes that form on the surface of the Greenland ice-sheet. They observe that these lakes sometimes will suddenly drain through a crack in the ice to the bottom.
It appears that they all believe that man-made global warming is adversely affecting the ice-pack there. Other than simply stating their personal opinions to this effect, however, as far as I can see, they present no evidence that their observations are abnormal, unprecedented, or exacerbated by man.
Paul Nottingham says:
May 15, 2010 at 3:15 pm
Quick question. When you look at the IJIS graph then there is a little blip just before the start of June where the extent of sea ice increases for a short time. Can anyone tell me why this is?
You’ll be pleased to know that JAXA have changed their method so that this no longer happens (they said last year that they were attempting to do so).
“[Updated on May 18, 2010] Previous version of data processing had made an erroneous blip of sea ice extent on June 1st and October 15th which was seen in the graph of sea ice extent as a small peak on these dates. We improved the processing to make the graph much smoother. The apparent blip had arisen due to a switching of some parameters in the processing on both dates. The parameter switching is needed because the surface of the Arctic sea-ice becomes wet in summer due to the melting of ice which changes satellite-observed signatures of sea-ice drastically. By this improvement most of the sea ice extent values are not affected at all except for the period of May 20-June 11 and October 8-26 of each year.”
Spector says:
May 17, 2010 at 11:51 pm
…
as far as I can see, they present no evidence that their observations are abnormal, unprecedented
Why is it important if the Greenland ice sheet, or all the ice sheets in the world, were gone 800,000 years ago, or 3 million years ago, or 1.3 billion years ago ?
Something doesn’t have to be “unprecedented” to present a problem now – and if the disappearance of the cryosphere will affect the climate upon which Civilization is based, that is an issue for now.
And if it is an issue for now, it is important to understand why it is happening now. This is what Science does – attempts to understand the natural world. Pointing out that something similar happened a long, long time ago, for reasons unknown, is just marginally useful context for understanding what is happening now.
RE: Anu: (May 18, 2010 at 9:44 am) “And if it is an issue for now, it is important to understand why it is happening now. This is what Science does – attempts to understand the natural world. Pointing out that something similar happened a long, long time ago, for reasons unknown, is just marginally useful context for understanding what is happening now.”
Yes, that is all true. It is important to do all we can to understand what is happening to the Greenland ice-pack now and in the past. That is science. The report I linked (May 17, 2010 at 11:51 pm) does show valuable field research in progress. However, as reported, that study did not provide any evidence of man-caused pollution or contamination of the ice-surface which might be accelerating the melting process. The determination of the degree that human activity may have influenced the climate of the Modern Warm Period was beyond the scope of their study.
As far as I can see, there is, as yet, no convincing evidence that our modern global climate has been seriously impacted by human activity except in local urban heat concentration areas. I do not think we would be here today if the dangerously high positive feedback levels required to make carbon dioxide responsible for the modern warming of the last 100 years were in effect.
stevengoddard says:
May 15, 2010 at 4:37 pm
u.k.(us)
I flew over Greenland during the late summer 2007 Armageddon, and the ice was filthy for many miles on the western side. Dirty snow/ice plays a big part in Arctic melting.
=====================================
Here is a nice view of local dirt being blown onto the Greenland icesheet dated 5/10/10, I imagine by the end of summer it will be everywhere.
It must happen anytime the ground is exposed and weathering.
http://rapidfire.sci.gsfc.nasa.gov/gallery/?2010130-0510/Greenland.A2010130.1330.250m.jpg
Amazing photos NASA has, all that is needed is a clear day.
Their archive goes back to 2001.
Just thought you might be interested.
Now it’s dropped below 2007, and is poised to drop below 2004, then 2006.
Nothing “predictive”, but it’s dropping like a rock, at a steeper rate than any of the IARC-JAXA years (which are all post-2000, when the Arctic ice really started worrisome summer melts).
Just interesting.
Guys. The extent doesn’t matter now. The rate doesn’t matter now. Wait until the line passes towards 8e6 sqkm and look at the rate then. If the rate of loss is high, that will tell you if we are headed towards a minimum.
Do we have any information regarding sea ice volumes before or concurrent with NSIDC or JAXA? I think unless we have this information we have no way of knowing whether to prefer volume versus extent as a metric is valid. I’d appreciate an answer if anyone out there knows.