By Joseph D’Aleo, CCM ICECAP.US
El Nino is still hanging on but likely not for very long. Warmer than normal water can still be seen along the equator in the tropical Pacific. It is even warmer in the sub-tropical North Atlantic because of the suppressed winter jet stream and subtropical high which meant lighter than normal winds and less clouds.

Signs of the demise of the El Nino are numerous. It is likely given the flip of the PDO which favors shorter El Ninos and stronger, more frequent and lengthy La Ninas that a moderate to strong La Nina is next in the cards this year and next.

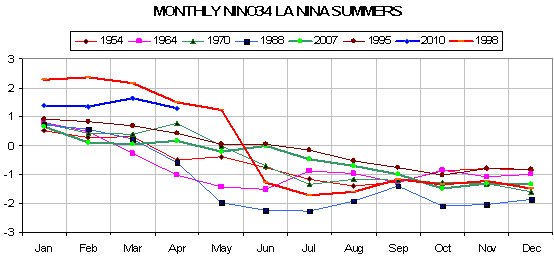
Notice in the temperature anomaly plot for NINO region 34 (region shown on the CDC map below)

How we are somewhere between 1998’s super El Nino and a cluster of more moderate ones and how they declined quickly by the summer on the graph that follows (enlarged here). Values are given in STD of NINO 34 SSTA.

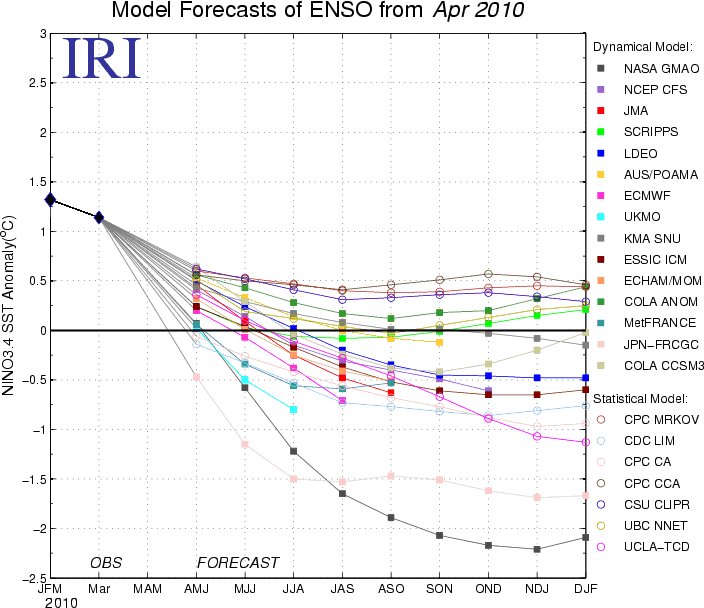
ENSO models, both dynamical (coupled air and ocean models) and statistical suggest a rapid cooling with all models dropping below threshold El Nino levels by summer (JJA – June-July-August) and perhaps half reaching La Nina values by summer or fall.

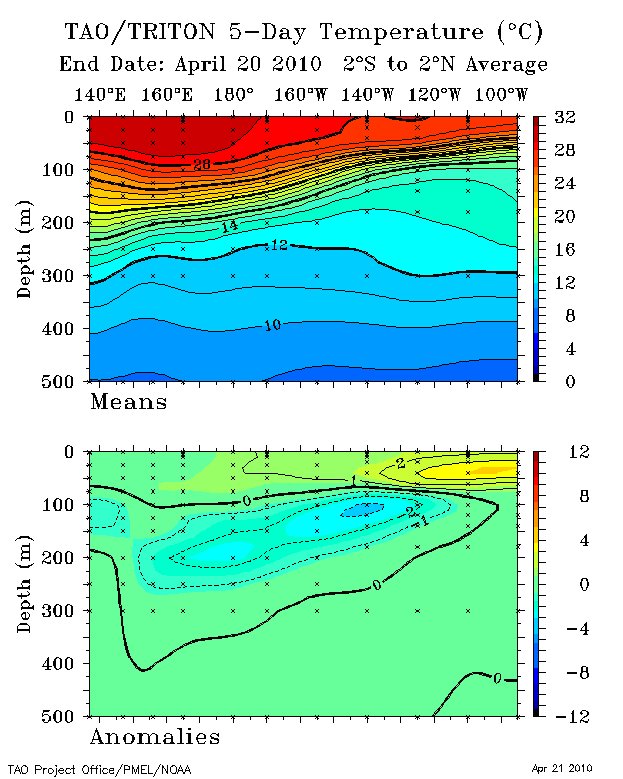
In the depth cross section across the entire tropical Pacific that is built from the TAO-Triton buoy data, we can see the warm water in the eastern top water which was 5C above normal has diminished as the water mixes with cooler surface water and the thermocline is lifted. Notice the developing strong cold pool not unlike that in 1998 at 100 meters across most of the Pacific. Notice the amazing cool down of NINO34 in 1998 from May to June in the multiyear graph above.

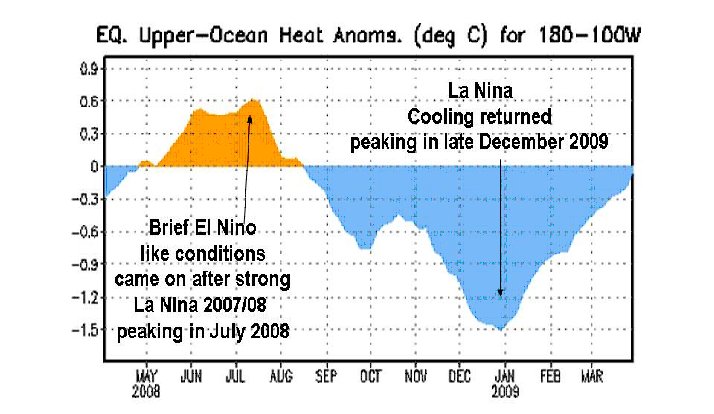
The El Nino followed two years of La Nina with below normal temperatures in NINO34 and in much of the Pacific leading to below normal ocean heat content in the tropical eastern half of the Pacific. A strong La Nina in 2007/08 was followed by a summer rebound then another dip in January.

We can see in the heat content the last year, a peak last summer a fall decline and then a multi peak winter warming fed by westerly wind bursts this past winter, notice the decline as we started April.
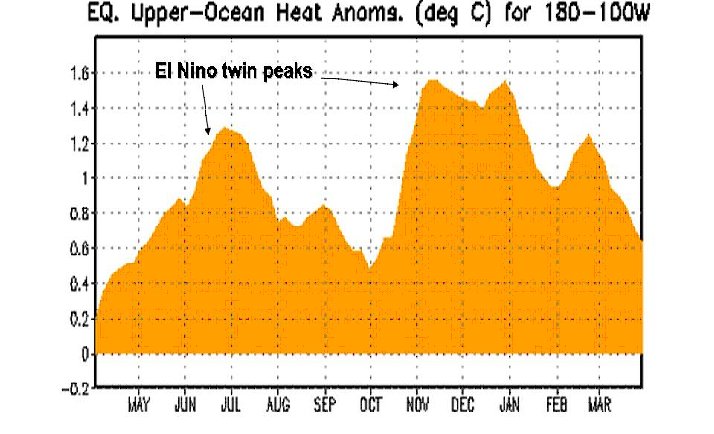

The Southern Oscillation Index which was in positive La Nina territory in 2007/08 and 2008/09 dropped into negative El Nino territory reaching an incredible 8 STS in early 2010. It has rebounded to positive and usually leads the change of ENSO state by a few months given credence to a return of La Nina.
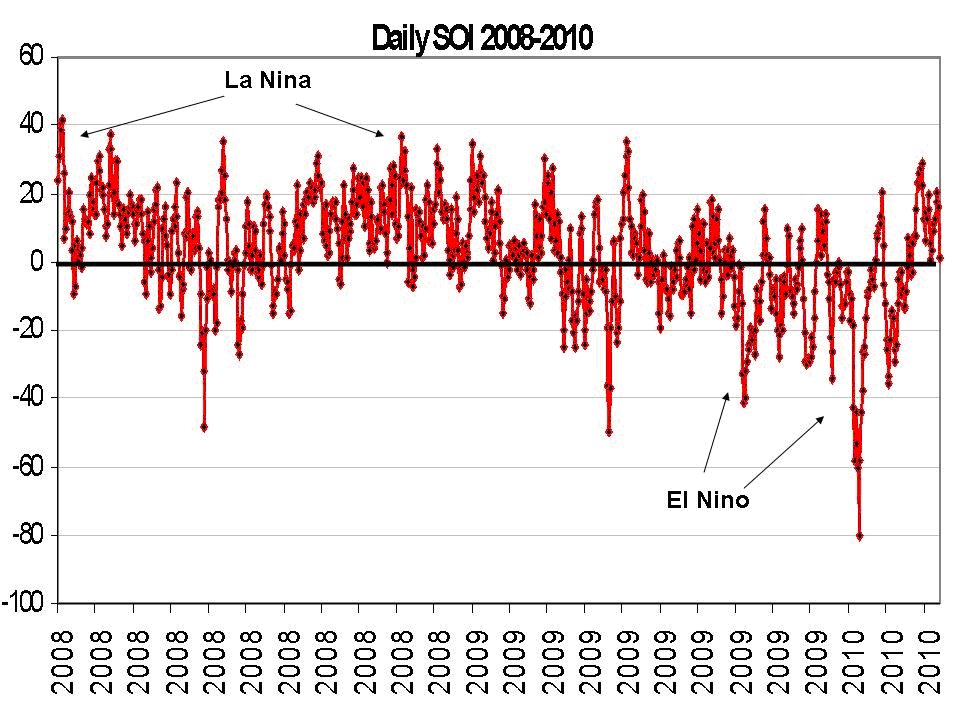

See much more on the possible implications for the summer and following winter (with recognition of the possible influence of the solar and volcano wildcards) here.
This El Nino was a peculiar kid, this year, as during the SH summer it was absent along the SA west coasts; it was only a nino limited to 3-4 regions and not to 1-2. Only late in summer and beginning autumm it appeared in 1-2 zone.
Was it because of jetstream changes due in turn to geomagnetical changes due in turn to any other exterior cause?
I’m curious to see if temp anomalies will drop with the combo of the recent volcano and the death of El Nino.
Speaking of updates hasn’t it been a week since the weekly ice extent update started or did I miss something?
Good to know about El Niño, I’m curious to know what number they will pop out for the April anomaly.
Quiet Sun, SSN=0 for 11 days in a row, low speed “solar “wind”” and if we read:
INFLUENCE OF SOLAR WIND ON THE GLOBAL ELECTRIC
CIRCUIT, AND INFERRED EFFECTS ON CLOUD MICROPHYSICS,
TEMPERATURE, AND DYNAMICS IN THE TROPOSPHERE
BRIAN A. TINSLEY
Discussion and Conclusions
Of the three inputs into the global electric circuit that are modulated by the solar wind, two of them do not involve cosmic rays or other particles that are energetic enough to penetrate to cloud levels and directly affect clouds. But all three inputs cause Jz variations that extend all the way down to the surface. So we have concluded that in all three cases it is most likely that Jz variations are causing changes in cloud microphysics that then produce correlated changes in weather and climate.
http://www.utdallas.edu/physics/pdf/Tin_rev.pdf
Sonicfrog (08:16:01) : Hope more “ingredients” in that “Combo” to reach a whopper level ☺
Enneagram (08:04:58) :
“Was it because of jetstream changes due in turn to geomagnetical changes due in turn to any other exterior cause?”
No doubt it was the usual suspects: rich white guys…
Whhich, if anything, will be the consequences on solar activity (against the consensus of course of post normal holy inquisition) by the current Jupiter/Uranus conjuntion and Saturn/Uranus opposition this interesting year?
Looking good for a hottest on record 2010.
REPLY: And that would make you happy?
The current El Niño has been a bit of a strange animal, almost like a car sputtering along on only 3 cylinders, and not seeming to have had much effect in mitigating the savage NH winter, which here in the UK was the coldest for over 30 years!
Perhaps the weak solar cycle 24 had something to do with this, along with the weakened NH polar vortex and a more southerly jet stream. I suspect that this more southerly jet stream will continue, unless the sun really kicks back into gear, so we could be in for another cool summer.
The thought of a late La Niña fills me with dread for the coming winter and I’ll be laying in a large supple of logs over the next few month, just in case.
Yeah .. I”m curious to see how all this is going to play out.
To boot, the sun has gone all funky on us again. I’m not sure I know how to read these things, but A index is at 1, flux back at 75, and SN back to 0 going on 11 days in a row now.
Someone needs to email John Christy and tell him to double check some stuff. Since all the stories of flawed data, et al., I’m having a hard time believing the numbers I’m seeing.
OT, but I’m surprised that nobody is commenting about the recent solar (in)activity. After a few months with a good deal of sunspots, when the rare day was the spotless day, we are now into an 11-days run without any sunspots, or 17-days run, if you don’t count sunspecks (SSN<15). It looks like if the wake-up of SC24 will be slower than it was looking. I don't know how normal this is given the previous much higher activity.
That old El Nino he ain’t what he used to be, ain’t what he used to be.
That old El Nino he ain’t what he used to be . . .
I just happened to listen to this link off of CNN. Sting’s wife mentions that the world (might) end up not being able to sustain life. If this is not a perfect example of hysterical think, then I don’t know what is. Here is the link
http://www.cnn.com/video/#/video/bestoftv/2010/04/25/nr.sting.trudie.earthday.cnn
I can clearly see the hotspot next to Iceland that caused the heat/melting and volcano recently.
The proof is clear.
The link: http://www.spc.noaa.gov/climo/online/monthly/newm.html
Headline at Drudge Report: “Number of tornadoes, hail, and wind reports at decade low… ”
On linked page, at top is a table with 3 year statistics (completed ones 2007-2009), so the “decade low” must come from the Severe Weather graphs below it that run to 2000.
Anyone here see that low?
Not only was the Southern Oscillation Index “an incredible 8 STS in early 2010,” but the Arctic Oscillation was also in “unprecedented” territory at the start of the year.
My hunch is that these larger-than-usual swings are due to the quiet sun.
Please do not ask me to explain how the heck the sun does it. I haven’t yet seen any explanation of the step-by-step mechanics. However, if only our records went back as far as the last time the sun was quiet, perhaps we would see that the Southern Oscillation Index and Arctic Oscillation behaved in the same manner back then.
I’m betting my nickel on dramatic cooling over the next year, as the El Nino has shot its wad, and the PDO is cooling. Also the AMO, though still warm, is past its peak. Lastly, though recent volcanoes haven’t shot their ash and SO2 very high up, any ash whatsoever is more than we had during the amazingly (“unprecedented”) ash-free period that followed Pinatubo.
The wild card is the quiet sun. How will the slight decrease in energy translate out? If less energy means weaker trade winds, then the El Nino may come back in a sluggish manner (as it’s supply of heat is somewhat drained.) That will create one of those counterintuitive situations where less energy means more heat, in the short term. However usually a period of “recharging” is necessary before an El Nino can again “discharge” heat.
In any case, there is a lot we will be seeing for the first time with our modern satellites. There were no satellites when the PDO and AMO last went through these stages. It’s a pity politics has everyone so worked up, because it would be nice to just admit how little we know, and to just sit back and observe, and learn.
I doubt we’ll be able to be so relaxed, however.
Deanster (08:52:23 Don’t you remember it? Only the Watts Effect could release the braking of the Sun by those pesky planets!
fred houpt (09:01:17) :
I just happened to listen to this link off of CNN. Sting’s wife mentions that the world (might) end up not being able to sustain life. If this is not a perfect example of hysterical think, then I don’t know what is. Here is the link
(…)
Not that hysterical, as it’s a given that will happen someday. But the actual amount of time until that happens will be quite a bit longer than she expects…. Barring certain severe solar events, asteroid impacts, and similar things, of course.
I will bet-colder than normal summer- late, with Nina by Sept….
April has been no great shakes as far as warm weather here in NE
Oregon? Also for the Aussies among us? how was your summer?…
I’d like a non- hothouse tomato summer but I do not know….
phlogiston (08:45:07) :
Looking good for a hottest on record 2010.
REPLY: And that would make you happy?
Dont know about you lot, but we could sure do with it here in Ireland, after the winters and summers we’ve had lately!
I’m not an English major, but shouldn’t the last sentence (“…which meant lighter than normal winds and less clouds”) be “less cloud cover” or “fewer clouds” instead? I thought the rule of thumb was anyting you can count (like clouds) used the word “fewer” and anything you would measure (like cloud cover) used the word “less”.
Graph states that La Nina peaked in late December 2009 – Probably should say late December 2008
phlogiston (08:45:07) :
“Looking good for a hottest on record 2010.”
I’m willing to bet that this will be the hottest ever 2010… The coldest too…
fred houpt (09:01:17) :
Sting. And his Mrs. And Geldof. And Bono.
We are not worthy.
I too am interested in what is going on with the sun. After a pretty decent period where it at least seemed like activity was beginning to ramp up, we get 11 days of absolute nothing again.
My gut feeling is that this, coupled with a transition from El Nino to La Nina may indeed bode a harsh winter again, but I am not a meteorologist, nor do I play one on TV 🙂
As for this year being on track for “warmest ever!” that is fine. Certainly isn’t holding true down here on the surface where I actually live, and I know that is also the case for many others as well.
For those of you that have not figured it out yet, climate is pretty darn cyclical, and it is about time for cooling again, so break out your parkas on your way to East Anglia!
I don’t understand much of this, but it sounds to me as if it support Svensmark’s theories about how the intensity of cosmic rays influence cloud formation based on variation of the sun’s magnetic field.
Quote Enneagram (08:34:47) :
Quiet Sun, SSN=0 for 11 days in a row, low speed “solar “wind”” and if we read:
INFLUENCE OF SOLAR WIND ON THE GLOBAL ELECTRIC
CIRCUIT, AND INFERRED EFFECTS ON CLOUD MICROPHYSICS,
TEMPERATURE, AND DYNAMICS IN THE TROPOSPHERE
BRIAN A. TINSLEY
Discussion and Conclusions
Of the three inputs into the global electric circuit that are modulated by the solar wind, two of them do not involve cosmic rays or other particles that are energetic enough to penetrate to cloud levels and directly affect clouds. But all three inputs cause Jz variations that extend all the way down to the surface. So we have concluded that in all three cases it is most likely that Jz variations are causing changes in cloud microphysics that then produce correlated changes in weather and climate.
http://www.utdallas.edu/physics/pdf/Tin_rev.pdf Unquote
Ref – Enneagram (08:34:47):
__________________
The Sun is merely like a catalyst that doesn’t really do anything regarding the weather except kinda keep it going; the Sun dosen’t “change” and it’s all the fault of the Earth’s tilt and orbit that makes everything toppsyturvy, kaddiwampus and variable.
I know how you feel, it was hard for me to believe too.
PS: Planets have no impact whatsoever. They’re too small and don’t have a negative charge like electrons (I think;-)
“Looking good for a hottest on record 2010.”
I disagree. While 2010 is currently leading 1998 throught March, the Super El Nino in ’98 held on far longer than this one is. April ’10 should come in WELL under April ’98 and propel 1998 back into the lead. I expect at a minimum weak La Nina conditions by Thanksgiving. This should take us even further away from 1998.
When it’s done, I think 2010 will be a top 10 year, perhaps even top 5. But 1998 should likely keep it reign as the warmest year on record. Again…
Is this what they meant by “new ice age scares” confined to newspaper stories?
http://bishophill.squarespace.com/blog/2010/4/26/hubert-lamb-on-ice-ages.html
From Bishop Hill. That is the Hubert Lamb who was director of the CRU.
Henry chance (09:02:24) :
“I can clearly see the hotspot next to Iceland that caused the heat/melting and volcano recently.”
Run the “potential temperature” N.H Tropopause animation on here;
http://www.pa.op.dlr.de/arctic/index.html
After crossing Iceland, you can see it heading towards Scotland where it was 17deg. for a couple of days, much warmer than the south UK. I have established a clear relationship between temperature rises and new eruptions, but it is very interesting to witness the precise local conditions to the day.
The GISS temperature for Jan, Feb, and Mar are at record highs (70, 73 & 81). The coming La Nina will have to be as severe as the one that followed 1998 to offset those numbers. The odds offered on Intrade.com the “2010= hottest year?” bet (75%) therefore reflect confidence in an insurmountable lead. (I’ve bet the other way.) We shall see.
Judging by how sensitive ENSO was to last March/April and the end of June heat wave, I reckon this El Nino has more time yet. You can see it respond to the recent stronger solar signal here; http://www.cpc.ncep.noaa.gov/products/analysis_monitoring/enso_update/sstanim.shtml
My forecast for May is above average temperatures, and a heat wave starting around June 12th.
“Looking good for a hottest on record 2010.”
Phlogiston,
I stopped paying attention to our surface records (or more appropriatly – reonstructions) many years ago. However, there is an AGW metric that the IPCC says should be quite pronounced -tropical mid-tropespheric temperatures. The so-called tropical hotspot has failed to materialize. I think Gavin Schmit at RC a year or so complained that this feature never materialized (much to his befuddlement).
So, if 2010 turns out to be a record hot year (whatever that means) it isn’t due to Greenhouse Gases. The Tropical tropesphere has failed to warm.
It was supposed to be sarcasm, should have used /sarc flags. I meant to add bracketed NOT at the end but my mobile phone keyboard – Nokia E71 – doesnt have brackets. How many people now think I’m a troll?
Mr. D’Aleo
The South Atlantic magnetic anomaly is moving into Pacific. This movement can be tracked by locating the crossing of the magnetic (Z-component) and geographic equators.
The equatorial crossing has moved east-wards during the last four centuries with a trend reminiscent of the global temperature trend for the period.
http://www.vukcevic.talktalk.net/LFC19.htm
This may be just a coincidence, alternatively it may point to a relationship between ocean currents and geomagnetic field in the area. This is an area of increased flux of energetic particles; the SAA is the Earth region where the Earth’s magnetic field is weakest.
http://www.vukcevic.talktalk.net/GandF.htm
This forecast doesn’t bode well for the climate scientology team out there . . . after all how can the scare the crap out of people, blackmail truckloads of research money out of politicians and take lovely tax payer funded trips to Bali if Mother Nature refuses to validate the scary scenario.
Time to short sell climate scientology and go long on the next great eco scare campaign.
I’m betting they’ll try and frame either oxygen or water as the next great eco culprit.
Deanster: I think I would trust AMSU 100%. The El Nino always causes a rise in temps, but its about to collapse so like 2010 will not be the warmest on record probably 2 or 3rd maybe. Next year could easily be one of the coolest, if La Nina kicks in though. R Spencer did post something last month about a single hotspot being responsible for the high gobal Feb March temps I believe….
I love following and rooting for the consequences of the extended solar minimum. I enjoy seeing the states and municipalities that used up all their snow removal funds and will probably need to increase those budgets for the next winter. I enjoy reading about the crop failures all the way down to Florida’s decimated orange, tomato, and other crops. The only reason I enjoy reading about the death toll of people and Manatees due to the extra cold winters is because, I know corrupted people will only be able to snap out of their delusional belief in the fraud of man-made global warming, is by inflicting so much natural pain on them from the magnificent solar minimum till they cry uncle.
I wouldn’t believe it if I hadn’t seen it with my own eyes. There is a winter storm warning for Vermont and Upstate New York for 6-12 inches of snow. Here in Stowe Vt that means 12 inches or more.
http://weather.unisys.com/surface/sst_anom.html
Doesn’t look like the watery part of earth’s surface should show a positive anomaly this month to me. If Dr. Roy Spencer comes up with another hottest month outcome I for one will have little faith in the peculiar machinations that produce his series.
Tenuc:
I suspect that if the Arctic Oscillation stays as it is then the consequence for the UK will be a long hot summer, as the blocking high we are experiencing now, and which contributed to our freezing winter, will hang about for most of the season.
I would really look forward to such a BBQ summer, except for the smug nagging of the AGW brigade, and the hose-pipe bans and ‘drought’ warnings of the water companies and their government lackeys.
I have been keeping a close eye on the “boys and girls” and sunspots for about 30 years now. Short term climate has a big influence on commodity prices and skiing conditions in Alberta. I have had some good success and some not so good, in trying to predict even 6 to 12 months. Now I know why. It’s those damn wild-cards and plus 30 year cycles. Back to the “size of the white man’s wood pile”, I guess. Damn again, we all switched to natural gas didn’t we.
Sonicfrog (08:16:01) “I’m curious to see if temp anomalies will drop with the combo of the recent volcano and the death of El Nino.”
I’m still waiting for a report on whether the recent Icelandic volcanic eruption has impacted SAOT (stratospheric aerosol optical thickness).
Lot’s of eruptions don’t:
http://www.sfu.ca/~plv/SAOT,DVI,VEI,MSI_SOI,L90,SOI+L90.png
http://www.sfu.ca/~plv/SAOT_Lunar_aa_SOI.png
[ Definition of terms here: http://www.sfu.ca/~plv/VolcanoStratosphereSLAM.htm ]
Note that one of the factors influencing impact is circulation – (hardly a surprise, but I’ve never seen these results anywhere.)
Clusters of major eruptions coinciding with decades of primarily La Nina seem to miss the persistence that stems from stratospheric residence time. No wonder studies that look at only 2 variables at a time (simple linear amplitude correlation) arrive at misleading conclusions; multivariate conditional dependence is key.
Hear, hear:
Caleb (09:12:25) “It’s a pity politics has everyone so worked up, because it would be nice to just admit how little we know, and to just sit back and observe, and learn.
Folks I deal with claim that such behavior, while sensible, would be “unprofessional”. (clarification: I’m quoting them, not agreeing with them.)
FWIW I actually think its going to be bloody cold by the end of the year.
I agree with others such as Caleb who have said here and elsewhere that this el Nino will end with a sharp drop to cooler temperatures. Like the 1998 one and all el Nino’s I have seen. When did an El Nino end in an elevated plateau? Its always a symetrical spike, up then down. Thus the article by Joseph D’Aleo about the incipient La Nina made it all the more clear that this drop is well underway.
This explains my attempt at sarcasm which clearly failed abjectly.
No El Nino and hot temps off the west coast of Africa .. sounds like a high ACE this year then. Wonder how many cat 5 hurricanes there will be.
Andy
vukcevic (11:06:18) : That is amazing! If you see there have been four low depth earthquakes, from 5.1 to 5.7 Richter, in the last five days, in the Sandwich islands region. (57°S, 26°W). That “moving red shadow” also reaches the chilean city of Concepcion, where there was a big 8.9 earthquake last february 27th. and one of 5.9 Richter on april 23rd.
maggieblanco (11:08:18) “Time to short sell climate scientology and go long on the next great eco scare campaign.”
Bets are already being hedged to cover all the bases — see the last paragraph here:
http://www.telegraph.co.uk/science/dinosaurs/7624014/Dinosaurs-died-from-sudden-temperature-drop-not-comet-strike-scientists-claim.html
“The drop in temperature is thought to have occurred because high levels of CO2 were in the atmosphere which caused global temperatures to rise and polar ice to melt – a phenomenon currently predicted for Earth.”
RE: ACE and hurricane activity, the most analogous year to this one is…..2005!
All that heat in the Atlantic plus the weak Azores hi plus the weakening El Nino tends to show lots of cyclonic activity is on the way.
See Hurricanetrack.com for lots of good info.
SOI on positive:
http://www.weatherzone.com.au/climate/indicator_enso.jsp?c=soi
Andy… they’ll all be blamed on global warming.
AndyW,
I don’t think the word “hot” is correct for the temps off of Africa, the phrase “large pool of cold” comes to mind.
And Yes, a really hot half decade would make me really happy, I’m moving to Alaska this summer for at least three years and probably more then five, so I want my global warming!!! Al Gore Promised!
The Very Preliminary April SST anomaly data were available today through the NOAA NOMADS website. I presented the preliminary April data here.
http://bobtisdale.blogspot.com/2010/04/very-preliminary-april-2010-sst-anomaly.html
NINO3.4 SST anomalies are down, while global SST anomalies are up.
Regarding the statement in the post, “It is likely given the flip of the PDO which favors shorter El Ninos and stronger, more frequent and lengthy La Ninas,” the PDO is an aftereffect of ENSO
http://i41.tinypic.com/34znfvr.png
It is more likely that the frequency and magnitude of ENSO events caused the “flip of the PDO.” Then again, the other major contributor to the PDO is North Pacific Sea Level Pressure. Refer to:
http://i41.tinypic.com/dng9xz.png
And to the post:
http://bobtisdale.blogspot.com/2010/04/is-difference-between-nino34-sst.html
phlogiston (10:52:47) :
It was supposed to be sarcasm, should have used /sarc flags. I meant to add bracketed NOT at the end but my mobile phone keyboard – Nokia E71 – doesnt have brackets. How many people now think I’m a troll?
Probably no more than usual. 😉
I’m reading the Google cache of an entry in a (former?) blog, a review of the E71. Says the brackets are moved to the Symbol menu however he’s actually talking about the parentheses. Are the square brackets in that Symbol menu?
I’m seeing the Nokia E71 described as a “smartphone.” However if you really want something smart and useful, and want to avoid looking stupid (again?), get a phone that works with a RedFly. Then wonder if you need a netbook/laptop at all.
Paul Vaughan (12:46:24) :
The vast majority of what I am reading suggests that the April’s Icelandic volcano did not send anything high enough to reach the stratosphere and spread over the globe. Essentially, no sulfate aerosol particles are expected.
For example, see
http://www.wunderground.com/blog/JeffMasters/comment.html?entrynum=1462
Caleb (09:12:25) you wrote, “and and the PDO is cooling…”
The PDO does not represent sea surface temperatures of the North Pacific. The North Pacific SST anomalies have declined over the past six months, but that’s the seasonal variation:
http://i42.tinypic.com/2eve0lk.png
Refer also to the next comment also.
And Joe D’Aleo, you wrote, “given the flip of the PDO…” assumedly referring to a change from a positive to a negative PDO.
The PDO has been positive (with the exception of one month) since August of 2009:
http://jisao.washington.edu/pdo/PDO.latest
Douglas Dc – I don’t presume to speak for the Aussies (I don’t want to either but that’s another story!), but NZ’s Summer was all over the place. Auckland and North was sunny sunny sunny for months, drought conditions, while further South the sunshine arrived late and left early.
There’s some interesting El Nino / La nina stuff on these two links (ignore that one is from AGW-loving NIWA!):
http://www.niwa.co.nz/our-science/climate/information-and-resources/clivar/elnino
http://www.pmel.noaa.gov/tao/
PS – Phlogiston – I got the sarc (winks)
All you northern hemisphere people have your seasons reversed. Us southern hemisphere types are generally willing to tolerate your eccentricity. But it annoys us when you persist in referring to December-February as `winter’ even when commenting on southern hemisphere events.
The Nino-Nina events happen in the south pacific (actually equatorial – but definitely more on the south side than the north). If you are going to persist in using seasons to talk about these events then winter must surely mean June-August.
phlogiston,
I caught your sarcasm immediately, and enjoyed it! 😉
mf
Anybody got a well reasoned explanation for the odd-looking hot spot off the east coast of South America?
On same Topic:
http://hidethedecline.eu/pages/posts/the-death-of-global-warming-from-below-176.php
K.R. Frank Lansner
BJ (09:26:20) :
A friend made a similar comment (different subject) on Facebook.
I mentioned that alot of people make that mistake. (Sometimes I’ll tell people that all they have to do is remember an alot is a small, furry animal.)
Richard Sharpe (10:19:02) :
Lamb recanted 4 years later. Perhaps Jones will soon, too..
JP (10:49:07) :
If I recall correctly, Schmidt claims that the hotspot is still there, just that the thermometers don’t see it.. they claim that windshears show that it is there. Apparently wind indicators are better thermometers than thermometers.
vukcevic (11:06:18)
“This may be just a coincidence, alternatively it may point to a relationship between ocean currents and geomagnetic field in the area.”
That is simple enough to be right. Iff:
The small amounts of iron in the oceans are drawn to the magnetic poles, they are small but they are many.
The drag caused by the iron induces the ocean currents that we see.
As the magnetic poles move towards the equator the ocean currents follow the magnetic movement.
When the poles are near the equator we have an ice age because there is no heat moving to the poles, but the net amount of heat is the same as before.
The duration and severity of the cold phase North and South of the tropics would depend on the speed of the magnetic polar movement.
Hmmm.
The typical conception of an El Nino is at the Vernal Equinox at hotter March/April`s, some 9 months before its celebrated arival at Peru around Christmas, with it getting a second uplift at the Autumn Equinox.
http://www.cpc.ncep.noaa.gov/products/analysis_monitoring/ensostuff/ensoyears.shtml
These months of doiminant warming can also be seen in individual monthly trends in CET, or other local temperature series, as when most of the warming such as in the last 30 or 100 years can be seen. Have a look at CET for the linear trend for Feb or May over the last 100yrs, they are as flat as a pancake. The Equinoxes are when the Aurora and solar storms are strongest, and we connect with the solar wind better, giving more warming potential.
Conversely, a cold Feb/Mar/Apr will tend to extinguish the El Nino condition.
I think there is a good chance of current El Nino following the 1968 to 1970 pattern and lasting till next spring.
Rhoda R (13:55:03) :
So global warming is going to send us into an ice age?
That’s why alarmists now refer to it as: “Climate Change”; because it covers all the bases. Even if we enter a long cold period, they’ll blame it on humans.
I should point out the SOI on positive, but that is 30-day mean, if you see monthly mean SOI, it is still in deep negative.
For El Niño observation, NINO3.4 SOI is the key index: both weekly and monthly SOIs are drop now which fit the prediction by NOAA that we will go El Niño neutral this June.
http://www.weatherzone.com.au/climate/indicator_enso.jsp?c=nino34&p=monthly
http://www.weatherzone.com.au/climate/indicator_enso.jsp?c=nino34&p=weekly
Enneagram (13:45:13) :
SOI on positive:
http://www.weatherzone.com.au/climate/indicator_enso.jsp?c=soi
Forget to put the monthly SOI which is still negative:
http://www.weatherzone.com.au/climate/indicator_enso.jsp?c=soi&p=monthly
Re: An Inquirer (14:34:01)
Not very confident in their gross oversimplification of circulation & latitudinal dependency, but thanks much for the constructive leads, which turned up more on ENSO/volcano connections:
http://www.meteo.psu.edu/~mann/shared/research/Adams2003Volcano/Adams2003Volcano.html
http://www.virginia.edu/topnews/releases2003/volcano-nov-19-2003.html
http://www.meteo.psu.edu/~mann/shared/articles/Kerr%282003%29_VolENSO.pdf
Note that WUWT’s good friend Mann has been looking at this. The main SAOT paper has Hansen as a co-author. Seems I’ve got something that might attract funding.
Bob Tisdale,
Thanks for the corrections. I’ll find time to study your work, as I always glean something, every time I snoop about your site.
You’ll have to forgive me if I at times seem guilty of gross over-simplifications. I tend to leap from subject to subject, trying to gain an overview of the many factors involved in “forcing” the climate this way and that way.
I think you are not guilty of leaping from subject to subject, but rather are doing great work by focusing on ENSO, as a central theme. In many ways I think your observations have a power lots of theory lacks, as yours are observations founded on the bedrock of truth. Truth is always the best teacher.
As I leap from subject to subject I am less certain than you seem to be that the ENSO is the “driver.” At times, especially in 1998, I think it is the “driver,” but other times I think it gets a bit flabby and is more able to be listed among the “driven.”
As an aside, you might be interested (or at least amused) to know my personal measurement of the negative PDO involves no crunching of negative or positive numbers. Instead I look for its signature on the surface temperature anomaly maps of the north Pacific. It’s signature is the letter “C,” backwards and in blue. Although the blue has grown fainter, and even a bit spotty, that “C” has remained even though the PDO has been in statistically positive territory in recent months. Now that “C” is growing stronger.
Therefore two things are obvious. The first is that I am allergic to numbers, and avoid them whenever possible. And the second is that the “negative” PDO may involve a switch in the oceanic set-up, more than mere numbers.
Just an observation. And thanks again for yours.
Great. Cold and dry. No pasture past October and my sewer freezes again. Just great. It takes a lot of cold to freeze a ranch sewer system. Just freakin great.
Douglas I am totally with you on that one. Short season, cold winter. And on the side, I invite you and yours to a Friday night tavern experience at the LT in Lostine. Would love to have your company and introduce you both to the locals. Ya’ll are welcome.
phlogiston (08:45:07) :
“Looking good for a hottest on record 2010.”
Ironic kook is ironic.
One sits with bated breath waiting for the kook korps to issue corrected adjusted modified altered amended edited temperature records to reflect the errors at Eureka Nunavut.
Paul Vaughan (17:35:14)
Big volcanoes on El Nino and La Nina:
http://www.volcano.si.edu/world/largeeruptions.cfm
http://www.cpc.ncep.noaa.gov/products/analysis_monitoring/ensostuff/ensoyears.shtml
Volcanoes do correspond to monthly temperature uplifts, but not ENSO phase.
Re: Bob Tisdale (14:17:21)
Bob, thanks for drawing our attention to this:
“Is The Difference Between NINO3.4 SST Anomalies And The PDO A Function Of Sea Level Pressure?”
http://bobtisdale.blogspot.com/2010/04/is-difference-between-nino34-sst.html
The Upper Ocean Temperature Anomalies in the Pacific say that a La Nina is coming soon.
http://www.ecmwf.int/products/forecasts/d/charts/ocean/real_time/xzmaps/
http://www.cpc.ncep.noaa.gov/products/analysis_monitoring/ocean/anim/wkxzteq_anm.gif
For the other indicators, the SOI is predicting La Nina while the Trade Winds and Atmospheric Angular Momentum are neutral.
——–
I agree with Bob Tisdale about the PDO just being an extension of the ENSO. The actual PDO index is not as cyclical as some of the charts on the Internet show.
phlog
“Looking good for a hottest on record 2010.” The wording is wrong, it should say looking good for a hottest summer temperature on record in the UK. Which will get you 10/1 at the local bookie.
Dr. Roy Spencer will be interviewed tonight (Mon.) on Coast-to-Coast from 10pm to 2am Pacific time.
Bill Illis (18:58:56) :
The Upper Ocean Temperature Anomalies in the Pacific say that a La Nina is coming soon.
I hope that would mean a cooler July to October here in Northern California. That’s the hottest part of the year. Mild summer is nice.
So, the 30 billion dollar question: what does this mean for corn and soybean yields this year? What will this do to the futures market?
I always like to see real data presented like Joseph D’Aleo, Bill Illis, Roy Spencer, Steven Goddard, Willis Eschenbach, Bob Tisdale, Jeff Id, Anthony, and others do.
I just wish they’d present the data on video. Seems to be a more productive way to learn. These posts would probably fit in a 10 to 20 minute video. And it would not be good for the regulars here but it would be a nice way to show friends what the real data is showing.
With video being so easy to do on the internet it seems like it would be good all the way around—especially for those guests doing the posts since people could hear their tone of voice as they presented their work—to have it on video.
typo
And it would not be good for the regulars here but it would be a nice way to show friends what the real data is showing.
should be
And it would not be good —not just for—for the regulars here but it would be a nice way to show friends what the real data is showing.
Ulric Lyons (18:51:37) “Volcanoes do correspond to monthly temperature uplifts, but not ENSO phase.”
It is becoming apparent that the graphs I’ve posted are being misread. (Word-explanations of graphs are generally clutter, but when I have funding I might reorganize for other audience segments.)
As for the work by Mann & others: They missed a whole dimension to the relationships.
Looking forward to hearing back from you on HMF3.2a…
Bill Illis (18:58:56) “I agree with Bob Tisdale about the PDO just being an extension of the ENSO.”
Is that really what Bob is saying in his recent post?
I took the main point to be about a difference between N3.4 & PDO being related to SLP.
Friendly note, the following sentence could be worded better, it crossed my eyes for a moment:
How we are somewhere between 1998’s super El Nino and a cluster of more moderate ones and how they declined quickly by the summer on the graph that follows (enlarged here).
What the heck is that persistent hot spot off South America (Uruguay/Paraguay) ?
Also check out Joe d’Aleo’s second half of the article:
http://icecap.us/index.php/go/joes-blog/the_transition_between_solar_sunspot_cycles_23_and_24_sun_back_in_mini_slum/
“Between November, 2008, and September, 2009, the AP index returned persistent readings of 4’s and 5’s, sinking to 3’s in October and November, and finally to 1 in December – which is the lowest reading in the 165 years of observations since 1844”
Since 1844, wow!
“cooling of up to 2.20 C may occur during Cycle 24”
This on top of the PDO cycle swing. Chilly.
IVI = Ice-core Volcanic Index & decadal ENSO
More phase-concordance:
http://www.sfu.ca/~plv/IVI2_SOI.png
This hints of insights into the role of north-south terrestrial asymmetry in the 20th century climate record. 90, 60, 30, & 20 year harmonics of the lunisolar harmonic spectrum may not be manifest in a spatially uniform fashion. (See the works of Russian scientist Yu.V. Barkin.)
–
Also, humor:
Burst out laughing when I read this:
“Monthly and Spatially Dependent Stratospheric Loading from Volcanic Eruptions, 501-2000 A.D.”
“Column 1: Time of loading […] Column 2-775: Sulfate aerosol loading from 9 km to 30 km at 0.5 km resolution for each 10-degree latitude belt (from 90 degrees south to 90 degrees north) for the corresponding month.”
Take a minute to think about that resolution.
http://climate.envsci.rutgers.edu/IVI2/
kadaka (KD Knoebel) (14:19:07)
Thanks for the advice on hardware. Sadly I have to lug round a heavy conventional laptop since I need it for training and demos with 3D analysis software which makes big demands on video graphics, disc, memory etc. But what you suggest might be a nice idea for our daughters.
rbateman
Looks ominous, but it has nothing to do with the tropospheric hot spot that the warmists failed to find. Nevertheless, looking at the end of the Eemian I think we should be a little concerned.
Writing in Quaternary International, scientists from the Helmholtz Centre for Environmental Research (UFZ), the Saxon Academy of Sciences (SAW) in Leipzig and the Russian Academy of Sciences say that a short warming event at the very end of the last interglacial period marked the final transition to the ice age.
Been there, done that.
Andrew30 (15:43:00) :
“That is simple enough to be right. Iff:
The small amounts of iron in the oceans are drawn to the magnetic poles, they are small but they are many….”
There is an additional factor: saline sea water current is a conductor moving within the Earth’s magnetic field. Depending on the sea current direction (clock- or anticlock-wise) and the N or S magnetic hemisphere, current circulation may be fractionally increased or reduced due to counter emf induction.
There are number of coincidences or should that be ‘coincidences’ in the geomagnetic trends and global temperature trends. I have in past pointed to some:
http://www.vukcevic.talktalk.net/LFC8.htm
http://www.vukcevic.talktalk.net/LFC16.htm
http://www.vukcevic.talktalk.net/LFC19.htm
http://www.vukcevic.talktalk.net/LFC21.htm
This is the best news I have heard in ages. For a small piece of the planet that suffers negatively under the Boy Child, the return of a prolonged Girl Child is great news. All of my best astronomy has been done during strong La Nina peiods. When I first started out in astronomy during 1974-75, our first great astrophotography period 1988-89, and the time that I did most of the observations for my part of “THe Night Sky Observer’s Guide Vol III, The Southern Sky,” late 1999 to late 2001, were all strong La Nina periods.
Down here on the west coast of the Lower North Island, New Zealand, a strong La Nina means a reversal from the predominately normal westerly flow that brings cloud, but not always rain. The only drawback for La Nina here is an increased likelihood of tropical cyclones dropping down our way between November & May. Other than that it is all good.
Swings and roundabouts folks!
Cheers
Coops
rbateman (22:09:40) :
“What the heck is that persistent hot spot off South America (Uruguay/Paraguay) ?”
Hi Robert
Since doc Svalgaard isn’t around, I would hazard to say: Cosmic rays energetic particles (low SS count) found weak spot in the Earth’s magnetic field, the South Atlantic Magnetic Anomaly where the Earth’s magnetic field is weakest. This of course could be anomalous recording by satellite rather than actual temperature.
http://www.vukcevic.talktalk.net/LFC19.htm
From the wicked Wikipedia:
The South Atlantic Anomaly is of great significance to astronomical satellites and other spacecraft that orbit the Earth at several hundred kilometers altitude; these orbits take satellites through the anomaly periodically, exposing them to several minutes of strong radiation, caused by the trapped protons in the inner Van Allen belt, each time. The International Space Station, orbiting with an inclination of 51.6°, requires extra shielding to deal with this problem. The Hubble Space Telescope does not take observations while passing through the SAA.[3] Astronauts are also affected by this region which is said to be the cause of peculiar ‘shooting stars’ seen in the visual field of astronauts.[4]
I’d like to see a resolution of the terminology problem as regards PDO and ENSO.
Bob Tisdale is right that PDO is simply a statistical artifact of ENSO but there is a common usage of ‘PDO’ to mean the underling ocean shifts that occur periodically.
Joe employs the term in that common usage sense in his post.
Perhaps one should use a different term for the oceanic phase shifts themselves but I fear that by now the common usage has gone too far and there is little point picking up on it.
Most readers will by now associate PDO with the phase shifts themselves and not the statistical index.
rbateman (22:09:40) :
What the heck is that persistent hot spot off South America (Uruguay/Paraguay) ?
http://www.cpc.ncep.noaa.gov/products/analysis_monitoring/enso_update/gsstanim.shtml
It was stronger early Feb, then eased off, and then returned recently, similar pattern around Tasmania.
Steve Schaper (20:10:28) :
So, the 30 billion dollar question: what does this mean for corn and soybean yields this year? What will this do to the futures market?
IMHO; average to below average yield for corn, average to above average yield for soybean, resulting in little tradable movement in either.
What is really interesting is the warm spot at 40s 50w off of South America. Very rarely do you ever find a negative anomaly in that area. I just randomly picked archived maps from all years and there is almost always a warm spot in that area. Underwater volcano or something?
Brian D : Perhaps this has something to do with it:
http://www.vukcevic.talktalk.net/LFC19.htm
Re: Stephen Wilde April 27, 2010 at 4:34 am
Good points Stephen. Bob seems to be challenging us to make a distinction between decadal SOI & decadal PDO based on SLP. I like this direction.
Certainly you are correct that we cannot curb the “common usage” of PDO. The dictionary will have to have more than one entry and people throwing fits about this can be ignored.
vukcevic
April 27, 2010 at 4:26 am
It would make sense that solar wind, not cosmic rays would be responsible for any warming.
SAMA is huge compared to the current tiny hotspot off S.America.
I wonder if there is a slow westward creep of the S. Aurora oval too,
http://www.swpc.noaa.gov/pmap/gif/pmapS.gif
it is fairly opposite SAMA, and stays well put, unlike the N.Aurora oval, which moves considerably week by week. http://www.swpc.noaa.gov/pmap/gif/pmapN.gif
Ulric Lyons says: April 27, 2010 at 1:50 pm
“It would make sense that solar wind, not cosmic rays would be responsible for any warming. SAMA is huge compared to the current tiny hotspot off S.America.”
Perhaps I should be a bit more explicit: The warm spot I think is a suspect (erroneous) value obtained by the satellite sensors, reading being affected by the excessive cosmic ray intensity due to fall in the sunspot activity during the last fortnight (it appears to vary with SS count), this being area of the weakest point of the Earth’s MF.
See quote my from Wikipedia:
vukcevic says: April 27, 2010 at 4:26 am
The weakest part of anomaly (grey area in the graph) http://image.gsfc.nasa.gov/poetry/tour/tr7.gif
is of a similar size as in here
http://icecap.us/images/uploads/SST.jpg
Note the gradual transition in both illustrations.
@ Tenuc April 26, 2010 at 8:48 am
My goodness. Don’t you know that the weak solar cycle 24 is caused by too much CO2 from humans burning too many hydrocarbons? The LIA wasn’t caused by too few sunspots; it was the other way around – too many cows farting and wood burning in fireplaces caused the sunspots to go away.
And our industry is what put the black hole at the center of the Milky Way.
And our cars are what caused the Big Bang.
It’s all our fault. Everything’s our fault. We, humans, are evil. We should just depart the planet and leave it up to the animals and plants to live in Edenic bliss until the sun goes nova. And the nova will be, of course, our fault, because we didn’t shut down our widget factories in time…
[Cue rending of cloth and beating of breast…]
Snarking aside, yes to all of the above, and more we don’t know anything about yet. We have been studying the atmosphere for such a short time, we should continually be humble about what we know about, as compared to the vast amounts we have yet to learn. Attempts at modeling the measurable affects of complex systems is not the same as understanding them. Writing code is not the same as understanding the big picture. To write code is to separate the parts into bits we can attempt to understand in isolation – but putting Humpty Dumpty back together (Grand unifies theories like AGW) again is something several decades or centuries in the future. We are only at the point of gathering facts about affects; assigning causes is beyond us at this point. Any jumping to conclusions about what causes what – that is getting the cart ahead of the horse. And we will be WRONG in those conclusions. Even if they are good guesses that seem to give good results, we can’t yet be sure we aren’t getting the right results for the wrong reasons. (Velikovsky did that for the surface temperature of Venus – and IMHO so did Sagan with his runaway greenhouse effect.) For now, to ask and keep asking is the proper approach.
As ideas to help us comprehend some of it, it is okay, as long as we only ask, like you did: “Perhaps this. . . along with that. . . and mixed in with this other thing?” Asking is fine.
Concluding? Correct concluding is beyond us right now. All conclusions have to be tentative, all understandings merely impressions. Seriously.
It is a good thing to TRY, but we just have to remember to not put much stock in the conclusions. Today’s conclusions are only steps toward full understanding, but they are not understanding any of it, in and of themselves.
What we don’t know far, far outweighs what we DO know. Some things appear to affect other things – but could it be the other way around?
With a system with so many feedbacks, who can be sure? Hansen? Mann? Havelock? Hardly… We are infants taking our first steps.
So, yes, perhaps. Perhaps, perhaps, perhaps. That is all we can do, is say, “Perhaps.”
No, that font is even more difficult to read.
Yowch! That was posted on the wrong post!
vukcevic says:
April 27, 2010 at 2:27 pm
I very much doubt that. Take a look at Jan 11th;
http://weather.unisys.com/archive/sst/sst_anom-100110.gif
=low solar wind velocity;
http://www.lmsal.com/solarsoft/last_events_20100113_1033/index.html
then 7th Feb;
http://weather.unisys.com/archive/sst/sst_anom-100207.gif
=higher solar wind velocity;
http://www.lmsal.com/solarsoft/last_events_20100209_1047/index.html
On a daily basis, circulation is a pivotal issue, look at the `potential temperature`
animation, Tropopause Maps (S.H) on here;
http://www.pa.op.dlr.de/arctic/index.html
you can get a clearer picture of daily changes in the region.
I had a brief look through the archive; http://weather.unisys.com/archive/sst/
and the area does show +ve anomalies that correspond to weekly global +ve anomalies
within the last year. SAMA induced, or just a circulation issue, I would say the temperature anomaly is real.
SAMA does interestingly, geographically lie on a stronger gravtational anomaly:
http://www.ngu.no/geodynamics/gplates/gravi-450dpi.jpg
vukcevic says:
April 27, 2010 at 2:27 pm
SAMA is fragmented and spread across the entire South Atlantic;
http://denali.gsfc.nasa.gov/research/crustal_mag/prep/pmc.JPG
Someone asked for a commentary on the Australian summer…..
Generally speaking…..quite warm (above average), but without the extremes. (eg. Melbourne had 7 days over 40c last summer, it had 1 day (over 40c) this summer – we average about 4-5 days over 40c each summer). Very warm nights (lots of cloud cover) across the SE region. Rainfall was average to slightly above average across the continent (slightly above average in the drought-affected SE areas but very high in the North (typical when El Nino starts to fade), with massive floods in the central desert regions resulting. A relatively quiet summer with respect to cyclones.
The SW wind patterns that bring cool changes to SE Australia every 8-10 days during summer were practically non-existent. These cool changes still did occur, but were accompanies by warmer NW winds instead of SW (3-4c difference). This was one of the main reasons (plus cloud cover) for the warmer average temps across SE Australia in our summer.
Good news for Australia, is the propsect of both a La Nina and negative IOD situation in our spring and summer, which SHOULD bring about widespread above-average rainfall in this period. Its the first time for over a decade that both these ocean conditions could eventuate at the same time. (its been frustrating – when we’ve had a -ve IOD, its been El Nino, and when its been La Nina, we’ve had a +ve IOD). Finally, we might just get both!!
After a decade of below average rains, Im looking forward to it!!
The Southern Oscillation Index which was in positive La Nina territory in 2007/08 and 2008/09 dropped into negative El Nino territory reaching an incredible 8 STS in early 2010.
The Australian Bureau of Meteorology (BOM), in March this year, attributed that SOI dip to
“……………. a sharp decline in
mean sea level pressure over Tahiti; in part due to several tropical depressions and Severe Tropical Cyclone Oli passing over the
region. ”
So this may have been an anomaly due to the Cyclone and not part of a usual SOI dip pattern.
I remember reading this in the March 3 Report. http://www.bom.gov.au/climate/enso/archive/ensowrap_20100303.pdf
Ulric Lyons says: April 27, 2010 at 5:53 pm
“SAMA is fragmented and spread across the entire South Atlantic;
http://denali.gsfc.nasa.gov/research/crustal_mag/prep/pmc.JPG “
Crustal Anomaly (imbedded static crust field, localised magnetization of the Earth’s crust) is a different feature to the Geomagnetic field strength. For the SAA see NASA’s International Geomagnetic Reference Field Model −− Epoch 2005, Main Field Total Intensity:
http://www.ngdc.noaa.gov/geomag/data/mag_maps/pdf/F_map_mf_2005.pdf
“vukcevic says:
April 28, 2010 at 12:06 am”
Recent SAMA maps;
http://heasarc.gsfc.nasa.gov/docs/rosat/gallery/misc_saad.html
http://earthobservatory.nasa.gov/IOTD/view.php?id=617
It corresponds fairly well to the crustal features, and the gravitational anomaly.
This may interest you;
http://www.neuralnetwriter.cylo42.com/node/2508
Global mag. anomaly map
http://ccgm.free.fr/WDMAM_b_gb.html
Ulric Lyons says: April 28, 2010 at 3:36 am
……..
Thanks for the links. The crustal field is a (geological) record (frozen in the rocks) record of fluctuations during many millions of years. It is much localised, and due to the polarity reversals, the overall effect over larger area is usually neutralised.
Geomagnetic Field on the global scale is continuously changing and evolving as you can see here:
http://www.vukcevic.talktalk.net/LFC1.htm
for the period 1600-2000.
vukcevic says:
April 28, 2010 at 5:02 am
Safe; http://www.appinsys.com/GlobalWarming/EarthMagneticField.htm
Fig 7 looks like the Siberian temperature record!:
http://www.geomag.bgs.ac.uk/earthmag.html
U.
Some time ago I have compared two North hemisphere Geomagnetic highs with temp records and found decent correlation.
http://www.vukcevic.talktalk.net/LFC18.htm
vukcevic says:
April 28, 2010 at 8:38 am
Interesting work; http://www.vukcevic.talktalk.net/GandF.htm
Got any predictive power of temperature change at {1} a weekly/monthly level,
{2} El Nino forecast (eg. did you predict the current one), and {3} season by
season climatic forecasts for the next 30 years?
Have you done individual monthly trends on CET, and seen the stronger warming
signal at the Equinoxes (stronger than Dec/Jan warming)?
The answer has to be NO to all. As far as CET is concerned there is this:
http://www.vukcevic.talktalk.net/CETt.htm
But this is more based on solar cycle anomalies (shown in green),
which again appear to have some correlation to the Geomagnetic field.
http://www.vukcevic.talktalk.net/LFC9.htm
http://www.vukcevic.talktalk.net/LFC8.htm
Only predictions I made are related to the solar cycles, based on a formula. There is selection of graphs here: http://www.vukcevic.talktalk.net/GandF.htm
” vukcevic says:
April 28, 2010 at 12:24 pm”
Nice, http://www.vukcevic.talktalk.net/CETt.htm can you see the 179yr pattern?
” rbateman says:
April 26, 2010 at 10:09 pm
What the heck is that persistent hot spot off South America (Uruguay/Paraguay) ?”
I am beginning to wonder whether it is to do with 10,000 tons per second of water up to 24 degree C coming out of the River Uruguay, fed by numerous hot springs up river. http://www.idrc.ca/en/ev-58878-201-1-DO_TOPIC.html
===========================================================
Back to El Nino, 200 hPa Zonal wind and 30/50 hPa Zonal (QBO) wind have a way to go before they start to turn +ve. This does not look good for a La Nina or a busy Atlantic tropical storm season. http://www.cpc.ncep.noaa.gov/products/CDB/Tropics/figt3.gif
Ulric Lyons says:
April 28, 2010 at 2:56 pm
Up to 30deg. Centigrade actually;
http://earthobservatory.nasa.gov/IOTD/view.php?id=42270
My opinion: Winter red will be affected in the western part of the US, so will trend down in yield, slightly up in price. Yields will be average in the plains, where the majority is grown anyway. Spring wheat will be down due to late start, frost and snow, short season. Winter red is the preferred bread wheat so it is possible that prices for high end flour and cake flour will rise somewhat.
Grape harvest will be down but the grape quality may be very good. Wine made from red grapes will continue to hold up and may rise in price. Buy previous good years now, since poor current yields will increase the price of previous year wine still in the barrels/bottles at the wineries.
This will be another bad year for corn, oranges, toms, melons, and gourds (IE pumpkins). Peas and other cool season crops should do very well.
“Pamela Gray says:
April 28, 2010 at 5:51 pm
Grape harvest will be down but the grape quality may be very good”
Most European vintage years are about a year or two before solar max.
Erl Happ would agree with that.